Giving More Weight to Health: Assessing Fiscal Space for Health in Indonesia 46847 Public Disclosure Authorized Public Disclosure Authorized Public Disclosure Authorized ublic Disclosure Authorized Public Disclosure Authorized Public Disclosure Authorized Public Disclosure Authorized ublic Disclosure Authorized
Transcript
Giving More Weight to Health:Assessing Fiscal Space for Health in
Indonesia
46847
Pub
lic D
iscl
osur
e A
utho
rized
Pub
lic D
iscl
osur
e A
utho
rized
Pub
lic D
iscl
osur
e A
utho
rized
Pub
lic D
iscl
osur
e A
utho
rized
Pub
lic D
iscl
osur
e A
utho
rized
Pub
lic D
iscl
osur
e A
utho
rized
Pub
lic D
iscl
osur
e A
utho
rized
Pub
lic D
iscl
osur
e A
utho
rized
iiiGiving More Weight to Health: Assessing Fiscal Space for Health in Indonesia
Table of Contents
List of Abbreviati ons and Acronyms v
List of Figures vi
List of Tables vii
List of Boxes viii
Executi ve Summary ix
Secti on One: Introducti on 1
Secti on Two: Defi ning Fiscal Space for Health 3
Secti on Three: Health System Outcomes, Inputs and Outputs 5
Secti on Four: Health Financing Overview 9
Secti on Five: Fiscal Space and the Macroeconomics of Government
Health Spending 13
5.1 Economic Growth and Government Health Spending 13
5.2 Government Expenditures and Revenue Generati on 20
Secti on Six: Fiscal Space from a Health-Sector Specifi c Perspecti ve 23
6.1 Fiscal Space from Earmarked Taxati on and
Health-Specifi c Borrowing/Grants 23
6.2 Fiscal Space from Mandatory Health Insurance 27
6.3 Fiscal Space from Increasing Health’s Share of the
Government Budget 29
6.4 Fiscal Space and Effi ciency of Government Spending on
Health 34
Secti on Seven: Other Issues: Fiscal Space and the Cost of Health Care 41
Secti on Eight: Policy Implicati ons and Discussion 43
References 45
iv Giving More Weight to Health: Assessing Fiscal Space for Health in Indonesia
Acknowledgments
This paper is one input into the ongoing Government of Indonesia-led Comprehensive Health Sector Review which will inform the GoI’s next fi ve-year Nati onal Development Strategic Plan 2010-2014. It is part of a broader Health Financing Economic and Sector Study (P107276) conducted by the World Bank in Indonesia and is, in part, fi nanced by funds provided by the HNP Anchor Unit for acti viti es related to the implementati on of the new HNP strategy.
This paper was writt en by Ajay Tandon (Senior Economist, HDNHE) under the guidance of Claudia Rokx (Lead Health Specialist, EASHD), George Schieber (Health Policy Advisor), Pablo Gott ret (Lead Health Economist, HDNHE), and Mukesh Chawla (Sector Manager, HDNHE). Inputs were provided by Pandu Harimurti (Health Specialist, EASHD) and Valerie Moran (Junior Professional Associate, HDNHE). Peer reviewers were Adam Wagstaff (Lead Economist, DECRG), Samuel Lieberman (Health Economist, Consultant EAPHD), and Daniel Dulitzky (Senior Economist, ECSHD). Comments were also provided by Ariel Fiszbein (Chief Economist, HDNVP), Wolfgang Fengler (Senior Economist, EASPR), Puti Marzoeki (Senior Health Specialist, EASHD), Camilo Gomez Osorio (Economist, Consultant EASPR) and Tim Bulman (Economist, Consultant EASPR). General guidance was provided by Joachim von Amsberg (Country Director, EACIF), Emmanuel Jimenez (Sector Director, EASHD) and William Wallace (Lead Economist, EASPR).
For the Government of Indonesia, the paper was reviewed and commented upon by Nina Sardjunani and Arum Atmawikarta (Nati onal Development Agency/Ministry of Planning Bappenas); Parluhutan Hutahean and Askolani (Ministry of Finance); Untung Suseno, Chalik Masulili and Armansyah (Ministry of Health); and Hasbullah Thabrany, Ascobat Gani (University of Indonesia); Laksono Trisnantoro, Sigit Riyarto (Gadja Mada University) and their highly valuable comments were included in the fi nal draft of the paper.
This paper was edited by Chris Stewart. Josh Estey was responsible for all photography used in this report.
Financing for this paper was provided, in part, by the GAVI Alliance Trust Fund and the Dutch Government.
vGiving More Weight to Health: Assessing Fiscal Space for Health in Indonesia
List of Abbreviati ons and Acronyms
AAA Advisory and Analyti cal Acti viti es
ADB Asian Development Bank
ASKES Asuransi KesehatanBappenas Badan Perencanaan Pembangunan Nasional (Nati onal
Development Planning Board)
DEPKES Departemen Kesehatan (Ministry of Health)
DPT3 Diptheria, Pertussis, Tetanus Immunizati on Series
EAP East Asia and the Pacifi c
EC European Community
GDP Gross Domesti c Product
GFATM Global Fund for AIDS, Tuberculosis and Malaria
GoI Government of Indonesia
HDNHE Human Development Network, Health and Educati on
HNP Health, Nutriti on and Populati on
IMF Internati onal Monetary Fund
IMR Infant Mortality RateJamkesmas Jaminan Kesehatan Masyarakat (Community Health
Insurance Scheme)
Jamsostek Jaminan Sosial Tenaga Kerja (Workforce Social Security)
MDG Millennium Development Goals
MMR Maternal Mortality Rati o
MoH Ministry of Health
NHA Nati onal Health Accounts
OECD Organisati on for Economic Co-operati on and DevelopmentSusenas Survei Sosial Ekonomi Nasional (Nati onal Socioeconomic
Survey)
UNDP United Nati ons Development Programme
UNESCAP United Nati ons Economic and Social Commission for Asia and the Pacifi c
VAT Value-added Tax
WDI World Development Indicators
WHO-SEARO World Health Organizati on-Southeast Asia Regional Offi ce
vi Giving More Weight to Health: Assessing Fiscal Space for Health in Indonesia
List of Figures
Figure 2-1: Visualizing Fiscal Space for Health: Hypotheti cal Scenario for Indonesia 4Figure 3-1: Trends in Key Health Indicators for Indonesia (1960-2006) 5
Figure 3-2: Life Expectancy and Infant Mortality vs Income (2006) 6Figure 3-3: Maternal Mortality and Child Malnutriti on vs Income
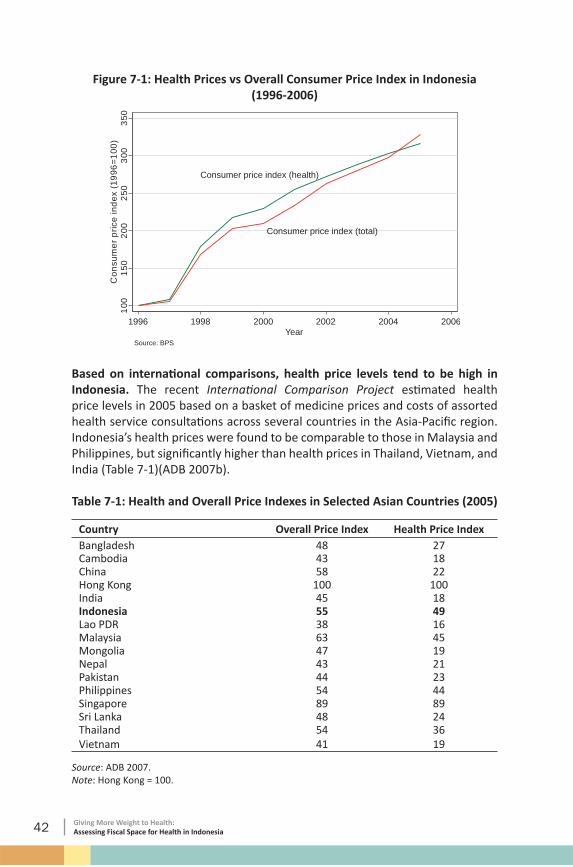
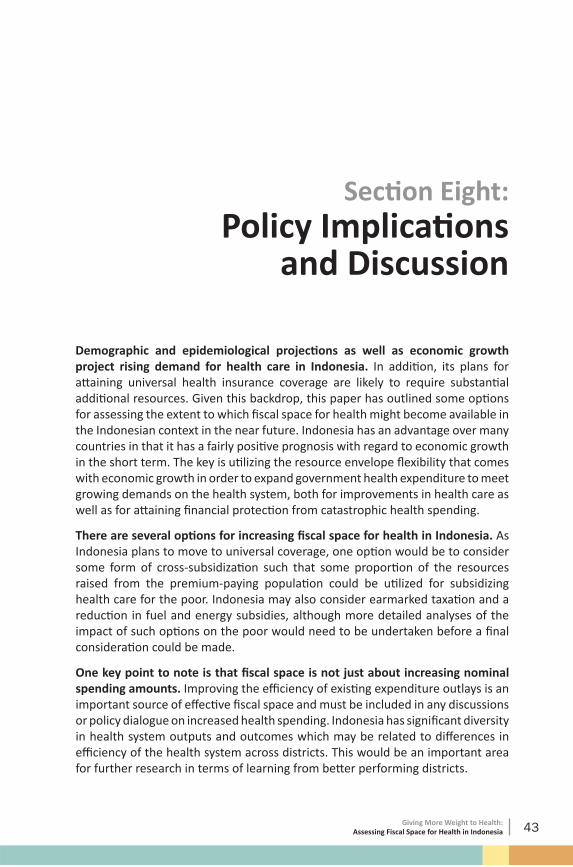
(2000-2006) 6Figure 4-1: Total and Government Health Expenditure Per Capita versus Income (2006) 10Figure 5-1: Total and Government Health Expenditure vs Income (2006) 14Figure 5-2: Health Financing Trends by Income (2005) 14Figure 5-3: Revised Economic Growth Forecast for Indonesia (2008-2013) 17Figure 5-4: Long-term Trends in Government Health Spending in Indonesia (1979-2007) 18Figure 5-5: Health Expenditure vs GDP in Indonesia (1979-2007) 19Figure 5-6: Government Total and Health Expenditure vs Revenues (2004-2006) 21Figure 5-7: Average Revenues as Percentage of GDP (2003-2006) 22Figure 6-1: External Resources as Share of Health Spending in Indonesia (1995-2006) 26Figure 6-2: Formal and Informal Sector Shares of Total Employment in Indonesia (1990-2003) 29Figure 6-3: Global Comparison of Indonesian Districts on DPT3 Immunizati on and Skilled Birth Att endance (2005) 38Figure 7-1: Health Prices vs Overall Consumer Price Index in Indonesia (1996-2006) 42
viiGiving More Weight to Health: Assessing Fiscal Space for Health in Indonesia
List of Tables
Table 3-1: Populati on Health Outcomes in Indonesia and Selected Countries for Comparison (2006) 7Table 3-2: Health System Outputs and Inputs in Indonesia and Selected
Countries for Comparison 8Table 4-1: Health Expenditure Indicators in Indonesia and Selected Countries for Comparison (2006) 9Table 5-1: Selected Macroeconomic Indicators for Indonesia: Actual (2004- 2007) and Projected (2008-2013)(%) 18Table 5-2: Government Health Expenditure: Actual (2004-2007) and Projected (2008-2013) 20Table 6-1: ODA for Health in Indonesia (Disbursements)(2006) 26Table 6-2: Government Budgetary Allocati ons in Indonesia and Selected Countries for Comparison (2000-2006) 30Table 6-3: Corrupti on Percepti on Index (2005) 31Table 6-4: Selected Countries Spending Greater than 15% of Budget on Health (2005) 32Table 6-5: Selected Countries with Health Spending Less than Indonesia and Having Higher DPT3 Coverage Rates (2005) 37Table 6-6: Public Health Expenditures by Level of Government (2002-2008) 37Table 7-1: Health and Overall Price Indexes in Selected Asian Countries (2005) 42
viii Giving More Weight to Health: Assessing Fiscal Space for Health in Indonesia
List of Boxes
Box 5-1 Fiscal Space from Economic Growth in India 16Box 6-1 Financing the Nati onal Health Insurance Scheme in Ghana with a 2.5% VAT Levy 25Box 6-2: Fiscal Space from Introducing Mandatory Health Insurance in
Colombia 28Box 6-3: Mexico’s Health Reform 33Box 6-4: Health System Effi ciency in Sri Lanka 35Box 6-5: Designing Interfi scal Transfers to Att ain Health Results in Argenti na 39
ixGiving More Weight to Health: Assessing Fiscal Space for Health in Indonesia
Executi ve Summary
This report analyzes fi scal space issues related to government health spending in Indonesia. Fiscal space refers to the ability of a government to increase expenditures for a desired purpose. In all likelihood, and for a variety of reasons, Indonesia will need to boost health spending in the near future as it expands access to care through the expansion of Jamkesmas, the health insurance scheme for the poor and near poor. In additi on, projecti ons based on demographic and epidemiological changes in the country indicate there is likely to be a signifi cant increase in the demand and need for health services and more sophisti cated care. Despite a tripling of the public budget for health over the past fi ve years, this increased need, combined with the fact that Indonesia remains a comparati vely low spender on health, indicates that there will conti nue to be upward pressure on resources for the health sector in the near future.
Indonesia has posted mixed results in key populati on health indicators in recent decades. There have been impressive gains in terms of increasing life expectancy (from 41 years in the 1960s to 68 years in 2006) and in reducing child mortality. Indonesia is also on track to achieve the MDG for child health. However, Indonesia’s performance on other health indicators is lagging: for instance, it does not do well on maternal mortality and the incidence of malnutriti on among young children remains high. From a regional perspecti ve, Indonesia lags behind its peers in most of its health indicators. In additi on, nati onal averages mask large inequiti es and distributi on problems remain signifi cant. All health indicators are worse in the poorer, eastern provinces of Indonesia. Similarly, in terms of health outputs and health system performance indicators, Indonesia is not a high performer. Immunizati on rates are low for a low middle-income country and skilled birth att endance is far lower than the East Asian average. In the area of fi nancial protecti on, Indonesia is starti ng to make progress. Health insurance coverage has increased with the introducti on of Jamkesmas, catastrophic spending on health problems has decreased, but overall health insurance coverage is sti ll below 40 percent of the total populati on.
Total health expenditure per capita for Indonesia in 2006 was about US$34, or approximately 2.2 percent of GDP. Health care provision is dominated by the public sector with about 65 percent of all uti lizati on (both inpati ent and outpati ent) occurring at public faciliti es and about 30 percent at private faciliti es. In the same year, 50.4 percent of total health spending in Indonesia was government and 49.6 percent was private spending. The Indonesian government spent about 5.3 percent of its budget on health in 2006 but total and government health expenditures per capita are low compared to regional neighbors as well as relati ve to its income level.
x Giving More Weight to Health: Assessing Fiscal Space for Health in Indonesia
Indonesia’s economic growth has been strong over the past year. Economic growth tends to be one of the most important determinants of fi scal space. However, at the ti me of writi ng this paper, the ongoing global fi nancial crisis makes any predicti on about the future course of events diffi cult. Nevertheless, this paper focuses more on analyzing diff erent mechanisms by which additi onal fi scal space for health could be realized in the near future in order to respond to increasing demands. The primary purpose of the paper is to gain an understanding of these diff erent mechanisms in order to inform policy dialogues related to this issue, rather than to defi ne with precision the sources and extent of additi onal funding for health.
A number of diff erent drivers of fi scal space for health in Indonesia are discussed in this paper. These include: (i) conducive macroeconomic conditi ons; (ii) reprioriti zati on of health within the overall government budget; (iii) increasing health-specifi c foreign aid and grants; (iv) an increase in other health-specifi c resources; for example, through earmarked taxati on or the introducti on of premiums for mandatory health insurance; and (v) an increase in the effi ciency of government health outlays. In additi on to laying out the possibiliti es for Indonesia with regard to each of these opti ons, relevant internati onal experiences are also highlighted.
The paper concludes that there are a number of policy opti ons for Indonesia to consider in order to raise resources for health. Health is accorded a relati vely low priority in the budget and one opti on would be to reduce fuel and other subsidies in favor of targeted increases in health spending. Other opti ons include cross-subsidizati on within a universal health insurance system, earmarking taxes (for example taxes on alcohol and cigarett es, by specifi c levies on income, or a VAT top-up), health-specifi c borrowing and grants from internati onal organizati ons, and improved effi ciency in the use of existi ng resources (for example by designing interfi scal transfers that are geared towards att ainment of health outputs and/or outcomes). It is also important to recognize that increasing resources is only one part of the overall picture. Higher resources will not solve Indonesia’s health system problems if the additi onal expenditures do not translate to improvements in health outputs and outcomes.
1Giving More Weight to Health: Assessing Fiscal Space for Health in Indonesia
Secti on One:
Introducti on
This paper discusses the issue of fi scal space for health in Indonesia. More specifi cally, the objecti ves of the paper are to defi ne fi scal space for health, elaborate an analyti cal framework for assessing fi scal space for health, and discuss some implicati ons in the Indonesian context.1 The paper also highlights several country case examples on the use of diff erent policy opti ons for increasing fi scal space for health.
A discussion of fi scal space specifi cally for health is important given the likely need for Indonesia to increase resources devoted to the health sector in the near future. Given its current health situati on and future demographic and epidemiological projecti ons, Indonesia will, in all likelihood, need to expand health spending–or increase the eff ecti veness of existi ng spending–in order to att ain further improvements in health outputs and outcomes, reduce health inequaliti es, as well as increase health insurance coverage. The latt er, in parti cular, is likely to require signifi cant increases in government health spending given Indonesia’s ongoing implementati on of the Jamkesmas program which entails provision of free health care for 76.4 million poor and near-poor individuals as well as the government’s plans for eventually att aining universal coverage, either via the expansion of the Jamkesmas program to the enti re populati on or via other health fi nancing opti ons.
The remainder of the paper is organized as follows. Secti on Two provides a brief defi niti on of fi scal space and outlines a basic analyti cal framework for applicati on 1 The analyti cal framework in this note closely follows that in Lane (2007).
2 Giving More Weight to Health: Assessing Fiscal Space for Health in Indonesia
of fi scal space to the health sector in any country. Secti on Three provides a brief overview of health system outcomes in Indonesia while Secti on Four briefl y discusses the health fi nancing situati on in the country. A discussion of the macroeconomic context underlying government expenditures more generally and government expenditures for health more specifi cally follows in Secti on Five. Secti on Six elaborates on some specifi c health sector issues when it comes to fi scal space. Secti on Seven discusses other issues such as the role of health price infl ati on and its impact in terms of potenti ally eroding fi scal space for health. Where possible, the note focuses on projecti ons to the years 2012-2015, with an important cauti onary caveat that the informati on content of the esti mates presented herein diminishes signifi cantly the further we look into the future. Secti on Eight concludes with a brief discussion of the policy implicati ons.
3Giving More Weight to Health: Assessing Fiscal Space for Health in Indonesia
Secti on Two:
Defi ning Fiscal Spacefor Health
Fiscal space refers to the ability of a government to increase expenditures for a desired purpose. More specifi cally, in this paper we use Heller’s (2006) defi niti on of overall fi scal space as the extent to which a government can raise spending in a fi nancially sustainable manner, namely in ways that do not jeopardize a government’s current or future fi scal solvency. In general, fi scal space may be defi ned with respect to the availability of additi onal resources for increasing government spending more generally or for a specifi c sector, with the latt er someti mes being a functi on of the former.2 For the purposes of this paper, we focus att enti on on fi scal space specifi cally in the context of health for Indonesia, keeping in mind that−at least for the near future−fi scal space for health may be constrained as a fi xed proporti on of overall fi scal space for Indonesia.
One way of assessing fi scal space for health is to examine the diff erent opti ons by which the sources of government fi nancing for health could be increased. These include:
conducive macroeconomic conditi ons such as economic growth and increases in overall government revenue that, in turn, lead to increases in government spending for health;
a reprioriti zati on of health within the government budget;
2 It is important to note that this need not always be the case. For health, for instance, there has been a rapid increase in recent years in development assistance that is earmarked for the sector, in which case fi scal space for health could increase without an increase in overall fi scal space. This disti ncti on is more relevant for countries that are highly dependent on foreign assistance, for example those in Sub-Saharan Africa, and less so for a country such as Indonesia.
4 Giving More Weight to Health: Assessing Fiscal Space for Health in Indonesia
an increase in health-specifi c foreign aid and grants; an increase in other health-specifi c resources, for example through
earmarked taxati on or the introducti on of premiums for mandatory health insurance; and
an increase in the effi ciency of government health outlays.
Of the abovementi oned opti ons, the fi rst two are largely outside the domain of the health sector per se as they involve general macroeconomic policies and conditi ons as well as cross-sectoral politi cal economy trade-off s. Nevertheless, despite the fact that these areas are largely exogenous to the health sector, it remains important to analyze the implicati ons for government health spending of changes in the generalized macroeconomic and politi cal environment within which the health sector operates. The remaining three opti ons are more in the domain of the health sector and merit parti cular att enti on given that they provide the potenti al for resources that are sector specifi c.
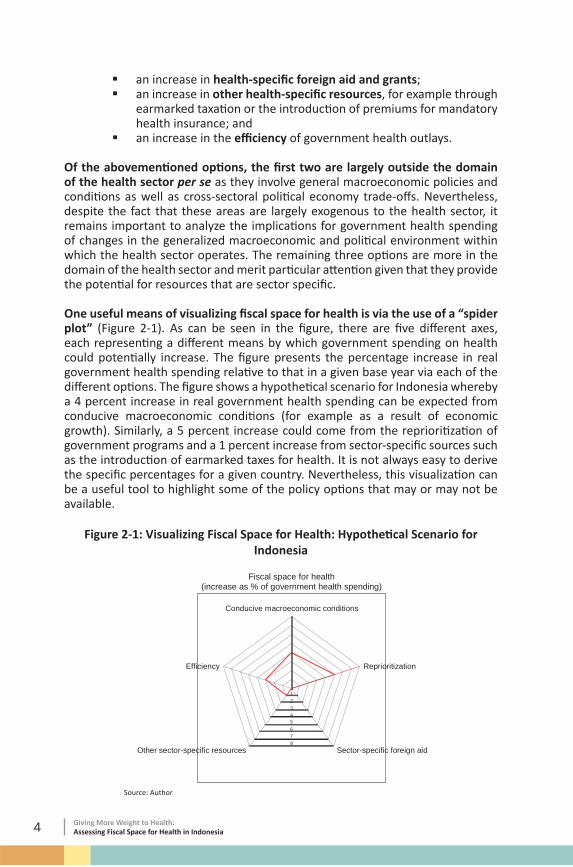
One useful means of visualizing fi scal space for health is via the use of a “spider plot” (Figure 2-1). As can be seen in the fi gure, there are fi ve diff erent axes, each representi ng a diff erent means by which government spending on health could potenti ally increase. The fi gure presents the percentage increase in real government health spending relati ve to that in a given base year via each of the diff erent opti ons. The fi gure shows a hypotheti cal scenario for Indonesia whereby a 4 percent increase in real government health spending can be expected from conducive macroeconomic conditi ons (for example as a result of economic growth). Similarly, a 5 percent increase could come from the reprioriti zati on of government programs and a 1 percent increase from sector-specifi c sources such as the introducti on of earmarked taxes for health. It is not always easy to derive the specifi c percentages for a given country. Nevertheless, this visualizati on can be a useful tool to highlight some of the policy opti ons that may or may not be available.
Figure 2-1: Visualizing Fiscal Space for Health: Hypotheti cal Scenario for Indonesia
Fiscal space for health(increase as % of government health spending)
Source: Author
5Giving More Weight to Health: Assessing Fiscal Space for Health in Indonesia
Secti on Three:
Health System Outcomes, Inputs and Outputs
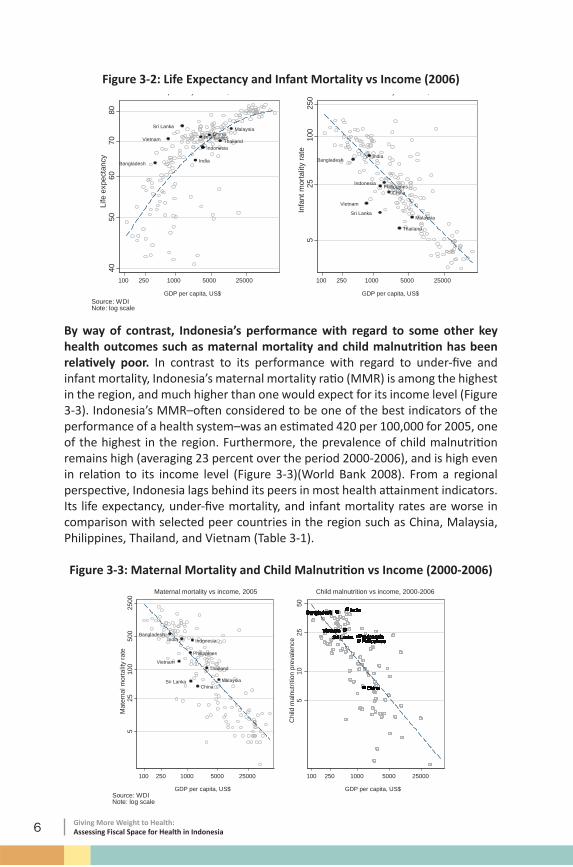
Indonesia has made impressive health gains over the past few decades. Life expectancy at birth has increased from just over 41 years in 1960 to more than 68 years in 2006. The infant mortality rate (IMR) dropped from 128 to 26 per 1,000 live births and the under-fi ve mortality rate has dropped from 216 to 34 per 1,000 live births over the same ti me period (Figure 3-1). The 1997 economic crisis and the decentralizati on of government administrati on in 2001 do not appear to have had a discernible impact on trends in average life expectancy, infant mortality, and under-fi ve mortality in Indonesia. The country is on track to att ain the Millennium Development Goal (MDG) for child mortality (UNESCAP et al 2007). Based on global comparisons, Indonesia’s IMR in 2006 was lower than the average for its income level and its life expectancy was about average for its income (Figure 3-2).
Figure 3-1: Trends in Key Health Indicators for Indonesia (1960-2006)
Decentralization
050
100
150
200
Infa
nt/U
nder
-five
mor
talit
y ra
te
4050
6070
Life
exp
ecta
ncy
1960 1970 1980 1990 2000 2006
YearSource: WDI
Economic crisis
Under-five mortality
Infant mortality
Life expectancy
6 Giving More Weight to Health: Assessing Fiscal Space for Health in Indonesia
Figure 3-2: Life Expectancy and Infant Mortality vs Income (2006)
China
Indonesia
India
Malaysia
PhilippinesThailand
Bangladesh
Sri Lanka
Vietnam
4050
6070
80Li
fe e
xpec
tanc
y
100 250 1000 5000 25000
GDP per capita, US$
Life expectancy vs income, 2006
China
India
Malaysia
Philippines
Thailand
Bangladesh
Indonesia
Sri Lanka
Vietnam
525
100
250
Infa
nt m
orta
lity
rate
100 250 1000 5000 25000
GDP per capita, US$
Infant mortality vs income, 2006
Source: WDINote: log scale
By way of contrast, Indonesia’s performance with regard to some other key health outcomes such as maternal mortality and child malnutriti on has been relati vely poor. In contrast to its performance with regard to under-fi ve and infant mortality, Indonesia’s maternal mortality rati o (MMR) is among the highest in the region, and much higher than one would expect for its income level (Figure 3-3). Indonesia’s MMR–oft en considered to be one of the best indicators of the performance of a health system–was an esti mated 420 per 100,000 for 2005, one of the highest in the region. Furthermore, the prevalence of child malnutriti on remains high (averaging 23 percent over the period 2000-2006), and is high even in relati on to its income level (Figure 3-3)(World Bank 2008). From a regional perspecti ve, Indonesia lags behind its peers in most health att ainment indicators. Its life expectancy, under-fi ve mortality, and infant mortality rates are worse in comparison with selected peer countries in the region such as China, Malaysia, Philippines, Thailand, and Vietnam (Table 3-1).
Figure 3-3: Maternal Mortality and Child Malnutriti on vs Income (2000-2006)
7Giving More Weight to Health: Assessing Fiscal Space for Health in Indonesia
Nati onal averages for health indicators mask signifi cant geographic and income-related inequaliti es within the country. Indonesia is a large, diverse, and geographically-dispersed country. In poorer provinces such as Gorontalo and West Nusa Tenggara, the infant and child mortality rates are four to fi ve ti mes higher than those in richer provinces such as Bali and Yogyakarta (World Bank 2007a). In additi on, health indicators for the poor are far worse than those for the rich: child mortality rates among the poorest quinti le in 2003 were 3.5 ti mes the rate among the richest quinti les (ADB 2006).
Table 3-1: Populati on Health Outcomes in Indonesia and Selected Countries for Comparison (2006)
Source: WDI.Note: EAP and LMC numbers are unweighted country averages.
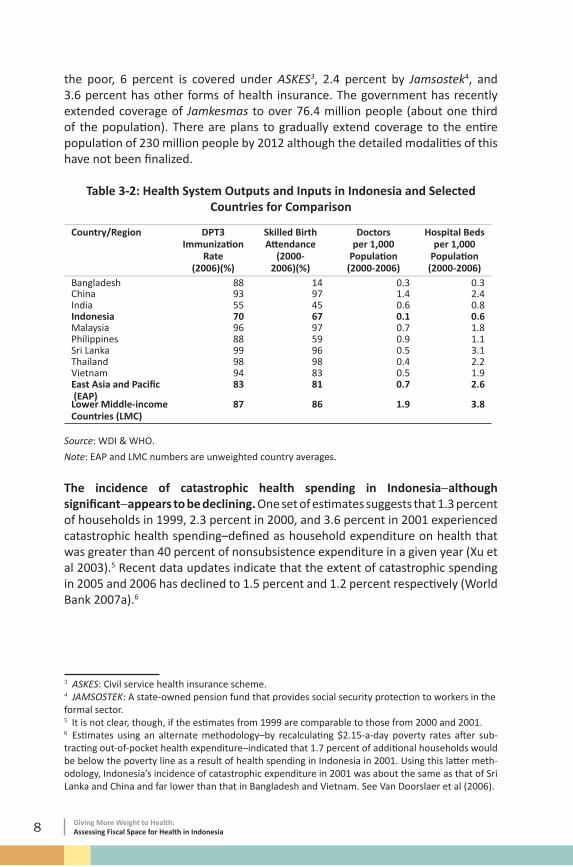
Indonesia’s health system outputs and inputs are relati vely low. The DPT3 immunizati on rate in Indonesia in 2006 was only 70 percent. By way of contrast, the EAP average was 83 percent and the average for lower middle-income countries was 87 percent. A similar patt ern is observed in skilled birth att endance rates: at 67 percent, this is far lower than the average for the region (81 percent) and for lower middle-income countries (86 percent). In terms of physical health system inputs, Indonesia has a low rati o of doctors and hospital beds per 1,000 populati on compared with its regional peers (Table 3-2).
Health insurance coverage rates remain fairly low in Indonesia. About 26 percent of the populati on has some form of health insurance coverage based on esti mates derived from Susenas 2007 household data. About 14 percent of the populati on is covered by the government-funded Jamkesmas program for
8 Giving More Weight to Health: Assessing Fiscal Space for Health in Indonesia
the poor, 6 percent is covered under ASKES3, 2.4 percent by Jamsostek4, and 3.6 percent has other forms of health insurance. The government has recently extended coverage of Jamkesmas to over 76.4 million people (about one third of the populati on). There are plans to gradually extend coverage to the enti re populati on of 230 million people by 2012 although the detailed modaliti es of this have not been fi nalized.
Table 3-2: Health System Outputs and Inputs in Indonesia and Selected Countries for Comparison
Note: EAP and LMC numbers are unweighted country averages.
The incidence of catastrophic health spending in Indonesia−although signifi cant−appears to be declining. One set of esti mates suggests that 1.3 percent of households in 1999, 2.3 percent in 2000, and 3.6 percent in 2001 experienced catastrophic health spending–defi ned as household expenditure on health that was greater than 40 percent of nonsubsistence expenditure in a given year (Xu et al 2003).5 Recent data updates indicate that the extent of catastrophic spending in 2005 and 2006 has declined to 1.5 percent and 1.2 percent respecti vely (World Bank 2007a).6
3 ASKES: Civil service health insurance scheme.4 JAMSOSTEK: A state-owned pension fund that provides social security protecti on to workers in the formal sector.5 It is not clear, though, if the esti mates from 1999 are comparable to those from 2000 and 2001.6 Esti mates using an alternate methodology–by recalculati ng $2.15-a-day poverty rates aft er sub-tracti ng out-of-pocket health expenditure–indicated that 1.7 percent of additi onal households would be below the poverty line as a result of health spending in Indonesia in 2001. Using this latt er meth-odology, Indonesia’s incidence of catastrophic expenditure in 2001 was about the same as that of Sri Lanka and China and far lower than that in Bangladesh and Vietnam. See Van Doorslaer et al (2006).
9Giving More Weight to Health: Assessing Fiscal Space for Health in Indonesia
Secti on Four: Health Financing
Overview
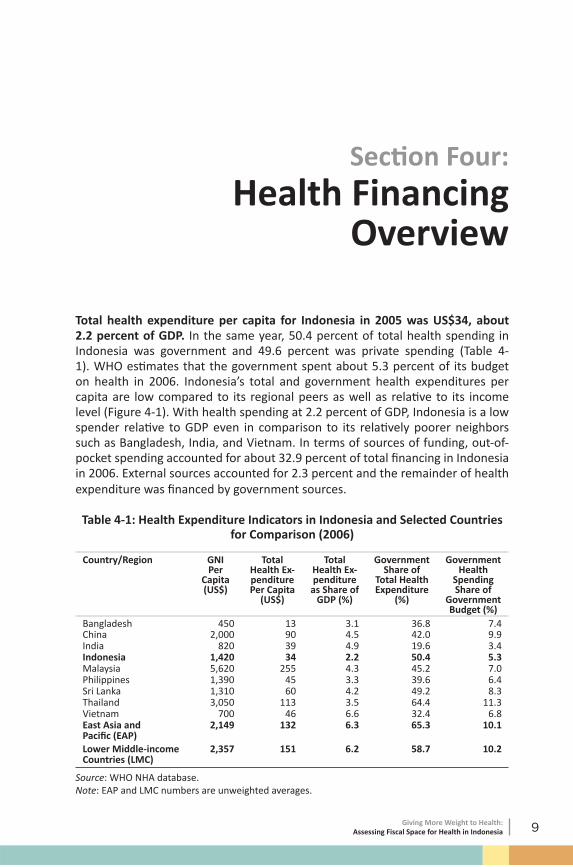
Total health expenditure per capita for Indonesia in 2005 was US$34, about 2.2 percent of GDP. In the same year, 50.4 percent of total health spending in Indonesia was government and 49.6 percent was private spending (Table 4-1). WHO esti mates that the government spent about 5.3 percent of its budget on health in 2006. Indonesia’s total and government health expenditures per capita are low compared to its regional peers as well as relati ve to its income level (Figure 4-1). With health spending at 2.2 percent of GDP, Indonesia is a low spender relati ve to GDP even in comparison to its relati vely poorer neighbors such as Bangladesh, India, and Vietnam. In terms of sources of funding, out-of-pocket spending accounted for about 32.9 percent of total fi nancing in Indonesia in 2006. External sources accounted for 2.3 percent and the remainder of health expenditure was fi nanced by government sources.
Table 4-1: Health Expenditure Indicators in Indonesia and Selected Countries for Comparison (2006)
Source: WHO NHA database. Note: EAP and LMC numbers are unweighted averages.
10 Giving More Weight to Health: Assessing Fiscal Space for Health in Indonesia
Health care provision is dominated by the public sector in Indonesia. In 2006, about 65 percent of all uti lizati on (both inpati ent and outpati ent) was at public faciliti es while about 30 percent was at private faciliti es and the remainder was accounted for by traditi onal healers and other categories (World Bank 2008a). Uti lizati on of public outpati ent faciliti es by the poor has increased over the past couple of years (to 60 percent), most likely as a result of the Jamkesmas program. The poor are also more reliant on public faciliti es for inpati ent care compared to the rich.7
Figure 4-1: Total and Government Health Expenditure Per Capita vs Income (2006)
China
IndonesiaIndia
Malaysia
Philippines
Thailand
Bangladesh
Sri LankaVietnam
525
500
2500
Tota
l hea
lth e
xpen
ditu
re p
er c
apita
, US$
100 250 1000 5000 25000
GDP per capita, US$
Total
China
Indonesia
India
MalaysiaThailand
Bangladesh
Sri LankaPhilippinesVietnam
525
500
2500
Gov
ernm
ent h
ealth
exp
endi
ture
per
cap
ita, U
S$
100 250 1000 5000 25000
GDP per capita, US$
Government
Source: WDINote: log scale
Health expenditure vs income, 2006
Given its current health situati on and future demographic and epidemiological projecti ons, it is likely that Indonesia will need to expand health spending–or increase the eff ecti veness of existi ng spending–in order to att ain further improvements in health outputs and outcomes, reduce health inequaliti es, as well as increase health insurance coverage. Extending health insurance coverage, in parti cular, is likely to require signifi cant increases in government health spending given Indonesia’s ongoing implementati on of the Jamkesmas program. Esti mates indicate that, in 2006, spending on this program amounted to Rp2.9 trillion, or 22 percent of central government health spending (World Bank 2008a). In additi on, this amount does not take into account the supply-side subsidizati on of health care through the payment of health worker salaries and infrastructure on the part of the government. Indonesia’s plans for eventually reaching universal insurance coverage are likely to require even more resources: preliminary analyses suggest that this initi ati ve alone would require additi onal resources equivalent to 1.6 percent of GDP by 2015 and 2.7 percent of GDP by 2020.8 7 See World Bank 2008a for more details on uti lizati on patt erns.8 See ADB 2007a. These numbers are based on an analysis done by the Asian Development Bank (ADB) that projects the cost of reaching universal health insurance coverage in Indonesia.
11Giving More Weight to Health: Assessing Fiscal Space for Health in Indonesia
Given the need for additi onal resources, the next two secti ons outline some of the key drivers and opti ons for fi scal space for health in Indonesia. Secti on Five begins with a discussion of some of the macroeconomic determinants of fi scal space and the implicati ons for the health sector in Indonesia. Secti on Six outlines some sector-specifi c opti ons and country examples for identi fying fi scal space from within the health sector.
12 Giving More Weight to Health: Assessing Fiscal Space for Health in Indonesia
13Giving More Weight to Health: Assessing Fiscal Space for Health in Indonesia
Secti on Five: Fiscal Space and
the Macroeconomics of Government Health Spending
5.1 Economic Growth and Government Health Spending
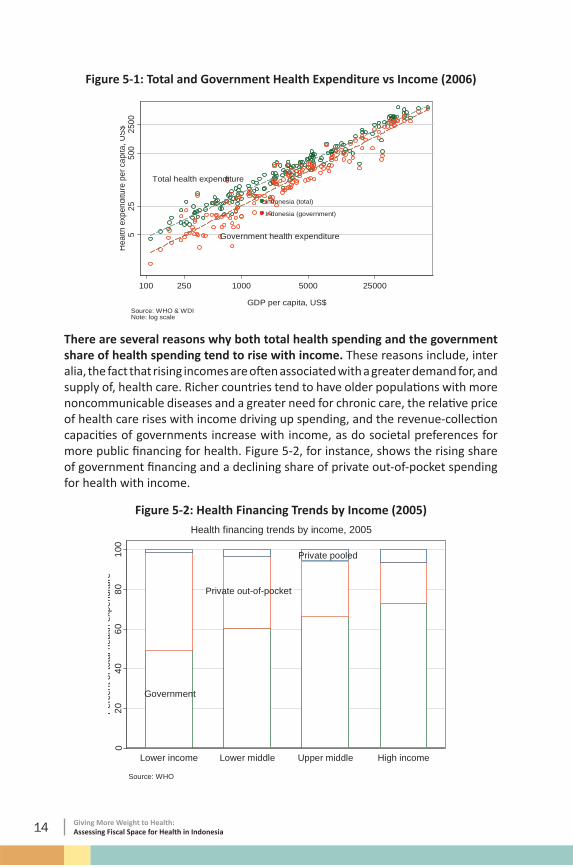
One of the most important determinants of fi scal space for health is economic growth. For all countries, in general, total health expenditure–and the government’s share of total health expenditure–tends to rise with income. This can be seen from the cross-country data in Figure 5-1 from which the elasti city of both total and government health spending to income can be derived. The elasti city of total health spending is about 1.1 (implying that a 1 percent rise in income raises total health spending by 1.1 percent) while the elasti city of government spending is higher at about 1.2 (implying that a 1 percent rise in income on average leads to a 1.2 percent rise in government health spending)
14 Giving More Weight to Health: Assessing Fiscal Space for Health in Indonesia
Figure 5-1: Total and Government Health Expenditure vs Income (2006)
Indonesia (total)
Indonesia (government)
Government health expenditure
Total health expenditure
525
500
2500
Hea
lth e
xpen
ditu
re p
er c
apita
, US$
100 250 1000 5000 25000
GDP per capita, US$Source: WHO & WDINote: log scale
There are several reasons why both total health spending and the government share of health spending tend to rise with income. These reasons include, inter alia, the fact that rising incomes are oft en associated with a greater demand for, and supply of, health care. Richer countries tend to have older populati ons with more noncommunicable diseases and a greater need for chronic care, the relati ve price of health care rises with income driving up spending, and the revenue-collecti on capaciti es of governments increase with income, as do societal preferences for more public fi nancing for health. Figure 5-2, for instance, shows the rising share of government fi nancing and a declining share of private out-of-pocket spending for health with income.
Figure 5-2: Health Financing Trends by Income (2005)
Government
Private out-of-pocket
Private pooled
020
4060
8010
0P
erce
nt o
f tot
al h
ealth
exp
endi
ture
Lower income Lower middle Upper middle High income
Source: WHO
Health financing trends by income, 2005
15Giving More Weight to Health: Assessing Fiscal Space for Health in Indonesia
There are many examples of countries where economic growth has resulted in improved fi scal space for health. India is a recent example of a country that is planning to signifi cantly boost government health spending, this being facilitated at least in part by its extremely robust economic growth rates over the past few decades (see Box 5-1).
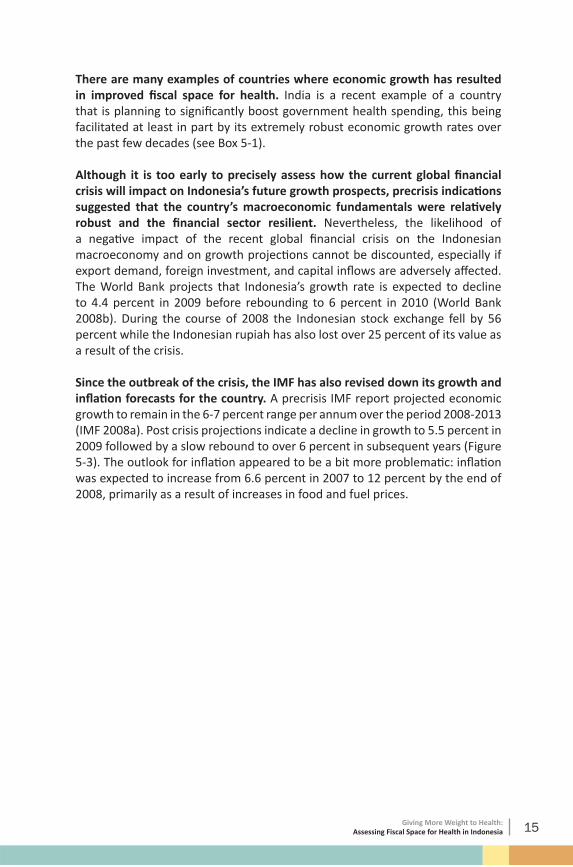
Although it is too early to precisely assess how the current global fi nancial crisis will impact on Indonesia’s future growth prospects, precrisis indicati ons suggested that the country’s macroeconomic fundamentals were relati vely robust and the fi nancial sector resilient. Nevertheless, the likelihood of a negati ve impact of the recent global fi nancial crisis on the Indonesian macroeconomy and on growth projecti ons cannot be discounted, especially if export demand, foreign investment, and capital infl ows are adversely aff ected. The World Bank projects that Indonesia’s growth rate is expected to decline to 4.4 percent in 2009 before rebounding to 6 percent in 2010 (World Bank 2008b). During the course of 2008 the Indonesian stock exchange fell by 56 percent while the Indonesian rupiah has also lost over 25 percent of its value as a result of the crisis.
Since the outbreak of the crisis, the IMF has also revised down its growth and infl ati on forecasts for the country. A precrisis IMF report projected economic growth to remain in the 6-7 percent range per annum over the period 2008-2013 (IMF 2008a). Post crisis projecti ons indicate a decline in growth to 5.5 percent in 2009 followed by a slow rebound to over 6 percent in subsequent years (Figure 5-3). The outlook for infl ati on appeared to be a bit more problemati c: infl ati on was expected to increase from 6.6 percent in 2007 to 12 percent by the end of 2008, primarily as a result of increases in food and fuel prices.
16 Giving More Weight to Health: Assessing Fiscal Space for Health in Indonesia
Box 5-1: Fiscal Space from Economic Growth in India
India has ambiti ous plans to increase its government health spending from less than 1 percent of GDP to 2-3 percent of GDP during its eleventh Five-Year Plan (2007-2012). Most of the additi onal funding for health is expected to be channeled through the Nati onal Rural Health Mission (NRHM) which was initi ated in 2005 for the enti re country, with a parti cular focus on 18 poorly-performing states. There is preliminary evidence that total government health expenditure in India over the period 2004/05 to 2006/07 has already risen in real and nominal terms: from 0.97 percent of GDP to 1.05 percent of GDP.
India’s plans for increasing government spending on health are occurring at a ti me when the country’s performance on economic growth has been very impressive. India’s GDP has grown on average by 6 percent over the past 25 years, with growth being in excess of 8 percent per year over the past 5 years or so. The country’s tax and other revenues, aft er a period of decline as a share of GDP in the 1990s, have been growing steadily post-2000 and are projected to conti nue to grow in the short to medium term (see fi gure). The government’s expenditure levels have also kept pace with the rise in revenues although part of the rise in government spending has been due to a rise in interest payment.
India
Economic reforms
5000
1000
015
000
2500
0G
DP
per c
apita
(con
stan
t Rs)
1940 1960 1980 2000 2020
YearNote: y-axis log scale
GDP per capita, 1950-2006
Expenditure
Tax revenues
Interest Payments
010
2030
4050
Per
cent
of G
DP
1960 1970 1980 1990 2000 2010
YearNote: Aggregate central and state expenditure
Expenditure and tax revenues, 1970-2007
Source: Handbook of Statistics on Indian Economy
Economic growth is only part of the story behind the proposed plans to increase government health spending in India. In large part, the prioriti zati on accorded to health in the country is a result of the 2005 electi ons which saw an unexpected rise to power of a coaliti on of parti es, including the communists, that considered the electi on outcome to be a mandate for increasing social spending programs for the poor.
17Giving More Weight to Health: Assessing Fiscal Space for Health in Indonesia
There are concerns, however, that, even in a most opti misti c scenario with a projected annual real growth rate in GDP of 7 percent, it will be diffi cult for the government to realize its health spending goal. Under India’s decentralized governmental structure, the bulk of health spending is made by the states, not all of whom are realisti cally expected to increase health spending by the amount needed to increase overall government health spending to 2-3 percent of GDP by 2012. In additi on, the IMF believes that in order to take advantage of the fi scal space from economic growth for investments in the health sector, the government will need to reduce subsidies on food and fuel as well as accelerate debt reducti on.
Source: Government of India 2006; Berman et al 2008; and IMF 2008b.
Despite a recent reducti on in the global price of oil, government expenditure on fuel subsidies in Indonesia remains high, with the IMF esti mati ng the cost at 3 percent of GDP in 2007 with a projecti on of 5 percent of GDP for 2008. The decline in fuel subsidies created some fi scal space in 2008, part of which was being used to reduce government debt and fund cash compensati on programs for the poor. Overall, at least based on precrisis projecti ons, Indonesia’s fi scal positi on appeared to be strong with central government revenues projected to be in the range of 17-20 percent of GDP to 2013. The fi scal defi cit was esti mated at 1.9 percent of GDP in 2008 and projected to remain in this range to 2013. Central government debt levels are expected to decline from 31.2 percent of GDP in 2008 to 25.2 percent of GDP by 2013.
Figure 5-3: Revised Economic Growth Forecast for Indonesia (2008-2013)
Pre-crisis forecast
Post-crisis forecast
45
67
8R
eal G
DP
gro
wth
rate
2003 2005 2007 2009 2011 2013
YearSource: IMF
18 Giving More Weight to Health: Assessing Fiscal Space for Health in Indonesia
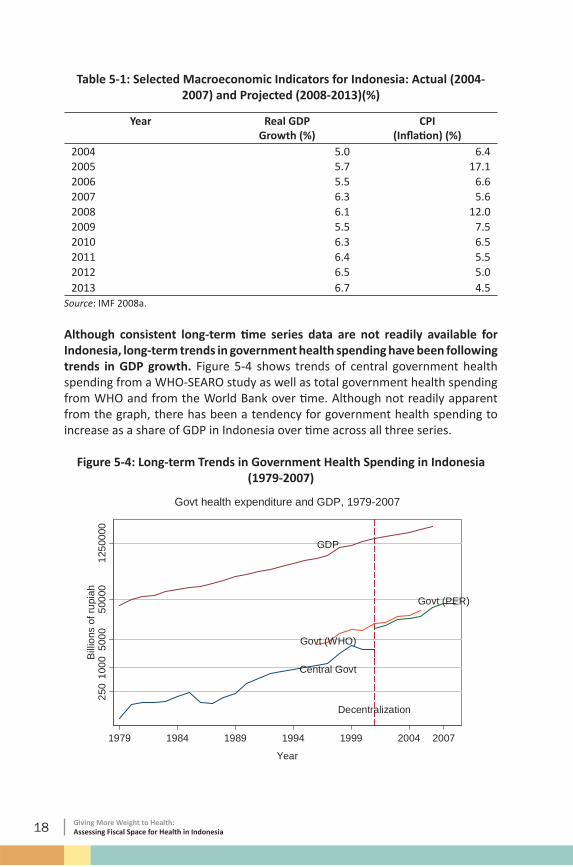
Table 5-1: Selected Macroeconomic Indicators for Indonesia: Actual (2004-2007) and Projected (2008-2013)(%)
Although consistent long-term ti me series data are not readily available for Indonesia, long-term trends in government health spending have been following trends in GDP growth. Figure 5-4 shows trends of central government health spending from a WHO-SEARO study as well as total government health spending from WHO and from the World Bank over ti me. Although not readily apparent from the graph, there has been a tendency for government health spending to increase as a share of GDP in Indonesia over ti me across all three series.
Figure 5-4: Long-term Trends in Government Health Spending in Indonesia (1979-2007)
Decentralization
GDP
Govt (WHO)
Central Govt
Govt (PER)
250
1000
5000
5000
012
5000
0B
illio
ns o
f rup
iah
1979 1984 1989 1994 1999 2004 2007
Year
Govt health expenditure and GDP, 1979-2007
19Giving More Weight to Health: Assessing Fiscal Space for Health in Indonesia
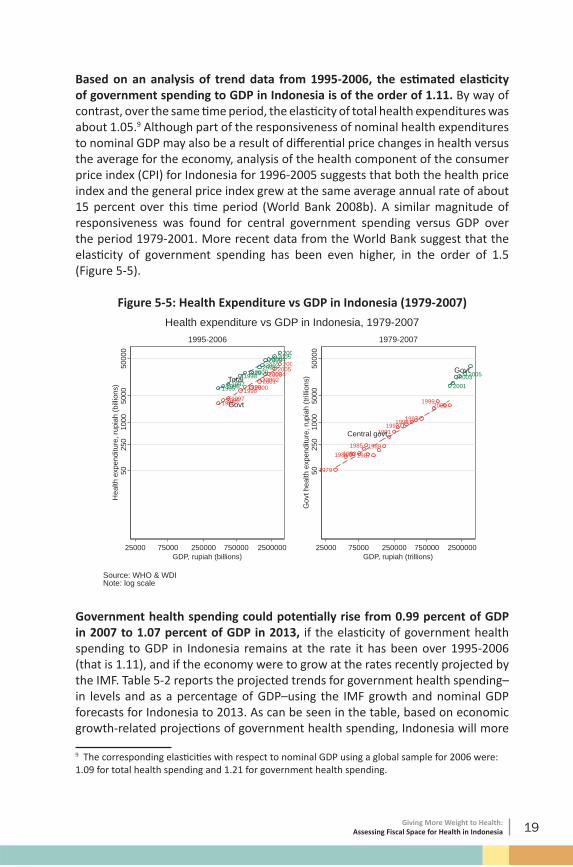
Based on an analysis of trend data from 1995-2006, the esti mated elasti city of government spending to GDP in Indonesia is of the order of 1.11. By way of contrast, over the same ti me period, the elasti city of total health expenditures was about 1.05.9 Although part of the responsiveness of nominal health expenditures to nominal GDP may also be a result of diff erenti al price changes in health versus the average for the economy, analysis of the health component of the consumer price index (CPI) for Indonesia for 1996-2005 suggests that both the health price index and the general price index grew at the same average annual rate of about 15 percent over this ti me period (World Bank 2008b). A similar magnitude of responsiveness was found for central government spending versus GDP over the period 1979-2001. More recent data from the World Bank suggest that the elasti city of government spending has been even higher, in the order of 1.5 (Figure 5-5).
Figure 5-5: Health Expenditure vs GDP in Indonesia (1979-2007)
Government health spending could potenti ally rise from 0.99 percent of GDP in 2007 to 1.07 percent of GDP in 2013, if the elasti city of government health spending to GDP in Indonesia remains at the rate it has been over 1995-2006 (that is 1.11), and if the economy were to grow at the rates recently projected by the IMF. Table 5-2 reports the projected trends for government health spending–in levels and as a percentage of GDP–using the IMF growth and nominal GDP forecasts for Indonesia to 2013. As can be seen in the table, based on economic growth-related projecti ons of government health spending, Indonesia will more
9 The corresponding elasti citi es with respect to nominal GDP using a global sample for 2006 were: 1.09 for total health spending and 1.21 for government health spending.
20 Giving More Weight to Health: Assessing Fiscal Space for Health in Indonesia
than double its nominal health spending levels over the period 2007-2013.Table 5-2: Government Health Expenditure: Actual (2004-2007) and Projected
5.2 Government Expenditures and Revenue Generati on
Higher revenues can be an important source of overall fi scal space. As menti oned earlier, one key factor underlying higher government spending is improved revenue generati on which−in additi on to economic growth−could result from improved administrati on of existi ng tax and nontax collecti on eff orts or from the introducti on of new taxes and other revenue sources, the potenti ally distorti onary eff ects of the latt er on the overall macroeconomy being a key considerati on (World Bank 2006). As would be expected, overall government spending is closely related to revenue generati ng capabiliti es in a country: there is a ti ght correlati on between the government budget as a share of GDP and revenues as a share of GDP. On average, the relati onship between government health spending as a share of GDP versus revenues as a share of GDP is similar to that of total government spending. However, the variability of government health spending to revenue is higher, suggesti ng fl uctuati ons in the budgetary prioriti zati on of health. Indonesia’s government health spending as a share of GDP is far lower than its average revenue share of GDP (Figure 5-6).
21Giving More Weight to Health: Assessing Fiscal Space for Health in Indonesia
Figure 5-6: Government Total and Health Expenditure vs Revenues (2004-2006)
Indonesia
Indonesia
510
2550
Gov
ernm
ents
pend
ing
(%G
DP
)G
over
nmen
thea
lthsp
endi
ng(%
GD
P)
10 20 30 40 50Revenue share of GDP (%)
Source: WDI
Government spending vs revenues, 2004-2006
Government spending (% GDP)
Government health spending (% GDP)
Indonesia’s revenues as a percentage of GDP are lower than the average for its status as a lower middle-income country. In general, revenues as a percentage of GDP rise with income (Figure 5-7). Indonesia collects revenues that are about 19 percent of its GDP, lower than the average 23 percent of GDP for its income group.10 There is some potenti al for raising revenue levels and a recent World Bank Public Expenditure Review (2007b) for Indonesia predicts that nonoil domesti c tax revenues as a percentage of GDP would rise by about 0.4 percent per year in the near term. To what extent this increase in revenue would lead to an increase in government spending is not clear: both the IMF and World Bank predict a fairly fl at trend for government spending as a share of GDP in the short term, in part because oil and gas revenue shares are projected to decline, so off setti ng any improvements in other revenue collecti on eff orts. A recent country report for Indonesia (IMF 2007) has suggested that an additi onal revenue yield of 1 percent of GDP annually could be realized if VAT exempti ons were limited, property taxes were increased, and fringe benefi ts taxes were introduced. If these revenue gains were realized, and assuming the health share of the budget remained at 5 percent, this could potenti ally lead to additi onal fi scal space for health of 0.05 percent of GDP per year for the next few years.
10 The World Bank’s Country Performance and Insti tuti onal Assessment (CPIA) score for effi ciency of revenue mobilizati on for Indonesia was 4 in 2005 on a 6-point scale with 1=lowest and 6=highest. In a recent assessment of revenue potenti al, Indonesia was categorized as falling short of its revenue potenti al See Gupta (2007).
22 Giving More Weight to Health: Assessing Fiscal Space for Health in Indonesia
Figure 5-7: Average Revenues as Percentage of GDP (2003-2006)
0 10 20 30 40Revenue (% of GDP)
Higher income
Upper middle
Lower middle
Lower income
Source: WDI
Revenues (% of GDP), 2003-2006
Local revenue-generati on capacity is low in Indonesia. Local revenues make up only about 8.5 percent of total government revenues in Indonesia. Electricity taxes, taxes on hotels and restaurants, health service user charges, building permit fees, motor vehicle taxes, and public market fees are some of the prominent sources of local revenues at the district and provincial levels. Improvements in local revenue generati on are a potenti al source of additi onal fi scal space but the magnitude of the impact may be limited given the expected conti nuing dominance of central revenue generati on and the weakness and ineffi ciency of local tax administrati ons (World Bank 2007b).
23Giving More Weight to Health: Assessing Fiscal Space for Health in Indonesia
Secti on Six:Fiscal Space from a Health-Sector Specifi c Perspecti ve
The previous secti on examined fi scal space from a macroeconomic perspecti ve. Economic growth, revenue generati on, and other macroeconomic factors have a strong bearing on overall fi scal space and, by derivati on, on fi scal space for health. However, these drivers of fi scal space are largely exogenous to the health sector. This secti on examines some alternati ve policy opti ons for identi fying fi scal space from a more health sector-specifi c perspecti ve.
6.1 Fiscal Space from Earmarked Taxati on and Health-Specifi c Borrowing/Grants
The health sector is somewhat diff erent in the sense that there are a number of possible ways in which fi scal space could be generated by earmarked taxati on or health-specifi c borrowing/grants. For instance, one source of fi scal space that is specifi c to health would be borrowing and grants from internati onal organizati ons such as The Global Fund to Fight AIDS, Tuberculosis and Malaria (GFATM) and the GAVI Alliance (formerly The Global Alliance for Vaccines and Immunizati on). In additi on, taxati on of alcohol and cigarett e consumpti on could be earmarked so that the revenues go directly to the health budget. Even if this does not prove to be a major source of revenue–which is unlikely given Indonesia’s high rates of cigarett e consumpti on–it may help reduce morbidity and mortality related to these risk factors.
There do, however, appear to be politi cal obstacles to taxing tobacco. Indonesia is the only Asian country not to have signed WHO’s Framework Conventi on for Tobacco Control. One cited reason is that excise taxes on tobacco producti on account for almost 10 percent of government revenues, and esti mates indicate
24 Giving More Weight to Health: Assessing Fiscal Space for Health in Indonesia
that the sector employs almost 7 million people (The Economist 2007). Taxes on cigarett es in Indonesia are amongst the lowest in the region: amounti ng to only about 31 percent of the price of cigarett es. Studies have suggested that a 10 percent rise in the price of cigarett es could lower consumpti on by 3.5-6.1 percent and increase government revenues from cigarett e taxati on by 6.7-9 percent (Achadi et al 2005). However, this has to be off set by concerns that cigarett e and alcohol taxati on is oft en regressive and may result in evasion and the development of underground markets. Thailand is an example of a country that has successfully implemented an earmarked tax that directly funds health promoti on acti viti es. In 2001, Thailand insti tuted the Thai Health Promoti on Foundati on (ThaiHealth), funding for which comes directly from a 2 percent earmarked tax on tobacco and alcohol consumpti on that provides an esti mated annual revenue stream of US$50 million (WHO/SEARO 2006). Thailand has also steadily increased cigarett e taxati on over the years–from 55 percent in 1993 to 75 percent in 2001–leading to declining consumpti on rates but increased government revenue from tobacco taxes.
Other examples of earmarked taxati on to create fi scal space for health come from Ghana and Zimbabwe. In Ghana, an additi onal 2.5 percent VAT (see Box 6-1) was implemented to help pay for its nati onal health insurance program. Similarly, Zimbabwe introduced an additi onal 3 percent levy on personal income and corporate taxes to help fund AIDS-related interventi ons. Although earmarked taxes can help add to fi scal space, they may also displace existi ng funding and thereby end up having no signifi cant net impact on overall resources for health. They can also contribute to reducing the fl exibility for spending budgets and these factors need to be taken into account when considering the implementati on of any earmarked taxes (McIntyre 2007).
25Giving More Weight to Health: Assessing Fiscal Space for Health in Indonesia
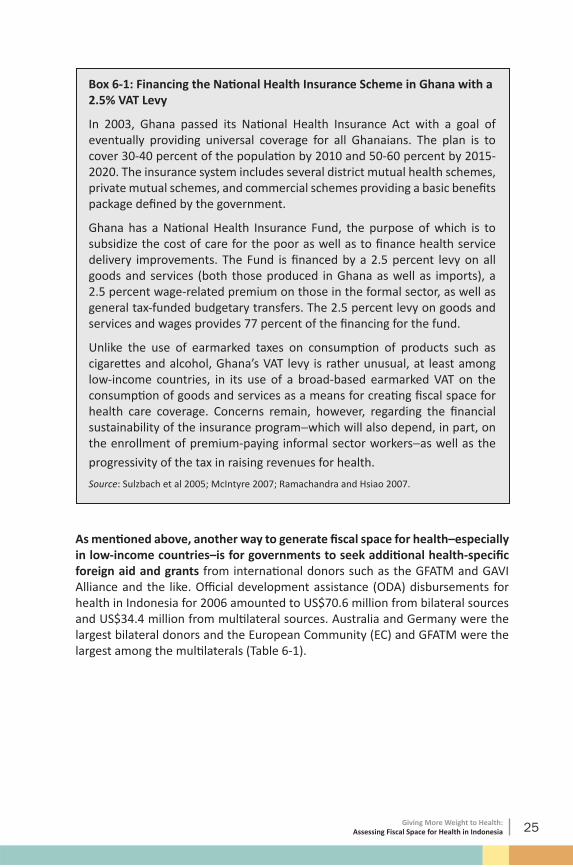
Box 6-1: Financing the Nati onal Health Insurance Scheme in Ghana with a 2.5% VAT Levy
In 2003, Ghana passed its Nati onal Health Insurance Act with a goal of eventually providing universal coverage for all Ghanaians. The plan is to cover 30-40 percent of the populati on by 2010 and 50-60 percent by 2015-2020. The insurance system includes several district mutual health schemes, private mutual schemes, and commercial schemes providing a basic benefi ts package defi ned by the government.
Ghana has a Nati onal Health Insurance Fund, the purpose of which is to subsidize the cost of care for the poor as well as to fi nance health service delivery improvements. The Fund is fi nanced by a 2.5 percent levy on all goods and services (both those produced in Ghana as well as imports), a 2.5 percent wage-related premium on those in the formal sector, as well as general tax-funded budgetary transfers. The 2.5 percent levy on goods and services and wages provides 77 percent of the fi nancing for the fund.
Unlike the use of earmarked taxes on consumpti on of products such as cigarett es and alcohol, Ghana’s VAT levy is rather unusual, at least among low-income countries, in its use of a broad-based earmarked VAT on the consumpti on of goods and services as a means for creati ng fi scal space for health care coverage. Concerns remain, however, regarding the fi nancial sustainability of the insurance program−which will also depend, in part, on the enrollment of premium-paying informal sector workers−as well as the
progressivity of the tax in raising revenues for health.
Source: Sulzbach et al 2005; McIntyre 2007; Ramachandra and Hsiao 2007.
As menti oned above, another way to generate fi scal space for health–especially in low-income countries–is for governments to seek additi onal health-specifi c foreign aid and grants from internati onal donors such as the GFATM and GAVI Alliance and the like. Offi cial development assistance (ODA) disbursements for health in Indonesia for 2006 amounted to US$70.6 million from bilateral sources and US$34.4 million from multi lateral sources. Australia and Germany were the largest bilateral donors and the European Community (EC) and GFATM were the largest among the multi laterals (Table 6-1).
26 Giving More Weight to Health: Assessing Fiscal Space for Health in Indonesia
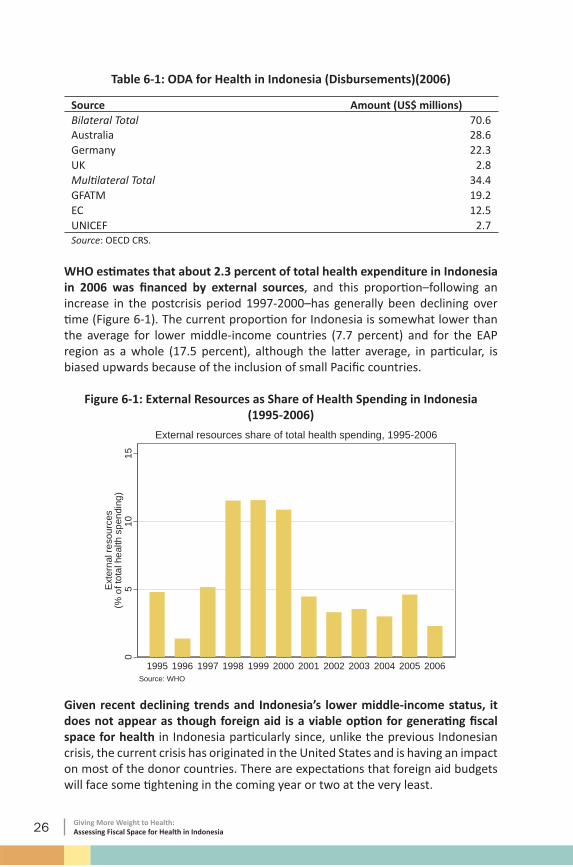
Table 6-1: ODA for Health in Indonesia (Disbursements)(2006)
Source Amount (US$ millions)Bilateral Total 70.6Australia 28.6Germany 22.3UK 2.8Multi lateral Total 34.4GFATM 19.2EC 12.5UNICEF 2.7
Source: OECD CRS.
WHO esti mates that about 2.3 percent of total health expenditure in Indonesia in 2006 was fi nanced by external sources, and this proporti on–following an increase in the postcrisis period 1997-2000–has generally been declining over ti me (Figure 6-1). The current proporti on for Indonesia is somewhat lower than the average for lower middle-income countries (7.7 percent) and for the EAP region as a whole (17.5 percent), although the latt er average, in parti cular, is biased upwards because of the inclusion of small Pacifi c countries.
Figure 6-1: External Resources as Share of Health Spending in Indonesia(1995-2006)
External resources share of total health spending, 1995-2006
Given recent declining trends and Indonesia’s lower middle-income status, it does not appear as though foreign aid is a viable opti on for generati ng fi scal space for health in Indonesia parti cularly since, unlike the previous Indonesian crisis, the current crisis has originated in the United States and is having an impact on most of the donor countries. There are expectati ons that foreign aid budgets will face some ti ghtening in the coming year or two at the very least.
27Giving More Weight to Health: Assessing Fiscal Space for Health in Indonesia
6.2 Fiscal Space from Mandatory Health Insurance
One potenti al mechanism for generati ng fi scal space is via introducti on of mandatory universal health insurance. This is a potenti al strategy by which high out-of-pocket payments may be “captured” by the public sector in the process of introducing health insurance for all via the collecti on of mandatory premiums. The basic economics behind any insurance mechanism is the idea that individuals would prefer payment of a predictable (and relati vely small) dedicated tax or premium in order to avoid unpredictable (and potenti ally large) payments when a health or other shock materializes. There is some evidence that individuals may be more willing to pay earmarked taxes or premiums as long as there are clear benefi ts att ached to the payment of such a tax or premium (Buchanan 1963). Colombia is an example of a country that was able to generate increases in public sector health spending and a reducti on in out-of-pocket expenditure when it introduced mandatory health insurance in 1993 (see Box 6-2).
28 Giving More Weight to Health: Assessing Fiscal Space for Health in Indonesia
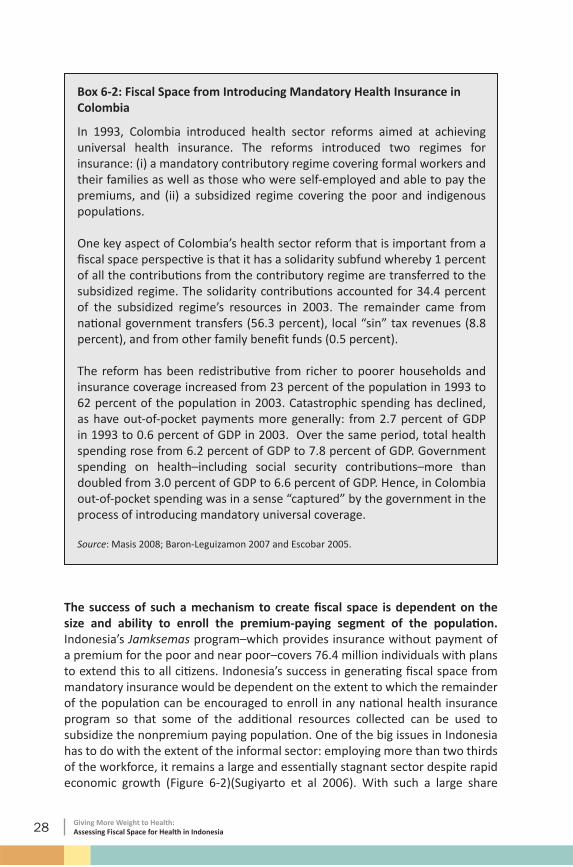
Box 6-2: Fiscal Space from Introducing Mandatory Health Insurance in Colombia
In 1993, Colombia introduced health sector reforms aimed at achieving universal health insurance. The reforms introduced two regimes for insurance: (i) a mandatory contributory regime covering formal workers and their families as well as those who were self-employed and able to pay the premiums, and (ii) a subsidized regime covering the poor and indigenous populati ons.
One key aspect of Colombia’s health sector reform that is important from a fi scal space perspecti ve is that it has a solidarity subfund whereby 1 percent of all the contributi ons from the contributory regime are transferred to the subsidized regime. The solidarity contributi ons accounted for 34.4 percent of the subsidized regime’s resources in 2003. The remainder came from nati onal government transfers (56.3 percent), local “sin” tax revenues (8.8 percent), and from other family benefi t funds (0.5 percent).
The reform has been redistributi ve from richer to poorer households and insurance coverage increased from 23 percent of the populati on in 1993 to 62 percent of the populati on in 2003. Catastrophic spending has declined, as have out-of-pocket payments more generally: from 2.7 percent of GDP in 1993 to 0.6 percent of GDP in 2003. Over the same period, total health spending rose from 6.2 percent of GDP to 7.8 percent of GDP. Government spending on health–including social security contributi ons–more than doubled from 3.0 percent of GDP to 6.6 percent of GDP. Hence, in Colombia out-of-pocket spending was in a sense “captured” by the government in the process of introducing mandatory universal coverage.
Source: Masis 2008; Baron-Leguizamon 2007 and Escobar 2005.
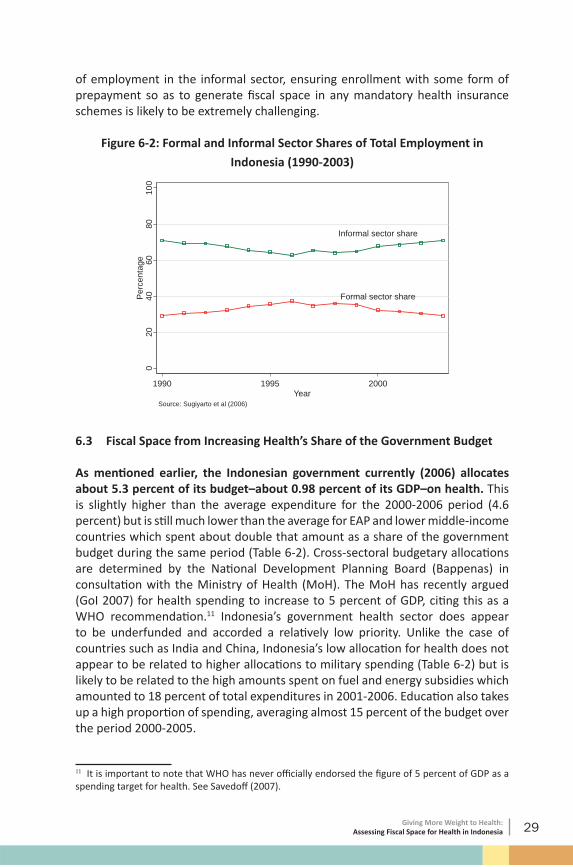
The success of such a mechanism to create fi scal space is dependent on the size and ability to enroll the premium-paying segment of the populati on. Indonesia’s Jamksemas program–which provides insurance without payment of a premium for the poor and near poor–covers 76.4 million individuals with plans to extend this to all citi zens. Indonesia’s success in generati ng fi scal space from mandatory insurance would be dependent on the extent to which the remainder of the populati on can be encouraged to enroll in any nati onal health insurance program so that some of the additi onal resources collected can be used to subsidize the nonpremium paying populati on. One of the big issues in Indonesia has to do with the extent of the informal sector: employing more than two thirds of the workforce, it remains a large and essenti ally stagnant sector despite rapid economic growth (Figure 6-2)(Sugiyarto et al 2006). With such a large share
29Giving More Weight to Health: Assessing Fiscal Space for Health in Indonesia
of employment in the informal sector, ensuring enrollment with some form of prepayment so as to generate fi scal space in any mandatory health insurance schemes is likely to be extremely challenging.
Figure 6-2: Formal and Informal Sector Shares of Total Employment in
Indonesia (1990-2003)
Informal sector share
Formal sector share
020
4060
8010
0P
erce
ntag
e
1990 1995 2000Year
Source: Sugiyarto et al (2006)
6.3 Fiscal Space from Increasing Health’s Share of the Government Budget
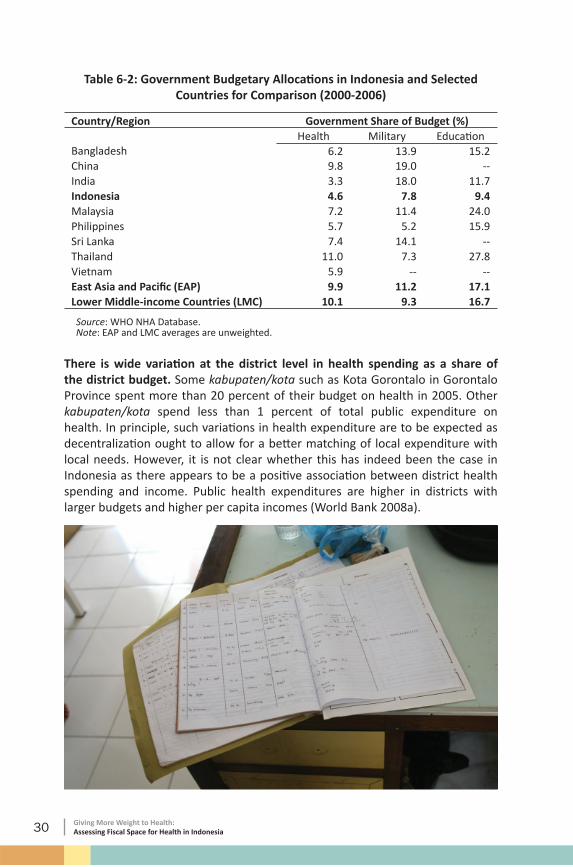
As menti oned earlier, the Indonesian government currently (2006) allocates about 5.3 percent of its budget–about 0.98 percent of its GDP–on health. This is slightly higher than the average expenditure for the 2000-2006 period (4.6 percent) but is sti ll much lower than the average for EAP and lower middle-income countries which spent about double that amount as a share of the government budget during the same period (Table 6-2). Cross-sectoral budgetary allocati ons are determined by the Nati onal Development Planning Board (Bappenas) in consultati on with the Ministry of Health (MoH). The MoH has recently argued (GoI 2007) for health spending to increase to 5 percent of GDP, citi ng this as a WHO recommendati on.11 Indonesia’s government health sector does appear to be underfunded and accorded a relati vely low priority. Unlike the case of countries such as India and China, Indonesia’s low allocati on for health does not appear to be related to higher allocati ons to military spending (Table 6-2) but is likely to be related to the high amounts spent on fuel and energy subsidies which amounted to 18 percent of total expenditures in 2001-2006. Educati on also takes up a high proporti on of spending, averaging almost 15 percent of the budget over the period 2000-2005.
11 It is important to note that WHO has never offi cially endorsed the fi gure of 5 percent of GDP as a spending target for health. See Savedoff (2007).
30 Giving More Weight to Health: Assessing Fiscal Space for Health in Indonesia
Table 6-2: Government Budgetary Allocati ons in Indonesia and Selected Countries for Comparison (2000-2006)
Country/Region Government Share of Budget (%)Health Military Educati on
Source: WHO NHA Database. Note: EAP and LMC averages are unweighted.
There is wide variati on at the district level in health spending as a share of the district budget. Some kabupaten/kota such as Kota Gorontalo in Gorontalo Province spent more than 20 percent of their budget on health in 2005. Other kabupaten/kota spend less than 1 percent of total public expenditure on health. In principle, such variati ons in health expenditure are to be expected as decentralizati on ought to allow for a bett er matching of local expenditure with local needs. However, it is not clear whether this has indeed been the case in Indonesia as there appears to be a positi ve associati on between district health spending and income. Public health expenditures are higher in districts with larger budgets and higher per capita incomes (World Bank 2008a).
31Giving More Weight to Health: Assessing Fiscal Space for Health in Indonesia
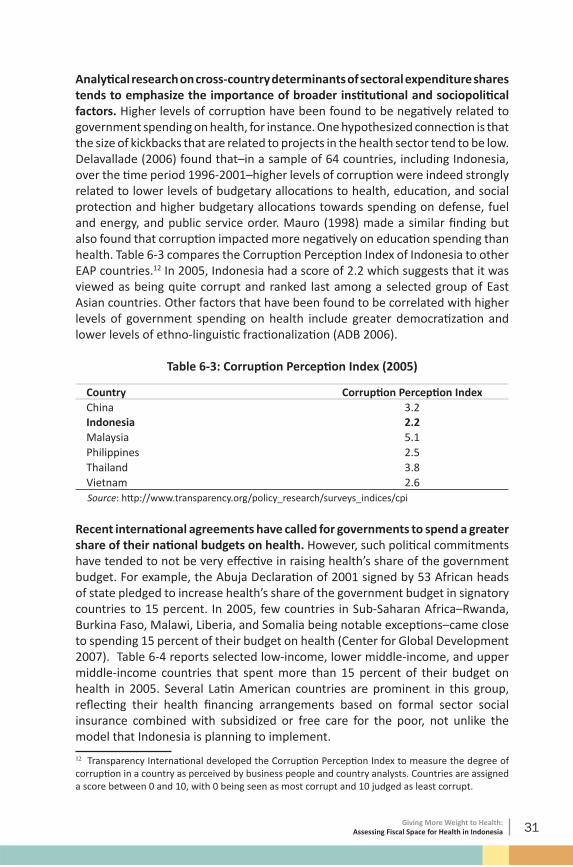
Analyti cal research on cross-country determinants of sectoral expenditure shares tends to emphasize the importance of broader insti tuti onal and sociopoliti cal factors. Higher levels of corrupti on have been found to be negati vely related to government spending on health, for instance. One hypothesized connecti on is that the size of kickbacks that are related to projects in the health sector tend to be low. Delavallade (2006) found that–in a sample of 64 countries, including Indonesia, over the ti me period 1996-2001–higher levels of corrupti on were indeed strongly related to lower levels of budgetary allocati ons to health, educati on, and social protecti on and higher budgetary allocati ons towards spending on defense, fuel and energy, and public service order. Mauro (1998) made a similar fi nding but also found that corrupti on impacted more negati vely on educati on spending than health. Table 6-3 compares the Corrupti on Percepti on Index of Indonesia to other EAP countries.12 In 2005, Indonesia had a score of 2.2 which suggests that it was viewed as being quite corrupt and ranked last among a selected group of East Asian countries. Other factors that have been found to be correlated with higher levels of government spending on health include greater democrati zati on and lower levels of ethno-linguisti c fracti onalizati on (ADB 2006).
Table 6-3: Corrupti on Percepti on Index (2005)
Country Corrupti on Percepti on IndexChina 3.2Indonesia 2.2Malaysia 5.1Philippines 2.5Thailand 3.8Vietnam 2.6
Recent internati onal agreements have called for governments to spend a greater share of their nati onal budgets on health. However, such politi cal commitments have tended to not be very eff ecti ve in raising health’s share of the government budget. For example, the Abuja Declarati on of 2001 signed by 53 African heads of state pledged to increase health’s share of the government budget in signatory countries to 15 percent. In 2005, few countries in Sub-Saharan Africa–Rwanda, Burkina Faso, Malawi, Liberia, and Somalia being notable excepti ons–came close to spending 15 percent of their budget on health (Center for Global Development 2007). Table 6-4 reports selected low-income, lower middle-income, and upper middle-income countries that spent more than 15 percent of their budget on health in 2005. Several Lati n American countries are prominent in this group, refl ecti ng their health fi nancing arrangements based on formal sector social insurance combined with subsidized or free care for the poor, not unlike the model that Indonesia is planning to implement.
12 Transparency Internati onal developed the Corrupti on Percepti on Index to measure the degree of corrupti on in a country as perceived by business people and country analysts. Countries are assigned a score between 0 and 10, with 0 being seen as most corrupt and 10 judged as least corrupt.
32 Giving More Weight to Health: Assessing Fiscal Space for Health in Indonesia
Table 6-4: Selected Countries Spending Greater than 15% of Budget on Health (2005)
Classifi cati on CountryLow-income Burkina Faso; Haiti ; Liberia; Malawi; Rwanda; SomaliaLower middle-income Brazil; Colombia; Guatemala; Honduras; Paraguay; El
SalvadorUpper middle-income Costa Rica; Croati aSource: WHO NHA Database.
Mexico is a recent example of a country that has begun to implement plans to achieve universal health insurance coverage and has increased government allocati ons to health in the process. Mexico’s health reforms−which commenced in 2004−were designed to extend coverage to about 50 million additi onal individuals, largely representi ng the poorer segments of the populati on who were not covered by any of the existi ng schemes. Mexico plans to have universal coverage by 2010, with an additi onal 14.3 percent of uninsured families being covered each year between 2004 and 2010 (see Box 6-3 for additi onal details).
33Giving More Weight to Health: Assessing Fiscal Space for Health in Indonesia
Box 6-3: Mexico’s Health Reform
It is envisioned that by 2010 everyone in Mexico will be covered by one of three insurance schemes: the Insti tuto Mexicano del Seguro Social (IMSS) scheme covering salaried employees in the private sector, the Insti tuto de Seguridad y Servicios Sociales de los Trabajadores del Estado (ISSSTE) for salaried workers in the public sector, and the Seguro Popular scheme for nonsalaried workers, self-employed, and families outside the labor force. Each of these schemes has, or is expected to have, a fi xed tax-fi nanced federal contributi on per family (social quota). This was set at 15 percent of the mandatory minimum wage and currently amounts to US$259 per year per affi liated family. In additi on, there are fi nancing components on the part of the benefi ciary as well as the cocontributor (private employers for IMSS, public employers for ISSSTE, and a solidarity contributi on split between the state and federal governments for Seguro Popular). The solidarity contributi on was set at 1.5 ti mes the social quota with some adjustments upwards for poorer states. The state contributi on−funded out of state revenues−was set at half the federal social quota.
For the Seguro Popular, family contributi ons are based on a family’s capacity to pay, with an upper limit of 5 percent of disposable income. Families in the bott om two deciles are exempt from contributi ons. The benefi ts package includes a set of essenti al primary and secondary care interventi ons provided at the state level and a package of higher-cost terti ary care interventi ons, the latt er being pooled at the nati onal level and provided for at the regional and nati onal levels.
A key aspect of the reform is that enrollment in Seguro Popular is voluntary. However, states have a strong incenti ve to enroll families given that federal allocati ons to state budgets are designed to be a functi on of number of enrollees in that state. In additi on, states have an incenti ve for maintaining quality of care or risk losing enrollees. Those families that choose not to enroll are eligible to seek care at public providers but would have to pay for services at the point of delivery. Financing esti mates for att aining universal coverage by 2010 suggest that government health spending would need to increase by 1 percent of GDP: up from about 2.8 percent of GDP in 2003.
Mexico is an example of a country where health reforms have triggered an increase in the government’s allocati on to the health sector. In real terms, the Ministry of Health’s budget has increased by 69 percent over the period 2001-2006, in part due to the mobilizati on of resources for implementati on of the health reform. Some funding also comes from earmarked taxes on cigarett e sales.
Source: Gakidou et al 2006; Knaul et al 2006; Frenk 2006; Knaul and Frenk 2005.
34 Giving More Weight to Health: Assessing Fiscal Space for Health in Indonesia
6.4 Fiscal Space and Effi ciency of Government Spending on Health
In additi on to increasing budgeted amounts for health, eff ecti ve fi scal space may be generated by increasing the effi ciency of spending. Improvements in the effi ciency of health systems can be an important source of fi scal space. Originally conceptualized in terms of the economics of fi rms and farms, effi ciency is typically defi ned as maximizing output(s) from input(s). Although its applicati on to defi ning the effi ciency of a health system is not perfect, one component of effi ciency is allocati ve: achieving the opti mal mix of inputs given relati ve prices. A second component is technical: given input levels, maximizing the level of output that can be att ained. Allocati ve and technical effi ciency combined together are oft en referred to as economic effi ciency (Jacobs et al 2006). Sri Lanka is oft en presented as an example of a country that has been able to att ain excellent health outcomes with relati vely low levels of resources, in part because of the underlying effi ciency of its health system (see Box 6-4).
35Giving More Weight to Health: Assessing Fiscal Space for Health in Indonesia
Box 6-4: Health System Effi ciency in Sri Lanka
Sri Lanka is one of the best-performing countries in its health outcomes relati ve to resources. The fi gure shows the att ainment of child mortality and maternal mortality outcomes relati ve to income and total health expenditure in Sri Lanka and other countries in 2005. As can be seen from this fi gure, Sri Lanka is one of the most positi ve outliers. Indonesia is above average for child mortality but not for maternal mortality.
Sri Lanka’s Child and Maternal Mortality Relati ve to Income and Total Health Spending (2005)
Indonesia
Sri Lanka
Abov
eav
erag
eBe
low
aver
age
Above average Below average-3-2
-10
12
3Pe
rform
ance
rela
tive
toto
talh
ealth
spen
ding
-3 -2 -1 0 1 2 3Performance relative to income
Under-five mortality
Indonesia
Sri Lanka
Abov
eav
erag
eBe
low
aver
age
Above average Below average-3-2
-10
12
3Pe
rform
ance
rela
tive
toto
talh
ealth
spen
ding
-3 -2 -1 0 1 2Performance relative to income
Maternal mortality
Source: WDI
Performance relative to income and health spending, 2005
Although health outcomes are also a functi on of nonhealth system related factors such as educati on, in Sri Lanka’s case there is some evidence that part of its good performance in health may be due to the fact that its health system has been relati vely effi cient. Its expansion of health coverage post-1960 has occurred during a period when government health spending as a share of GDP has actually been declining.
In the case of some traditi onal effi ciency indicators, Sri Lanka has relati vely low cost per GDP per capita rati os for inpati ent and outpati ent care, has high producti vity of human resources in the health sector, as well as high bed turnover rates and a low average length of stay in hospitals. The health-care delivery modality in the country is oriented towards the use of hospitals for providing both inpati ent and outpati ent primary care and there is some evidence that this has been more cost-eff ecti ve than the use of stand-alone primary care faciliti es, possibly due to economies of scale.
Source: Rannan-Eliya and Sikurajapathy 2008.
36 Giving More Weight to Health: Assessing Fiscal Space for Health in Indonesia
Health system effi ciency can be defi ned at a more micro level (for example at the level of health faciliti es) or at a more macro level (for example at the level of a subnati onal or nati onal health system). Macro-level measurement of effi ciency tends to be problemati c. WHO (2000) att empted to esti mate the performance of nati onal level health systems by relati ng a composite index of health levels, health inequality, responsiveness, responsiveness inequality, and fairness in fi nancial contributi on against total health expenditure, with a control for the level of educati on in a country. Indicator esti mati on problems aside, such macro-level measures of health system effi ciency can be misleading given that they assume that health expenditure is a causal factor underlying health system outcomes. Health outcomes are clearly a functi on of many other factors–educati on, water and sanitati on, housing, and income, to name a few–making the att ributi on of causality to health expenditures alone diffi cult.13
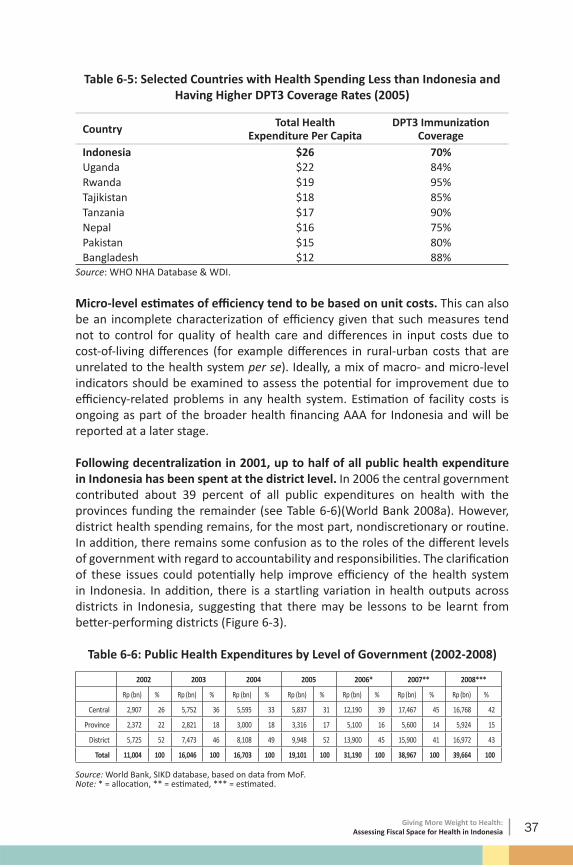
Eff ecti ve coverage rates for given levels of health resources can be an indicator for esti mati ng macro-level health system effi ciency problems. Eff ecti ve coverage–defi ned as the proporti on of the populati on that has a given health care need that receives quality care–is a more direct output measure of a health system (Shengelia et al 2005). Health care needs may be defi ned based on populati on characteristi cs (for example the need for immunizati on among children) or by the presence of a disease or health problem for which an eff ecti ve interventi on is available. Relati ng eff ecti ve coverage to health resources can be a crude esti mate of possible effi ciency problems in a health system. DPT3 immunizati on coverage, for instance, is oft en considered to be a good indicator of the coverage of a health system. Table 6-5 lists several countries in 2005 that spent less on health care than Indonesia but att ained higher DPT3 coverage rates. Clearly, Table 6-5 does not show that Nepal’s health system is more effi cient than Indonesia’s: one would need to look at a more composite measure of eff ecti ve coverage or only look at resources devoted to DPT3 immunizati on in each of the countries to reach such a conclusion. It does suggest, however, that there might be some effi ciency-related problems in Indonesia that merit further study given its poor performance on a key public health measure such as DPT3 immunizati on in light of the net health resources at its disposal.
13 See ADB (2007) for a criti cal overview of methods for measuring macro-level health system effi ciency.
37Giving More Weight to Health: Assessing Fiscal Space for Health in Indonesia
Table 6-5: Selected Countries with Health Spending Less than Indonesia and Having Higher DPT3 Coverage Rates (2005)
Micro-level esti mates of effi ciency tend to be based on unit costs. This can also be an incomplete characterizati on of effi ciency given that such measures tend not to control for quality of health care and diff erences in input costs due to cost-of-living diff erences (for example diff erences in rural-urban costs that are unrelated to the health system per se). Ideally, a mix of macro- and micro-level indicators should be examined to assess the potenti al for improvement due to effi ciency-related problems in any health system. Esti mati on of facility costs is ongoing as part of the broader health fi nancing AAA for Indonesia and will be reported at a later stage.
Following decentralizati on in 2001, up to half of all public health expenditure in Indonesia has been spent at the district level. In 2006 the central government contributed about 39 percent of all public expenditures on health with the provinces funding the remainder (see Table 6-6)(World Bank 2008a). However, district health spending remains, for the most part, nondiscreti onary or routi ne. In additi on, there remains some confusion as to the roles of the diff erent levels of government with regard to accountability and responsibiliti es. The clarifi cati on of these issues could potenti ally help improve effi ciency of the health system in Indonesia. In additi on, there is a startling variati on in health outputs across districts in Indonesia, suggesti ng that there may be lessons to be learnt from bett er-performing districts (Figure 6-3).
Table 6-6: Public Health Expenditures by Level of Government (2002-2008)
2002 2003 2004 2005 2006* 2007** 2008***
Rp (bn) % Rp (bn) % Rp (bn) % Rp (bn) % Rp (bn) % Rp (bn) % Rp (bn) %
Source: World Bank, SIKD database, based on data from MoF.Note: * = allocati on, ** = esti mated, *** = esti mated.
38 Giving More Weight to Health: Assessing Fiscal Space for Health in Indonesia
Figure 6-3: Global Comparison of Indonesian Districts on DPT3 Immunizati on and Skilled Birth Att endance (2005)
Kab. Tana Toraja
Kab. Ciamis
Kab. Morowali
Kab. Subang
Kab. Parigi Moutong
Kab. Bombana
Kab. Madiun
Kota Ambon
Kab. Lombok Barat
Kab. Konawe Selatan
Kota Singkawang
Kab. Bangka Tengah
Bangladesh
Japan
Nepal
Papua New Guinea
Somalia
Timor-LesteIndia
Niger
Pakistan
Chad
Turkey
Uganda
Vietnam
020
4060
8010
0D
PT3
imm
uniz
atio
n
Indonesia Other countries
DPT3 immunizationKota Kediri
Kab. Kediri
Kab. Bantul
Kab. Barito Selatan
Kab. Hulu Sungai Utara
Kab. Nias Selatan
Kota Padang Panjang
Kab. Semarang
Kab. Kuningan
Kab. Barru
Kab. Purbalingga
Kab. Wonosobo Burundi
Cambodia
Senegal
Ukraine
Bhutan
China
Ethiopia
Tanzania
020
4060
8010
0S
kille
dbi
rthat
tend
ance
Indonesia Other countries
Skilled birth attendance
Source: SUSENAS & WDI
Global comparison of Indonesian districts, 2005
One possible avenue for improving the eff ecti ve fi scal space in a decentralized context would be to design interfi scal transfers such that they are geared towards att ainment of health outputs and/or outcomes. Such mechanisms have recently been found to be quite successful in the cases of Argenti na (see Box 6-5) and Rwanda and may be something that could be considered in the Indonesian context as only a small percentage of transfers are currently ti ed to specifi c sectors and even those are not ti ed to the att ainment of specifi c outputs or outcomes.
39Giving More Weight to Health: Assessing Fiscal Space for Health in Indonesia
Box 6-5: Designing Interfi scal Transfers to Att ain Health Results in Argenti na
Argenti na’s Plan Nacer was initi ated in 2004 in order to provide coverage for the poor in provinces located in the northern part of the country. The program is designed to provide results-based fi nancing to provincial governments based on the number of enrollees in the program as well as performance on a set of basic health indicators. About 60 percent of interfi scal transfers from the central government to the provincial governments are based on the number of enrollees and the remaining 40 percent is ti ed to att ainment of ten tracer indicators such as immunizati on rates and average weight at birth of newborns. Service delivery is contracted out by the provincial governments to certi fi ed public and private providers with pati ents free to choose among the providers. The program fi nances a conditi onal matching grant from the central government to provinces which pays half the average per capita cost of a basic benefi t package covering 80 cost-eff ecti ve maternal and child health interventi ons to uninsured mothers and children up to 6 years of age.
The program has built-in incenti ves for increasing enrollment rates as well as for provision of quality care. Capitati on-based and unit-costed payments encourage negoti ati on with providers and effi ciency in delivery of services. Results are independently audited and have so far been quite encouraging.
Source: Johannes, L. 2007.
40 Giving More Weight to Health: Assessing Fiscal Space for Health in Indonesia
In additi on to effi ciency gains from bett er coordinati on across all levels of government, several studies have indicated other avenues by which effi ciency gains may be realized in Indonesia. For instance, a recent IMF analysis argues that Indonesia–by rati onalizing its spending and eliminati ng energy subsidies–could expand overall fi scal space by almost 1.5 percent of GDP. This would entail moving the bulk of expenditure away from personnel, interest payments, subsidies, and government apparatus as it currently stands (which allow litt le room for investment in infrastructure, health, and educati on)(IMF 2007). In additi on, the recent Public Expenditure Review by the World Bank (2007b) shows that public health expenditure is dominated by spending on salaries of personnel and primarily benefi ts the richer quinti les: some effi ciency gains may be actualized by bett er targeti ng and increasing the discreti onary elements of health spending.
Another example that shows room for effi ciency gains comes from a study of health worker absenteeism in Indonesia. Based on unannounced visits to primary health care faciliti es in Indonesia, the study found a 40 percent absenteeism rate among medical workers (Chaudhury 2006). Absenteeism rates tended to be higher among doctors than other types of health workers. This clearly demonstrated the need to reevaluate incenti ves and governance issues related to delivery of health services given that–in “real” terms–expenditure outlays may not be translati ng eff ecti vely into human resource inputs in the health system.
41Giving More Weight to Health: Assessing Fiscal Space for Health in Indonesia
Secti on Seven: Other Issues:
Fiscal Space and the Cost of Health Care
Rising health prices can signifi cantly erode fi scal space for health. If the cost of health care provision rises faster than general price movements in the economy, this can be a major impediment to actualizing, in real terms, any nominal increases in fi scal space for health. In general, given the prominence of (nontradable) labor inputs in the provision of health care, the cost of health care provision is likely to rise at a faster rate than prices in general as economic growth occurs: there is a general tendency for convergence between the prices of tradable and nontradable goods and services as economies become richer.14 On the fl ip side, government regulati ons and policies–including provider payment mechanisms and supply-side incenti ves–can be uti lized to control spiraling medical price infl ati on.
Health prices have tended to track the overall consumer price index (CPI) quite closely in Indonesia. As can be seen in Figure 7-1, from 1996-2003, the index of health prices rose at a slightly faster pace than the general CPI for the country. In 2004/05, health prices grew at a somewhat slower rate than the general CPI. If these trends are maintained then the threat to fi scal space due to diff erenti al price changes in the health sector versus those for the overall economy will remain minimal. However, it is not easy to predict what the demand and supply-side reacti ons would be to plans for universal health insurance coverage in Indonesia. The behavior of health prices would need to be carefully monitored so as not to jeopardize the fi nancial sustainability of Indonesia’s health fi nancing plans.
14 Lower relati ve prices of nontradable goods and services are a prominent reason why purchasing-power parity (PPP) esti mates of GDP are signifi cantly higher than market exchange-rate converted measures of GDP.
42 Giving More Weight to Health: Assessing Fiscal Space for Health in Indonesia
Figure 7-1: Health Prices vs Overall Consumer Price Index in Indonesia (1996-2006)
Consumer price index (health)
Consumer price index (total)
100
150
200
250
300
350
Con
sum
erpr
ice
inde
x(1
996=
100)
1996 1998 2000 2002 2004 2006Year
Source: BPS
Based on internati onal comparisons, health price levels tend to be high in Indonesia. The recent Internati onal Comparison Project esti mated health price levels in 2005 based on a basket of medicine prices and costs of assorted health service consultati ons across several countries in the Asia-Pacifi c region. Indonesia’s health prices were found to be comparable to those in Malaysia and Philippines, but signifi cantly higher than health prices in Thailand, Vietnam, and India (Table 7-1)(ADB 2007b).
Table 7-1: Health and Overall Price Indexes in Selected Asian Countries (2005)
43Giving More Weight to Health: Assessing Fiscal Space for Health in Indonesia
Secti on Eight:Policy Implicati ons
and Discussion
Demographic and epidemiological projecti ons as well as economic growth project rising demand for health care in Indonesia. In additi on, its plans for att aining universal health insurance coverage are likely to require substanti al additi onal resources. Given this backdrop, this paper has outlined some opti ons for assessing the extent to which fi scal space for health might become available in the Indonesian context in the near future. Indonesia has an advantage over many countries in that it has a fairly positi ve prognosis with regard to economic growth in the short term. The key is uti lizing the resource envelope fl exibility that comes with economic growth in order to expand government health expenditure to meet growing demands on the health system, both for improvements in health care as well as for att aining fi nancial protecti on from catastrophic health spending.
There are several opti ons for increasing fi scal space for health in Indonesia. As Indonesia plans to move to universal coverage, one opti on would be to consider some form of cross-subsidizati on such that some proporti on of the resources raised from the premium-paying populati on could be uti lized for subsidizing health care for the poor. Indonesia may also consider earmarked taxati on and a reducti on in fuel and energy subsidies, although more detailed analyses of the impact of such opti ons on the poor would need to be undertaken before a fi nal considerati on could be made.
One key point to note is that fi scal space is not just about increasing nominal spending amounts. Improving the effi ciency of existi ng expenditure outlays is an important source of eff ecti ve fi scal space and must be included in any discussions or policy dialogue on increased health spending. Indonesia has signifi cant diversity in health system outputs and outcomes which may be related to diff erences in effi ciency of the health system across districts. This would be an important area for further research in terms of learning from bett er performing districts.
44 Giving More Weight to Health: Assessing Fiscal Space for Health in Indonesia
Absorpti ve capacity constraints can hinder the actualizati on of fi scal space for health. This is a criti cal issue in the case of Indonesia given its decentralizati on with the locus of decision-making and implementati on authority substanti vely devolved to the district level. One key indicator that suggests there are absorpti ve capacity constraints is the level of unspent reserves held by local governments which is esti mated at 3.1 percent of GDP (World Bank 2007b). There are other constraints–for example large personnel expenditures and the diffi culty of hiring and fi ring civil servants–that can pose signifi cant problems to realizati on of fi scal space. Any analysis of fi scal space should also examine constraints to actualizati on that may occur along the chain of health service delivery modaliti es in Indonesia. This is where recent innovati ons in results-based fi nancing that have been uti lized in other countries may be a policy opti on that could be considered in improving the effi ciency of interfi scal health expenditure transfers.
45Giving More Weight to Health: Assessing Fiscal Space for Health in Indonesia
References
Achadi, A., W. Soerojo, and S. Barber. 2005. The relevance and prospects of advancing tobacco control in Indonesia. Health Policy, 72(3), pp. 333-349.
ADB. 2006. Key Indicators 2006: Measuring Policy Eff ecti veness in Health and Educati on. Manila: Asian Development Bank.
ADB. 2007a. Preparatory Studies on Nati onal Social Security System in Indonesia. Manila: Asian Development Bank.
ADB. 2007b. Purchasing Power Pariti es and Real Expenditures. Manila: Asian Development Bank.
Baron-Leguizamon, G. 2007. Gasto Nacional en Salud de Colombia 1993-2003: Composicion y Tendencias. Revista de Salud Publica, 9(2), pp. 167-179.
Berman, P., and R. Ahuja. 2008. Government Health Spending in India: Getti ng to 2% of GDP. World Bank Working Paper, New Delhi.
Buchanan, J.M. 1963. The Economics of Earmarked Taxes. Journal of Politi cal Economy, 71, pp. 457-469.
Center for Global Development. 2007. Does The IMF Constrain Health Spending in Poor Countries? Evidence and an Agenda for Acti on. Washington DC: Center for Global Development.
Chaudhury, N., J. Hammer, M. Kremer, K. Muralidharan, and F.H. Rogers. 2006. Missing in Acti on: Teacher and Health Worker Absence in Developing Countries. Journal of Economic Perspecti ves, 20(1), pp. 91-116.
Delavallade, C. 2006. Corrupti on and Distributi on of Public Spending in Developing Countries. Journal of Economics and Finance, 30(2), pp. 222-239.
46 Giving More Weight to Health: Assessing Fiscal Space for Health in Indonesia
Economist, The. 2007. Can’t kick the habit: Smoking in Asia, Sep 22.
Escobar, M.L. 2005. Health Sector Reform in Colombia. Development Outreach, May 2005. Washington DC: World Bank.
Frenk, J. 2006. Bridging the divide: global lessons from evidence-based health policy in Mexico. Lancet, 368, pp. 954-961.
Frenk, J., E. Gonzalez-Pier, O. Gomez-Dantes, M.A. Lezana, and F.M Knaul. 2006. Comprehensive reform to improve health system performance in Mexico. Lancet, 368, pp. 1524-1534.
Gakidou, E., R. Lozano, E. Gonzalez-Pier, J. Abbott -Klaft er, J.T. Barofsky, C. Bryson-Cahn, D.M. Feehan, D.K. Lee, H. Hernandez-Llamas, and C.J.L. Murray. 2006. Assessing the eff ect of the 2001-06 Mexican health reform: an interim report card. Lancet, 368, pp. 1920-1935.
Government of India. 2006. Towards Faster and More Inclusive Growth: An Approach to the 11th Five Year Plan. New Delhi: Planning Commission of India.
Government of Indonesia (2007). Health Financing and Security Acti on Plan 2005-2009. Jakarta: Ministry of Health.
Gupta, A.S. 2007. Determinants of Tax Revenue Eff orts in Developing Countries. IMF Working Paper WP/07/184. Washington DC: Internati onal Monetary Fund.
Heller, P. 2006. The prospects of creati ng ‘Fiscal Space’ for the health sector. Health Policy and Planning, 21(2), pp. 75-79.
IMF (2007). Indonesia: Selected Issues -- Country Report 07/273. Washington DC: Internati onal Monetary Fund.
IMF (2008a). Indonesia 2008 Arti cle IV Consultati ons. Washington DC: Internati onal Monetary Fund.
IMF (2008b). India: 2007 Arti cle IV Consultati on. Washington DC: Internati onal Monetary Fund.
Jacobs, R., P.C. Smith, and A. Street. 2006. Measuring Effi ciency in Health Care: Analyti c Techniques and Health Policy. Cambridge: Cambridge University Press.
Johannes, L. 2007. Output-based Aid in Health: The Argenti ne Maternal-Child Health Insurance Program. OBApproaches. Washington DC: World Bank.
47Giving More Weight to Health: Assessing Fiscal Space for Health in Indonesia
Knaul, F.M., H. Arreola-Ornelas, O. Mendez-Carniado, C. Bryson-Cahn, J. Barofsky, R. Maguire, M. Miranda, and S. Sesma. 2006. Evidence is good for your health system: policy reform to remedy catastrophic and impoverishing health spending in Mexico. Lancet, 368, pp. 1828-1841.
Knaul, F.M., and J. Frenk. 2005. Health insurance in Mexico: achieving universal coverage through structural reform. Health Aff airs, 24(6), pp. 1467-1476.
Lane, C. 2007. Fiscal Space for Health: A Criti cal Literature Review. Mimeo. Washington DC: World Bank.McIntyre, D. 2007. Learning from experience: Health care fi nancing in low- and middle-income countries. Geneva: Global Forum for Health Research.
Masis, D.P. 2008. Colombia: Good Practi ces in Expanding Health Care Coverage. In Good Practi ces in Health Financing, eds. P. Gott ret, G. Schieber, and H. Waters. Washington DC: World Bank.
Mauro, P. 1998. Corrupti on and the compositi on of government expenditure. Journal of Public Economics, 69, pp. 263-279.
Ramachandra, S., and W.C. Hsiao. 2007. Ghana: Initi ati ng Social Health Insurance. In Social Health Insurance for Developing Nati ons, eds. W.C. Hsiao, and P.R. Shaw. Washington DC: World Bank.
Rannan-Eliya, R.P., and L. Sikurajapathy. 2008. Sri Lanka: “Good Practi ce” in Expanding Health Care Coverage. In Good Practi ces in Health Financing, eds. P. Gott ret, G. Schieber, and H. Waters. Washington DC: World Bank.
Savedoff , W. 2007. What Should a Country Spend on Health Care? Health Aff airs, 26(4), pp. 962-970.
Shengelia, B., A. Tandon, O.B. Adams, and C.J.L. Murray. 2005. Access, uti lizati on, quality, and eff ecti ve coverage: an integrated conceptual framework and measurement strategy. Social Science and Medicine, 61(1), pp. 97-109.
Sugiyarto, G., M. Oey-Gardiner, and N. Triaswati . 2006. Labor Markets in Indonesia: Key Challenges and Policy Issues. In Labor Markets in Asia: Issues and Perspecti ves, eds. J. Felipe and R. Hasan. London: Palgrave Macmillan for the Asian Development Bank.
Sulzbach, S., B. Garshong, and G. Owusu-Banahene. 2005. Evaluati ng the Eff ects of the Nati onal Health Insurance Act in Ghana: Baseline Report. Bethesda, MD: Ghana Health Service and Abt Associates/PHRPlus.
48 Giving More Weight to Health: Assessing Fiscal Space for Health in Indonesia
UNESCAP/ADB/UNDP. 2007. Millennium Development Goals: Progress in Asia and the Pacifi c 2007. Bangkok: UNESCAP.
Van Doorslaer, E., O. O’Donnell, R.P. Rannan-Eliya, A. Somanathan et al. 2006. Eff ect of payments for health care on poverty esti mates in 11 countries in Asia: an analysis of household survey data. Lancet, 368, pp. 1357-1364.
WHO. 2000. The World Health Report 2000: Health Systems: Improving Performance. Geneva: World Health Organizati on.
WHO/SEARO. 2006. Regional Strategy for Health Promoti on Follow-Up of the Sixth Global Conference on Health Promoti on: Health Promoti on and Dedicated Taxes. New Delhi: World Health Organizati on, South-East Asia Regional Offi ce.
World Bank. 2006. Fiscal Policy for Growth and Development: An Interim Report. Background report for the Development Committ ee Meeti ng. Washington DC: World Bank.
World Bank. 2007b. Spending for Development: Making the Most of Indonesia’s New Opportuniti es. Indonesia Public Expenditure Review. Jakarta: World Bank Offi ce.
World Bank. 2008a. Investi ng in Indonesia’s Health: Challenges and Opportuniti es for Future Public Spending. Health Public Expenditure Review 2008. Jakarta: World Bank Offi ce.
World Bank. 2008b. Indonesia Quarterly Economic Update: Batt ening Down the Hatches. Jakarta: World Bank.
Xu, K., D.B. Evans, G. Carrin, A.M Aguilar-Rivera, P. Musgrove, and T. Evans. 2007. Protecti ng households from catastrophic health spending. Health Aff airs, 26(4), pp. 972-983.
Xu, K., D.B. Evans, K. Kawabata, R. Zeramdini, J. Klavus, and C. Murray. 2003. Household catastrophic health expenditure: a multi country analysis. Lancet, 362, pp. 111-117.
49Giving More Weight to Health: Assessing Fiscal Space for Health in Indonesia
50 Giving More Weight to Health: Assessing Fiscal Space for Health in Indonesia