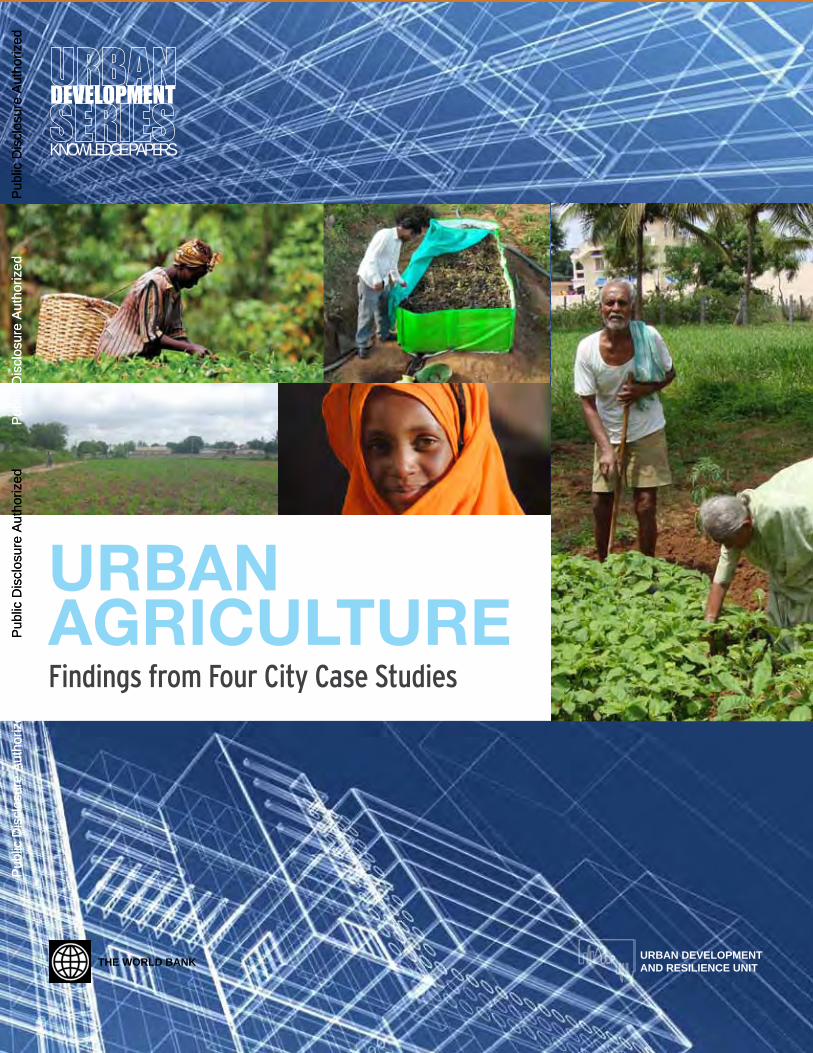
KNOWLEDGE PAPERS Findings from Four City Case Studies URBAN AGRICULTURE THE WORLD BANK URBAN DEVELOPMENT AND RESILIENCE UNIT Public Disclosure Authorized Public Disclosure Authorized Public Disclosure Authorized Public Disclosure Authorized Public Disclosure Authorized Public Disclosure Authorized Public Disclosure Authorized Public Disclosure Authorized
Transcript
Knowledge PAPeRS
Findings from Four City Case Studies
Urban aGrICULTUrE
The World Bank UrBan developmenT and resilience UniT
Pub
lic D
iscl
osur
e A
utho
rized
Pub
lic D
iscl
osur
e A
utho
rized
Pub
lic D
iscl
osur
e A
utho
rized
Pub
lic D
iscl
osur
e A
utho
rized
Pub
lic D
iscl
osur
e A
utho
rized
Pub
lic D
iscl
osur
e A
utho
rized
Pub
lic D
iscl
osur
e A
utho
rized
Pub
lic D
iscl
osur
e A
utho
rized
WB456288
Typewritten Text
WB456288
Typewritten Text
80759
Urban Development SeriesProduced by the World Bank’s Urban Development and Resilience Unit of the Sustainable Development Network, the Urban Development Series discusses the challenge of urbanization and what it will mean for developing countries in the decades ahead. The Series aims to explore and delve more substantively into the core issues framed by the World Bank’s 2009 Urban Strategy Systems of Cities: Harnessing Urbanization for Growth and Poverty Alleviation. Across the five domains of the Urban Strategy, the Series provides a focal point for publications that seek to foster a better understanding of (i) the core elements of the city system, (ii) pro-poor policies, (iii) city economies, (iv) urban land and housing markets, (v) sustainable urban environment, and other urban issues germane to the urban development agenda for sustainable cities and communities.
1818 H Street, NW Washington, DC 20433 USA www.worldbank.org/urban
This publication is a product of the staff of the World Bank Group. It does not necessarily reflect the views of the Executive Directors of the World Bank or the governments they represent. The World Bank does not guarantee the accuracy of the data included in this work.
This note is provided for information only. The World Bank has no responsibility for the persistence or accuracy of URLs and citations for external or third-party sources referred to in this publication, and does not guarantee that any content is, or will remain, accurate or appropriate.
Table G8: The impact of consumption of one’s own food produced in Lima . . . . . . . . . . . . . . . . . . . . . . . 86
Foreword i
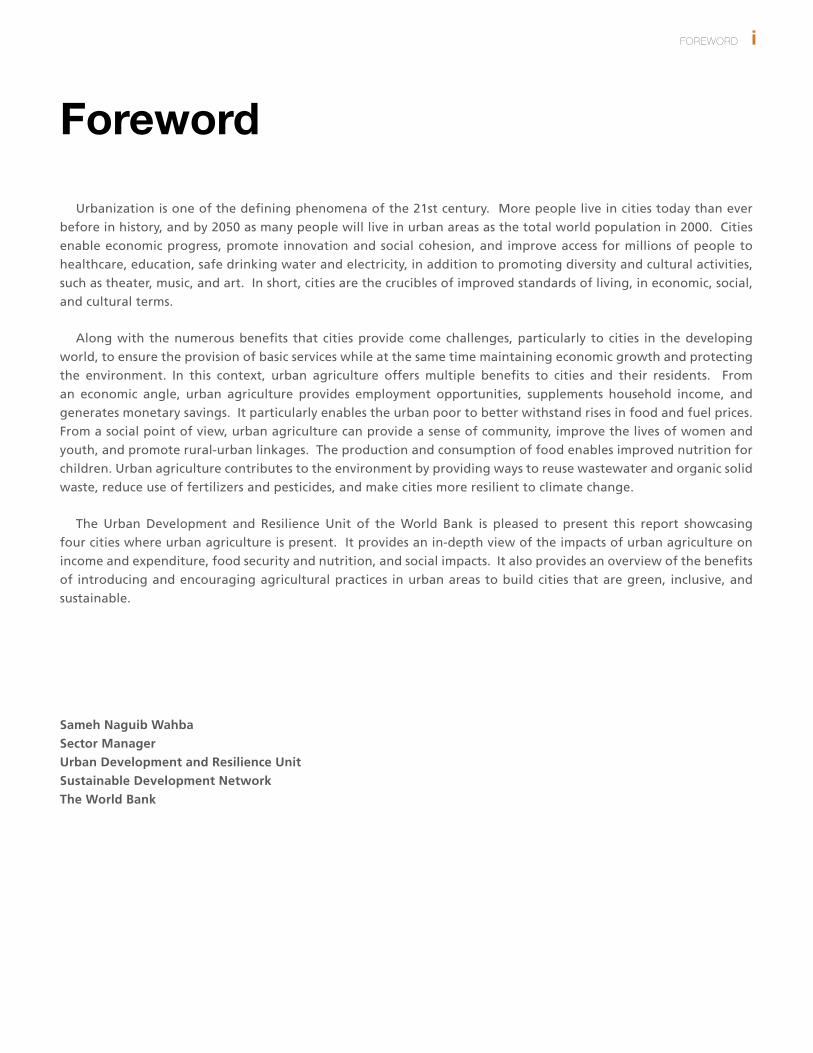
Foreword
Urbanization is one of the defining phenomena of the 21st century. More people live in cities today than ever before in history, and by 2050 as many people will live in urban areas as the total world population in 2000. Cities enable economic progress, promote innovation and social cohesion, and improve access for millions of people to healthcare, education, safe drinking water and electricity, in addition to promoting diversity and cultural activities, such as theater, music, and art. In short, cities are the crucibles of improved standards of living, in economic, social, and cultural terms.
Along with the numerous benefits that cities provide come challenges, particularly to cities in the developing world, to ensure the provision of basic services while at the same time maintaining economic growth and protecting the environment. In this context, urban agriculture offers multiple benefits to cities and their residents. From an economic angle, urban agriculture provides employment opportunities, supplements household income, and generates monetary savings. It particularly enables the urban poor to better withstand rises in food and fuel prices. From a social point of view, urban agriculture can provide a sense of community, improve the lives of women and youth, and promote rural-urban linkages. The production and consumption of food enables improved nutrition for children. Urban agriculture contributes to the environment by providing ways to reuse wastewater and organic solid waste, reduce use of fertilizers and pesticides, and make cities more resilient to climate change.
The Urban Development and Resilience Unit of the World Bank is pleased to present this report showcasing four cities where urban agriculture is present. It provides an in-depth view of the impacts of urban agriculture on income and expenditure, food security and nutrition, and social impacts. It also provides an overview of the benefits of introducing and encouraging agricultural practices in urban areas to build cities that are green, inclusive, and sustainable.
Sameh Naguib Wahba Sector ManagerUrban Development and Resilience UnitSustainable Development Network The World Bank
ii UrBAN AGrICULTUre: FINdINGS FroM FoUr CITY CASe STUdIeS
acknowledgmentsThis report is a product of the Urban Development and Resilience Unit of the World Bank and benefited from the
support of the Trust Fund for Environmentally & Socially Sustainable Development (TFESSD).
Preparation of this guide involved a core team at the World Bank that included Marcus Lee (Task Team Leader), Perinaz Bhada-Tata, Claudia Henriquez Gallegos, and Rana Amirtahmasebi. Content for chapters 1-3 were contributed by Ir. Marielle Dubbeling (RUAF Foundation), Dr. Gordon Prain (CIP-Lima), and Ir. Henk de Zeeuw (RUAF Foundation), and also draws upon an earlier FAO-World Bank paper on urban agriculture, Urban Agriculture for Sustainable Poverty Alleviation and Food Security (2008) and an FAO-RUAF report on Cities, Agriculture, and Poverty: Challenges and The Way Forward (2009). Content from the case study of Bangalore was provided by Amalendu Jyotishi (Amrita School of Business, Bangalore), Priyanie Amerasinghe (IWMI, Hyderabad), Sreedhar Archarya (IWMI, Hyderabad), Vikas Kumar (Amrita School of Business, Bangalore), C. G. Yadava (IWMI, Hyderabad), and R. S. Deshpande (ISEC, Bangalore). The case study of Accra is based on a report authored by Dr. George T-M. Kwadzo (University of Ghana, Legon), Dr. John Baptist, D. Jatoe (University of Ghana, Legon), Dr. Olufunke Cofie (IWMI), Philip Amoah (IWMI), and Gerald Forkuor (IWMI). The case study of Nairobi is based on work by Mary Njenga and Nancy Karanja of University of Nairobi and Gamma Systems. The content of the case study on Lima was provided by Mary E. Penny, Hilary M. Creed-Kanashiro, Miluska Carrasco, Margot Marin from the Instituto de Investigación Nutricional, and Gunther Merzthal and Alain Santandreu at IPES Promoción del Desarrollo Sostenible. RUAF Foundation, through Ir. Marielle Dubbeling and Gordon Prain, coordinated the activities of the various case studies and prepared an overall synthesis report.
Valuable comments and inputs were received from the peer reviewers Ademola Braimoh, John Morton, and Jonas Parby. The original concept and TFESSD proposal for this work was developed by Anjali Acharya, Christa Anderson, and Daniel Hoornweg of the World Bank.
Gisela Campillo and Meena Anvananthan contributed to the development of the final report. Claudia Henríquez provided valuable support for analysis of the original data. Much appreciation is due to Xiaofeng Li, Laura De Brular, Adelaide Barra, and Vivian Cherian for their excellent support to the World Bank team. Finally, thanks go to Zoubida Allaoua, Sameh Wahba, Abha Joshi-Ghani, and Daniel Hoornweg for their leadership, guidance, and support.
eXeCUTIVe SUMMArY iii
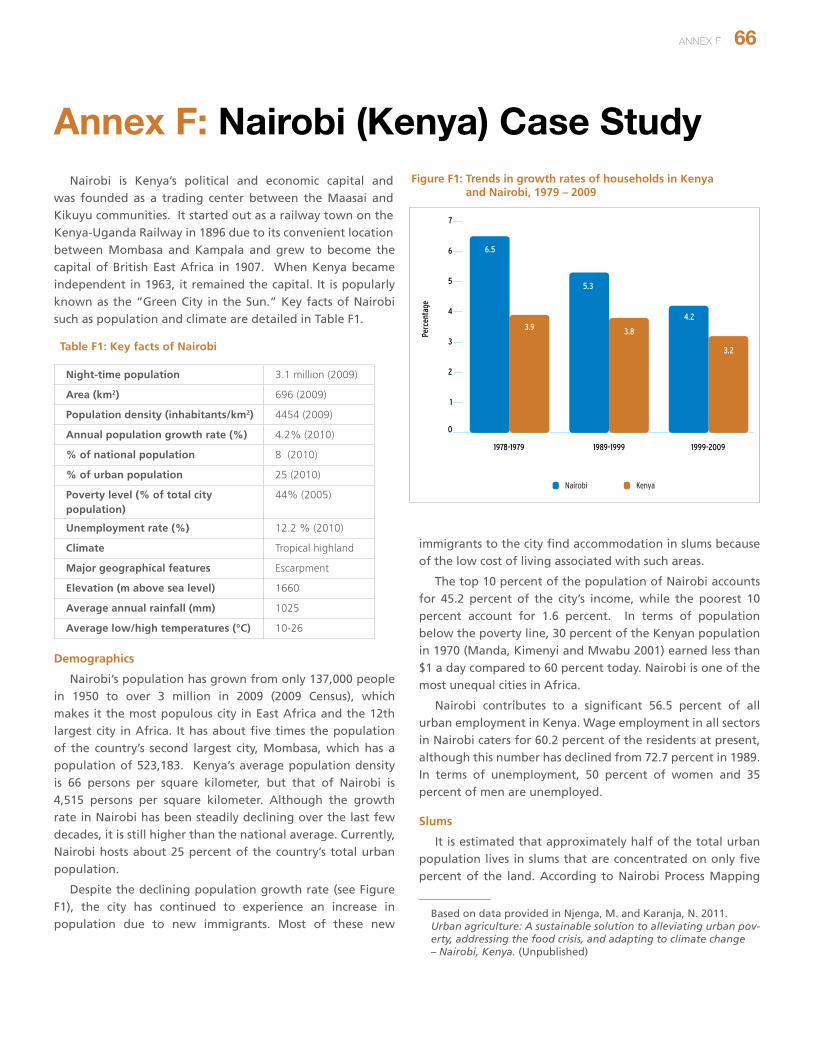
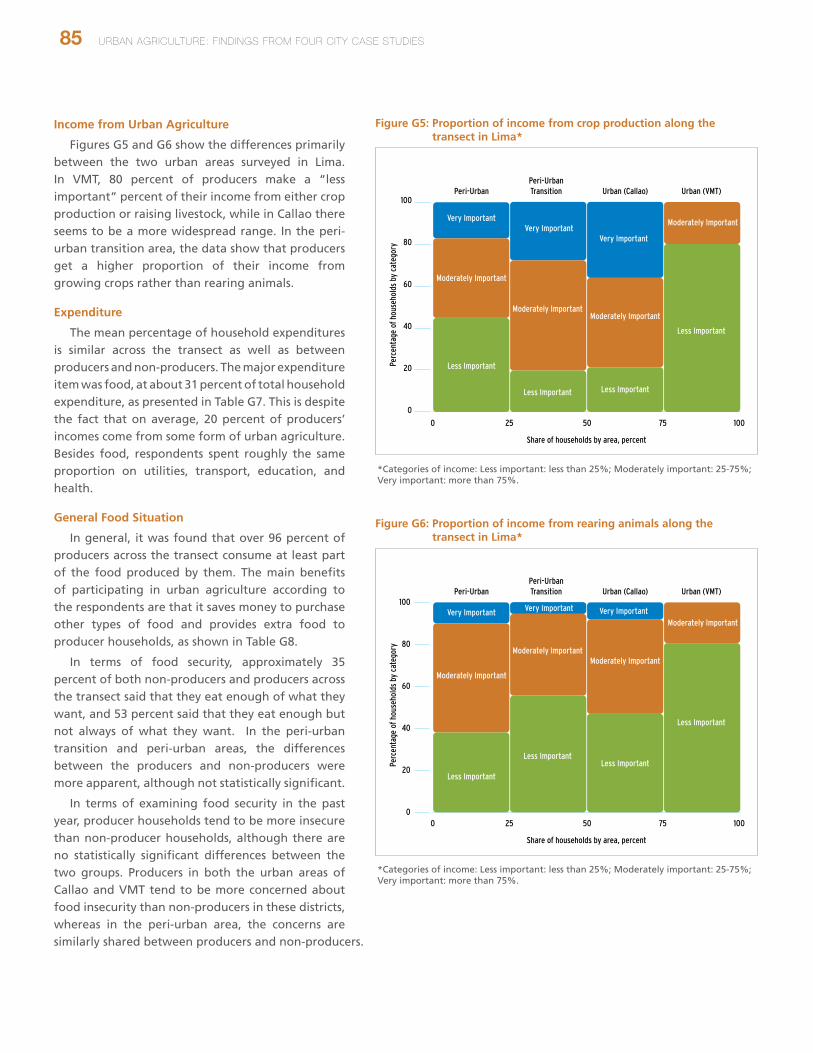
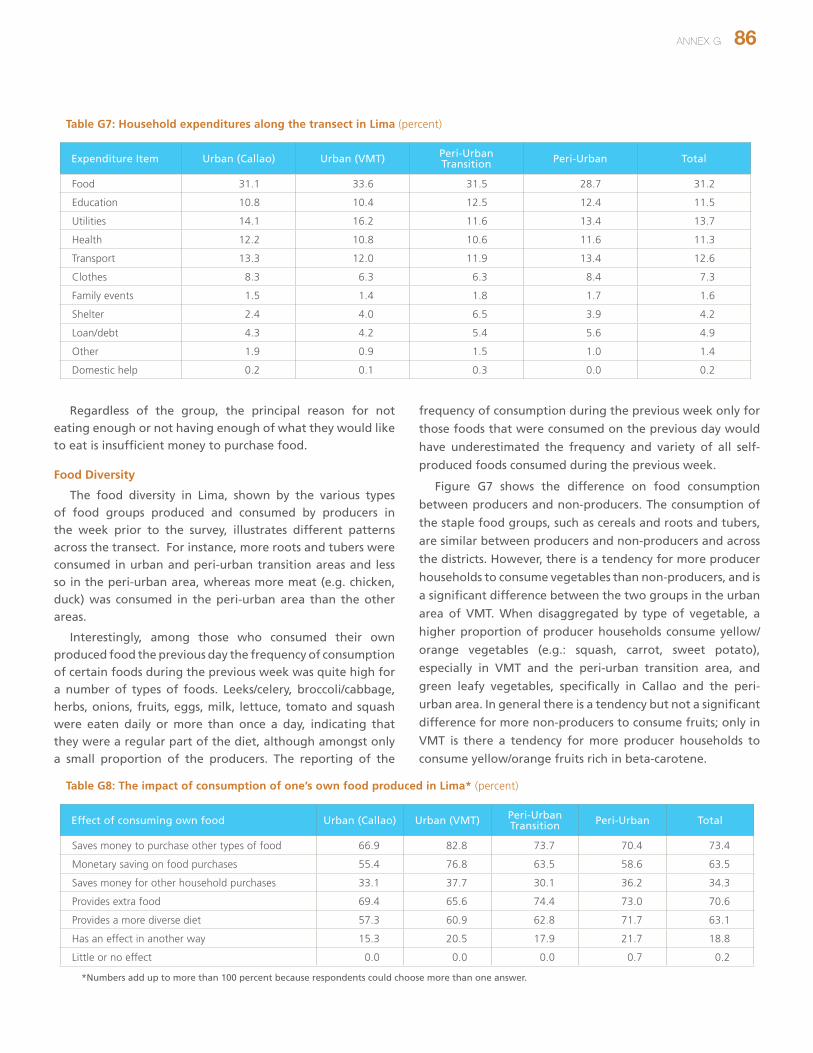
Executive SummaryUrban agriculture contributes to local economic
development, poverty alleviation, the social inclusion of
the urban poor and women, as well as to the greening of
the city and the productive reuse of urban wastes . While
there is a growing awareness about the role of urban
agriculture in the context of food security and poverty
alleviation for urban populations, urban agriculture largely
remains an informal sector that is not well integrated
into agricultural policies or urban planning. Gaps in the
availability of good quality, current and comparable data
on the benefits and constraints of urban agriculture limit
the design of relevant policies and interventions that
would enhance the positive impacts for urban livelihoods
and public health, as well as for the environment.
Urban agriculture encompasses a wide variety of
production systems in both urban as well as peri-urban
areas . These systems include crops, fish, and livestock
production, as well as herbs, medicinal and ornamental
plants for both home consumption and for the market.
Urban agriculture contributes to a substantial portion of
food consumed in cities in many countries around the
world.
This study examines the contribution of urban
agriculture to livelihoods, food security, health, and the
urban environment through an assessment of existing
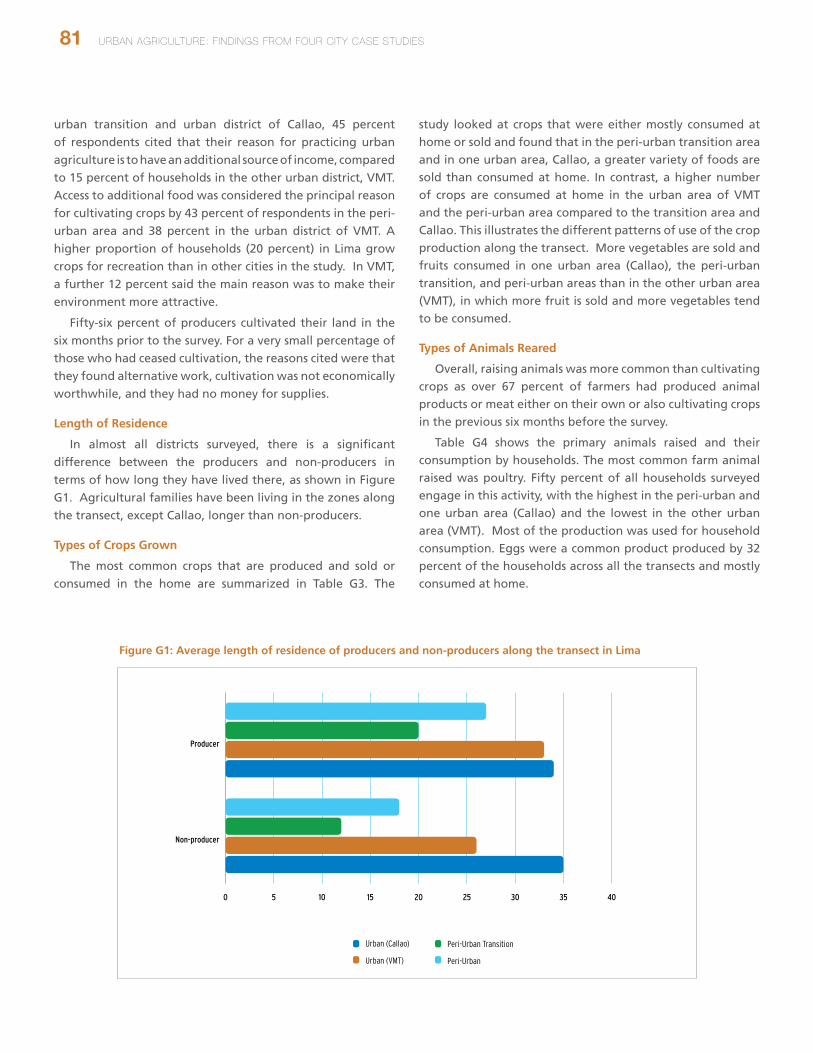
urban agriculture activities among poor households
in four selected cities . Urban agriculture, as defined in
this report, encompasses both “intra-urban” as well
as “peri-urban” agriculture. Through data collected in
surveys, focus group discussions, and city consultations,
this study comparatively analyzes the social and economic
effects of urban agriculture on the urban poor. The case
studies of Accra, Ghana; Bangalore, India; Lima, Peru; and
Nairobi, Kenya were undertaken to help bridge existing
knowledge gaps and to help inform policy makers about
urban agriculture.
Data on age, education, and migration show that
urban agriculture provides a stable occupation and
income strategy for a vulnerable sector of the population
that tends to be older, less well educated, and settled
in urban areas earlier than non-producers . Urban
agriculture generally also provides occupation and income
for households that migrated to cities earlier than non-
producers. This does not support commonly held ideas that
urban producers are typically recent migrants who are still
transitioning towards integration into (non-agricultural)
urban society.
There is some hard evidence to support the claim that
urban agriculture is highly compatible with other kinds of
employment, particularly informal business or even casual
labor . This apparent adaptability of agricultural activity
with other concurrent occupations also facilitates access
to multiple income sources. Such diversification of income
sources is important as a risk management and adaptation
strategy. The role of urban agriculture as an income source
is thus considered of greater importance than as a direct
source of additional food, except in Nairobi where the
opposite is true.
Another important benefit from urban agricultural
production is in the cash savings from self-produced food
that would otherwise have to be purchased . Although the
foods purchased with savings depend on local food cultures
to some extent, there are commonalities, primarily in the
important use of savings to purchase local staple foods.
The vast majority of staple foods are typically produced in
rural areas and facilitating their purchase through savings
from own production is a key contribution. Savings are
also important for covering higher-value items in the diet,
such as micronutrient and protein-rich animal foods and
supplementary vegetables.
iv UrBAN AGrICULTUre: FINdINGS FroM FoUr CITY CASe STUdIeS
In terms of food groups consumed, there were no
major differences between producers and non-producers,
though some differences were found for particular food
groups, such as green leafy vegetables and beta-carotene
rich foods . The diversification of food sources reduces the
vulnerability of producer and non-producer households
and enhances their coping capacities by increasing
the stability of household food consumption against
seasonality, disturbances in food supplies from rural areas
or imports, increases in food prices, and losses of income.
As food prices have doubled in the last five years and
are expected to continue to rise in the coming decades,
leading to a further deterioration of food security in cities,
the role of urban agriculture in this respect may become
more important than is currently considered.
In terms of ownership of the land that producers use
for rearing animals and/or growing crops, a common
pattern is seen across the four cities, where the rate of
land ownership is higher among producers than non-
producers . In the case of Accra, there is also a significant
proportion of producer households who rent or lease
plots; in urban areas publicly available land is used for
urban agriculture activities. In Nairobi, too, the use of
publicly available space is important in urban and peri-
urban transition areas.
The development of urban agriculture is generally
constrained by the loss of agricultural land, specifically
in peri-urban transition and peri-urban areas, as well as
the lack of secure tenure . Lack of access to safe irrigation
water, credit and capital were also identified as constraints
by producers across the four cities. In addition, the
agricultural extension system is generally weak, and cannot
respond to the need for training on more sustainable and
profitable urban agriculture production systems. Readily
available market demand and increasing support by policy
makers at local and national level do, however, offer real
opportunities to current and future urban producers.
The role and importance of urban agriculture will
likely increase with urbanization and climate change, so
the integration of urban agriculture into development
strategies and policy decisions would be important
for long-term sustainability . The integration of urban
agriculture should be relevant and customized to the
objectives and circumstances of individual cities. City-
level decision-makers can be the primary facilitators
for such integration, with appropriate support from
the national level, and action and engagement at the
local and community level within cities. Doing so offers
the opportunity to address multi-sectoral and multi-
disciplinary issues, including crop and livestock production,
aquaculture, agro-forestry, in the overall context of proper
natural resource management.
To further enhance the potential positive impacts of
urban agriculture, this study makes recommendations
to strengthen urban agriculture as an income source,
and promote local food systems and integrated land-use
planning . Specifically, these recommendations include
the integration of urban agriculture into urban planning
and city-based climate change strategies and action
plans; support for urban agriculture through improved
market infrastructure, training and extension programs;
strengthened producer organizations, value-chain
development and direct marketing, and increased access
to finance; promotion of more local and regional food
systems; and integration of agriculture and food culture
into nutrition education programs.
ACroNYMS ANd ABBreVIATIoNS v
acronyms and abbreviationsABWI Asset-based Wealth Indicator
ADMA Adentan Municipal Assembly
AEA Agricultural Extension Agents
AMA Accra Metropolitan Assembly
AU Administrative Unit
BBMP Bruhat Bengaluru Mahanagara Palika
BDA Bangalore Development Authority
FGD Focus Group Discussion
FI Financial Institution
GAMA Greater Accra Metropolitan Area
GDP Gross Domestic Product
ha Hectare
IT Information Technology
IWMI International Water Management Institute
JNNURM Jawaharlal Nehru Urban Renewal Mission
LC Lurigancho-Chosica
MOFA Ministry of Food and Agriculture (Accra)
RUAF RUAF Foundation: International Network of Resource Centres on Urban Agriculture and Food Security
VMT Villa María del Triunfo
WHO World Health Organization
1 UrBAN AGrICULTUre: FINdINGS FroM FoUr CITY CASe STUdIeS
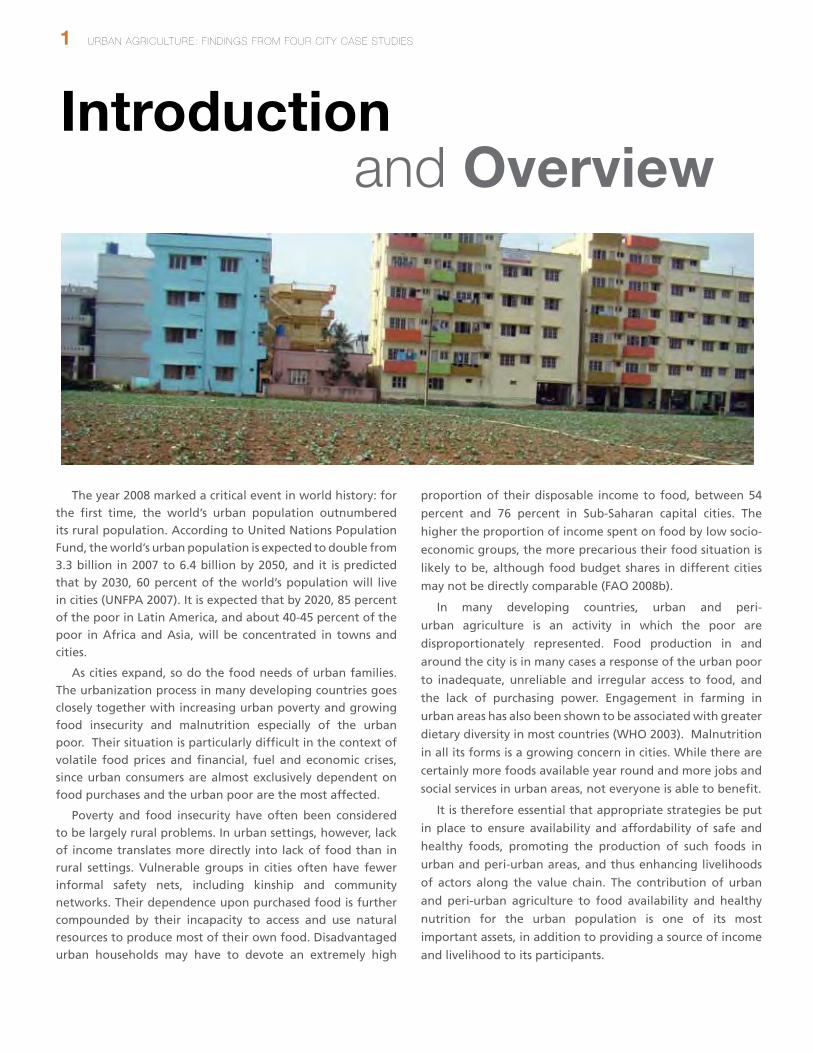
The year 2008 marked a critical event in world history: for the first time, the world’s urban population outnumbered its rural population. According to United Nations Population Fund, the world’s urban population is expected to double from 3.3 billion in 2007 to 6.4 billion by 2050, and it is predicted that by 2030, 60 percent of the world’s population will live in cities (UNFPA 2007). It is expected that by 2020, 85 percent of the poor in Latin America, and about 40-45 percent of the poor in Africa and Asia, will be concentrated in towns and cities.
As cities expand, so do the food needs of urban families. The urbanization process in many developing countries goes closely together with increasing urban poverty and growing food insecurity and malnutrition especially of the urban poor. Their situation is particularly difficult in the context of volatile food prices and financial, fuel and economic crises, since urban consumers are almost exclusively dependent on food purchases and the urban poor are the most affected.
Poverty and food insecurity have often been considered to be largely rural problems. In urban settings, however, lack of income translates more directly into lack of food than in rural settings. Vulnerable groups in cities often have fewer informal safety nets, including kinship and community networks. Their dependence upon purchased food is further compounded by their incapacity to access and use natural resources to produce most of their own food. Disadvantaged urban households may have to devote an extremely high
proportion of their disposable income to food, between 54
percent and 76 percent in Sub-Saharan capital cities. The
higher the proportion of income spent on food by low socio-
economic groups, the more precarious their food situation is
likely to be, although food budget shares in different cities
may not be directly comparable (FAO 2008b).
In many developing countries, urban and peri-
urban agriculture is an activity in which the poor are
disproportionately represented. Food production in and
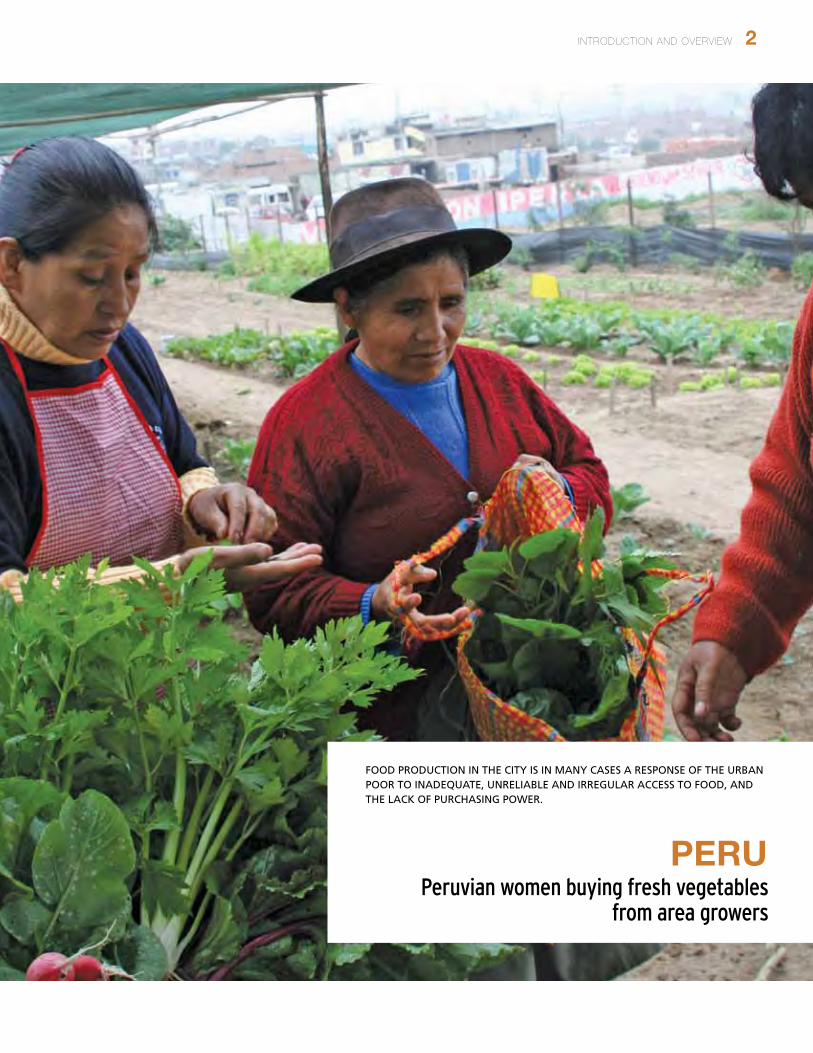
around the city is in many cases a response of the urban poor
to inadequate, unreliable and irregular access to food, and
the lack of purchasing power. Engagement in farming in
urban areas has also been shown to be associated with greater
dietary diversity in most countries (WHO 2003). Malnutrition
in all its forms is a growing concern in cities. While there are
certainly more foods available year round and more jobs and
social services in urban areas, not everyone is able to benefit.
It is therefore essential that appropriate strategies be put
in place to ensure availability and affordability of safe and
healthy foods, promoting the production of such foods in
urban and peri-urban areas, and thus enhancing livelihoods
of actors along the value chain. The contribution of urban
and peri-urban agriculture to food availability and healthy
nutrition for the urban population is one of its most
important assets, in addition to providing a source of income
and livelihood to its participants.
Introduction and Overview
INTrodUCTIoN ANd oVerVIew 2
Peruvian women buying fresh vegetables from area growers
PErU
FOOD PRODUCTION IN THE CITY IS IN MANY CASES A RESPONSE OF THE URBAN POOR TO INADEqUATE, UNRELIABLE AND IRREGULAR ACCESS TO FOOD, AND THE LACK OF PURCHASING POWER.
3 UrBAN AGrICULTUre: FINdINGS FroM FoUr CITY CASe STUdIeS
1.1 The Approach and Structure of this Report
This report seeks to examine the contribution of urban agriculture to livelihoods, food security, health, and the urban environment, through an assessment of existing urban agriculture activities among poor households in four selected cities: Accra (Ghana), Bangalore (India), Lima (Peru), and Nairobi (Kenya). In so doing, it aims to provide some practical, evidence-based information that city-level decision-makers use in considering how urban agriculture can be part of the policies, plans and programs for sustainable development in their city -—particularly for developing country cities with low-income populations. Other readers interested in urban development or agriculture more broadly would also likely find this information useful.
The hypothesis underpinning this work is that urban agriculture can contribute to sustainable urban development and urban poverty reduction, by functioning as a source of livelihoods and income, and by increasing the availability of and access to food in cities. This report also has the perspective that urban agriculture offers a range of co-benefits for the local and global environment, including for natural resource management and climate change mitigation. At the same time, it is recognized that the development and expansion of urban agriculture is constrained by a range of issues, and that addressing these challenges would contribute towards the achievement of overall development goals.
This report is structured according to the basic framework mentioned above. The rest of this chapter provides a definition and examples of urban agriculture, summarizes some of the sustainable development challenges that cities face, and provides an overview of the role of urban agriculture in contributing to poverty reduction, food security, and environmental sustainability. Chapter 2 then summarizes the key findings from the four city case studies, analyzing the profiles of urban agriculture in each city, including the agricultural practices pursued, access to and use of urban land, as well as examining the available data for evidence of the importance of urban agriculture for livelihoods and food security. Chapter 2 also discusses the main findings from the case studies on the constraints facing urban agriculture. Chapter 3 then provides various recommendations for strengthening urban agriculture and addressing these constraints, recognizing that these need to be considered in light of the broader urban development agenda and the many competing priorities that cities face. The annexes to this report describe the methodology used for the city case studies, and provide detailed information on each city, including a general city profile, the urban agricultural practices in each city, the inputs used and outputs produced, and the income,
expenditure, dwelling and food consumption profiles of residents.
1.2 What is Urban Agriculture?
Urban and peri-urban agriculture—collectively referred to in this report as ‘urban agriculture’—is an industry located within (‘intra-urban’) or on the fringe (‘peri-urban’) of a town, a city, or a metropolis, that grows and raises, processes and distributes a diversity of agricultural products from both plants and animals, using human, land and water resources, products, and services found in and around that urban area. Urban agriculture can be practiced in gardens, rooftops, empty public land, cellars or field plots by urban residents from various backgrounds. The orientation and scale of such activities may vary from subsistence-oriented cultivation, to more recreational types of agriculture at the micro scale, through small-scale semi-commercial gardeners and livestock keepers, to medium and large-scale commercial enterprises. Urban agriculture already provides a substantial contribution to the food for the cities in many countries. Yet, with the rapid growth of the urban population and the low nutritional levels of the urban and peri-urban poor, there is tremendous scope for increasing this source of supply.
Benefits of urban agriculture include:• Non-market access to fresh, nutritious food for poor
consumers, and income generation (especially for women);
• Supply of food to urban markets, street food and food processing, providing additional employment and income;
• Productive reuse of water and urban waste to provide water, animal fees and fertilizers for the demands of urban agriculture;
• Integrating urban agriculture with urban greening programs, which can provide fuelwood for urban residents, reduce urban pollution and temperatures, and offer recreation opportunities to improve quality of life for all urban residents, and in particular for youth and elderly people;
• Providing an opportunity for participation of urban residents to benefit from the implementation of urban agriculture within the broader context of urban greening programs, specifically stimulating the involvement of women as complementary activity;
• If practiced sustainably, urban agriculture clearly aligns itself with the key goals of inclusive green growth, which are clean, resilient, efficient, and inclusive, as
INTrodUCTIoN ANd oVerVIew 4
defined by the World Bank (2012). In this way, urban agriculture can advance the objectives of inclusive green growth and vice-versa; and
• Helping cities become more resilient to climate change by reducing vulnerability of urban residents, particularly the poor, diversifying urban food sources and income opportunities, maintaining green open spaces and enhancing vegetative cover, which has important adaptation (and some mitigation) benefits.
1.3 The Challenges of Sustainable Cities
1 .3 .1 Urban Poverty
The high rate of urbanization in many developing countries, particularly in low-income ones, is taking place at a time when the availability of non-farm jobs is limited. In fact, non-farm productivity in the least developed countries declined 9 percent from 1980-83 to 2000-03 (UNCTAD 2006). As a result, the urbanization process is accompanied by a phenomenon referred to as the “urbanization of poverty”: rural-to-urban migration combined with limited employment opportunities in cities, which leads to a shift in the locus of poverty from rural to urban areas. In addition, the recent global financial crisis and rising food, fuel, and energy prices have affected developing countries, with a disproportionately large effect on the urban poor. FAO data indicate that the number of people with chronic food insecurity has risen to over 100 million people in two years from 2007 to 2009, the majority of whom are urban poor (FAO 2009b).
The urban poor are particularly vulnerable to changes in food prices and variation in income since food makes up a
large proportion of their household expenses (often over 60 percent) and urban consumers are almost exclusively dependent on food purchases. Variations in income or food prices have a significant and direct impact on their diets (lower food intake, turning to cheaper / less nutritious food) and may also lead to reduced expenditures in healthcare and schooling or sale of productive assets (FAO 2008a). It is estimated that the rise in food prices between early 2007 and 2008 increased the number of people living in extreme poverty in urban areas in East Asia, South Asia, the Middle East and Sub-Saharan Africa by at least 1.5 percent (Baker 2008).
1 .3 .2 Food Insecurity and Malnutrition
Increasing urban poverty goes hand-in-hand with growing food insecurity and malnutrition in cities. Urban food insecurity often is overlooked since at the aggregate level, economic and social conditions in urban areas are much better than those in rural areas. (Satterthwaite and others 2010) But aggregate figures do not account for inequality within the urban population that is generally much greater than within the rural areas (World Bank 2000). Unlike in rural areas, food insecurity problems in urban areas are strongly related to inadequate purchasing power of the urban poor, which limits their access to food of adequate quantity and nutritious quality.
1 .3 .3 Climate Change Impacts
The challenge posed by climate change and its interaction with urban poverty and food security is globally recognized. UN-HABITAT (2009) states that “Cities are a major part of the cause, suffering the most impacts and therefore play a primary
5 UrBAN AGrICULTUre: FINdINGS FroM FoUr CITY CASe STUdIeS
role in finding the appropriate solution.” According to UN-Habitat, slum areas are anticipated to be the most vulnerable to the effects of climate change, given the paucity of shelter and the absence of public services (UN-HABITAT 2009). In parts of Asia, Africa, and Latin America, it is common for as much as half a city’s population to live in informal settlements, lacking piped water supply, paved roads, sewers, storm drains, and household waste collection. Many such settlements are often located in marginal areas that are not suited for construction and are vulnerable to natural disasters, such as on steep and unstable slopes (landslides after prolonged rain fall) and low-lying areas like reclaimed swamp areas and river beds (flooding), leaving their inhabitants at greatest risk from storms and floods.
Climate change is expected to put 49 million additional people at risk of hunger by 2020, and 132 million by 2050 (IFAD n.d.). City economies will suffer as agricultural production in the surrounding rural areas is impacted by storms, floods, or constraints on water availability. The decline in agricultural productivity will thus not only affect the rural population but also affect the urban poor. Maxwell and others (2009) state: “Urban and peri-urban areas are similarly impacted, as natural causes can lead to increased (temporarily or sustained) higher food prices, food shortages, epidemics, and sudden settlement of those displaced by the shock. To make matters worse, natural causes of food crises are often cyclical, repeatedly affecting the same regions or agro-climatic zones.” Box 1.1 describes several examples of how cities around the
world are recognizing the role of urban agriculture in their responses to climate change.
1 .3 .4 Natural Resource Scarcity and Waste Disposal
In most cities, land is a scarce—and thus valuable—resource. Cities concentrate people, assets and economic activity; it is this density that contributes to the vibrancy of cities, offering opportunities for greater efficiency and for responding to challenges such as climate change (Glaeser 2011, Hoornweg and others 2011). Urban planning thus has a fundamental role to play in fostering sustainable and livable cities, including through making choices on the optimal use of land within a city. However in many cities, particularly in developing countries, urban planning and related policies are weakly designed, or else poorly implemented—exacerbating the challenges of rapid population and economic growth in cities. In this context, urban agricultural activities are often ignored or not well integrated into planning processes and policies, with little attention paid to the benefits and tradeoffs of urban agriculture.
The urban demand for fresh water is quickly rising due to population growth as well as increasing supply, coverage and overall urban economic growth, while the availability of fresh water is becoming a serious problem. There is growing competition among industrial, energy, and domestic uses of water and the agricultural use of water, which is exacerbated by water scarcity in arid countries. When faced with water scarcity, central and local governments often tend to restrict
Box 1 .1: Urban agriculture in city climate change strategies
Across the world, cities in both developing and developed countries are including urban agriculture and forestry in their climate change strategies and action plans.
• InSierraLeone,Freetownhaszonedallwetlandsandlow-lyingvalleysforurbanagriculturetoincreasewaterinfiltration,reduce flooding, keep the flood-zones free from (illegal) construction and promote urban agriculture production for food supply and job creation;
• InCanada,Toronto’sclimatechangeplanincludesfinancialsupporttocommunitybasedurbanagricultureprojects,e.g.,community orchards and gardens, home gardens; promotion of composting of organic wastes and rainwater harvesting; reduction of the city’s “Food print” by requiring shipping distance on food labels, promotion of regional products, supporting farmers’ markets and preferential procurement of food;
• InSouthAfrica,Durbanispromotingproductivegreenroofsforstormwatermanagement,biodiversity,andfoodproduction,is testing possible replacement crops for maize to adapt to lower rainfall and is promoting community reforestation and management;
• MakatiCityinthePhilippinespromotestreeplantinginopenareas,roadmedians,androadsidestoreduceairpollution,forcity beautification, prevention of landslides and carbon dioxide sequestration; and
agricultural water use in favor of urban industrial, energy and domestic uses, with important negative consequences for food production. At the same time, water demand for food production is increasing due to growing populations and changes in food consumption patterns that go along with urbanization. Shifts toward richer and more varied diets such as from tubers to rice and from cereals to livestock, fish, and high-value crops all require more water for production (UN-Water and FAO 2007).
Contamination of groundwater and pollution of freshwater resources have important negative effects on public health and urban ecology. Water treatment capacity in most cities in developing countries is limited and existing treatment is often ineffective. Moreover, the quantity of solid organic wastes generated in cities is increasing dramatically. In many cities, solid waste collection is often restricted to the central district and the wealthy neighborhoods and much of the organic wastes is left to rot in the streets or dumped along riverbanks or on open land near the city limits, leading to contamination of soils and water. These and other urban environmental problems are discussed in detail in various literature, such as McGranahan and Satterthwaite (2002), Satterthwaite and Mitlin (2011), Stephens (1995), and Hoornweg and others (2010).
1.4 The Role of Urban Agriculture
1 .4 .1 Livelihoods and Employment for the Urban Poor
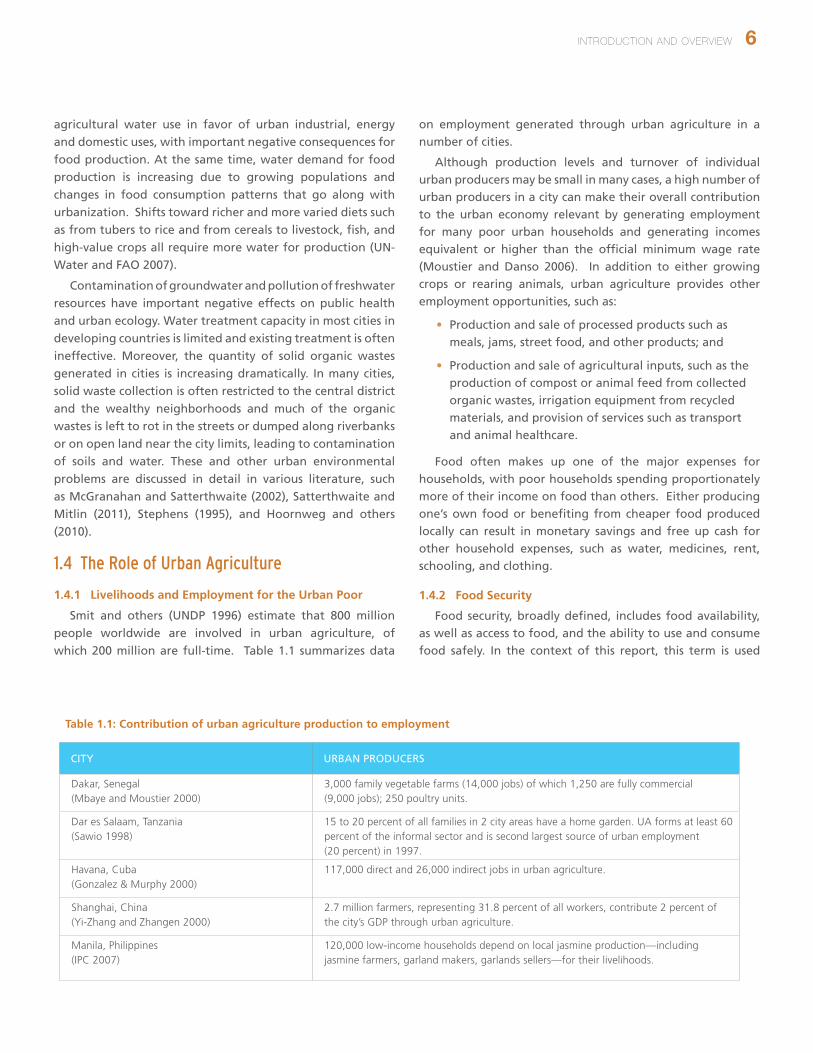
Smit and others (UNDP 1996) estimate that 800 million people worldwide are involved in urban agriculture, of which 200 million are full-time. Table 1.1 summarizes data
on employment generated through urban agriculture in a number of cities.
Although production levels and turnover of individual urban producers may be small in many cases, a high number of urban producers in a city can make their overall contribution to the urban economy relevant by generating employment for many poor urban households and generating incomes equivalent or higher than the official minimum wage rate (Moustier and Danso 2006). In addition to either growing crops or rearing animals, urban agriculture provides other employment opportunities, such as:
• Production and sale of processed products such as meals, jams, street food, and other products; and
• Production and sale of agricultural inputs, such as the production of compost or animal feed from collected organic wastes, irrigation equipment from recycled materials, and provision of services such as transport and animal healthcare.
Food often makes up one of the major expenses for households, with poor households spending proportionately more of their income on food than others. Either producing one’s own food or benefiting from cheaper food produced locally can result in monetary savings and free up cash for other household expenses, such as water, medicines, rent, schooling, and clothing.
1 .4 .2 Food Security
Food security, broadly defined, includes food availability, as well as access to food, and the ability to use and consume food safely. In the context of this report, this term is used
Table 1 .1: Contribution of urban agriculture production to employment
CITY URBAN PRODUCERS
Dakar, Senegal (Mbaye and Moustier 2000)
3,000 family vegetable farms (14,000 jobs) of which 1,250 are fully commercial (9,000 jobs); 250 poultry units.
Dar es Salaam, Tanzania(Sawio 1998)
15 to 20 percent of all families in 2 city areas have a home garden. UA forms at least 60 percent of the informal sector and is second largest source of urban employment (20 percent) in 1997.
Havana, Cuba (Gonzalez & Murphy 2000)
117,000 direct and 26,000 indirect jobs in urban agriculture.
Shanghai, China (Yi-Zhang and Zhangen 2000)
2.7 million farmers, representing 31.8 percent of all workers, contribute 2 percent of the city’s GDP through urban agriculture.
Manila, Philippines (IPC 2007)
120,000 low-income households depend on local jasmine production—including jasmine farmers, garland makers, garlands sellers—for their livelihoods.
7 UrBAN AGrICULTUre: FINdINGS FroM FoUr CITY CASe STUdIeS
primarily to refer to availability and access. The contribution of urban agriculture to food security and nutrition in cities and/or of urban farming households has been the subject of many articles and research papers. Often, the literature differentiates between production for the market or for home-consumption (Cole, Lee-Smith and Nasinyama 2008; De Zeeuw and Dubbeling 2009; Mougeot 2006; Redwood 2009; Van Veenhuizen, 2006). Many such reviews seem to indicate that the direct food security purpose prevails, but that a substantial number of urban farmers also produce for the market, and more so in Asia and Latin America than in Africa (Zezza and Tasciotti 2010).
Self-production of food by poor urban households can represent 20 to 60 percent of their total food consumption, and is generally fresher, more nutritious, and diverse than food bought in shops, markets or street restaurants. This is particularly important for young children, elderly, or sick household members, particularly in poor households. Urban households that are involved in some sort of farming or gardening generally have a better and more diverse diet and eat more vegetables than non-farming households of the same wealth class. These households are in most cases more food secure than households not practising urban agriculture (Purnomohadi 2000, Foeken 2006, Yeudall and others 2007, Zezza and Tasciotti 2008, Motunodzo 2009).
Urban agriculture not only benefits self-producing households, but can also increase the availability of fresh, healthy, and affordable food for a large number of urban consumers, when the food produced by urban farmers is bartered or sold locally. It is estimated that 15 to 20 percent of the world’s food is produced in urban areas (Armar-Klemesu 2000). The volume of crops and animal products produced in urban and peri-urban agriculture often represents a substantial part of urban annual food requirements, as much as 8 percent in Nakuru, Kenya (Foeken 2006), 10 percent in Dakar, Senegal (Mbaye and Moustier 2000), and 44 percent in Hanoi, Vietnam (Mubarik and others 2005).
Urban agriculture also improves access of the urban poor to fresh and nutritious food by reducing the costs of food, since locally-produced food involves fewer intermediaries and less transport, cold storage, processing, and packaging. As a consequence, the price differential between producer and final consumer, which may be as high as 1:10 in rural agriculture, is lowered to 1:2 or 1:3 in urban agriculture (Moustier and Danso 2006).
1 .4 .3 Environmental Co-benefits and Responding to the Challenges of Climate Change
Urban agriculture is increasingly mentioned for the role it might play in disaster management in urban areas and the actions of cities to mitigate the effects of climate change through climate compatible city development (Mitchell and Maxwell 2010). More broadly, urban agriculture contributes to environmental sustainability by offering a range of potential co-benefits for the local environment, including through the re-use of wastewater and organic waste. In this vein, urban agriculture itself can be made more sustainable and ecological—rather than using fresh water or artificial fertilizers as inputs, sustainable urban agricultural practices can emphasize the re-use and recycling of waste water and organic waste.
Urban and indoor farming can be a response to climate change and a way to build more resilient cities (WMO 2007). A review of broader literature (Dubbeling and de Zeeuw 2011; Acharya, Hoornweg and Dubbeling 2011) indicates that urban agriculture is credited with multiple climate-related benefits. This can be understood in two main ways:
a. Reducing the vulnerability of urban residents and strengthening community-based adaptation management:
• Diversifying urban food sources, enhancing access of the urban poor to nutritious food, reducing the dependency on imported foods and making the city less vulnerable for periods of low food supply from rural areas due to floods, droughts or other natural or human made disasters; and
• Diversifying income opportunities of the urban poor and functioning as a safety net in times of economic crisis.
b. Maintaining green open spaces and enhancing vegetation cover in the city with important adaptation (and some mitigation) benefits, such as:
• Reduction in the urban heat island effect by providing shade and enhanced evapotranspiration, and thus more cooling and less smog;
• Less flooding and reduced impacts of high rainfall by increasing water storage, interception and infiltration in green open spaces; urban agriculture keeps flood-prone zones free from construction; reduces rapid stormwater runoff; and replenishes ground water;
INTrodUCTIoN ANd oVerVIew 8
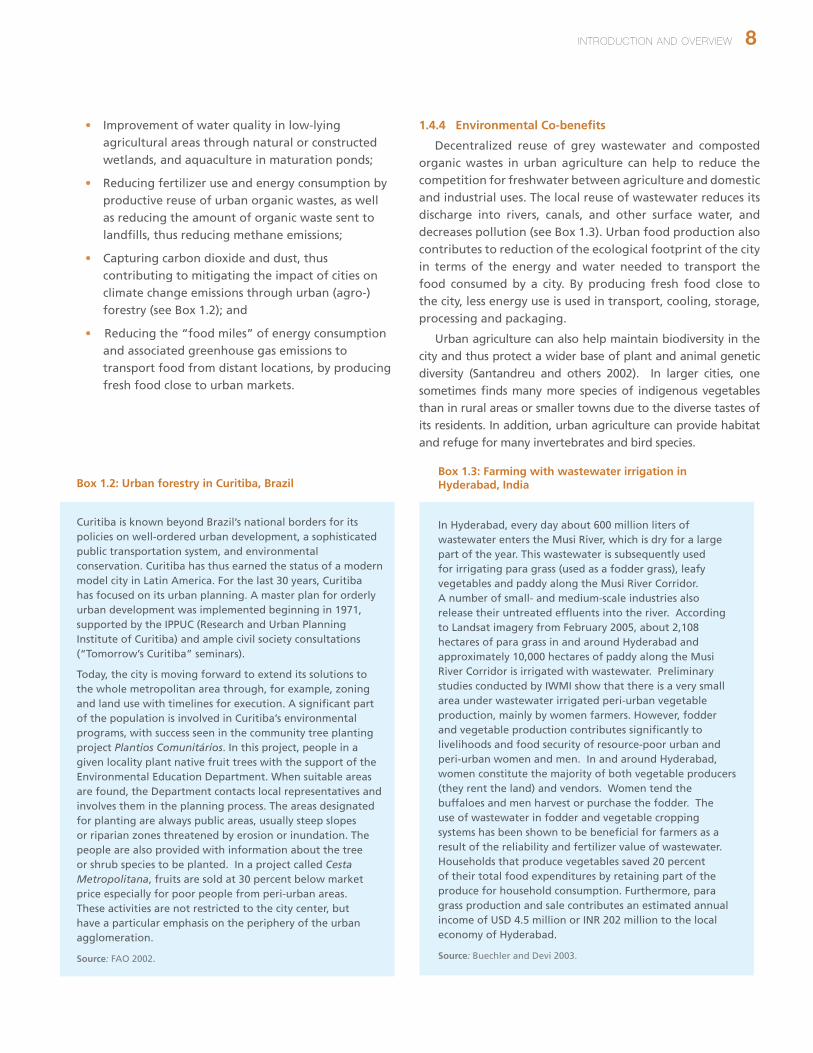
Box 1 .2: Urban forestry in Curitiba, Brazil
Curitiba is known beyond Brazil’s national borders for its policies on well-ordered urban development, a sophisticated public transportation system, and environmental conservation. Curitiba has thus earned the status of a modern model city in Latin America. For the last 30 years, Curitiba has focused on its urban planning. A master plan for orderly urban development was implemented beginning in 1971, supported by the IPPUC (Research and Urban Planning Institute of Curitiba) and ample civil society consultations (“Tomorrow’s Curitiba” seminars).
Today, the city is moving forward to extend its solutions to the whole metropolitan area through, for example, zoning and land use with timelines for execution. A significant part of the population is involved in Curitiba’s environmental programs, with success seen in the community tree planting project Plantios Comunitários. In this project, people in a given locality plant native fruit trees with the support of the Environmental Education Department. When suitable areas are found, the Department contacts local representatives and involves them in the planning process. The areas designated for planting are always public areas, usually steep slopes or riparian zones threatened by erosion or inundation. The people are also provided with information about the tree or shrub species to be planted. In a project called Cesta Metropolitana, fruits are sold at 30 percent below market price especially for poor people from peri-urban areas. These activities are not restricted to the city center, but have a particular emphasis on the periphery of the urban agglomeration.
Source: FAO 2002.
• Improvement of water quality in low-lying agricultural areas through natural or constructed wetlands, and aquaculture in maturation ponds;
• Reducing fertilizer use and energy consumption by productive reuse of urban organic wastes, as well as reducing the amount of organic waste sent to landfills, thus reducing methane emissions;
• Capturing carbon dioxide and dust, thus contributing to mitigating the impact of cities on climate change emissions through urban (agro-)forestry (see Box 1.2); and
• Reducing the “food miles” of energy consumption and associated greenhouse gas emissions to transport food from distant locations, by producing fresh food close to urban markets.
1 .4 .4 Environmental Co-benefits
Decentralized reuse of grey wastewater and composted organic wastes in urban agriculture can help to reduce the competition for freshwater between agriculture and domestic and industrial uses. The local reuse of wastewater reduces its discharge into rivers, canals, and other surface water, and decreases pollution (see Box 1.3). Urban food production also contributes to reduction of the ecological footprint of the city in terms of the energy and water needed to transport the food consumed by a city. By producing fresh food close to the city, less energy use is used in transport, cooling, storage, processing and packaging.
Urban agriculture can also help maintain biodiversity in the city and thus protect a wider base of plant and animal genetic diversity (Santandreu and others 2002). In larger cities, one sometimes finds many more species of indigenous vegetables than in rural areas or smaller towns due to the diverse tastes of its residents. In addition, urban agriculture can provide habitat and refuge for many invertebrates and bird species.
Box 1 .3: Farming with wastewater irrigation in Hyderabad, India
In Hyderabad, every day about 600 million liters of wastewater enters the Musi River, which is dry for a large part of the year. This wastewater is subsequently used for irrigating para grass (used as a fodder grass), leafy vegetables and paddy along the Musi River Corridor. A number of small- and medium-scale industries also release their untreated effluents into the river. According to Landsat imagery from February 2005, about 2,108 hectares of para grass in and around Hyderabad and approximately 10,000 hectares of paddy along the Musi River Corridor is irrigated with wastewater. Preliminary studies conducted by IWMI show that there is a very small area under wastewater irrigated peri-urban vegetable production, mainly by women farmers. However, fodder and vegetable production contributes significantly to livelihoods and food security of resource-poor urban and peri-urban women and men. In and around Hyderabad, women constitute the majority of both vegetable producers (they rent the land) and vendors. Women tend the buffaloes and men harvest or purchase the fodder. The use of wastewater in fodder and vegetable cropping systems has been shown to be beneficial for farmers as a result of the reliability and fertilizer value of wastewater. Households that produce vegetables saved 20 percent of their total food expenditures by retaining part of the produce for household consumption. Furthermore, para grass production and sale contributes an estimated annual income of USD 4.5 million or INR 202 million to the local economy of Hyderabad.
Source: Buechler and Devi 2003.
9 UrBAN AGrICULTUre: FINdINGS FroM FoUr CITY CASe STUdIeS
ReferencesAcharya, A., D. Hoornweg and M. Dubbeling. 2011. “Urban Agriculture is Climate-Smart: Thinking Outside the Box on Climate
Change.” In Chapter 7.2 Low Carbon Cities. World Bank publication for the Government of China. Washington, DC: World Bank.
Armar-Klemesu, M. and D. Maxwell. 2000. “Urban Agriculture as an Assist Strategy, Supplementing Income and Diets. A Case Study of Accra.” In Growing Cities, Growing Food: Urban Agriculture on the Policy Agenda, ed. Bakker, N., M. Dubbeling, S.Guendel, U. Sabel Koschella, H. de Zeeuw, 183-205. Feldafing: Deutsche Stiftung für internationale Entwicklung (DSE).
Baker, J. 2008. “Impacts of Financial, Food and Fuel Crisis on the Urban Poor.” Directions in Urban Development, Urban Development Unit. Washington, DC: World Bank.
Buechler, S. and G. Devi. 2003. Farmer Innovations Among Groundwater Users in Wastewater Irrigated Areas Near Hyderabad, India. Proceedings of the 8th International Conference on Water Conservation and Reuse of Wastewater. India Water Works Association.
Cole, D., D. Lee-Smith and G. Nasinyama, eds. 2008. “Healthy City Harvests: Generating Evidence to Guide Policy on Urban Agriculture.” CIP/Urban Harvest and Makerere University Press. Lima, Peru.
De Zeeuw, H. and M. Dubbeling. 2009. “Cities, Food and Agriculture: Challenges and the Way Forward.” RUAF Working Paper 3. Leusden, The Netherlands: RUAF Foundation. http://www.ruaf.org/sites/default/files/Working%20paper%203%20%20Cities%20Food%20and%20Agriculture.pdf
Dubbeling, M. and H. De Zeeuw. 2011. “Urban Agriculture, Advances, Opportunities and Application.” In International Handbook of Urban Policy, ed. Geyer H.S, vol. 3: Issues in the Developing World. UK: Edward Elgar Publishing Ltd.
FAO (Food and Agriculture Organization). 2002. “Expert Consultation on Enhancing the Contribution of Trees Outside Forests to Sustainable Livelihoods.” Rome, November 26-28, 2001. Proceedings. Rome: FAO.
____. 2008a. “State of Food Insecurity in the World 2008: High Food Prices and Food Security – Threats and Opportunities.” Rome: FAO.
____. 2008b. “Urbanization and Food Security in Sub Saharan Africa.” Information paper for the FAO 25th African Regional Conference. ftp://ftp.fao.org/docrep/fao/meeting/012/k1915e.pdf
____. 2009b. “Follow-up to the High-level Conference on World Food Security: FAO Contribution to the Implementation of the Comprehensive Framework for Action.” Document for FAO Council 136th Session, June 15-19. Rome: FAO.
Foeken, D. 2006. “To Subsidise My Income: Urban Farming in an East African Town.” Brill, Leiden.
Glaeser, E. 2011. Triumph of the City: How Our Greatest Invention Makes Us Richer, Smarter, Greener, Healthier, and Happier. Penguin Press.
Gonzalez Novo, M. and C. Murphy. 2000. “Urban agriculture in the City of Havana: a Popular Response to a Crisis.” In Growing Cities, Growing Food: Urban Agriculture on the Policy Agenda, ed. Bakker, N., M. Dubbeling, S.Guendel, U. Sabel Koschella, H. de Zeeuw, 329-347. Feldafing: Deutsche Stiftung für internationale Entwicklung (DSE).
Hoornweg, D., L. Sugar, M. Freire, C. Anderson, P. Bhada, C. Trejos, R. Dave and M. Lee. 2010. Cities and Climate Change: An Urgent Agenda. Urban and Local Government Development Unit. Washington, DC: World Bank.
IFAD (International Fund for Agricultural Development). “Climate Change: Building the Resilience of Poor Rural Communities.” IFAD. http://www.ifad.org/climate/factsheet/e.pdf
IPC (International Potato Center). 2007. “Impacts of urban agriculture. Highlights of Urban Harvest Research and Development 2003-2006.” Lima, Peru.
Maxwell, D., P. Webb, J. Coates, and J. Wirth. 2009. “Rethinking Food Security in Humanitarian Response.” Paper presented to the Rethinking Food Security in Humanitarian Response International Forum. Rome, April 16–18.
Mbaye, A. and P. Moustier. 2000. “Market-oriented Urban Agricultural Production in Dakar.” In Growing Cities, Growing Food: Urban Agriculture on the Policy Agenda, ed. Bakker, N., M. Dubbeling, S.Guendel, U. Sabel Koschella, H. de Zeeuw, 235-256. Feldafing: Deutsche Stiftung für internationale Entwicklung (DSE).
McGranahan, G. and D. Satterthwaite. 2002. “The Environmental Dimensions of Sustainable Development for Cities.” Geography. Vol. 87. No. 3. pp. 213-226.
Mitchell, T. and S. Maxwell. 2010. “Defining Climate Compatible Development.” Policy Brief Climate and Development Knowledge Network, London.
Mougeot, L. 2006. “Growing Better Cities: Urban Agriculture for Sustainable Development.” In-Focus collection. Ottawa, Canada: IDRC.
Moustier, P. and G. Danso. 2006. “Local Economic Development and Marketing of Urban Produced Food.” In Cities Farming for the Future: Urban Agriculture for Green and Productive Cities, ed. Veenhuizen, R van. RUAF Foundation/IDRC/IIRR, Leusden/Los Banos.
INTrodUCTIoN ANd oVerVIew 10
Mubarik, A., H. de Bon, and P. Moustier. 2005. “Promoting the Multifunctionality of Urban and Peri-urban Agriculture in Hanoi.” Urban Agriculture Magazine 15. Leusden, The Netherlands: RUAF Foundation.
Mutonodzo, C. 2009. “The Social and Economic Implications Urban Agriculture on Food Security in Harare. Zimbabwe.” In Agriculture in urban planning, Generating livelihoods and food security, ed. M. Redwood. Earthscan.
Purnomohadi, N. 2000. “Jakarta: Urban agriculture as an alternative strategy to face the economic crisis.” In Growing Cities, Growing Food: Urban Agriculture on the Policy Agenda, ed. N. Bakker M. Dubbeling, S.Guendel, U. Sabel Koschella, H. de Zeeuw, 453-466. Feldafing: Deutsche Stiftung für internationale Entwicklung (DSE).
Redwood, M., ed. 2009. “Agriculture in Urban Planning: Generating Livelihoods and Food Security.” USA: Earthscan and International Development Research Centre.
Santandreu, A, A. Gómez Perazzoli and M. Dubbeling. 2002. “Biodiversity, Poverty and Urban Agriculture, in Latin America.” In Urban Agriculture Magazine 6, Transition to Ecological Urban Agriculture: A Challenge. Leusden, The Netherlands: RUAF Foundation.
Satterthwaite, D., G. McGranahan, and C. Tacoli. 2010. “Urbanization and its implications for food and farming.” Philosophical Transactions B. Vol. 365 No. 1554. Royal Society.
Satterthwaite, D. and D. Mitlin. 2011. “Recognising the potential of cities.” BMJ British Medical Journal 2011. 343:d7979.
Sawio, C. J. 1998. “Urban Agriculture in Dar es Salaam.” Paper presented at the Workshop on Cities Feeding People: Lessons learned from projects in African cities. IDRC. Nairobi, June 21-25, 1998.
Stephens, C. 1995. “The urban environment, poverty and health in developing countries.” Health Policy Plan. 10 (2): 109-121.
UNCTAD (United Nations Conference on Trade and Development). 2002. “The Least Developed Countries Report: Developing Productive Capacity.” http://unctad.org/en/Docs/ldc2006_en.pdf
UNDP (United Nations Development Program). 2006. “Human Development Report 2006: Beyond scarcity: Power, Poverty and the Global Water Crisis.” New York, NY: UNDP. http://hdr.undp.org/en/media/HDR06-complete.pdf
UNESCO (United Nations Educational Scientific and Cultural Organization). 2003. “Water for People, Water for Life.” The United Nations World Water Development Report, France.
UNFPA (United Nations Population Fund). 2007. “State of World Population 2007: Unleashing the Potential of Urban Growth.” http://www.unfpa.org/webdav/site/global/shared/documents/publications/2007/695_filename_sowp2007_eng.pdf
UN-Habitat. 2009. “International Tripartite Conference on Urban Challenges and Poverty Reduction in African, Caribbean and Pacific Countries.” Nairobi, Kenya. June 8-10, 2009.
UN-Water and FAO. 2007. “Coping with Water Scarcity – Challenge of the Twenty-first Century.” World Water Day, 2007. http://www.fao.org/nr/water/docs/escarcity.pdf
Van Veenhuizen, R., ed. 2006. “Cities Farming for the Future, Urban Agriculture for Green and Productive Cities.” RUAF Foundation and IIRR, The Philippines. http://www.ruaf.org/node/961
WHO (World Health Organization). 2003. “Diet, Nutrition and the Prevention of Chronic Diseases.” Report of a Joint WHO/FAO Consultation WHO Technical Report Series 916. Geneva.
World Bank. 2000. “World Development Report 2000/2001: Attacking Poverty.” Washington, DC: World Bank.
Hoornweg, D., M. Freire, M. J. Lee, P. Bhada-Tata, and B. Yuen, eds. 2011. Cities and Climate Change: Responding to an Urgent Agenda. Washington, DC: World Bank.
World Bank. 2012. “Inclusive Green Growth in Latin America & Caribbean.” Washington, DC: World Bank.
WMO (World Meteorogical Organization). 2007. “UN Agency Calls for Urban Agriculture.” WMO press release. December 7, 2007.
Yeudall, F., R. Sebastian, D.C. Cole, S. Ibrahim, A. Lubowa, and and J. Kikafunda. 2007. “Food and Nutritional Security of Children of Urban Farmers in Kampala, Uganda.” Food and Nutrition Bulletin 28 (2 Suppl.): S237-S246.
Yi-Zhang, C. and Z. Zhangen. 2000. “Shanghai: Trends Towards Specialized and Capital-Intensive Urban Agriculture.” In Growing Cities, Growing Food: Urban Agriculture on the Policy Agenda, ed. Bakker, N., M. Dubbeling, S.Guendel, U. Sabel Koschella, H. de Zeeuw, 467-476. Feldafing: Deutsche Stiftung für internationale Entwicklung.
Zezza, A. and L. Tasciotti. 2008. “Does Urban Agriculture Enhance Dietary Diversity? Empirical Evidence from a Sample of Developing Countries.” Rome: FAO.
11 UrBAN AGrICULTUre: FINdINGS FroM FoUr CITY CASe STUdIeS
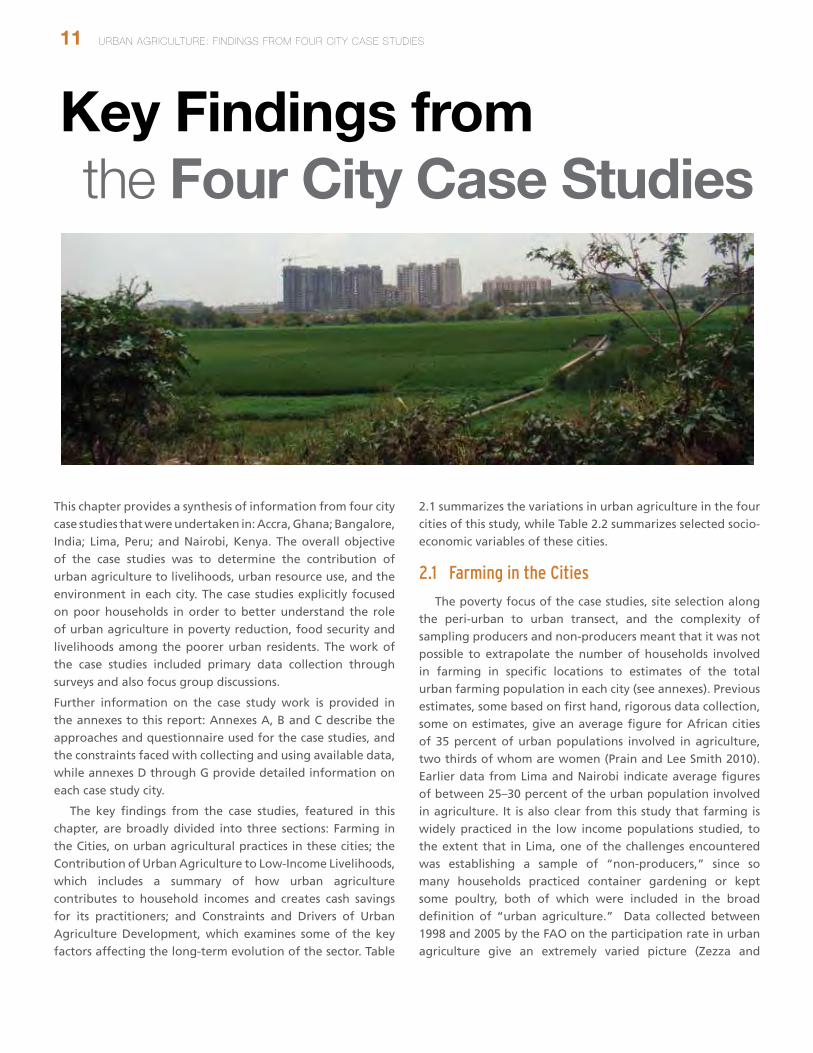
This chapter provides a synthesis of information from four city case studies that were undertaken in: Accra, Ghana; Bangalore, India; Lima, Peru; and Nairobi, Kenya. The overall objective of the case studies was to determine the contribution of urban agriculture to livelihoods, urban resource use, and the environment in each city. The case studies explicitly focused on poor households in order to better understand the role of urban agriculture in poverty reduction, food security and livelihoods among the poorer urban residents. The work of the case studies included primary data collection through surveys and also focus group discussions.
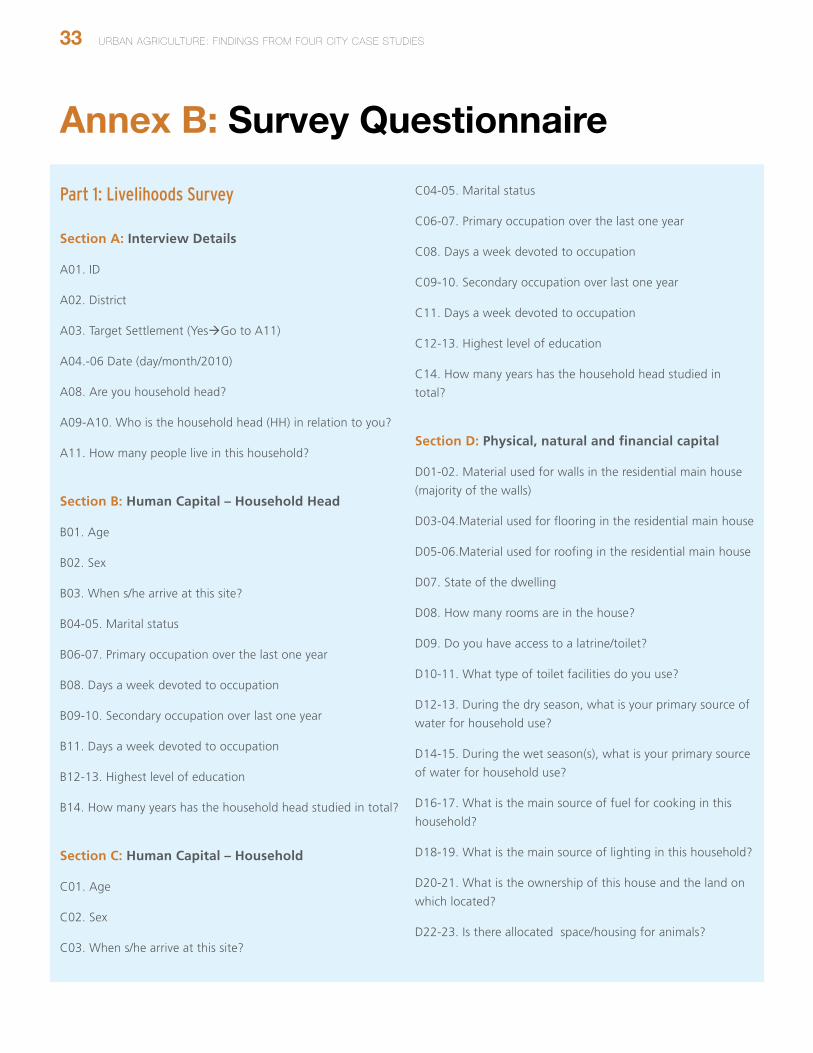
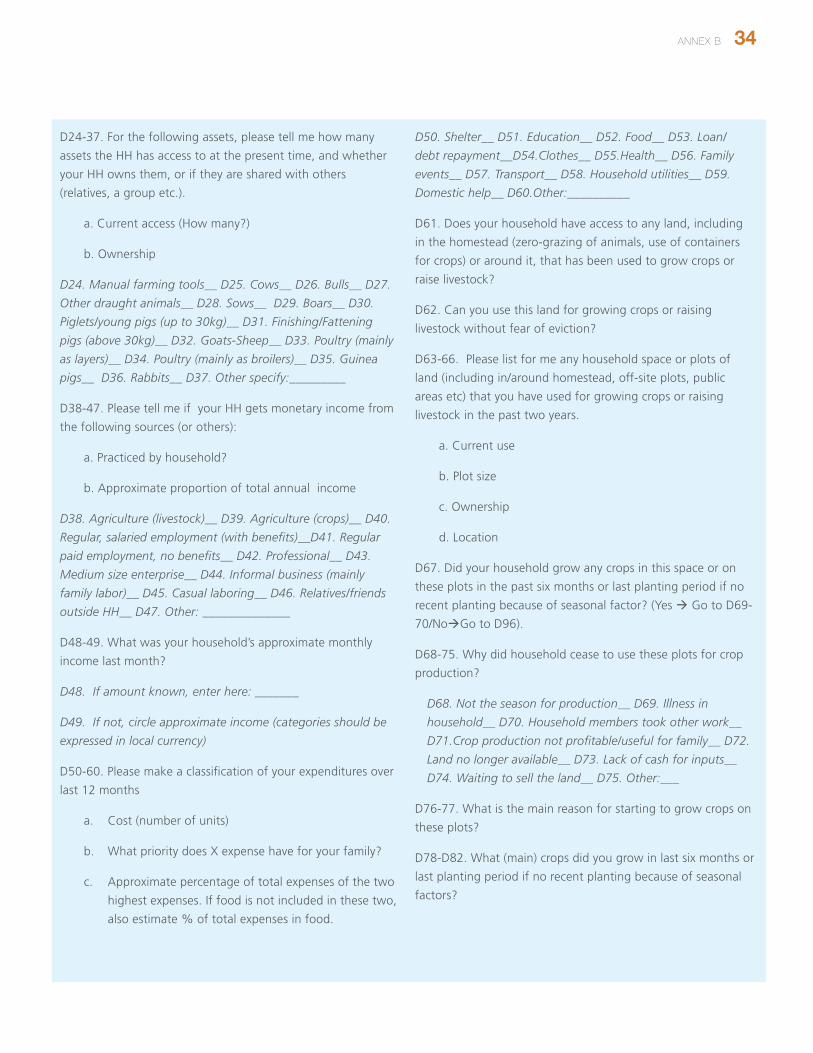
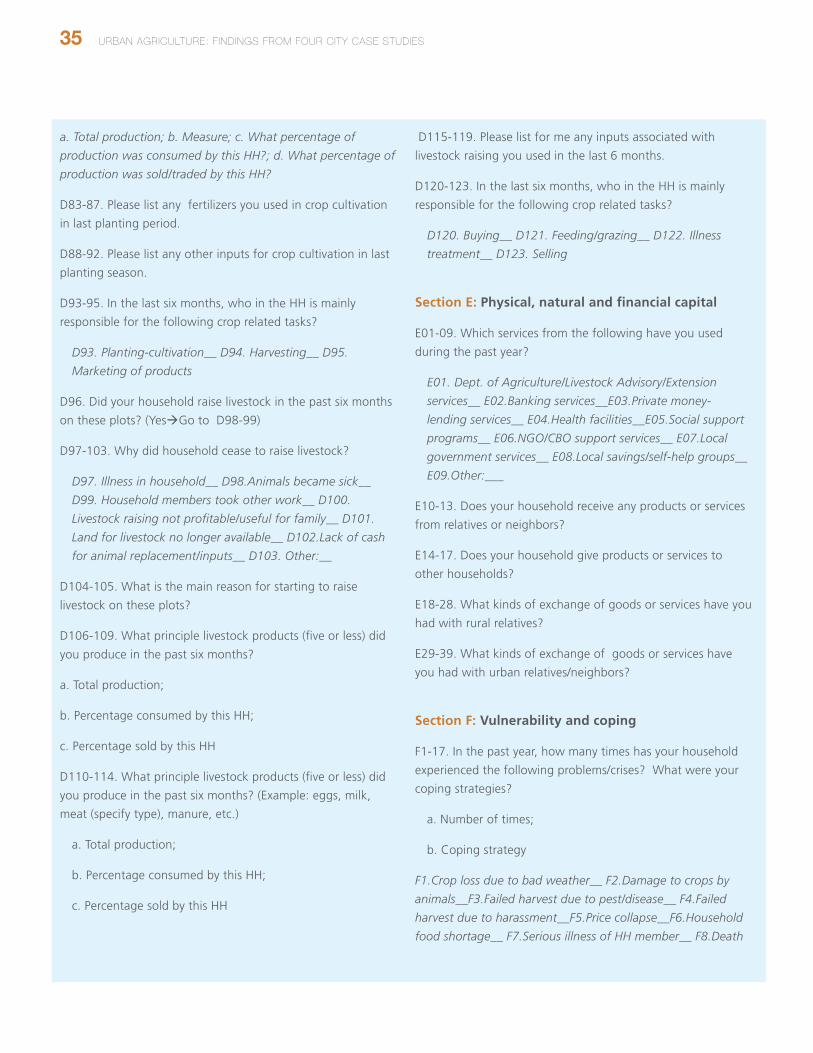
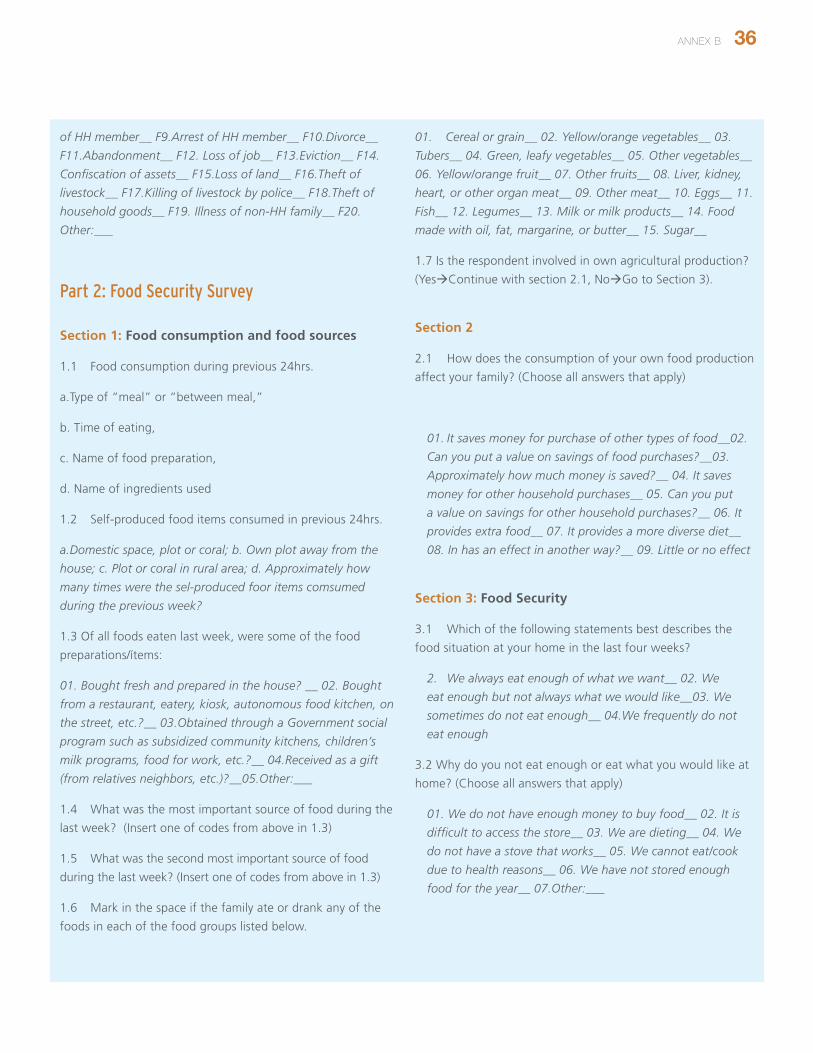
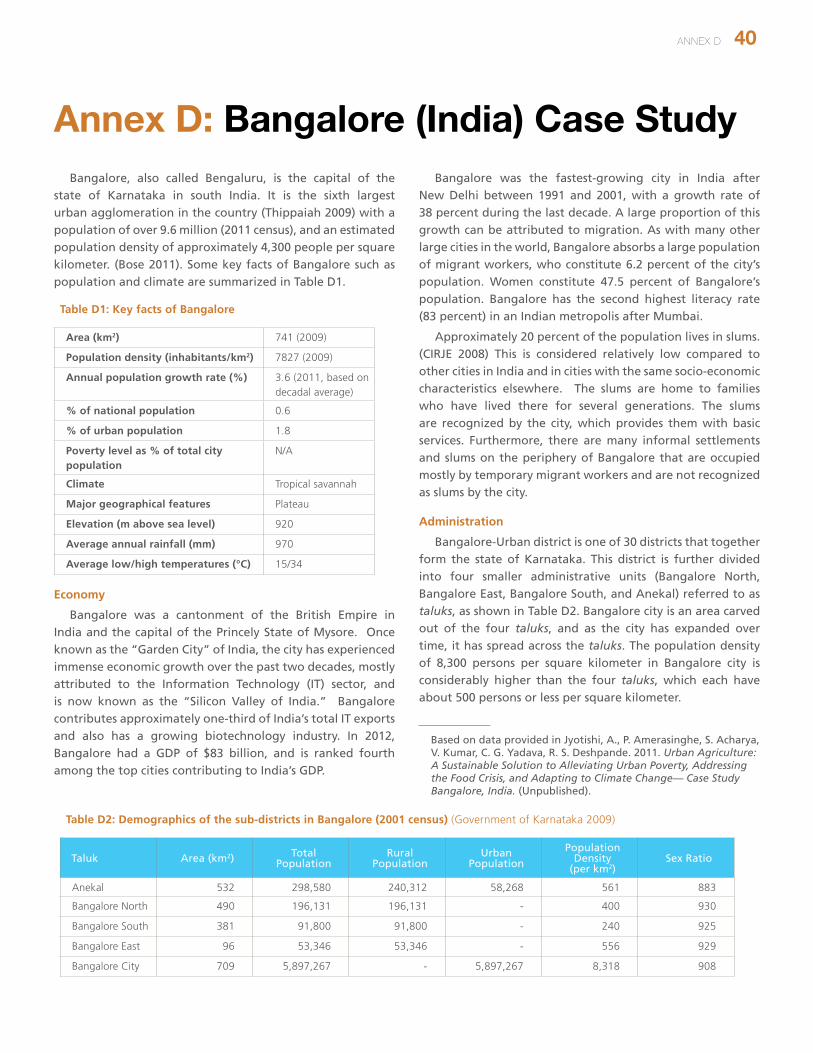
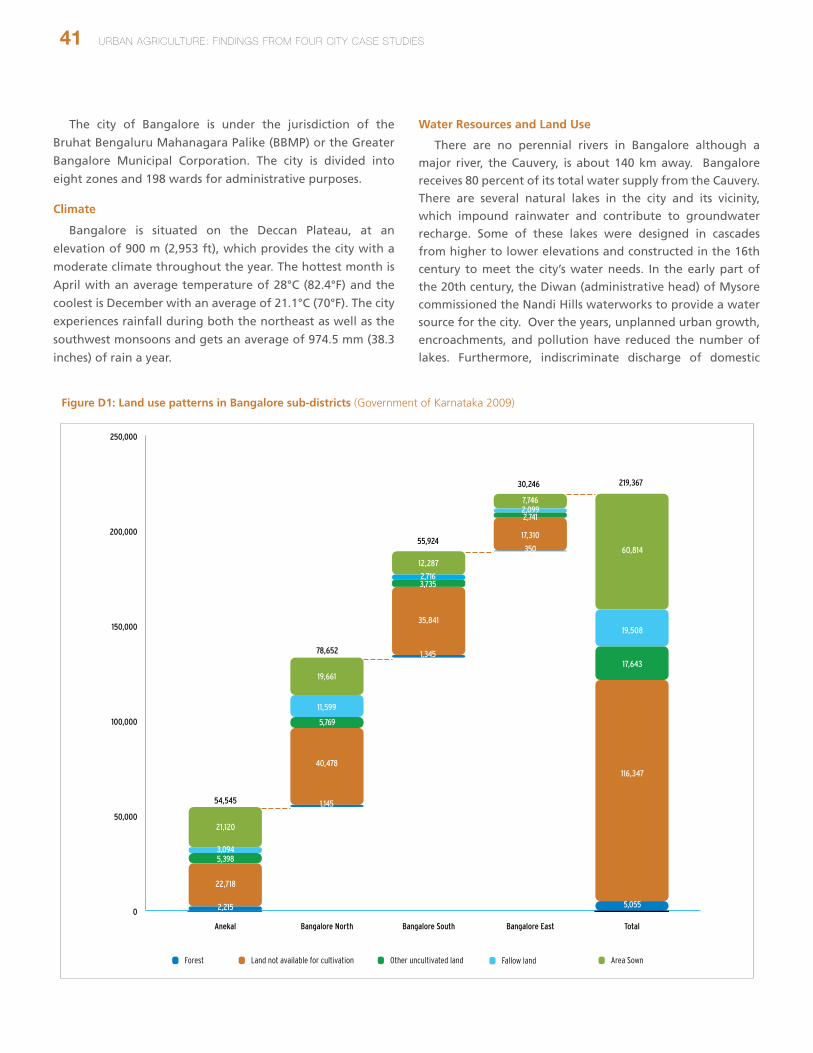
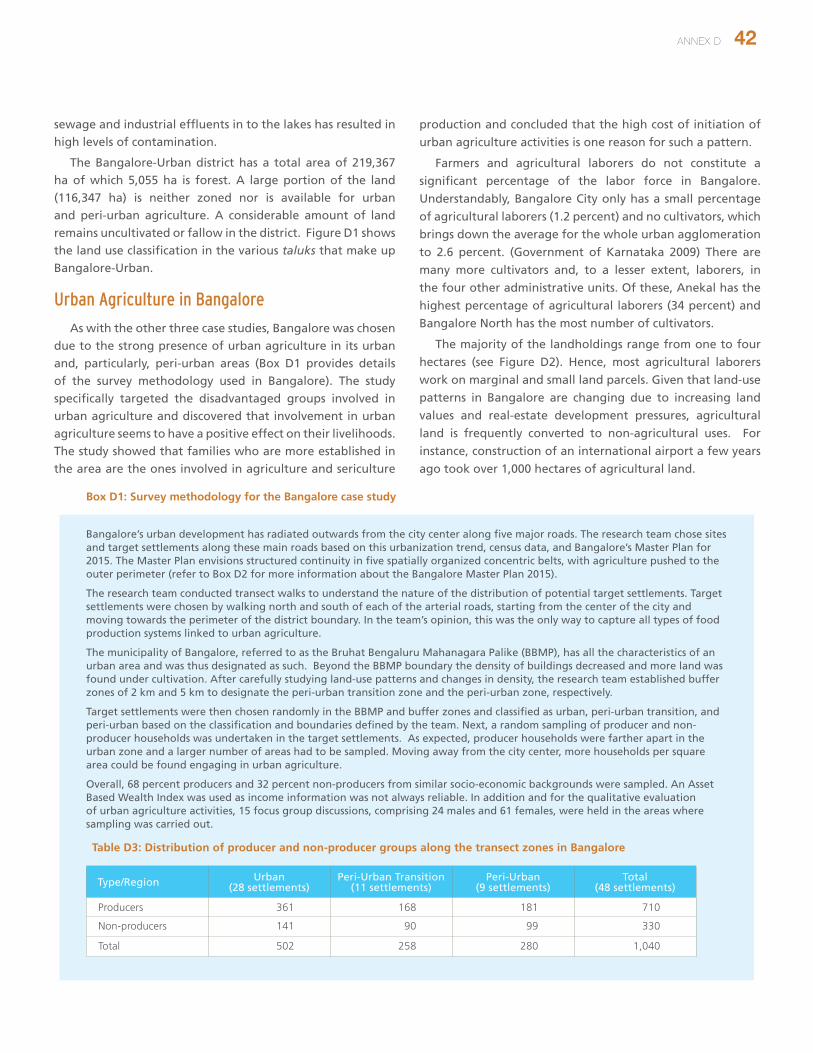
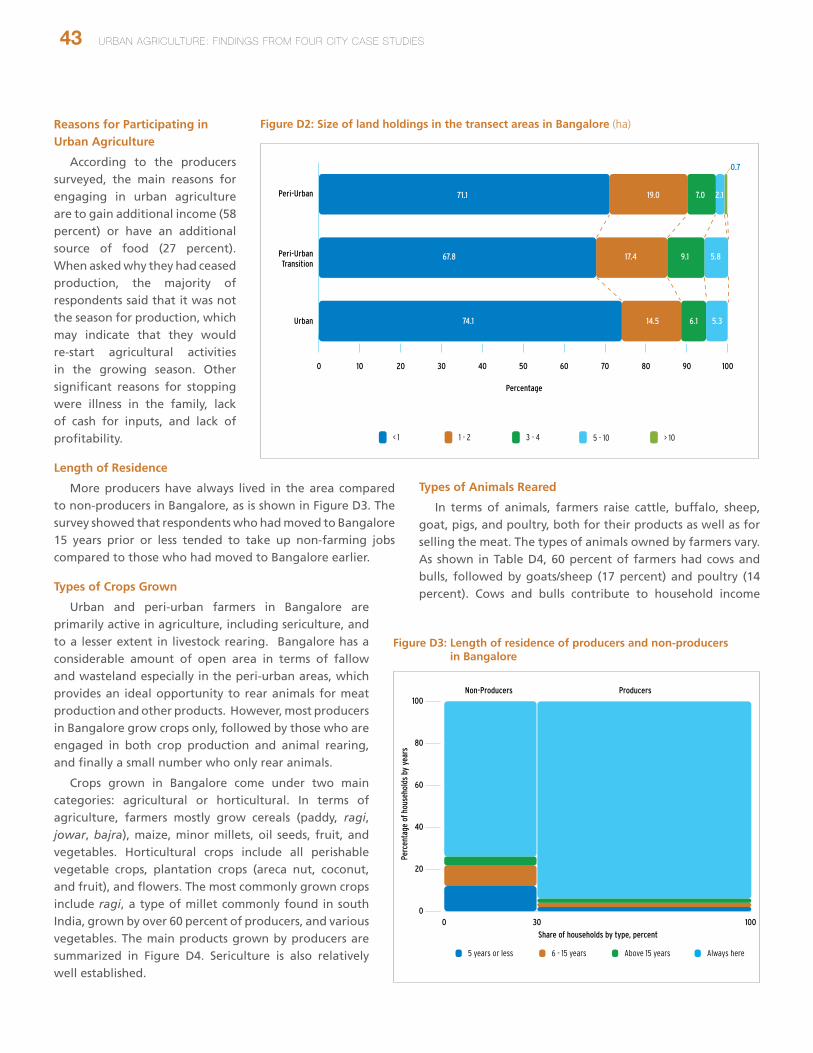
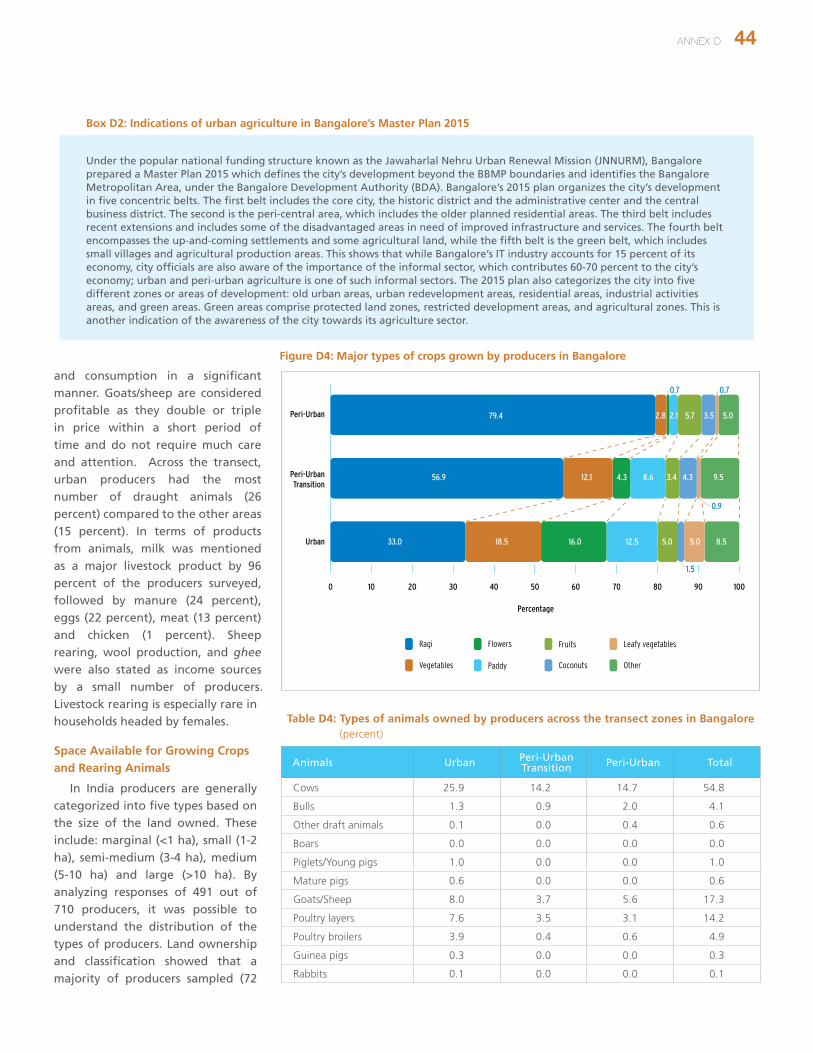
Further information on the case study work is provided in the annexes to this report: Annexes A, B and C describe the approaches and questionnaire used for the case studies, and the constraints faced with collecting and using available data, while annexes D through G provide detailed information on each case study city.
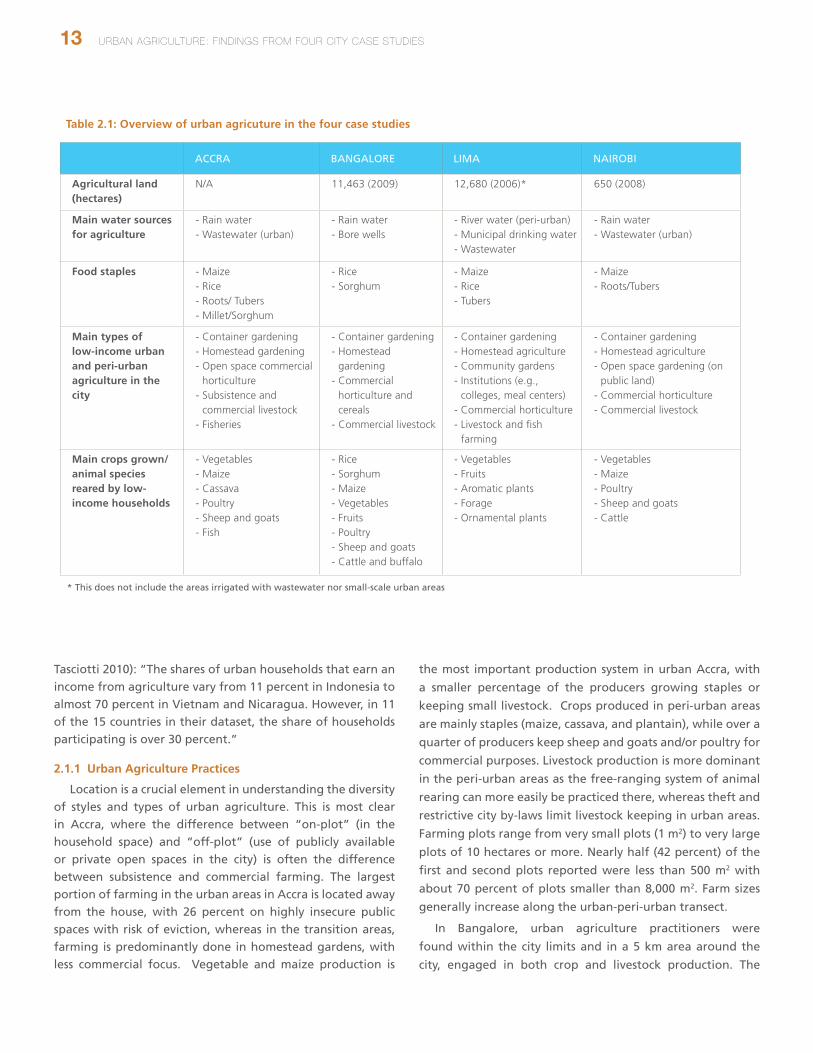
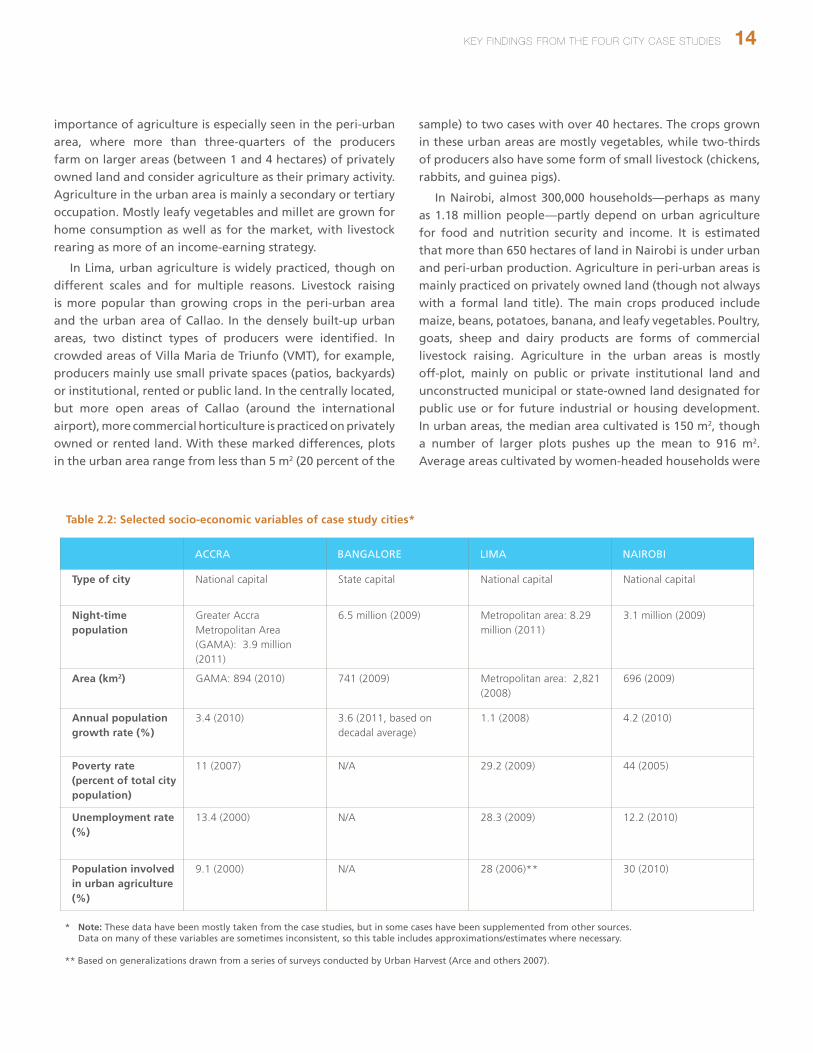
The key findings from the case studies, featured in this chapter, are broadly divided into three sections: Farming in the Cities, on urban agricultural practices in these cities; the Contribution of Urban Agriculture to Low-Income Livelihoods, which includes a summary of how urban agriculture contributes to household incomes and creates cash savings for its practitioners; and Constraints and Drivers of Urban Agriculture Development, which examines some of the key factors affecting the long-term evolution of the sector. Table
2.1 summarizes the variations in urban agriculture in the four cities of this study, while Table 2.2 summarizes selected socio-economic variables of these cities.
2.1 Farming in the Cities
The poverty focus of the case studies, site selection along the peri-urban to urban transect, and the complexity of sampling producers and non-producers meant that it was not possible to extrapolate the number of households involved in farming in specific locations to estimates of the total urban farming population in each city (see annexes). Previous estimates, some based on first hand, rigorous data collection, some on estimates, give an average figure for African cities of 35 percent of urban populations involved in agriculture, two thirds of whom are women (Prain and Lee Smith 2010). Earlier data from Lima and Nairobi indicate average figures of between 25–30 percent of the urban population involved in agriculture. It is also clear from this study that farming is widely practiced in the low income populations studied, to the extent that in Lima, one of the challenges encountered was establishing a sample of “non-producers,” since so many households practiced container gardening or kept some poultry, both of which were included in the broad definition of “urban agriculture.” Data collected between 1998 and 2005 by the FAO on the participation rate in urban agriculture give an extremely varied picture (Zezza and
Key Findings from the Four City Case Studies
KeY FINdINGS FroM THe FoUr CITY CASe STUdIeS 12
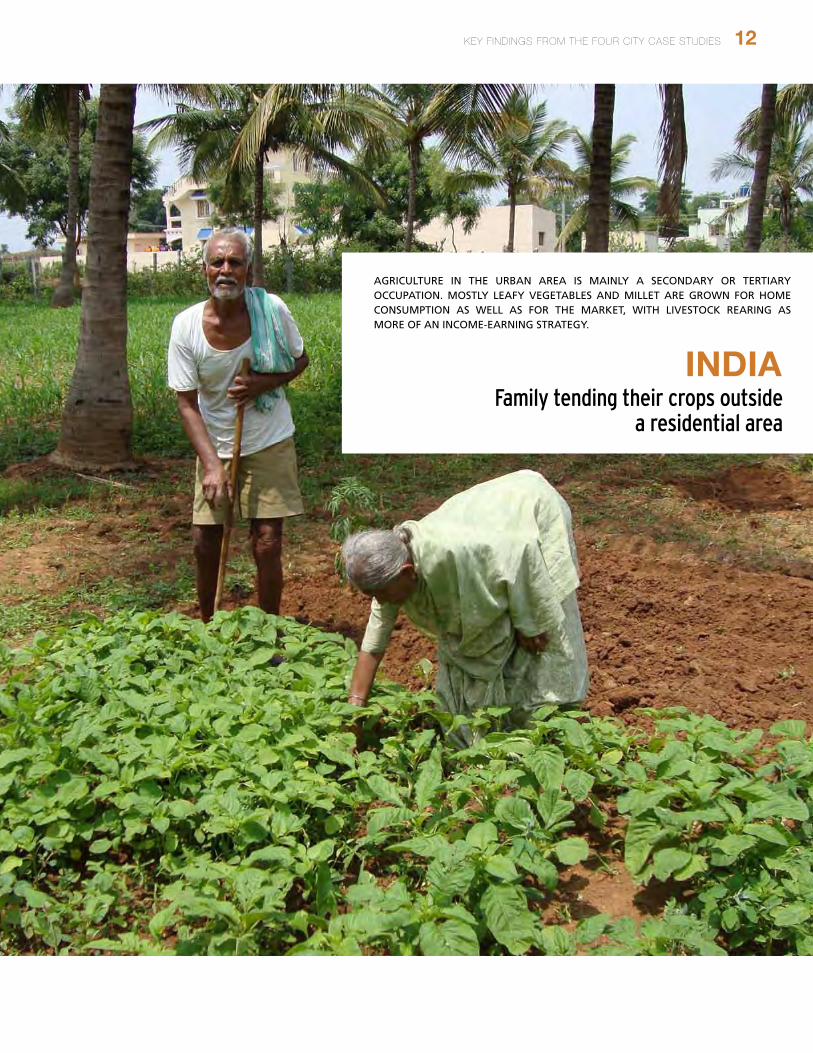
Family tending their crops outside a residential area
InDIa
AGRICULTURE IN THE URBAN AREA IS MAINLY A SECONDARY OR TERTIARY OCCUPATION. MOSTLY LEAFY VEGETABLES AND MILLET ARE GROWN FOR HOME CONSUMPTION AS WELL AS FOR THE MARKET, WITH LIVESTOCK REARING AS MORE OF AN INCOME-EARNING STRATEGY.
13 UrBAN AGrICULTUre: FINdINGS FroM FoUr CITY CASe STUdIeS
Tasciotti 2010): “The shares of urban households that earn an income from agriculture vary from 11 percent in Indonesia to almost 70 percent in Vietnam and Nicaragua. However, in 11 of the 15 countries in their dataset, the share of households participating is over 30 percent.”
2 .1 .1 Urban Agriculture Practices
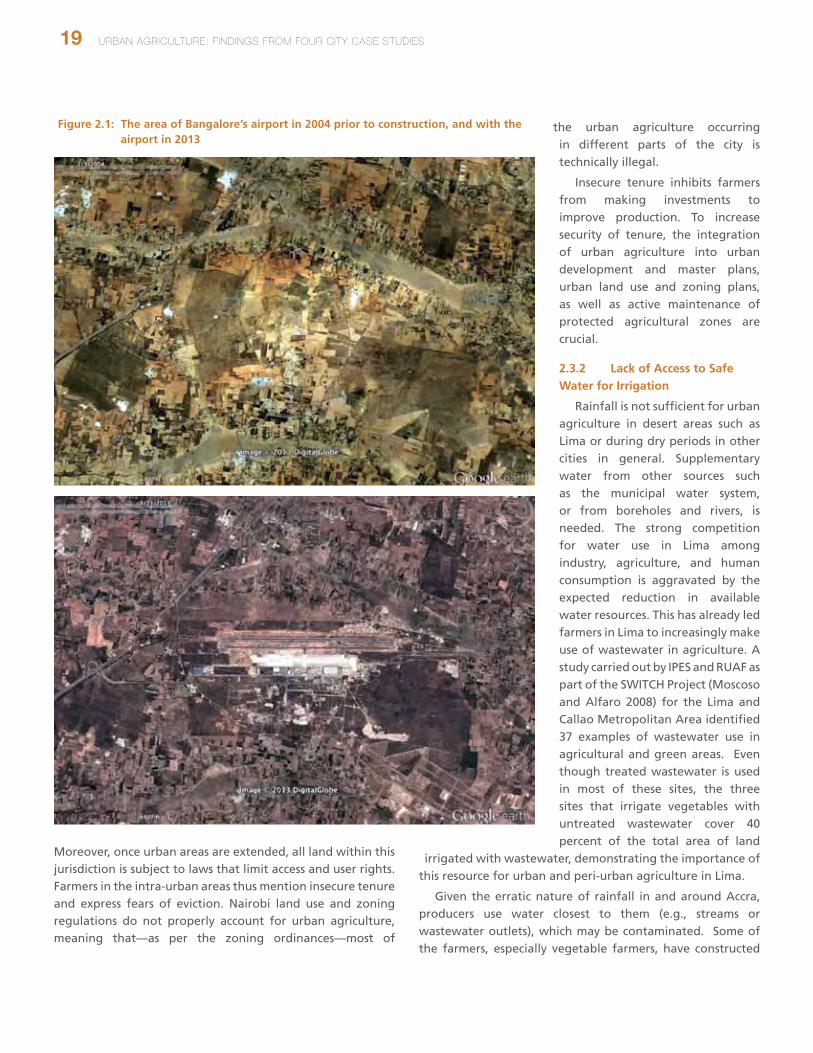
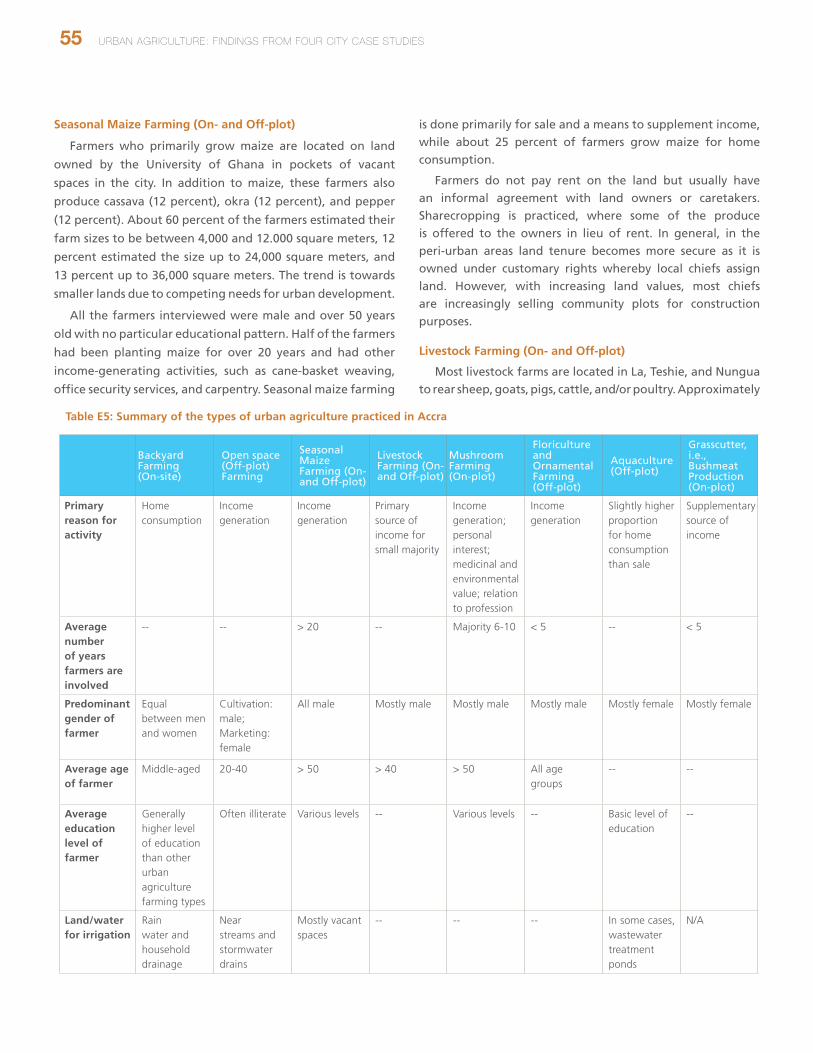
Location is a crucial element in understanding the diversity of styles and types of urban agriculture. This is most clear in Accra, where the difference between “on-plot” (in the household space) and “off-plot” (use of publicly available or private open spaces in the city) is often the difference between subsistence and commercial farming. The largest portion of farming in the urban areas in Accra is located away from the house, with 26 percent on highly insecure public spaces with risk of eviction, whereas in the transition areas, farming is predominantly done in homestead gardens, with less commercial focus. Vegetable and maize production is
the most important production system in urban Accra, with
a smaller percentage of the producers growing staples or
keeping small livestock. Crops produced in peri-urban areas
are mainly staples (maize, cassava, and plantain), while over a
quarter of producers keep sheep and goats and/or poultry for
commercial purposes. Livestock production is more dominant
in the peri-urban areas as the free-ranging system of animal
rearing can more easily be practiced there, whereas theft and
restrictive city by-laws limit livestock keeping in urban areas.
Farming plots range from very small plots (1 m2) to very large
plots of 10 hectares or more. Nearly half (42 percent) of the
first and second plots reported were less than 500 m2 with
about 70 percent of plots smaller than 8,000 m2. Farm sizes
generally increase along the urban-peri-urban transect.
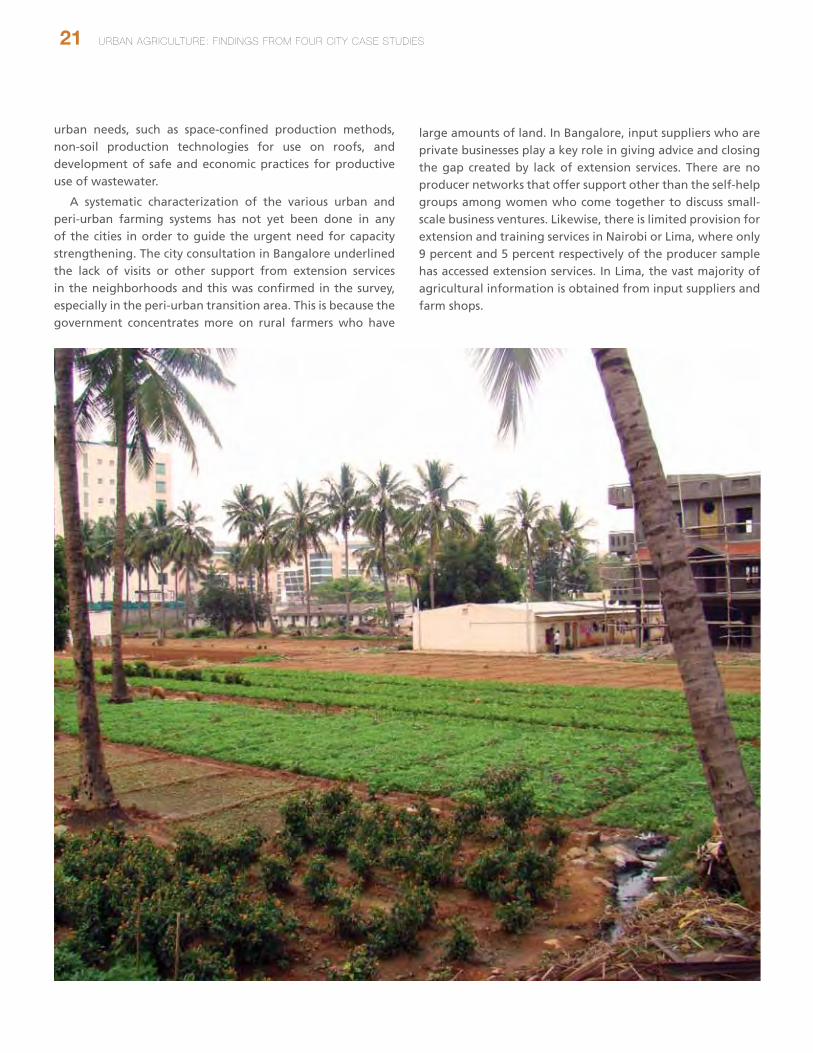
In Bangalore, urban agriculture practitioners were
found within the city limits and in a 5 km area around the
city, engaged in both crop and livestock production. The
Table 2 .1: Overview of urban agricuture in the four case studies
ACCRA BANGALORE LIMA NAIROBI
Agricultural land (hectares)
N/A 11,463 (2009) 12,680 (2006)* 650 (2008)
Main water sources for agriculture
- Rain water- Wastewater (urban)
- Rain water- Bore wells
- River water (peri-urban)- Municipal drinking water - Wastewater
* Note: These data have been mostly taken from the case studies, but in some cases have been supplemented from other sources. Data on many of these variables are sometimes inconsistent, so this table includes approximations/estimates where necessary.
** Based on generalizations drawn from a series of surveys conducted by Urban Harvest (Arce and others 2007).
importance of agriculture is especially seen in the peri-urban area, where more than three-quarters of the producers farm on larger areas (between 1 and 4 hectares) of privately owned land and consider agriculture as their primary activity. Agriculture in the urban area is mainly a secondary or tertiary occupation. Mostly leafy vegetables and millet are grown for home consumption as well as for the market, with livestock rearing as more of an income-earning strategy.
In Lima, urban agriculture is widely practiced, though on different scales and for multiple reasons. Livestock raising is more popular than growing crops in the peri-urban area and the urban area of Callao. In the densely built-up urban areas, two distinct types of producers were identified. In crowded areas of Villa Maria de Triunfo (VMT), for example, producers mainly use small private spaces (patios, backyards) or institutional, rented or public land. In the centrally located, but more open areas of Callao (around the international airport), more commercial horticulture is practiced on privately owned or rented land. With these marked differences, plots in the urban area range from less than 5 m2 (20 percent of the
sample) to two cases with over 40 hectares. The crops grown in these urban areas are mostly vegetables, while two-thirds of producers also have some form of small livestock (chickens, rabbits, and guinea pigs).
In Nairobi, almost 300,000 households—perhaps as many as 1.18 million people—partly depend on urban agriculture for food and nutrition security and income. It is estimated that more than 650 hectares of land in Nairobi is under urban and peri-urban production. Agriculture in peri-urban areas is mainly practiced on privately owned land (though not always with a formal land title). The main crops produced include maize, beans, potatoes, banana, and leafy vegetables. Poultry, goats, sheep and dairy products are forms of commercial livestock raising. Agriculture in the urban areas is mostly off-plot, mainly on public or private institutional land and unconstructed municipal or state-owned land designated for public use or for future industrial or housing development. In urban areas, the median area cultivated is 150 m2, though a number of larger plots pushes up the mean to 916 m2. Average areas cultivated by women-headed households were
15 UrBAN AGrICULTUre: FINdINGS FroM FoUr CITY CASe STUdIeS
considerably less than men (300 m2 versus 500 m2). Where no land is available as is the case in the densely built-up slum areas, container farming is widely practiced by poor urban households. The crops most frequently grown in the urban area include: vegetables, tomatoes, beans, cowpeas, maize, Irish potatoes and sweet potatoes. The majority of the urban producers also keep some small livestock, principally poultry.
2 .1 .2 Ownership, Location, and Use of Space
Many factors conspire against achieving security, with the prevalence of crime and vulnerability to disasters being the ones most commonly cited (UN-HABITAT 2007). House plot ownership and housing tenancy are less visible factors that influence stability and security. In Accra, about 38 percent of both producers and non-producers own their houses with a title, though there is a higher percentage of non-producers who lease (25 percent versus 15 percent for producers), again probably reflecting the somewhat longer period that producers have been located in their area. As might be expected, the very poor have a very high incidence of leasing (75 percent) compared to the less poor (23 percent).
A quite different picture emerges in Nairobi, where there is very low incidence of ownership among both producers and non-producers in urban areas (zero with title, 4 percent without title) and also in the transition area, with the difference that insecurity is even higher in the transition zone where 40 percent of producers in non-owned housing (65 percent of all producer households) are squatting. By contrast, in peri-urban areas, producers have almost 95 percent ownership (72 percent with title), but only 15 percent of non-producers own their house. This means that both urban and transition producers have considerable instability in their living arrangements, and unsurprisingly this is reflected in a high incidence of “off-site” cultivation (95 percent and 67 percent in urban and transition areas, respectively).
It is often assumed that urban agriculture is primarily practised by rural-urban migrants who are relatively recent arrivals in cities. Certainly, for individuals or families who have recently arrived in an urban area, achieving stability and security is of major importance. Yet, not all urban growth is due to migration—in Africa, for example, most urban growth is due to natural growth. Within cities, there are households which have very unstable living arrangements, and may have to move their accommodation frequently, but within the same area. Cultivation of off-site plots appears to provide an important level of socio-economic and perhaps cultural stability in these circumstances.
In all case study cities, producers were found to have lived
in the survey areas longer than non-producers had. In Accra,
64 percent of producers were either born in the location or
had been there since before 2000, compared to 56 percent of
non-producers. In Nairobi, 38 percent of producers had been
living in the location since 1980 or earlier compared to just 14
percent of non-producers. In Lima, producer household heads
settled in most locations of the city earlier on average than
non-producers. Also in Bangalore, most of the producers are
long-time residents compared to the non-producers and many
are still resisting the pressure to sell their land to developers.
Many producers were those who had been around in the
same locality, and have become part of the urban landscape
with the expansion of the municipal boundaries. In other
words, the “urban myth” mentioned above—that producers
are recent ex-agriculturalist migrants from rural areas who
have not yet transitioned into urban lifestyles is, based on
this data, indeed a myth. These four city studies suggest
that producers may be more settled in the locality than non-
producers with agriculture providing them with some level
of stability.
In addition to asking about ownership of the space or
plot used for urban agriculture, the surveys also included
questions regarding the location of plots. Here, the responses
were more varied across the four cities and also across the
transects in the cities. In Bangalore, most respondents did
not answer the question; those who did said that they had an
urban plot away from the home. In Lima, most respondents
use either homestead containers or home plots. In Accra
and Nairobi, as mentioned above, most urban producers use
publicly available space; others use plots around or away
from the house. The pattern in the two African cities is of
intense use of public and sometimes private land off-site by
urban and in some cases transition producers, with greater
levels of ownership and/or private leasing in peri-urban areas.
Thus in Accra, about two-thirds of plots are either leased or
are public lands occupied with or without permission. Almost
50 percent of the main plots cited by respondents were
cultivated on public lands. The transition area, which is more
small-scale and homestead based, shows higher ownership
(50 percent). Peri-urban cultivation is relatively evenly divided
between ownership and leasing, with minimum access to
public land. Although specific data on tenancy arrangements
in Nairobi was not available, there was very high reported
fear of eviction, especially in the urban area (85 percent).
As mentioned above, most of this agriculture is off-site, on
KeY FINdINGS FroM THe FoUr CITY CASe STUdIeS 16
public locations with no ownership, which explains this level of concern.
Producers were also asked how they used their space in terms of whether the space was primarily used for growing crops, raising livestock, or both. The responses were unique for each of the four cities. In Accra, the plots were used mostly for growing crops, whereas it was the opposite in Lima. In Nairobi, surprisingly more crops were grown in the urban area compared to the peri-urban area; in the peri-urban area it was common to find producers using their space for both crops and livestock as well as just to grow crops. In Bangalore, the majority chose not to respond to this question.
2 .1 .3 Other Non-land Inputs Used
Manure was the most common type of fertilizer used, except in Accra, where chemical fertilizers are used mostly in the urban and peri-urban areas. Chemical fertilizers and compost were used to a lesser extent in the other cities. Use of wastewater varied across and within the cities; for instance, it is commonly used in the urban area of Nairobi and in the urban area of Callao and the peri-urban area in Lima. In Accra, more fertilizer is used in the urban areas than in areas surrounding the city, while in Bangalore it is the peri-urban area that uses the most fertilizers. Seeds/seedlings were purchased in all cities, but in terms of other inputs, there was greater variation. In Bangalore, inputs such as hired labor, water/irrigation, and pesticides, were used in roughly equal proportion across the transect, but seeds slightly more so than other inputs. In Lima, paid labor and pesticides are seldom used in VMT and to a slightly greater extent in the peri-urban area. In other areas in Lima the use of other inputs is fairly consistent. Accra and Nairobi had more variations along the transect.
2.2 Urban Agriculture’s Contribution to Livelihood and Food Security
2 .2 .1 Urban Agriculture is a Provider of Employment and Income
Among producer households, farming is very significant as a primary occupation in the case study cities, with the exception of Lima. In just Accra and Nairobi, the two cities in Sub-Saharan Africa, if the figure of 35 percent of urban populations farming is accepted, there are some 230,000
urban households where the household’s main declared occupation is farming.1
The data on secondary occupation is also significant, in two ways. First, it shows generally low levels of secondary employment by household heads in all cities (27 percent overall) which seems to suggest a change in employment availability in recent years, at least compared to descriptions of the informal sector in cities like Accra and Lima over the past thirty years or so (Hart 1973, Lloyd 1980). Second, across all cities, there are significant differences in the incidence of secondary employment between producers and non-producers. Agriculture seems to combine well with other occupations and offers the chance to retain multiple employments for household heads to a much greater degree than for those not involved in agriculture. Again this is of high importance to women and women-headed households, especially if agricultural activities are located close to the home and allow for combining with other household chores and childcare.
Urban agriculture is an important livelihood strategy for some groups. It is clear from this study that urban agriculture is attractive to households with older, less educated heads. This was consistent across all four cities, and in at least two cities, it was shown that age and education were independent, meaning that agricultural production offers benefits and advantages to households where the head is older or has received less education. As these are among the more vulnerable groups living in cities, this makes agriculture a particularly important contribution to urban livelihoods. Women are often more vulnerable given their level of education compared to men, and farming is thus of even greater relevance for them.
The findings also show that the advantage of agriculture in combining with other occupations also enables producers to benefit from more diversified income sources, thus reducing vulnerability and enhancing the economic resilience of low income households, even if producers do not obviously benefit from higher incomes overall. With over 30 percent of the producers (except for Lima) considering urban agriculture an important source of income and if we conservatively estimate 20 percent of the overall population to be involved in urban agriculture, this would imply that over 1,346,000
1 Considering 35 percent of the two populations of Accra and Nairobi, divided by respective average household size of producers and then taking the percent of those households reporting agriculture as a principal occupation.
17 UrBAN AGrICULTUre: FINdINGS FroM FoUr CITY CASe STUdIeS
households in the four cities generate an important share of
their income from urban agriculture.2
Another important contribution to income from agriculture
comes from the cash savings arising from producing one’s
own food, which would otherwise have to be purchased.
High percentages of respondents in most cities reported that
the savings coming from own food production enabled them
to purchase other types of food, especially staples (Bangalore,
percent) or cover for other non-food household needs.
2 .2 .2 Urban Agriculture Provides Food Security
From the case study findings, the contribution of urban
agricultural production to food availability and access is
perhaps less clear than its important role in employment and
diversified income generation. Using 24-hour recall data,
the surveys found no significant differences between the
nutritional status of producers and non-producers in Accra,
Lima and Nairobi.3 A difference was noted in Bangalore
between very poor producers and non-producers, suggesting
that farming enabled the very poor to diversify their diet.
In other cases, significant differences were only noted in
levels of consumption of particular food groups, especially
leafy vegetables and orange-fleshed vegetables which may
be attributable to better access to these foods by both those
producing as a principal occupation and those for whom
agriculture was of subsidiary importance as an occupation,
but seemingly made a key contribution to food security.
2 These figures are consistent with those found in the study done by Zezza and Tasciotti (2010). They found that “For between 18 and 24 percent of all urban households in the African counties in the sample agriculture constitutes 30% percent of total income or more.” This figure is lower for households in Guatemala, Nicaragua and Vietnam. By decomposing participation rates and income shares by quintile of expenditure levels, the study also found confirmation that urban agriculture is an eminent activity practiced by the poor. Data from a recent AFSUN study (Crush, Hovorka and Tevera 2011) however found much lower num-bers of households deriving an income from urban agriculture. Reasons for this may include that the incorporation of urban agriculture in (in)formal markets in southern Africa is much more limited. In addition, the study focussed only selected areas and did not provide insights into the relevance of urban agriculture across the city as a whole.
3 The 24-hour recall data has certain limitations, especially in rela-tion to absence of quantification of portion size. The Zezza and Tasciotti study (2010), having applied two measures of dietary diversity (one based on food groups and the other a count of food items consumed in a 2 week–1 month recall period) did find evidence that engagement in urban farming is positively associ-ated with greater dietary diversity in 10 of the 15 countries where this was measured.
Differences in food diversity do exist between different locations within cities (urban, peri-urban transition, and peri-urban zones) both overall and for certain food groups. This can be explained by differential access by producers in these different locations to resources and opportunities, such as the commercial horticulture producers in the transition areas of Lima having the feed resources and space to raise small animals for home consumption, which helps explain their higher consumption of this food group.
In contrast to the unclear picture about the nutrition and dietary benefits of urban agriculture from the 24-hour recall data, the perceptions data reveal producers with clear recognition of the benefits they gain from agriculture production, especially access to extra food and saving of money to buy other food, but also a more varied diet and savings for non-food purchases. Diversification of food sources reduces vulnerability and enhances the coping capacity by increasing the stability of household food consumption against seasonality, disturbances in food supply from rural areas or imports (due to climate change or other factors) or other temporary shortages, increases in food prices and (temporary) losses of income. For example, households in Accra that consume a high proportion of their own farm produce (both crop and livestock, i.e., more than 50 percent of production) perceive that they are much less prone to high food insecurity than their non-producer counterparts.
2 .2 .3 Urban Agriculture Contributes to Social Capital
The case studies also revealed information on the contribution of urban agriculture to another, less tangible, aspect of livelihoods: levels of social capital. It was found that producers benefited relatively little from macro-level social capital, particularly involvement in agricultural extension services. In terms of micro-level social capital built up through exchanges of goods and services between neighbours and relatives in both urban and rural areas, a greater volume of exchange was conducted with both relatives and non-relatives in urban areas rather than with distant relatives. Food was found to be the most common item exchanged, if we consider both fresh and prepared food together. These exchanges are clearly a significant part of urban food systems across all of the cities studied and they are a form of redistribution of local production to non-producers (which may partly explain the limited differences in food consumption between producers and non-producers). There are inconsistencies in the data between responses on food exchanges and responses on the sources of food consumed during the previous week, which need to be better understood.
KeY FINdINGS FroM THe FoUr CITY CASe STUdIeS 18
Cash loans were also very important items exchanged, reflecting the limited access to credit among the populations surveyed. Overall, there was clear evidence that producers are more intensively involved in these exchanges than non-producers, probably because of the wider range of goods and services that they have available for exchange, or need to obtain from others. This suggests that agricultural production can be a strong basis for strengthening local organization and integrating local voices in governance systems.
Income generation is considered of greater importance than access to additional food as a reason for farming in cities, even though this differs for individual households or locations. In Accra, 51 percent prioritize income compared to 41 percent who prioritize food security or an additional source of food, with the more commercial urban producers having a higher percentage. For those growing crops for additional food, the highest proportion is in the transition area. Those raising livestock (sheep, goats, poultry, and grass-cutters) mainly do so to access additional food. Urban and peri-urban transition dwellers more frequently keep livestock for food, while in the peri-urban area access to additional income is the main reason.
For 58 percent of the Bangalore producers and over 45 percent of producers in Lima, urban agriculture constitutes an important source of additional income. In Nairobi a greater proportion of producers (78 percent) indicate that they cultivate for household food supply, while 22 percent mention additional income or income diversification as an important reason. Employment provided by urban agriculture is for many of them more reliable compared to casual labour opportunities, which are not guaranteed.
2.3 Constraints on Urban Agriculture Development
A number of key constraining factors for sustainable urban agriculture development emerged in this study that are common to the four cities.
2 .3 .1 Lack of Access to Land
A major challenge to the viability of urban agriculture, as highlighted by all four case studies, remains land availability and access. Urban growth intensifies competition for land among industrial, commercial, residential and agricultural uses, especially in the peri-urban transition and peri-urban areas. For example, high levels of in-migration and urban growth in Bangalore have resulted in increased land prices and pressure on agricultural land, with many converting agricultural land to non-agriculture uses. Recent construction
for the IT industry and an international airport has converted thousands of hectares of agricultural land. Figure 2.1 shows satellite images of the area in and around Bangalore airport in 2004, prior to the construction of the airport, compared to 2013, when the airport is fully functional and is being expanded. The Bangalore Master Plan for 2015 proposes a conceptual diagram for the future city development, envisioning five spatially organized concentric belts, with agriculture pushed to the outer perimeter (outside the 5 km zone). (See Box D2 for more information on the master plan.) This vision will affect all producers currently engaged in urban agriculture.
Similarly, in Lima 23 municipal districts modified their territorial planning priorities in 2010 towards urban development above other land use. As a consequence, the growing peripheries of the Lima and Callao Metropolitan Area are seeing not only construction on uncultivated areas but also the development of areas that have been dedicated to farming. A good example of this is Lurigancho-Chosica, which between 2002 and 2006 lost 305 hectares of agricultural land due to changes in land use, much of it to quarrying and brick-making for the construction industry. However, preserving existing agricultural areas in and around cities is important to safeguard their food production and environmental functions.
In Accra, finding larger areas of land seems to be the most common problem by producers, especially those located in the urban and peri-urban transition areas. This would call for (technical) support to help farmers in these areas to intensify land use to increase production per unit area in addition to promoting the adoption of high value crop and livestock enterprises.
Apart from availability of and access to agricultural land, there is also widespread absence of secure tenure. Where agriculture is practiced on public, community, or institutional land, the use of these spaces is often not regulated and lacks legal protection for producers. In Accra, for example, most of the open spaces on which urban agriculture is practiced belong to government institutions and to a lesser extent, individual owners. Farmers usually do not pay for the use of such lands. There is no security of tenure as they are allowed to farm as long as the owners do not need the land. More than a quarter of urban producers in Accra reported fear of eviction from the plots that they are currently cultivating.
In Nairobi, where the predominant tenure system is individual leasehold, the fear of eviction for urban producers is 85 percent. Where owners have freehold titles, such land parcels are converted to leaseholds upon sub-division.
19 UrBAN AGrICULTUre: FINdINGS FroM FoUr CITY CASe STUdIeS
Moreover, once urban areas are extended, all land within this jurisdiction is subject to laws that limit access and user rights. Farmers in the intra-urban areas thus mention insecure tenure and express fears of eviction. Nairobi land use and zoning regulations do not properly account for urban agriculture, meaning that—as per the zoning ordinances—most of
the urban agriculture occurring in different parts of the city is technically illegal.
Insecure tenure inhibits farmers from making investments to improve production. To increase security of tenure, the integration of urban agriculture into urban development and master plans, urban land use and zoning plans, as well as active maintenance of protected agricultural zones are crucial.
2 .3 .2 Lack of Access to Safe Water for Irrigation
Rainfall is not sufficient for urban agriculture in desert areas such as Lima or during dry periods in other cities in general. Supplementary water from other sources such as the municipal water system, or from boreholes and rivers, is needed. The strong competition for water use in Lima among industry, agriculture, and human consumption is aggravated by the expected reduction in available water resources. This has already led farmers in Lima to increasingly make use of wastewater in agriculture. A study carried out by IPES and RUAF as part of the SWITCH Project (Moscoso and Alfaro 2008) for the Lima and Callao Metropolitan Area identified 37 examples of wastewater use in agricultural and green areas. Even though treated wastewater is used in most of these sites, the three sites that irrigate vegetables with untreated wastewater cover 40 percent of the total area of land
irrigated with wastewater, demonstrating the importance of this resource for urban and peri-urban agriculture in Lima.
Given the erratic nature of rainfall in and around Accra, producers use water closest to them (e.g., streams or wastewater outlets), which may be contaminated. Some of the farmers, especially vegetable farmers, have constructed
Figure 2 .1: The area of Bangalore’s airport in 2004 prior to construction, and with the airport in 2013
KeY FINdINGS FroM THe FoUr CITY CASe STUdIeS 20
hand-dug wells to irrigate their crops when the rains are delayed or fail completely. Others use wastewater to also benefit from the nutrients in such waste. The use of such polluted water, especially on vegetables that are not cooked before eating, poses potential health risks to consumers.
The WHO expects that “urban agriculture, with urban wastewater as a common resource, will play a more important role in supplying food for the cities” (WHO 2006). The last two decades have seen a strong move towards alternative, decentralized and low-cost wastewater treatment that allows reuse of wastewater and nutrients or even includes aquaculture or agriculture as part of the wastewater treatment process. Where only partial or no wastewater treatment is available, health risks of productive reuse of wastewater can be reduced through complementary health risk reduction measures as explained in the latest WHO guidelines for safe use of excreta and wastewater (WHO 2006). These new guidelines assist decision-makers to plan how to achieve the required levels of pathogen reduction by choosing and combining a number of different health risk reduction measures and entry points for action along the “farm-to-fork” pathway, depending on what is feasible locally. As the new WHO guidelines allow for incremental and adaptive change (in contrast to the earlier strict water quality thresholds), they are a cost-effective and realistic approach for reducing health and environmental risks in low-income countries (International Water Management Institute 2006).
2 .3 .3 Lack of Access to Capital and Credit
In all cities, farmers complain about a lack of access to affordable micro-credit and financing that would support more capital investment to improve their production systems. Overall, only 25 percent of producers access some form of banking or money-lending service, according to the surveys. In Bangalore, local saving and credit systems and self-help groups are currently the major sources of financial support, especially for women farmers. The surveys also show that the major type of exchange existing among urban neighbours and relatives, and with rural relatives, involves small-scale financial loans.
A credit and financing study on urban agriculture implemented by RUAF in 17 cities (2009-2010), including the cities of Lima, Accra and Bangalore, also shows that micro-credit for small-scale urban farmers is generally limited in scope and in number. It was found that credit is more common for commercially-oriented activities such as raising animals, agro-processing or marketing and much less for production of vegetable crops (Cabannes 2011).
A key conclusion of the study in Accra, that is applicable to the other cities, is that “most … financial institutions do not have special products for agricultural activities, especially those related to growing crops on small farms and raising small livestock such as sheep, goat, grass cutter and fowls” (Egyir 2010). In Accra, most of the vegetable farmers indeed use their own funding or make an arrangement with market sellers to provide them with some advance payments.
Next to the focus on larger-scale agricultural enterprises, Cabannes (2011) identified other problems constraining producers from obtaining more formal micro-loans:
• Limited awareness among financial institutions (FIs) of urban agriculture;
• The perception that financing agriculture, especially small-scale production, is risky—small-scale urban agriculture is seen as unprofitable and doubts exist about the ability of farmers to repay their loans;
• Inflexible nature of the rules and regulations of some FIs;
• Lack of proper land title deeds and/or collateral among producers; and
• Lack of viable projects among poor urban producers to qualify for borrowing and lack of proper record keeping by them.
A central finding is that finance institutions justify their lack of interest to offer financial products to urban producers because of risk. These perceived risks might also be linked to the possibility of crop failures resulting from adverse climatic events such as droughts and floods. The expectation of future climate change effects is likely to strengthen this perception. The influence of the current financial crisis is leading FIs to be even more cautious. However, various municipalities have come up with innovative approaches such as guarantee and insurance mechanisms. The formation of producer organizations and enhanced tenure security are two other strategies with positive effects. These incipient experiences could serve as examples to other cities (Cabannes 2011).
2 .3 .4 Lack of Access to Appropriate Training and Extension Services
Urban agriculture is performed under specific conditions that require technologies and organizational and marketing models different from those used in the rural agricultural context. Most available agricultural technologies need adaptation for use in urban conditions, whilst new technologies have to be developed to respond to specific
21 UrBAN AGrICULTUre: FINdINGS FroM FoUr CITY CASe STUdIeS
urban needs, such as space-confined production methods, non-soil production technologies for use on roofs, and development of safe and economic practices for productive use of wastewater.
A systematic characterization of the various urban and peri-urban farming systems has not yet been done in any of the cities in order to guide the urgent need for capacity strengthening. The city consultation in Bangalore underlined the lack of visits or other support from extension services in the neighborhoods and this was confirmed in the survey, especially in the peri-urban transition area. This is because the government concentrates more on rural farmers who have
large amounts of land. In Bangalore, input suppliers who are private businesses play a key role in giving advice and closing the gap created by lack of extension services. There are no producer networks that offer support other than the self-help groups among women who come together to discuss small-scale business ventures. Likewise, there is limited provision for extension and training services in Nairobi or Lima, where only 9 percent and 5 percent respectively of the producer sample has accessed extension services. In Lima, the vast majority of agricultural information is obtained from input suppliers and farm shops.
KeY FINdINGS FroM THe FoUr CITY CASe STUdIeS 22
ReferencesArce, B., G. Prain, R. Valle, and N. Gonzales. 2007. “Vegetable Production Systems as Livelihood Strategies in Lima-Peru:
Opportunities and risks for households and local governments.” Acta Hort. (ISHS) 762: 291-302. http://www.actahort.org/books/762/762_28.htm
Cabannes, Y. 2011. “Financing Urban Agriculture, Current Challenges and Innovations.” Urban Agriculture Magazine 25: 32-35. Leusden, The Netherlands: RUAF Foundation. http://www.ruaf.org/node/2372
Crush, J., A. Hovorka and D. Tevera. 2011. “Food Security in Southern African Cities: The Place of Urban Agriculture.” Progress in Development Studies 2011, 11-285. Sage.
Egyir, I. S. 2010. “Applied Study on Local Finance for Poor Urban and Peri-urban Producers in Accra, Ghana.” IWMI Ghana and RUAF Foundation (unpublished).
Hart, K. 1973. “Informal Income Opportunities and Urban Employment in Ghana.” Modern African Studies 11 (1): 61-89.
International Water Management Institute. 2006. “Recycling Realities: Managing Health Risks to Make Wastewater an Asset.” IWMI Water Policy Briefing 17. Colombo, Sri Lanka: International Water Management Institute (IWMI). http://www.iwmi.cgiar.org/Publications/Water_Policy_Briefs/Landing_Pages/WPB17.aspx
Lloyd, P. 1980. “The Young Towns of Lima. Aspects of Urbanization in Peru.” Cambridge: Cambridge University Press.
Moscoso J. and T. Alfaro. 2008. “Panorama de Experiencias de Tratamiento y Uso de Aguas Residuales en Lima Metropolitana y Callao.” Cuaderno de Agricultura Urbana 6. Lima, Peru: IPES, RUAF Foundation, MVCS and SWITCH. http://www.ipes.org/index.php?option=com_content&view=article&id=161&Itemid=179
Prain, G. and D. Lee Smith. 2010. “Urban Agriculture in Africa. What has been learnt?” In African Urban Harvest: Agriculture in the cities of Cameroon, Uganda and Kenya, ed. Prain, G., N. Karanja and D. Lee-Smith. Springer, New York / International Development Research Centre, Ottawa / International Potato Centre/Urban Harvest, Lima.
UN-HABITAT. 2007. “Enhancing Urban Safety and Security — Global Report on Human Settlements 2007.” Nairobi, Kenya: United Nations Program on Human Settlements.
WHO (World Health Organization). 2006. “Guidelines for the Safe Use of Wastewater, Excreta and Greywater.” Geneva.
Zezza, A. and L. Tasciotti. 2010. “Urban Agriculture, Poverty and Food Security: Empirical Evidence from a Sample of Developing Countries.” Food Policy 35: 265-273. Elsevier Ltd.
23 UrBAN AGrICULTUre: FINdINGS FroM FoUr CITY CASe STUdIeS
The case studies from the four cities offer a number of key
findings and conclusions, based on the data gathered, and
generally validating the basic hypothesis underlying this
report, as mentioned in section 1.1. First, in general terms,
urban agriculture contributes to local economic development,
poverty alleviation, social inclusion of the urban poor
and women, as well as to the greening of the city and the
productive reuse of urban wastes. Second, urban agriculture
provides a stable occupation and income strategy for
vulnerable segments of the urban population. It is also highly
compatible with other kinds of employment, particularly
informal business or even casual labor, thus facilitating access
to multiple income sources. Such diversification of income
sources is important as a risk management and adaptation
strategy.
On the other hand, the development of urban agriculture
is generally constrained by the loss of agricultural land,
specifically in peri-urban transition and peri-urban areas,
as well as the lack of secure tenure. Lack of access to safe
irrigation water, credit and capital were also identified as
constraints by producers across the four cities. In addition,
the agricultural extension system is generally weak, and
cannot respond to the need for training on more sustainable
and profitable urban agriculture production systems. Urban
agriculture largely remains an informal sector that is often not
well integrated into agricultural policies or urban planning.
Yet, the importance of urban agriculture will likely increase
with the urbanization and climate change, policy decisions
and integration of urban agriculture into development strategies are necessary for the efficiency and long-term sustainability of urban agriculture programs.
3.1 Integrating Urban Agriculture Into the Broader Urban Development Agenda
Given the contributions that urban agriculture can make to urban livelihoods and food security, as well as the local and global environmental co-benefits that it offers, what can local and national governments, the research community, and international organizations do to guide and enhance the development of urban agriculture? In attempting to answer this question, it is essential to recognize that urban agriculture on its own cannot be a panacea for urban problems; neither should it be seen a niche activity that does not have broader relevance. Rather, urban agriculture should be viewed as a useful part of an integrated approach to sustainable urban development—in other words, it can be ‘mainstreamed’ into urban policies and programs.
Urban agriculture that is mainstreamed into broader urban development strategies should also be customized to the particular needs and circumstances of the city and country in question. There is thus no blanket prescription for what any given city can or should do with respect to urban agriculture. Ideally, governments and policy-makers would clearly identify specific goals in relation to the promotion of urban agriculture. For example, a local government concerned about growing food insecurity or malnutrition among the
recommendations for Decision-makers
reCoMMeNdATIoNS For deCISIoN-MAKerS 24
Urban gardening enables mothers to introduce nutritional foods to their families
naIrObI
AGRICULTURE CAN BE PARTICULARLY IMPORANT TO THE LIVELIHOODS OF URBAN WOMEN, WHO ARE AMONG THE MORE VULNERABLE GROUPS LIVING IN CITIES.
25 UrBAN AGrICULTUre: FINdINGS FroM FoUr CITY CASe STUdIeS
urban poor in urban areas may specifically support forms of backyard gardening or low-space gardening (as practiced by many households in Kibera, Nairobi) or promote the production of crops and livestock that are nutritionally and culturally important. Another city that is mainly interested in boosting local economic development and employment creation may instead focus on the development of small-scale commercial urban agriculture in larger open spaces in the urban, peri-urban transition or peri-urban areas; support input-supply, processing, or marketing enterprises; and seek to stimulate well-performing subsistence farmers to move into the market sector. Local authorities mainly concerned with improving general urban living conditions and reducing risks from climate change and associated disasters may promote greening and agricultural use of open spaces, promote a shift from high-input commercial agricultural production towards more sustainable and ecological forms of agriculture, and carefully consider the possibilities of (agro-)forestry on steep slopes and in floodplains.
3.2 The City Level: Promoting Local Food Systems in Integrated Urban Land Use Planning
In order to build more resilient regional or local food systems, land use and urban planning policies can be developed to be favorable toward urban and peri-urban agriculture, and preserve existing agricultural areas in urban, peri-urban transition, and peri-urban areas. Formal recognition of urban agriculture as a legitimate use of urban land and of its value to city livelihoods and liveability would be a crucial step towards the effective planning, regulation and facilitation of urban agriculture. The inclusion of urban agriculture as a separate land use category in municipal development, land use and zoning plans is an important question to consider (Dubbeling, de Zeeuw and van Veenhuizen 2010). Moreover, in order to take advantage of urban waste streams by utilizing municipal organic waste and wastewater as production inputs, land could be zoned so that irrigation activities can take place next to treatment plants to allow use of treated sewage (Acharya, Hoornweg and Dubbeling 2011, Dubbeling, De Zeeuw and Van Veenhuizen 2010).
There is a clear need for mapping and land surveying, to identify actual and potential food production areas in and around cities and in rural hinterlands and to relate these to health facilities and outreach centers. This will require much greater precision than existing agricultural surveys, which have systematically under-recorded homestead plots in general and most urban cultivation. Following the model of Rosario, Argentina, a municipal land bank for urban agriculture could
be set up, facilitating access of interested producer groups, and specifically women-headed households, youth, or HIV-AIDS infected families to abandoned plots (Dubbeling and Pasquini 2010).
Next to the preservation and protection of existing agricultural land, governments can optimize the use of vacant and non-built land areas up for food production. Institutions (schools, hospitals, prisons, offices) could utilize all their free spaces in this way and serve the food grown in the premises. Urban agriculture could also be integrated in social housing and slum upgrading programs by including space for home gardens or community gardens, street trees for shade and fruits, “productive parks,” as done in the Villa Viva and Drenurbes housing schemes in Belo Horizonte, Brazil (De Zeeuw and Dubbeling 2009). Priority could also be given to using land that is earmarked for other uses but not yet in use as such, land that is not fit for construction, e.g. flood zones, and land under power lines or buffer zones (such as those along airport strips as found in Lima and Accra).
Cities can also address the issue of tenure by acknowledging the legal status of the producers growing on open public land through tacit approval of occupancy and short- or medium-term lease arrangements. They could offer multi-annual leaseholds or occupancy licenses, specifying that the land is occupied with the consent of the local government. Often such arrangements or contracts with farmers include conditions regarding land, crop, and waste management practices and include certain restrictions. Even limited acceptance by a government can influence the status of urban farmers in two ways. First, it encourages a sense of security that will lead them to make more improvements to their farming system and, secondly, it allows urban farmers to access credit and to use their land occupancy license as collateral for small loans, thus overcoming the barrier of not having formal “property.” An on-going experience developed in Freetown, Sierra Leone is a good example of how to address this bottleneck (Cabannes 2011).
Cities may also provide fiscal and tax incentives for land owners who lease out vacant private land to groups of urban poor people willing to produce on this land, while idle land could be taxed. Since land is a valuable resource, combinations of different forms of land use (multifunctional land use), for example by combining agricultural land use with recreational, water management/flood protection, green space, or other functions could also be required (Dubbeling and de Zeeuw 2010).
An integrated approach is thus needed for urban agriculture within wider urban planning and management processes. Table 3.1 illustrates the challenges that the case
reCoMMeNdATIoNS For deCISIoN-MAKerS 26
Table 3 .1: Legal and policy elements favoring or disfavoring urban agriculture
ACCRA BANGALORE LIMA NAIROBI
National policy support
Urban agriculture included in the national agriculture policy
National policy on urban horticulture being formulated and urban agriculture included in the 12th 5-year plan on agriculture
Incidental support by Ministry of Agriculture and the Ministry of Women and Social Development
Draft national urban agriculture and livestock policy developed (2010)
Overall policy environment at local level
By-laws regulating the urban agriculture practice
The overall vision is to maintain agriculture only in a greenbelt around the city
Several districts with a facilitating urban agriculture policy. Recent urban agriculture programs set up under the Metropolitan Municipality of Lima
Neither clear local policy guidelines exist, nor operationalization of the Nairobi 2030 Metro Strategy that calls for preservation of agricultural land use.
City-level policy support
- By-laws on urban agriculture for the Accra Metropolitan Assembly
- District food and agriculture officers provide technical assistance and financing to urban farmers
- No city level policy to promote urban agriculture
- Urban agriculture included in municipal development plans
- Special municipal structures for urban agriculture set up
- Municipal budget allocated to urban agriculture
- Urban agriculture included in the Nairobi Metro 2030 Strategy
- Nairobi has no agricultural department
- No specific resources are allocated
Institutional framework
Low level of support to urban agriculture
Low level of support to urban agriculture
Broad NGO and academic support for urban agriculture
Broad NGO and academic support to urban agriculture
study cities face with providing a conducive environment for
the development of urban agriculture. Coordination among
various government levels, structures, and departments is one
of the conditions for operationalizing local and regional food
systems, especially between agricultural and environmental
agencies on the one hand and health and educational
agencies on the other. Land-use planning for local and
regional food systems can be considered at various scales:
at the neighborhood level (with varying urban, transition,
or peri-urban characteristics) and at city and metropolitan
or city-region levels. This integration of agriculture and
food systems at the various levels of planning can then be
supported by urban, metropolitan and regional/national
management, incentives and governance measures. In terms
of urban management, special attention needs to be paid to
health control, storage and processing, land legislation, land
tenure systems, use of vacant land and ensuring access to
water. In terms of urban governance, it is important to ensure
the inclusion of vulnerable groups, with special attention for
gender, youth and migrant workers. Finally, while the voice of
these groups needs to be enhanced, it is important to ensure transparency related to the integration of food systems in urban decision-making processes (FAO 2011).
3.3 The Value Chain: Strengthening Each Link Within the Urban Agriculture Sector
In order to increase the income and employment benefits of urban agriculture, infrastructure needs to be improved so as to better connect local farmers to urban markets. Support is also needed to help increase the productivity and profitability of urban agriculture. Productivity in small-scale urban agriculture is still generally low as result of a lack of (or inappropriate) support services (extension, access to credit, infrastructure development), limited access to productive resources and secure land tenure. This would require improvement in technical capacity and extension capability in most cities.
27 UrBAN AGrICULTUre: FINdINGS FroM FoUr CITY CASe STUdIeS
The development of good crop and livestock practices among urban producers requires capacity strengthening and technical assistance in the following areas:
• Small-space intensive technologies for intra-urban producers involving combined, coordinated government and NGO support;
• Improved processing and marketing capacity, especially for commercial peri-urban farmers, including identification of and shifts towards more profitable production systems in response to market demand and/or adding value to primary produce (Nyapandi and others 2010), the provision of entrepreneurial training to build reliable and sustainable markets to facilitate the sale of local products, and promote regional organic green markets (Prain and others 2010);
• Artificial insemination services, balanced feeding advice and guidelines and requirements for hygiene and safety for livestock farmers;
• Appropriate technologies for constraints such as limited land holdings, unavailability of clean water for irrigation and poor waste management, as recommended by the Kenyan draft National Urban Agriculture and Livestock Policy (2010). Such support would also promote the adoption of high value crop and livestock enterprises, for example, horticulture and small livestock;
• quality control methods such as in-feed formulation and integrated crop management practices to reduce or eliminate use of agrochemicals;
• Regular and effective inspection and control on the use of agrochemicals and veterinary drugs;
• Use of treated wastewater, together with information for producers and consumers on how to manage potential health risks related to use of untreated wastewater (e.g., adapting crop choice and/or irrigation practices; washing and cooking of produce before eating); and
• Gender equity issues regarding access to extension, land and financing.
3 .3 .2 Increasing access to financing
Access to credit and other sources of financing (e.g., subsidies and grants) are crucial to further investment in agricultural production and/or processing and marketing activities. Government grant schemes can be revised so that urban producers can apply, as is proposed in countries such as Brazil and India. Other needs include:
• Better quantification of the demand for credit and finance among small urban producers;
• Better information about producers’ repayment capacity. Lessons could be learnt from successful small-scale loan schemes such as in Bangladesh, especially about methods for handling small loans and strengthening repayment;
• Producer training in business development skills, preparation of business plans, assistance with loan applications and record-keeping;
• Specific (municipal) guarantee schemes to financial institutions providing loans to small-scale urban producers;
• Establishment of a co-funding facility for multi-stakeholder urban and peri-urban agriculture projects to encourage local financing of urban agriculture by local authorities, credit institutions and private enterprises; and
• Crop insurance schemes for producers and guarantee funds for credit institutions to reduce risk, as in Beijing, China, for example, where the local government set up an insurance system for 18 different types of crops and animals that engaged over 1,600 urban farming households in 2007 (Dubbeling 2011).
3 .3 .3 Strengthening producer organizations
A low degree of organization hampers producers’ efforts to obtain a stronger market position, undertake processing and engage in direct marketing and limits the capacity to represent the political interests of producers. There have been many calls for the strengthening of existing producer organizations and promoting the formation of new ones, so as to enhance their participation in policy lobbying and marketing. The formation of viable farmer groups and farmer-based enterprises with gender equality can be promoted to enhance their knowledge, skills, and access to resources, and for stronger bargaining power in inputs, marketing and access to financing. Empowerment of women farmers requires priority attention. Formation of women farmer networks to deal with agriculture-related activities can further strengthen the household economy. The strength of women’s social networks and co-operative efforts offer opportunities for development strategies in the urban agriculture sector (Hovorka and others 2009). Women’s groups and their urban agriculture collective practices can be promoted and supported, and thus recognized as social and political actors.
reCoMMeNdATIoNS For deCISIoN-MAKerS 28
3 .3 .4 Promoting value-chain development and direct producer-consumer marketing
Several supermarkets and hypermarkets in the cities of Accra, Nairobi and Lima have started to link up with urban vegetable producers to source supply for their customers, including for organic vegetables in Lima. As this relationship expands, employment will be created and income levels of producers will rise. The results of a major RUAF Foundation project to promote value chain development and direct marketing in 17 cities around the world (De Zeeuw 2010, Dubbeling 2011) show that local urban agriculture value chains that link local producers more directly to urban consumers do have a place in the urban food system, even though global products, markets and corporations increasingly dominate it. Local, safe and healthy production is the main reason for urban consumers to buy produce that addresses their social and health concerns. This is best done by establishing direct relations with consumers and selling products:
• Vegetable box schemes delivering urban farm produce to schools, hospitals, international organizations and offices, as is done for example in Cape Town, South Africa and Freetown, Sierra Leone;
• Producer kiosks, fairs, and markets as in Lima and Accra; and
• Direct sales to restaurants and supermarkets, including use of marketing strategies that emphasize that the produce is local (or local varieties/breeds), produced by low resource producers/women, organic, safe, and that make use of logos that stress product qualities, as in Bulawayo, Zimbabwe; Bobo Dioulasso, Burkina Faso
and Beijing, China, Amman, Jordan and Sana’a, Yemen (an example is the “Responsible Production Protocol” used in Amman and Sana’a, which provides guarantees on production location, ecological quality and ethical production standards).
3.4 The Broader View: Beyond the City
National level and broader sectoral policies can also help to strengthen urban agriculture’s role within the city. So, for example, although typically general agricultural policies and plans do focus on linking production with (urban) markets, these aspects are dealt with in a general way and do not differentiate between different types of production systems, such as rural, peri-urban and intra-urban. They therefore easily underestimate the contribution of urban and peri-urban production to income and employment generation. At the same time, commercial urban agriculture, agro-processing and value addition activities are often not well addressed (Dubbeling and Pasquini 2010). Yet the fact remains that the food needs of cities will always need to be met through rural agricultural production, supplemented to varying extents – and as illustrated through the case studies in this report – by urban agriculture. In setting broader sectoral and national policies, governments can recognize the role that urban agriculture plays in cities, particularly for food security, income generation, and livelihoods. Where possible, such policies could also facilitate urban agriculture, particularly for those aspects of inputs (financing, extension services) and market linkages mentioned above.
29 UrBAN AGrICULTUre: FINdINGS FroM FoUr CITY CASe STUdIeS
ReferencesAcharya, A., D. Hoornweg and M. Dubbeling. 2011. “Urban Agriculture is Climate-Smart: Thinking Outside the Box on Climate
Change.” In Low Carbon Cities, chapter 7.2. World Bank publication for the Government of China. Washington, DC: World Bank.
Cabannes, Y. 2011. “Financing Urban Agriculture, Current Challenges and Innovations.” Urban Agriculture Magazine 25: 32-35. Leusden, The Netherlands: RUAF Foundation. http://www.ruaf.org/node/2372
De Zeeuw, H. 2010. “Strengthening Urban Farmer Organisations and their Marketing Capacities: The RUAF “From Seed to Table” programme.” Urban Agriculture Magazine 24: 11-16. Leusden, The Netherlands: RUAF Foundation. http://www.ruaf.org/node/2265
De Zeeuw, H. and M. Dubbeling. 2009. “Cities, Food and Agriculture: Challenges and the Way Forward.” RUAF Working Paper 3. Leusden, The Netherlands: RUAF Foundation. http://www.ruaf.org/sites/default/files/Working%20paper%203%20%20Cities%20Food%20and%20Agriculture.pdf
Dubbeling, M. 2011. “The RUAF “From Seed to Table” Programme; an Approach to Participatory Innovation in Small-scale Urban and Periurban Agriculture Production, Processing and Marketing.” Urban Agriculture Magazine 25: 51–53. Leusden, The Netherlands: RUAF Foundation. http://www.ruaf.org/node/2377
Dubbeling, M. and H. De Zeeuw. 2010. “Urban Agriculture and Climate Change Adaptation, Ensuring Food Security Through Adaptation.” In Resilient Cities: Cities and Adaptation to Climate Change—Proceedings of the Global Forum 2010, ed. K. Otto-Zimmermann, chapter 44. Springer Science and Business Media B.V.
Dubbeling, M. and M. Pasquini. 2010. “The Growth of Cities in East-Africa: Consequences for Urban Food Supply.” Paper developed for the World Bank. Leusden, The Netherlands: RUAF Foundation.
Dubbeling, M., H. De Zeeuw and R. Van Veenhuizen. 2010. “Cities, Poverty and Food, Multi-Stakeholder Policy and Planning in Urban Agriculture.” RUAF Foundation and Practical Action Publishing. http://www.ruaf.org/node/2387
FAO (Food and Agriculture Organization). 2011. “Food, Agriculture and Cities, Challenges of Food and Nutrition Security, Agriculture and Ecosystem Management in an Urbanising World.” Food for the Cities multi-disciplinary initiative position paper. Rome, Italy: FAO.
Hovorka, Alice, Henk De Zeeuw and Mary Njenga. 2009.” Women Feeding Cities- Mainstreaming Gender in Urban Agriculture and Food Security.” UK: Practical Action Publishing, Rugby. http://www.ruaf.org/node/2290
Nyapendi, R. et al. 2010. “Identifying Market Opportunities for urban and Peri-urban Farmers Kampala.” In African Urban Harvest: Agriculture in the cities of Cameroon, Uganda and Kenya, ed. Prain, G., N. Karanja and D. Lee-Smith. Springer, New York / International Development Research Centre, Ottawa / International Potato Centre/Urban Harvest, Lima.
Prain, G., N. Gonzales, B. Arce, J. Tenorio. 2010. “Organic Vegetables on the Peri-urban Interface: Helping Low Income Producers Access High Value Markets in Lima, Peru.” Acta Hort. (ISHS) 881:117-123. http://www.actahort.org/books/881/881_11.htm\
ANNeX A 30
annex a: Methodology of the Case Studies
Objectives
The overall objective of the case studies was to determine the contribution of urban agriculture to livelihoods, urban resource use and the urban environment by assessing urban agriculture activities in the selected cities (Accra, Nairobi, Lima, and Bangalore).
The specific objectives included:
a) Analyzing the presence, forms and roles, of urban agriculture in contributing to food security, nutritional health and economic and social livelihoods;
b) Evaluating a standardized inter-disciplinary data collection protocol in order to facilitate more systematic data collection in cities in the future and to enable comparisons to be made across cities and over time; and
c) Building a better understanding of the constraining and facilitating factors for development of successful urban agriculture programs and making recommendations for city- and country-level policy makers.
Study Design
This section describes the design of the overall case studies, selection of cities, sampling areas, and study methods used in this survey.
Focus on the urban poor and direct poverty alleviation from agriculture
The study focuses on urban agriculture practiced by poor urban households and its direct poverty reduction effects through improved food security (i.e. availability and access) and nutritional health and as a source of income. It also identifies the factors constraining and facilitating the development of pro-poor urban agriculture.
The study thus excludes urban agriculture that is practiced by and benefits better-off households, especially urban livestock keeping in some locations (Karanja et al 2010). In some cases poor urban households earn income as laborers in these household or commercial enterprises. Such casual employment benefits are not captured in this study.
A second type of potential indirect poverty reduction effect of urban agriculture excluded from this study relates to price impacts, such as when cheap food produced through
urban agriculture benefits poor urban consumers who may or may not produce their own food. The poverty reduction effects of these exchanges and the relative importance of different channels needs further study.
Selection of the case cities
The four case cities were selected for their representation of different geographic locations and a diversity of urban agriculture systems. They were also selected because of the presence of experienced local research teams, secondary data availability on urban agriculture and for being considered (moderately) supportive of urban agriculture.
Random sampling of study areas and respondents
As outlined, the study sought to assess the contribution of different types of urban agriculture to poor households that are involved primarily in growing crops or rearing animals for home consumption or in earning income from agricultural sales to markets.
To capture this variation between different types of urban agriculture, a sample was drawn from administrative units (AU) of the city located along a transect from the inner city to the peri-urban interface in the following areas:
• Urban, characterized by either inner city, heavily built up area or more recently built up areas with more open spaces (two AUs);
• Peri-urban transition, referring to areas on the city fringe experiencing intensive urban development (1 AU); and
• Peri-urban, including areas with strong agricultural presence mixed with limited development (1 AU).
The “transect” is not a literal straight line from city core to periphery, but intends to capture the historical and physical development of cities which is very variable, but which often leads to similar patterns of high density settlement in the older part of the city, and newer, medium density urban settlements and declining density on the periphery, where nevertheless intensive urban developments are often also found.
“Target Settlements” were selected in the AU’s and random samples of producer and non-producer households were taken (a minimum of 600 producer households and 300 non-
31 UrBAN AGrICULTUre: FINdINGS FroM FoUr CITY CASe STUdIeS
producing households per city). To reflect likely distribution of overall population, it was proposed to distribute the sample across the three areas of the city mentioned above in the following way: 300 producer and 150 non-producer households from the urban area and 150 producer and 75 non-producer households in each of the peri-urban transition and peri-urban areas.
A household was defined as a “producer” if at least one family member was currently practicing urban agriculture. Here, urban agriculture refers to either growing crops or rearing animals or both, which could be for sale or personal consumption. If there was no family member involved in any form of urban agriculture, the household was referred to as a “non-producer.”
Study Methods Used
Each city case study describes in greater detail the methodology followed and the variations in each city.
a) Primary survey data collection: Households were selected randomly within the “target settlements” distributed along the urban to peri-urban transect to capture variability in practices under variable geographical and land use conditions. Six hundred producers were interviewed, and a sample of 300 non-producers was taken along the same transect in the same or close-by settlements as a control group. Through use of a livelihood survey, data were collected on existing physical infrastructure and services at the household level; on occupations of both the household head and the household; on different indicators of social capital and on the role that agriculture plays in household
income streams. Household vulnerability perceptions were collected in relation to environmental and economic stresses and shocks. Through a food security survey, data on food consumption and perceptions of food and nutrition security and vulnerability data were collected. This included food recall and consumption of various food items, data on cash savings from crops and livestock, seasonable variability, etc.
b) Focus group discussions: Separate group discussions were conducted with women and men producers and with women non-producers to supplement information from the surveys. Information especially targeted in these discussions was related to seasonal and longer term changes in agricultural and food security issues and more qualitative perceptions of agricultural and food-related practices and their income effects.
c) Secondary texts and numeric data: The studies also drew on national household survey data as well as specific urban household surveys and urban agriculture project data where available.
d) Geo-spatial datasets and images: The study drew on available GIS and maps to help construct “city anatomies” and select the administrative units to be sampled as well as to understand the ecological, topological and socio-economic contexts under which urban agriculture is practiced in the different cities and in different neighborhoods of each city.
e) Food groups: Table A1 shows the classification of food groups and the types of food associated with each of these groups. Respondents were asked to list the foods consumed in the 24-hour recall which were then categorized into various groups.
Table A1: Food groups consumed and the types of food in each group
FOOD GROUP TYPES OF FOOD
Cereals and grains Rice, bread, noodles, maize, sorghum, or other cereal or grain
Yellow/orange vegetables Pumpkin, carrots, yellow/orange sweet potatoes or orange vegetables
Tubers Potatoes, cassava, yam, white sweet potatoes, cooking banana or other tubers
Green leafy vegetables Spinach or kale
Other vegetables Cabbage, celery, leek or tomatoes
Yellow/orange fruits Mangoes, papayas, coconut or yellow orange fruit (excluding oranges and lemons)
Other fruits Citrus fruit, bananas, passion fruit, apples or grapes
Other meat Beef, pork, goat, lamb, chicken or other offal
Eggs Eggs
Fish Fresh or dried fish or shellfish
Legumes Beans, peas, lentils, peanut or nuts
Milk or milk products Cheese, yogurt, milk or other milk products
ANNeX A 32
References
Karanja, N., M. Njenga, K. Gathuru, A. Karanja and P. Muendo Munyao. 2010. “Crop-Livestock-Waste Interactions in Nakuru’s Urban Agriculture.” In African Urban Harvest: Agriculture in the Cities of Cameroon, Uganda and Kenya, ed. Prain, G., N. Karanja and D. Lee-Smith. Springer, New York / International Development Research Centre, Ottawa /International Potato Centre/Urban Harvest, Lima.
33 UrBAN AGrICULTUre: FINdINGS FroM FoUr CITY CASe STUdIeS
Part 1: Livelihoods Survey
Section A: Interview Details
A01. ID
A02. District
A03. Target Settlement (YesGo to A11)
A04.-06 Date (day/month/2010)
A08. Are you household head?
A09-A10. Who is the household head (HH) in relation to you?
A11. How many people live in this household?
Section B: Human Capital – Household Head
B01. Age
B02. Sex
B03. When s/he arrive at this site?
B04-05. Marital status
B06-07. Primary occupation over the last one year
B08. Days a week devoted to occupation
B09-10. Secondary occupation over last one year
B11. Days a week devoted to occupation
B12-13. Highest level of education
B14. How many years has the household head studied in total?
Section C: Human Capital – Household
C01. Age
C02. Sex
C03. When s/he arrive at this site?
C04-05. Marital status
C06-07. Primary occupation over the last one year
C08. Days a week devoted to occupation
C09-10. Secondary occupation over last one year
C11. Days a week devoted to occupation
C12-13. Highest level of education
C14. How many years has the household head studied in
total?
Section D: Physical, natural and financial capital
D01-02. Material used for walls in the residential main house
(majority of the walls)
D03-04.Material used for flooring in the residential main house
D05-06.Material used for roofing in the residential main house
D07. State of the dwelling
D08. How many rooms are in the house?
D09. Do you have access to a latrine/toilet?
D10-11. What type of toilet facilities do you use?
D12-13. During the dry season, what is your primary source of
water for household use?
D14-15. During the wet season(s), what is your primary source
of water for household use?
D16-17. What is the main source of fuel for cooking in this
household?
D18-19. What is the main source of lighting in this household?
D20-21. What is the ownership of this house and the land on
which located?
D22-23. Is there allocated space/housing for animals?
annex b: Survey Questionnaire
ANNeX B 34
D24-37. For the following assets, please tell me how many
assets the HH has access to at the present time, and whether
your HH owns them, or if they are shared with others
lending services__ E04.Health facilities__E05.Social support
programs__ E06.NGO/CBO support services__ E07.Local
government services__ E08.Local savings/self-help groups__
E09.Other:___
E10-13. Does your household receive any products or services
from relatives or neighbors?
E14-17. Does your household give products or services to
other households?
E18-28. What kinds of exchange of goods or services have you
had with rural relatives?
E29-39. What kinds of exchange of goods or services have
you had with urban relatives/neighbors?
Section F: Vulnerability and coping
F1-17. In the past year, how many times has your household
experienced the following problems/crises? What were your
coping strategies?
a. Number of times;
b. Coping strategy
F1.Crop loss due to bad weather__ F2.Damage to crops by
animals__F3.Failed harvest due to pest/disease__ F4.Failed
harvest due to harassment__F5.Price collapse__F6.Household
food shortage__ F7.Serious illness of HH member__ F8.Death
ANNeX B 36
of HH member__ F9.Arrest of HH member__ F10.Divorce__
F11.Abandonment__ F12. Loss of job__ F13.Eviction__ F14.
Confiscation of assets__ F15.Loss of land__ F16.Theft of
livestock__ F17.Killing of livestock by police__ F18.Theft of
household goods__ F19. Illness of non-HH family__ F20.
Other:___
Part 2: Food Security Survey
Section 1: Food consumption and food sources
1.1 Food consumption during previous 24hrs.
a.Type of “meal” or “between meal,”
b. Time of eating,
c. Name of food preparation,
d. Name of ingredients used
1.2 Self-produced food items consumed in previous 24hrs.
a.Domestic space, plot or coral; b. Own plot away from the
house; c. Plot or coral in rural area; d. Approximately how
many times were the sel-produced foor items comsumed
during the previous week?
1.3 Of all foods eaten last week, were some of the food
preparations/ítems:
01. Bought fresh and prepared in the house? __ 02. Bought
from a restaurant, eatery, kiosk, autonomous food kitchen, on
the street, etc.?__ 03.Obtained through a Government social
program such as subsidized community kitchens, children’s
milk programs, food for work, etc.?__ 04.Received as a gift
(from relatives neighbors, etc.)?__05.Other:___
1.4 What was the most important source of food during the
last week? (Insert one of codes from above in 1.3)
1.5 What was the second most important source of food
during the last week? (Insert one of codes from above in 1.3)
1.6 Mark in the space if the family ate or drank any of the
foods in each of the food groups listed below.
01. Cereal or grain__ 02. Yellow/orange vegetables__ 03.
Tubers__ 04. Green, leafy vegetables__ 05. Other vegetables__
06. Yellow/orange fruit__ 07. Other fruits__ 08. Liver, kidney,
heart, or other organ meat__ 09. Other meat__ 10. Eggs__ 11.
Fish__ 12. Legumes__ 13. Milk or milk products__ 14. Food
made with oil, fat, margarine, or butter__ 15. Sugar__
1.7 Is the respondent involved in own agricultural production?
(YesContinue with section 2.1, NoGo to Section 3).
Section 2
2.1 How does the consumption of your own food production
affect your family? (Choose all answers that apply)
01. It saves money for purchase of other types of food__02.
Can you put a value on savings of food purchases?__03.
Approximately how much money is saved?__ 04. It saves
money for other household purchases__ 05. Can you put
a value on savings for other household purchases?__ 06. It
provides extra food__ 07. It provides a more diverse diet__
08. In has an effect in another way?__ 09. Little or no effect
Section 3: Food Security
3.1 Which of the following statements best describes the
food situation at your home in the last four weeks?
2. We always eat enough of what we want__ 02. We
eat enough but not always what we would like__03. We
sometimes do not eat enough__ 04.We frequently do not
eat enough
3.2 Why do you not eat enough or eat what you would like at
home? (Choose all answers that apply)
01. We do not have enough money to buy food__ 02. It is
difficult to access the store__ 03. We are dieting__ 04. We
do not have a stove that works__ 05. We cannot eat/cook
due to health reasons__ 06. We have not stored enough
food for the year__ 07.Other:___
37 UrBAN AGrICULTUre: FINdINGS FroM FoUr CITY CASe STUdIeS
3.3 In the last 12 months.....
a. Yes/No;
b. How often this happen?
3.3.1 Did you ever worry that your household would run
out of food before you would be able to get more money
to buy or could acquire more?__ 3.3.2 Were you or any
household member not able to eat the kinds of foods you
want because of lack of money?__ 3.3.3 Did you or any
household member have to eat a limited variety of foods
due to a lack of money?__ 3.3.4 Did you or any household
member have to eat some foods that you did not want to
eat because of a lack of money to obtain other types of
food?__ 3.3.5 Did you or any household member have to
eat less (portion size) in a meal than you wanted because
there was not enough food?__ 3.3.6 Did you or any
household member have to reduce the number of meals
eaten a day because there was not enough food?__ 3.3.7
Was there ever no food to eat in your household because
of lack of money to get food?__ 3.3.8 Did you or any
household member go to sleep at night hungry because
there was not enough food?__ 3.3.9 Did you or any
household member go a whole day and night without eating
anything because there was not enough food?______
3.4 Were the children in the household also affected or was it
just the adults?
ANNeX C 38
annex C: a note on the Challenges of the Survey Data
The results shared in this study should be considered with a degree of caution due to inconsistencies detected in the different stages of the survey process. Some of these problems are related to limited representativeness of the case cities, differences in definitions, simplification of sampling design, complexity in questionnaire design, and extrapolation of results.
Limited representation of the case cities
The four study cities are all national or state capitals and are representative of large cities. Nevertheless, the study does not capture the rapidly changing conditions in smaller urban centers and their surroundings that highlight even more acutely the issues of sustainable urbanization and development and their integration with rural surroundings. Capacities of smaller cities for planning and implementation can be weak, while in some countries processes of decentralization and devolution are loading them with increased roles and responsibilities. (Tacoli and Satterthwaite 2003).
Problems related to the selection of research sites along the urban, transition, and peri-urban transect
Another problem faced in this study was the difficulty in defining certain key concepts. The study proposed three different locations—urban, peri-urban transition, and peri-urban—in each city in order to capture the dynamism of cities in relation to the practice of urban agriculture. However, definitions of “urban” were not always evident, especially in Bangalore and Accra, as “urban” is used both as a geographic as well as an administrative concept. In both these two cities, efforts were made to solve this problem by using administrative units to define each of the locations. In Bangalore, the Greater Bangalore municipal body (BBMP) refers to an administrative category relating to Indian “metropolitan cities” (cities with over 4 million inhabitants), but are geographically quite narrowly defined. The researchers for the Bangalore study use this administrative unit to define the urban sampling area. In parallel with this unit, there also exists a state-based administrative structure, which divides states into districts. In Karnataka, where Bangalore is located, there are 30 districts, one of which is the “Bangalore Urban District” which is geographically much broader and includes the BBMP and its hinterland. The study includes the urban,
peri-urban transition, and peri-urban sampling areas within this district. Similar problems arose in Accra, though not in Nairobi, where the urban site is located in the central part of Nairobi Province, the peri-urban transition site on the fringes of that province and the peri-urban site in the adjoining Central Province, which is being steadily absorbed into the economic, social, and ecological fabric of the city, if not yet the administrative. In Lima, the province-level administrative structure incorporates districts, which exhibit urban, transition, and peri-urban characteristics.
Definition of urban agriculture used
The definition of urban agriculture presented some variations among the four cities. In the case of Nairobi and Bangalore the definition of Luc Mougeot was used: “An industry located within (intra-urban) or on the fringe (peri-urban) of a town, a city or a metropolis, which grows or raises, processes and distributes a diversity of food and non-food products, re-using largely human and material resources, products and services found in and around that urban area, and in turn supplying human and material resources, products and services largely to that urban area” (Mougeot 1999). Though the notions of both “intra-urban” and “peri-urban” are used in the definition, for simplicity this paper sticks to the standard expression ”urban agriculture” encompassing both forms. The Accra study uses a similarly broad definition, but without the ecological dimension (“…the practice of farming within and on the boundaries of towns or cities…involves crop cultivation, animal rearing, and fish farming. A person or household is classified a producer even if he or she has one plant of plantain or one fowl in the survey area…within compound, outside the dwelling, on open spaces within the city owned by the public or private institutions or individuals”). The Lima study refers to having used a wide definition, “of (agricultural) producer, which varied between households growing a few herbs in a pot to commercial farmers with large plots.”
Comparison between groups
Another definition that introduced some complexity was the comparison between producers and non-producers. Particularly in Lima, the large number of households with micro-scale production reduced the likelihood of finding
39 UrBAN AGrICULTUre: FINdINGS FroM FoUr CITY CASe STUdIeS
significant differences in food security, vulnerability, or
income between the two groups.
Sample design
The sample design presented another problem in this study.
In each city, a higher number of households were chosen to
be surveyed in urban areas than in the peri-urban transition
and peri-urban areas as the former tend to have a much
higher number of residents than in the other locations, and
this stratification would ensure proper representation of the
sub-population groups. Random sampling was chosen as the
methodology for this survey design; however, the same sample
size was maintained for all cities. If considerations about the
differences in populations and the characteristics of each city
had been taken into account, the sample size would probably
have varied. Therefore, if this study was performed again
with new samples, the results would probably be somewhat
different. This also makes it harder to draw conclusions about
the wider population.
Questionnaire design
The design of the questionnaire presented other difficulties
for the analysis of this study. Some questions appeared to
be complex for the respondents to answer, especially those
related to expenditures, as many could not recall expenses
and calculating proportions proved to be difficult. Therefore,
the results were instead framed to see how families
prioritized their expenses under each category, which were
then interpreted as trends. Similarly, in the section about food
security the lack of data on portion size of foods consumed
during the previous 24 hours was not captured in the 24-hour
recall. Some questions also had a high “no response” rate,
which may reflect the complex questionnaire design. Finally,
although the surveys were led by teams consisting of senior
researchers and data were collected by enumerators/students
or other persons with ample experience in food security and
income data collection in low-income areas, problems in data
collection were presented.
Extrapolation of results to city level
Although administrative units and target settlements in
each city were selected based on their representativeness,
this was only for a segment of the total population, namely
where low-income households were concentrated and these
were purposively located where some form of agriculture was
being practiced in different (urban and peri-urban) locations.
This means that direct extrapolations to the city level cannot
be made regarding total numbers of households engaged
in urban agriculture activities and types of practices, but
we can cautiously draw solid generalizations based on the
quantitative data collected.
ReferencesMougeot, Luc J.A. 1999. “Urban Agriculture: Definition, Presence, Potentials and Risks.” In Growing Cities, Growing Food:
Urban Agriculture on the Policy Agenda, ed. Bakker, N. et al. Feldafing: Deutsche Stiftung für internationale Entwicklung (DSE).
Tacoli, C. and D. Satterthwaite. 2003. “The Urban Part of Rural Development: The Role of Small and Intermediate Urban Centres in Rural and Regional Development and Poverty Reduction.” Rural-urban Interactions and Livelihood Strategies, Working Paper 9. London: International Institute for Environment and Development.
ANNeX d 40
annex D: bangalore (India) Case StudyBangalore, also called Bengaluru, is the capital of the
state of Karnataka in south India. It is the sixth largest urban agglomeration in the country (Thippaiah 2009) with a population of over 9.6 million (2011 census), and an estimated population density of approximately 4,300 people per square kilometer. (Bose 2011). Some key facts of Bangalore such as population and climate are summarized in Table D1.
Table D1: Key facts of Bangalore
Area (km2) 741 (2009)
Population density (inhabitants/km2) 7827 (2009)
Annual population growth rate (%) 3.6 (2011, based on decadal average)
% of national population 0.6
% of urban population 1.8
Poverty level as % of total city population
N/A
Climate Tropical savannah
Major geographical features Plateau
Elevation (m above sea level) 920
Average annual rainfall (mm) 970
Average low/high temperatures (°C) 15/34
Economy
Bangalore was a cantonment of the British Empire in India and the capital of the Princely State of Mysore. Once known as the “Garden City” of India, the city has experienced immense economic growth over the past two decades, mostly attributed to the Information Technology (IT) sector, and is now known as the “Silicon Valley of India.” Bangalore contributes approximately one-third of India’s total IT exports and also has a growing biotechnology industry. In 2012, Bangalore had a GDP of $83 billion, and is ranked fourth among the top cities contributing to India’s GDP.
Bangalore was the fastest-growing city in India after New Delhi between 1991 and 2001, with a growth rate of 38 percent during the last decade. A large proportion of this growth can be attributed to migration. As with many other large cities in the world, Bangalore absorbs a large population of migrant workers, who constitute 6.2 percent of the city’s population. Women constitute 47.5 percent of Bangalore’s population. Bangalore has the second highest literacy rate (83 percent) in an Indian metropolis after Mumbai.
Approximately 20 percent of the population lives in slums. (CIRJE 2008) This is considered relatively low compared to other cities in India and in cities with the same socio-economic characteristics elsewhere. The slums are home to families who have lived there for several generations. The slums are recognized by the city, which provides them with basic services. Furthermore, there are many informal settlements and slums on the periphery of Bangalore that are occupied mostly by temporary migrant workers and are not recognized as slums by the city.
Administration
Bangalore-Urban district is one of 30 districts that together form the state of Karnataka. This district is further divided into four smaller administrative units (Bangalore North, Bangalore East, Bangalore South, and Anekal) referred to as taluks, as shown in Table D2. Bangalore city is an area carved out of the four taluks, and as the city has expanded over time, it has spread across the taluks. The population density of 8,300 persons per square kilometer in Bangalore city is considerably higher than the four taluks, which each have about 500 persons or less per square kilometer.
Based on data provided in Jyotishi, A., P. Amerasinghe, S. Acharya, V. Kumar, C. G. Yadava, R. S. Deshpande. 2011. Urban Agriculture: A Sustainable Solution to Alleviating Urban Poverty, Addressing the Food Crisis, and Adapting to Climate Change— Case Study Bangalore, India. (Unpublished).
Table D2: Demographics of the sub-districts in Bangalore (2001 census) (Government of Karnataka 2009)
Taluk Area (km2) Total Population
Rural Population
Urban Population
Population Density
(per km2)Sex Ratio
Anekal 532 298,580 240,312 58,268 561 883
Bangalore North 490 196,131 196,131 - 400 930
Bangalore South 381 91,800 91,800 - 240 925
Bangalore East 96 53,346 53,346 - 556 929
Bangalore City 709 5,897,267 - 5,897,267 8,318 908
41 UrBAN AGrICULTUre: FINdINGS FroM FoUr CITY CASe STUdIeS
Forest Land not available for cultivation Other uncultivated land Area Sown
3,094
1,145
35,841
12,287
1,345
5,769
5,398
2,7163,735
17,310
7,746
219,36730,246
55,924
78,652
54,545
350
2,0992,741
Fallow land
116,347
17,643
19,508
60,814
5,0552,215
The city of Bangalore is under the jurisdiction of the
Bruhat Bengaluru Mahanagara Palike (BBMP) or the Greater
Bangalore Municipal Corporation. The city is divided into
eight zones and 198 wards for administrative purposes.
Climate
Bangalore is situated on the Deccan Plateau, at an
elevation of 900 m (2,953 ft), which provides the city with a
moderate climate throughout the year. The hottest month is
April with an average temperature of 28°C (82.4°F) and the
coolest is December with an average of 21.1°C (70°F). The city
experiences rainfall during both the northeast as well as the
southwest monsoons and gets an average of 974.5 mm (38.3
inches) of rain a year.
Water Resources and Land Use
There are no perennial rivers in Bangalore although a major river, the Cauvery, is about 140 km away. Bangalore receives 80 percent of its total water supply from the Cauvery. There are several natural lakes in the city and its vicinity, which impound rainwater and contribute to groundwater recharge. Some of these lakes were designed in cascades from higher to lower elevations and constructed in the 16th century to meet the city’s water needs. In the early part of the 20th century, the Diwan (administrative head) of Mysore commissioned the Nandi Hills waterworks to provide a water source for the city. Over the years, unplanned urban growth, encroachments, and pollution have reduced the number of lakes. Furthermore, indiscriminate discharge of domestic
Figure D1: Land use patterns in Bangalore sub-districts (Government of Karnataka 2009)
ANNeX d 42
sewage and industrial effluents in to the lakes has resulted in high levels of contamination.
The Bangalore-Urban district has a total area of 219,367 ha of which 5,055 ha is forest. A large portion of the land (116,347 ha) is neither zoned nor is available for urban and peri-urban agriculture. A considerable amount of land remains uncultivated or fallow in the district. Figure D1 shows the land use classification in the various taluks that make up Bangalore-Urban.
Urban Agriculture in Bangalore
As with the other three case studies, Bangalore was chosen due to the strong presence of urban agriculture in its urban and, particularly, peri-urban areas (Box D1 provides details of the survey methodology used in Bangalore). The study specifically targeted the disadvantaged groups involved in urban agriculture and discovered that involvement in urban agriculture seems to have a positive effect on their livelihoods. The study showed that families who are more established in the area are the ones involved in agriculture and sericulture
production and concluded that the high cost of initiation of
urban agriculture activities is one reason for such a pattern.
Farmers and agricultural laborers do not constitute a
significant percentage of the labor force in Bangalore.
Understandably, Bangalore City only has a small percentage
of agricultural laborers (1.2 percent) and no cultivators, which
brings down the average for the whole urban agglomeration
to 2.6 percent. (Government of Karnataka 2009) There are
many more cultivators and, to a lesser extent, laborers, in
the four other administrative units. Of these, Anekal has the
highest percentage of agricultural laborers (34 percent) and
Bangalore North has the most number of cultivators.
The majority of the landholdings range from one to four
hectares (see Figure D2). Hence, most agricultural laborers
work on marginal and small land parcels. Given that land-use
patterns in Bangalore are changing due to increasing land
values and real-estate development pressures, agricultural
land is frequently converted to non-agricultural uses. For
instance, construction of an international airport a few years
ago took over 1,000 hectares of agricultural land.
Box D1: Survey methodology for the Bangalore case study
Bangalore’s urban development has radiated outwards from the city center along five major roads. The research team chose sites and target settlements along these main roads based on this urbanization trend, census data, and Bangalore’s Master Plan for 2015. The Master Plan envisions structured continuity in five spatially organized concentric belts, with agriculture pushed to the outer perimeter (refer to Box D2 for more information about the Bangalore Master Plan 2015).
The research team conducted transect walks to understand the nature of the distribution of potential target settlements. Target settlements were chosen by walking north and south of each of the arterial roads, starting from the center of the city and moving towards the perimeter of the district boundary. In the team’s opinion, this was the only way to capture all types of food production systems linked to urban agriculture.
The municipality of Bangalore, referred to as the Bruhat Bengaluru Mahanagara Palike (BBMP), has all the characteristics of an urban area and was thus designated as such. Beyond the BBMP boundary the density of buildings decreased and more land was found under cultivation. After carefully studying land-use patterns and changes in density, the research team established buffer zones of 2 km and 5 km to designate the peri-urban transition zone and the peri-urban zone, respectively.
Target settlements were then chosen randomly in the BBMP and buffer zones and classified as urban, peri-urban transition, and peri-urban based on the classification and boundaries defined by the team. Next, a random sampling of producer and non-producer households was undertaken in the target settlements. As expected, producer households were farther apart in the urban zone and a larger number of areas had to be sampled. Moving away from the city center, more households per square area could be found engaging in urban agriculture.
Overall, 68 percent producers and 32 percent non-producers from similar socio-economic backgrounds were sampled. An Asset Based Wealth Index was used as income information was not always reliable. In addition and for the qualitative evaluation of urban agriculture activities, 15 focus group discussions, comprising 24 males and 61 females, were held in the areas where sampling was carried out.
Table D3: Distribution of producer and non-producer groups along the transect zones in Bangalore
Type/Region Urban (28 settlements)
Peri-Urban Transition (11 settlements)
Peri-Urban (9 settlements)
Total (48 settlements)
Producers 361 168 181 710
Non-producers 141 90 99 330
Total 502 258 280 1,040
43 UrBAN AGrICULTUre: FINdINGS FroM FoUr CITY CASe STUdIeS
Reasons for Participating in Urban Agriculture
According to the producers surveyed, the main reasons for engaging in urban agriculture are to gain additional income (58 percent) or have an additional source of food (27 percent). When asked why they had ceased production, the majority of respondents said that it was not the season for production, which may indicate that they would re-start agricultural activities in the growing season. Other significant reasons for stopping were illness in the family, lack of cash for inputs, and lack of profitability.
Length of Residence
More producers have always lived in the area compared to non-producers in Bangalore, as is shown in Figure D3. The survey showed that respondents who had moved to Bangalore 15 years prior or less tended to take up non-farming jobs compared to those who had moved to Bangalore earlier.
Types of Crops Grown
Urban and peri-urban farmers in Bangalore are primarily active in agriculture, including sericulture, and to a lesser extent in livestock rearing. Bangalore has a considerable amount of open area in terms of fallow and wasteland especially in the peri-urban areas, which provides an ideal opportunity to rear animals for meat production and other products. However, most producers in Bangalore grow crops only, followed by those who are engaged in both crop production and animal rearing, and finally a small number who only rear animals.
Crops grown in Bangalore come under two main categories: agricultural or horticultural. In terms of agriculture, farmers mostly grow cereals (paddy, ragi, jowar, bajra), maize, minor millets, oil seeds, fruit, and vegetables. Horticultural crops include all perishable vegetable crops, plantation crops (areca nut, coconut, and fruit), and flowers. The most commonly grown crops include ragi, a type of millet commonly found in south India, grown by over 60 percent of producers, and various vegetables. The main products grown by producers are summarized in Figure D4. Sericulture is also relatively well established.
Types of Animals Reared
In terms of animals, farmers raise cattle, buffalo, sheep, goat, pigs, and poultry, both for their products as well as for selling the meat. The types of animals owned by farmers vary. As shown in Table D4, 60 percent of farmers had cows and bulls, followed by goats/sheep (17 percent) and poultry (14 percent). Cows and bulls contribute to household income
Length of stay by type of producer
52
100
0
20
40
60
80
100
30 100
Non-Producers
Share of households by type, percent
Perc
enta
ge o
f hou
seho
lds
by y
ears
Producers
0
5 years or less 6 - 15 years Above 15 years Always here
Figure D3: Length of residence of producers and non-producers in Bangalore
1 - 2
Size of Land holdings in the Transect Areas
0 10 20 30 40 50 60 70 80 90 100
> 105 - 103 - 4< 1
Peri-Urban
Peri-UrbanTransition
Percentage
Urban
71.1 19.0 7.0 2.1
67.8 17.4 9.1 5.8
74.1 14.5 6.1 5.3
0.7
Figure D2: Size of land holdings in the transect areas in Bangalore (ha)
ANNeX d 44
and consumption in a significant manner. Goats/sheep are considered profitable as they double or triple in price within a short period of time and do not require much care and attention. Across the transect, urban producers had the most number of draught animals (26 percent) compared to the other areas (15 percent). In terms of products from animals, milk was mentioned as a major livestock product by 96 percent of the producers surveyed, followed by manure (24 percent), eggs (22 percent), meat (13 percent) and chicken (1 percent). Sheep rearing, wool production, and ghee were also stated as income sources by a small number of producers. Livestock rearing is especially rare in households headed by females.
Space Available for Growing Crops and Rearing Animals
In India producers are generally categorized into five types based on the size of the land owned. These include: marginal (<1 ha), small (1-2 ha), semi-medium (3-4 ha), medium (5-10 ha) and large (>10 ha). By analyzing responses of 491 out of 710 producers, it was possible to understand the distribution of the types of producers. Land ownership and classification showed that a majority of producers sampled (72
Vegetables
Major types of crops grown by producers
0 10 20 30 40 50 60 70 80 90 100
Other
Leafy vegetables
Coconuts
Fruits
Paddy
FlowersRagi
Peri-Urban
Peri-UrbanTransition
Percentage
Urban
79.4 2.8 2.1 5.7 3.5 5.0
56.9 12.1 4.3 8.6 3.4 4.3 9.5
33.0 18.5 16.0 12.5 5.0 5.0 8.5
0.7 0.7
0.9
1.5
Figure D4: Major types of crops grown by producers in Bangalore
Table D4: Types of animals owned by producers across the transect zones in Bangalore (percent)
Animals Urban Peri-Urban Transition Peri-Urban Total
Cows 25.9 14.2 14.7 54.8
Bulls 1.3 0.9 2.0 4.1
Other draft animals 0.1 0.0 0.4 0.6
Boars 0.0 0.0 0.0 0.0
Piglets/Young pigs 1.0 0.0 0.0 1.0
Mature pigs 0.6 0.0 0.0 0.6
Goats/Sheep 8.0 3.7 5.6 17.3
Poultry layers 7.6 3.5 3.1 14.2
Poultry broilers 3.9 0.4 0.6 4.9
Guinea pigs 0.3 0.0 0.0 0.3
Rabbits 0.1 0.0 0.0 0.1
Box D2: Indications of urban agriculture in Bangalore’s Master Plan 2015
Under the popular national funding structure known as the Jawaharlal Nehru Urban Renewal Mission (JNNURM), Bangalore prepared a Master Plan 2015 which defines the city’s development beyond the BBMP boundaries and identifies the Bangalore Metropolitan Area, under the Bangalore Development Authority (BDA). Bangalore’s 2015 plan organizes the city’s development in five concentric belts. The first belt includes the core city, the historic district and the administrative center and the central business district. The second is the peri-central area, which includes the older planned residential areas. The third belt includes recent extensions and includes some of the disadvantaged areas in need of improved infrastructure and services. The fourth belt encompasses the up-and-coming settlements and some agricultural land, while the fifth belt is the green belt, which includes small villages and agricultural production areas. This shows that while Bangalore’s IT industry accounts for 15 percent of its economy, city officials are also aware of the importance of the informal sector, which contributes 60-70 percent to the city’s economy; urban and peri-urban agriculture is one of such informal sectors. The 2015 plan also categorizes the city into five different zones or areas of development: old urban areas, urban redevelopment areas, residential areas, industrial activities areas, and green areas. Green areas comprise protected land zones, restricted development areas, and agricultural zones. This is another indication of the awareness of the city towards its agriculture sector.
45 UrBAN AGrICULTUre: FINdINGS FroM FoUr CITY CASe STUdIeS
percent) belonged to the marginal category, owning land less than 1 ha. Figure D2 illustrates that the highest number of marginal land holders (74 percent) is in the urban area, whereas farmers with larger land holdings (above 2 ha) were located in the peri-urban transition area followed by the peri-urban area.
Producers use land that is primarily owned by them. Gathering information on land size and ownership proved to be difficult as some producers were not sure of the size of their land holdings and figures referring to communal land skewed the overall data. Of 710 producers surveyed, 602 provided full or partial information about the current use of the land for crop and livestock production, size of the plots, ownership and location. The majority of plots were away from the homestead (39 percent). Container plot areas were high in number (14 percent), a finding that could not be completely verified during the survey.
Inputs Used for Urban Agriculture
Only 44 percent of producers have farm tools. Ten percent of non-producers also reported having tools, perhaps for gardening, as in the case of Accra. Of those producers who have tools, the most were in the peri-urban transition area (41 percent), followed by the peri-urban (40 percent) and urban (33 percent) areas.
Figure D5 summarizes the fertilizers and other inputs used for crop production. For fertilizer use, animal manure was most common (82 percent), followed by chemical fertilizers (64 percent). Preference for other types of fertilizers, such as
vegetable compost and wastewater, is low. Often, producers used a combination of different fertilizers. Since animal manure is freely available, its usage is not surprising. Often manure was obtained from the producers’ livestock or from the neighborhood. Other inputs include purchased seedlings/seeds and pesticides.
Livelihood
Most of the producers interviewed in Bangalore are involved in urban agriculture as their primary occupation. As Figure D6 illustrates, 13 percent of producers consider casual labor to be their primary occupation. On the other hand, more than 30 percent of non-producers consider themselves to be casual laborers. Other non-producers were involved in informal business or regular employment. Eighty-nine percent of households who practice urban agriculture as a primary occupation do not have a secondary occupation, while 6 percent work as casual laborers as a secondary occupation, as shown in Figure D7.
Table D5 describes the different sources of income for producers and non-producers. For those producers whose primary occupation is urban agriculture, the majority are involved in growing crops and to a lesser extent in rearing livestock. On the other hand, the reverse is true for those producers whose secondary occupation is farming: They are mainly involved in raising animals rather than growing crops.
Along the transect, there are no significant differences in the sources of income for producers except in the case of income from agriculture from both crops as well as livestock.
OtherInputs
Fertilizers and other inputs use by location
0 10 20 30 40 50 60 70 80 90
Purchased Seedlings/Seeds
Hired Labor
Water/Irrigation
Pesticides
Animal Manure
Vegetable Compost
Wastewater
Chemical Fertilizer
21
44
82
52
56
71
63
64
Percentage
Fertilizer
Figure D5: Fertilizers and other inputs used for crop production in Bangalore
ANNeX d 46
The highest number of producers involved in agriculture
are located in the peri-urban area, while the least are in
the urban area. In the urban area, casual labor is the most
important source of income for producers interviewed after
urban agriculture.
Gender-wise, no obvious positive impacts of urban and
peri-urban agriculture on women and female-headed
households could be observed. In most cases, the male adult
was responsible for planting and cultivation (62 percent), harvesting (64 percent), and marketing (76 percent), while for women it was 9 percent (cultivation), 6 percent (harvesting), and 3 percent (marketing). On the other hand, involvement of multiple household members in cultivation and harvesting (14 percent) could be a good indicator of collective family action and social entrepreneurship. Overall, it appears that male members of households play major roles in all aspects of cultivation.
Figure D6: Primary occupation of household heads in Bangalore
ProducerNon-Producer
Perc
enta
ge
Farmer
Regular employee
Informal business
Casual labor
Other
No secondary occupation
0
10
20
30
40
50
60
70
80
90
100
Primary and secondary occupation of household heads
39.8
0.6 0.1
31.5
14.5
13.6
69.2
3.22.8
13.1
11.6
No secondary occupation
Casual labor
Informal business
Medium enterprise owner
Salaried employee with benefits
Secondary occupation of farmers
88.8
5.93.50.1 1.4
Figure D7: Secondary occupation of producers in Bangalore (percent)
Table D5: Sources of income for producers and non-producers in Bangalore
47 UrBAN AGrICULTUre: FINdINGS FroM FoUr CITY CASe STUdIeS
Income from Urban Agriculture
The proportion of income from crop production along the transect is the same. No noticeable differences are noted. The majority of the producers receive more than 25 percent of their income by growing crops, as illustrated in Figure D8. However, when considering the proportion of income from livestock along the transect (see Figure D9), the majority of producers chose a “less important” percent of their income from this source in the urban and peri-urban transition areas. In the peri-urban area, just over one-third of producers chose a “less important” percent, while the others earn more.
The income status of the household head is an important indicator of the economic status of the household and household wellbeing. In the male-headed households there are only marginal differences between producers and non-producers, where more urban and peri-urban households appear to be vulnerable. In contrast, in the female-headed households, the peri-urban households of producers and non-producers appear to be more vulnerable. Overall, there are more female-headed households below poverty line than male-headed households. While it seems that the majority of practitioners of urban agriculture are above the poverty line, there were no conclusive results to prove the impact of urban agriculture on the livelihoods of female-headed households.
Figure D8: Proportion of income from agriculture in Bangalore* (percentage of households)
Proportion of income from crop production along the transect
Less important
Moderatelyimportant
Very important
12.4%
43.3%
44.3%
* Categories of income: less important: less than 25%; Moderately important: 25-75%; Very important: more than 75%.
Figure D9: Proportion of income from rearing animals along the transect in Bangalore*
Proportion of income from rearing animals along the transect
52
100
0
20
40
60
80
100
25 50 75 100
Less ImportantLess Important
Less Important
Moderately important
Moderately importantModerately important
Very important
Very important Very important
Peri-Urban
Share of households by area, percent
Perc
enta
ge o
f hou
seho
lds
by c
ateg
ory
Peri-UrbanTransition Urban
0
* Categories of income: less important: less than 25%; Moderately important: 25-75%; Very important: more than 75%.
Box D3: General state of dwellings of producers and non-producers in Bangalore
The state of the dwellings is comparable between producers and non-producers with a fairly high percentage being in good condition. Indicators such as materials used for the walls and floors are marginally better among the producers, but not significantly so. Brick and cement walls were observed in 83 percent and 85 percent of houses among non-producers and producers respectively. Only the materials used for roofing were significantly different, with more non-producers using straw/grass/plastic sheets as roofing material than producers. Across the transect, peri-urban transition households use less brick and/or cement than in the other areas.
No other indicators to describe the state of the dwelling were found to be statistically different between producers and non-producers. The average number of rooms for both groups was found to be between 1 and 3. With regard to access to latrines, the majority use pit latrines, and 15 percent of respondents openly defecate for lack of other means.
Fuel for cooking is statistically different between the two groups, but not lighting sources. Producers tend to use more firewood, while non-producers use more bottled gas and kerosene for cooking. Firewood is more commonly used in the peri-urban transition and peri-urban areas as it is more accessible and cheaper. Electricity is the most common source of lighting, followed by kerosene to a much lesser extent.
Producer households in Bangalore tend to have five people living in the home, which is significantly larger than the number of people in non-producers households (4.23).
ANNeX d 48
A comparison of the state of dwellings, between
producers and non-producers, is described in Box D3.
Expenditure
Household expenditures are assessed under various
categories such as shelter, education, food, loan/debt
repayment, and health. This part of the survey was
difficult to administer in Bangalore due to low literacy
levels compounded by reluctance to give responses due
to lack of time. Based on the responses provided in Figure
D10, both producers as well as non-producers seem to
have similar expenses within the top expense category,
followed by utilities and education. Although it seems
that producers spend more on food compared to non-
producers, the results are not significant. Only under two
categories are the differences in expenditures significant:
non-producers tend to spend more on shelter than
producers, while producers spend more in the “Other”
category than non-producers.
The data presented in Table D6 shows that across
the transect respondents in general tend to spend more
on food and shelter in the urban area compared to the
other zones. In the peri-urban transition area, it was found
that respondents spend significantly more on health than
their counterparts in other places, while in the peri-urban
area respondents spend less on clothes and more on other
expenses than others.
General Food Situation
Table D7 illustrates the impact of consumption of one’s
food produced. Fifty-six percent of respondents surveyed
said that participating in urban agriculture-related activities allowed them to save money, which was then used to purchase other types of food. Some of the commonly purchased items included ragi, rice, and wheat. In addition, vegetables, sugar, meat, and milk were also cited. Thirty-six percent of producers said that urban agriculture provided them with extra food. Other common impacts of urban agriculture cited were that it saved money for household expenses, such as appliances, children’s books, clothes, and it also saved money spent on food, where the savings ranged from INR 80-5,000.
Figure D10: Distribution of household expenditures for producers and non-producers in BangaloreDistribution of Household expenditure comparing producers
and non producers
52
100
0
20
40
60
80
100
30 100
Non-Producers
Share of households by type, percent
Expe
nditu
re s
hare
Producers
0
FoodFood
Utilities
Education
Health
Clothes
Shelter
Loan/DebtTransport
OtherFamily EventsDomestic Help
Utilities
Education
Health
Clothes
ShelterLoan/DebtTransport
OtherFamily EventsDomestic Help
Table D6: Household expenditures along the transect in Bangalore (percent)
Expenditure Item Urban Peri-Urban Transition Peri-Urban Total
Food 29.2 24.2 25.0 27.0
Utilities 16.8 19.6 19.8 18.2
Education 11.5 10.9 13.1 11.8
Health 10.4 14.0 10.3 11.2
Clothes 8.1 8.8 6.6 7.8
Shelter 7.0 5.4 4.9 6.1
Loan/debt 6.2 5.7 3.8 5.4
Transport 4.6 5.4 5.2 5.0
Other 3.3 2.2 6.7 4.0
Family events 2.1 3.6 4.3 3.0
Domestic help 0.7 0.2 0.3 0.5
49 UrBAN AGrICULTUre: FINdINGS FroM FoUr CITY CASe STUdIeS
The survey also aimed to analyze the level of food security provided by urban agriculture. In this case, the differences between the producers and non-producers are statistically significant. Across the transect, a significant majority of producers (73 percent) stated that they always had enough to eat of what they want, while only 67 percent of non-producers said the same. A similar number in both groups said that they had enough to eat but not always what they like (approximately 21 percent).
The producer and non-producer groups were asked about their food situation to ascertain whether they had enough food in the last year. questions were related to whether respondents worried about running out of food, if they were able to eat the kinds of food they wanted or had to eat a limited variety of food because of lack of money, if they
had to eat less than they wanted due to insufficient food, or whether there was never any food to eat and household members had to go to bed hungry. In all cases it was found that there was no statistically significant difference between producers and non-producers.
Overall, the survey showed that both groups face food security issues, although to varying degrees. Non-producers were found to be more vulnerable than producers.
Food Diversity
Consumption patterns of different food groups between producers and non-producers along the transect show that there are a few significant differences, as described in Figure D11. Only marginal increases in percentages are observed among the producer groups. Cereals dominate the
Table D7: The impact of consumption of one’s own food produced in Bangalore*
Effect of consuming own food Urban Peri-Urban Transition Peri-Urban Total
Saves money to purchase other types of food 51.2 61.9 59.7 55.9
Monetary saving on food purchases 16.9 22.0 26.5 20.6
Saves money for other household purchases 27.7 34.5 28.2 29.4
Provides extra food 29.4 45.8 39.2 35.8
Provides a more diverse diet 11.9 23.2 14.1 15.2
Has an effect in another way 3.3 2.4 2.2 2.8
Little or no effect 3.0 4.2 1.7 3.0
*Numbers add up to more than 100 percent because respondents could choose more than one answer.
Food diversity: Consumption of 15 food groups by producers and non producers in the previous 24 hours
0 10 20 30 40 50 60 70 80 90 100
Cereal and grain
Green leafy vegetables
Other vegetables
Milk or milk products
Tubers
Yellow/orange vegetables
Other fruits
Yellow/orange fruit
Legumes
Eggs
Other meats
Fish 2019.1
26.1
28.325.8
31.132.1
46.642.1
47.945.2
57.753.9
65.563
70.670.6
77.681.4
8281.2
99.198.7
27
Non-Producer Producer
Percentage
Figure D11: Food diversity showing consumption of 15 food groups in the previous 24 hours in Bangalore*
*Annex A provides a detailed description of foods contained in each group
ANNeX d 50
diet (99 percent), consumed primarily as local preparations (primarily as rotis made of wheat, millets and rice). Although in general vegetarian foods rank higher than meat and animal products, more producers consume vegetables and fruit than non-producers.
Source of Food
Overall, 98 percent of both producers as well as non-producers stated that they bought fresh food and prepared it at home. Consuming cooked food outside the home, such as from restaurants and eateries, is marginal, at 8 percent for non-producers and 7 percent for producers. However, in the peri-urban transition area, the non-producer households consuming food bought from a restaurant is significantly higher than producer households, while in the peri-urban area, there are significantly more producers buying fresh food and preparing it at home compared to non-producers.
Figure D12: Map of Bangalore showing survey sites
Figure D13: Map of India
ReferencesBangalore Development Authority. 2005. “Bangalore Master Plan
Bose, P. 2011. “Population boom: At 46.68%, Bangalore Tops Urban Districts.” Business Standard. April 7, 2011. http://www.business-standard.com/india/news/population-boom-at-4668-bangalore-tops-urban-districts/431302/
Government of Karnataka. 2009. “Bangalore Urban District at a Glance 2008-09.” Bangalore: District Statistics Office.
Narayana, M. 2008. “Globalization and Urban Growth: Evidence for Bangalore (India).” CIRJE. http://www.cirje.e.u-tokyo.ac.jp/research/dp/2008/2008cf544.pdf
Thippaiah, P. 2009. “Vanishing Lakes: A Study of Bangalore City.” Bangalore: Institute for Social and Economic Change.
51 UrBAN AGrICULTUre: FINdINGS FroM FoUr CITY CASe STUdIeS
annex E: accra (Ghana) Case StudyAccra is the capital and largest city in Ghana, located
on the western coast of Africa. Accra anchors the Greater Accra Metropolitan Area (GAMA), which has a population of over 4 million people (Journal of the International Institute ), although the population of the city of Accra has approximately 2.3 million inhabitants. (World Gazetteer) More characteristics about Accra city are reported in Table E1.
Table E1: Key facts of Accra
Area (km2) GAMA: 894 (2010)
Population density (inhabitants/km2) 1,235.8 (2010)
Annual population growth rate (%) 3.1 (2000-2010)
% of national population 16.3
% of urban population 18.2
Poverty level as % of total city population
11 (2007)
Climate Tropical coastal savannah
Major geographical features Coastal semi-dry
Elevation (m above sea level) 61
Average annual rainfall (mm) 730
Average low/high temperatures (°C) 24/28
History
The city was first settled in the 15th century, when the Ga people migrated to the coast to distance themselves from their enemies. Accra gained status as a trading hub and port during the slave trade when the Portuguese, Dutch, Swedish, French, British, and Danish built forts around the city. After the abolition of the slave trade, Accra was captured by the British and became the capital of the British Gold Coast. After independence in 1957, the country of Ghana was born and Accra became the capital.
Administration
As shown in Table E2, Ghana is divided into ten administrative regions, of which the Greater Accra region is one. This region is further sub-divided into ten districts; the Accra Metropolitan Area (AMA) is one such district and its capital is Accra.
Table E2: Administrative districts and capitals of the Greater Accra Region
Administrative District Capital
Accra Metropolitan Area Accra
Tema Metropolitan Area Tema
Ga West Municipal Assembly Amasman
Ga East Municipal Assembly Madina
Ga South Municipal Assembly Wejia
Dangme West District Dodowa
Dangme East District Ada-Foah
Adentan Municipal Assembly Adentan
Ashaiman Municipal Assembly Ashaiman
Ledzokuku Krowor Teshie-Nungua
Demographics
Accra is one of the fastest and largest-growing cities in Africa, with an annual population growth rate of 3.36 percent. Due to rapid industrialization and rural-urban migration, the 1960s saw an increase in the population density. Population density has increased from 151.6 persons per square kilometer in 1960 to 895.5 in 2000. The densely populated nature of the region is brought into sharp focus when it is compared with the other regions. The sex ratio decreased from 113.6 males per 100 females in 1960 to 97.7 in 2000. This is a result of male out-migration, female in-migration and high male mortality. Accra’s population is a relatively young one, with 56 percent of its inhabitants being under 24 years of age; however, fertility rates are steadily declining over time. The majority of the population follows Christianity (83 percent), followed by Islam (10 percent) and other (7 percent) religions.
Economy
Accra accounted for approximately 10 percent of Ghana’s GDP in 2008. Table E3 shows that the main sectors in Accra are wholesale and retail trade, manufacturing, and urban agriculture and fishing.
Based on data provided in Kwadzo, G., Jatoe, J., Cofie, O., Amoah, P., and Forkuor, G. 2010. Urban agriculture: a sustainable solu-tion to alleviating urban poverty, addressing the food crisis, and adapting to climate change Case study Accra, Ghana. (Unpub-lished).
ANNeX e 52
Table E3: Main employment sectors in Accra (2000)* (Ghana
Statistical Service 2000)
Industry Percent
Agriculture, hunting and forestry 7.9
Fishing 3.6
Mining and quarrying 1.6
Manufacturing 16.7
Electricity, gas and water supply 0.5
Construction 6.6
Wholesale and retail trade 30.4
Hotels and restaurants 4.2
Transport, storage and communication 6.7
Financial intermediation 1.5
Real estate, renting and business activities 2.8
Public administration and defense 4.0
Education 3.6
Health and social work 1.5
Other community, social personal service activities 5.5
Private household with employed persons 1.9
Extra-territorial organizations and bodies 0.9
Total 100.0
Climate
Accra has a tropical savanna/semi-arid climate. The average annual rainfall is about 730 mm (28.7 inches), which falls primarily during Ghana’s two rainy seasons: April to mid-July and October. The annual average temperature is 26.8°C (80.2°F) and is relatively stable throughout the year, with March being the hottest (28°C/82.4°F) and August being the coolest (24.7°C/76.5°F). The cooler months tend to be more humid than the hotter months, thus the city experiences a windy “dry heat” in summer.
Urban Agriculture in Accra
Accra has a long history of urban agriculture and has been the subject of numerous studies on the topic (refer to Box E1 for a list of urban agriculture studies based in Accra). During the colonial period, Europeans planted vegetables and ornamental crops in their backyards and public spaces. During the Second World War, agriculture was promoted in order to help feed allied troops in the Gold Coast. In the 1970s, during the economic post-independence crises, the government supported urban agriculture to meet the population’s food demands through a national program called “Operation Feed Yourself.” In the late nineties, the decentralization of the Ministry of Food and Agriculture provided a boost to urban farming, as each district, including cities, had an Agricultural Directorate with extension staff.
A study covering more than 2000 households across Ghana during both lean as well as bumper seasons showed the specific contribution of urban and peri-urban farming to rural farming, as illustrated in Table E4. For instance, one of the results highlighted that 75 to 90 percent of the lettuce and spring onions consumed in cities are grown on open urban spaces (Drechsel and others 2007). Most perishable vegetables and some fruits come from peri-urban areas, while others such as onions and tomatoes, which constitute the largest vegetable quantities by weight share, are transported over 1,000 km before they are sold in Accra.
Backyard gardening remains a socially accepted activity even today. Open-space farming, on the other hand, receives mixed feedback as does livestock farming in the city center and the use of polluted water for irrigation of vegetables. Besides backyard and open-space crop production, fish farming/aquaculture, livestock farming, floriculture/ornamentals, small ruminants and poultry, and non-traditional farming (e.g., snails and mushrooms) are popular
Box E3 provides details about the survey methodology used for this case study.
Table E4: Geographical sources of food in Accra’s retail markets (percentage) (IWMI, unpublished, Lettuce from Obuobie et al., 2006)
Crop Urban Farming
Peri-Urban Farming (28 km radius)
Rural, Imported
to City
Yam 0 0 100
Cassava <2 5 95
Maize <2 5 95
Plantain <2 10 90
Rice 0 0 100
Cocoyam 0 0 100
Cabbage 10 50 40
Tomatoes <5 5 95
Onions 0 20 80
Garden eggs <5 45 55
Lettuce 75* 20 5
Bananas 0 0 100
Oranges 0 13 87
Pineapple 0 85 15
Total 2 10 88
53 UrBAN AGrICULTUre: FINdINGS FroM FoUr CITY CASe STUdIeS
Backyard/On-plot Farming
Backyard farming is characterized by the cultivation of crops and rearing of animals in and around households. In Accra, about 50 to 70 hectares of agricultural land are distributed around 80,000 backyards involving nearly 60 percent of Accra’s households. This may often be limited to just a few plantain or mango trees or chickens, but sometimes could also include a few square meters of maize or cassava. Where green vegetables are grown, they are traditional varieties mainly used in stews. This estimate is based on a cross-city survey of about 1,000 households (IWMI and RUAF 2006, unpublished.). The figure is much higher than the one by Armar-Klemesu and Maxwell (2003), who surveyed mostly low-income and high-density suburbs where only about 13.6 percent of households had backyards.
Both men and women are equally engaged in backyard cultivation depending on the type of crop or livestock. Most members are middle-aged and have higher levels of education than farmers who cultivate on open spaces. The survey showed that a large number of households with gardens worked in the civil service, as they occupied government buildings constructed in the 1950s and 1960s, which had ample open space.
Most of the water for irrigation comes from rain and through drainage water from households. Given the size of the farmable space and the main occupation of the household heads, the average backyard in Accra does not provide, on its own, a livelihood base, but can provide extra income or
reduce expenditures. Occasionally, when good harvests are produced, the excess is sold to neighbors or market sellers.
For more information about backyard farming in Accra refer to Box E3.
Open Space/Off-plot Farming
Many farmers using open space for cultivation grow either vegetables or maize as both provide the highest profit margin. In the dry season, vegetable plots dominate areas along streams, while in the rainy season maize is more popular. Nonetheless, there are many farmers who grow vegetables all year round.
A survey in 2006 showed that within the Accra municipal area about 680 ha are used to grow maize, 47 ha for vegetables, and 251 ha for mixed cereal/vegetables. All plots used for vegetable farming are close to streams and storm water drains since the most profitable vegetables require continuous irrigation. Irrigated urban vegetable production takes place on more than seven large sites reaching around 100 ha in the dry season and is cultivated by an estimated 1,000 farmers (Obuobie and others 2006). Although some of these sites have been in use for more than 50 years (Anyane 1963), a 50 percent decrease in farm land was observed between 2001 and 2008.
Obosu-Mensah (1999) reported that most open-space farmers come from rural areas and have some experience in farming. Many of them come from Northern Ghana and are seeking employment or better education. They take up
Box E1: Urban agriculture studies in Accra
Accra has a long history of urban agriculture studies, both through RUAF as well as from independent research. Some important titles are included here:
Asomani-Boateng, R. 2002. Urban cultivation in Accra: an examination of the nature, practices, problems, potentials and urban planning implications. Habitat International 26: 591-607.
Maxwell, D. and M. Armar-Klemesu. 1999. Urban Agriculture in Greater Accra: Reviewing Research Impacts for Livelihoods, Food and Nutrition Security. CFP Report 29F. IDRC: Ottawa.
Armar-Klemesu, M. and D. Maxwell. 2003. Accra - Urban agriculture as an asset strategy supplementing income and diets. Growing Cities, Growing Food: Urban Agriculture on the Policy Agenda: A Reader on Urban Agriculture. ETC, DSE. 183-208.
Obosu-Mensah, K. 1999. Food production in urban areas. A study of urban agriculture in Accra, Ghana. Ashgate Publishing: Aldershot, UK. 227 pp.
Obuobie, E., B. Keraita, G. Danso, P. Amoah, O. Cofie, L. Raschid-Sally, and P. Drechsel. 2006. Irrigated urban vegetable production in Ghana: Characteristics, benefits and risks. IWMI-RUAF-IDRC-CPWF, Accra, Ghana: IWMI, 150 pp. www.cityfarmer.org/GhanaIrrigateVegis.html
Flynn-Dapaah, K. 2002. Land negotiations and tenure relationships: Accessing land for urban and peri-urban agriculture in Sub-Saharan Africa. CFP Report Series 36. IDRC: Ottawa.
Yankson, P.W.K. and K.V. Gough. 1999. The environmental impact of rapid urbanization in the peri-urban area of Accra, Ghana. Geografisk Tidsskrift, Bind 99: 98-99 www.tidsskrift.dk/visning.jsp?markup=&print=no&id=71848
ANNeX e 54
farming to earn enough to meet these targets, but once
they start around two-thirds continue this occupation. The
majority of the farmers are between 20 and 40 years of age
and are often illiterate (Amoah and others 2008, Obuobie
2003). Out of 138 open-space farmers interviewed in Accra,
more than 60 percent rely on irrigated vegetable cultivation
as their only source of income, while for 33 percent it is a
supplementary source of income. More than two-thirds
grow exotic vegetables for sale. Those who cultivate green
vegetables (primarily used in stews) or maize consume a
smaller share at home (Keraita and others 2002, Amoah and
others 2008).
While open-space cultivation is mostly dominated by
men, the marketing is controlled by women (Obuobie and
others 2006; Hope and others 2009). It has been estimated
that every day about 200,000 consumers of street food in
Accra eat vegetables produced within urban areas (Amoah
and others 2007).
Box E2: Backyard farming provides food security in Accra
A recent survey by IWMI of 120 households engaged in backyard farming in Kumasi and Accra showed that 3 to 10 percent gain some commercial advantage while 90 to 97 percent use the on-plot space for subsistence only.
The contribution of backyards to household food security has been estimated in terms of the saved cost on food expenditures and direct income from sales. Given that most food produced is used for subsistence, the cash income is not noteworthy, while the annually saved costs vary from 1 to 5 percent of the overall food expenditures, with higher values (up to a maximum of 10 percent) in the lower wealth classes. This confirms the magnitude reported a decade ago by Armar-Klemesu and Maxwell (2003) in their Accra study that households get only 7 to 8 percent of their total food in terms of value and calories from their own production. Thus, the contribution of urban on-site plots to household food security is marginal.
However, although the numbers appear low, all households highly valued the contribution. They considered the supplementary food supply and related reduction in household expenditures as a significant contribution.
Another reason for the discrepancy between the quantitative survey and household perception is that every saving counts, even small ones. The majority of produced crops are heavy food items, which include plantains and tubers, which constitute the major part of the local diet. The survey showed that typical backyards in Accra produced between 44 and 146 kg of cassava and 26 to 104 kg of plantains annually. Although this makes up only a small part of the overall annual food expenditure, these households do not have to buy and carry 10 to 25 percent of their annual needs (Drechsel and others 2009). In the case of maize, even larger degrees of self-sufficiency are possible. Armar-Klemesu and Maxwell (2003) estimated that off-plot maize farmers might produce enough maize to cover their household maize needs for 1 to 8 months of a year, unless they sold their produce.
Box E3: Survey methodology for the Accra case study
The project was implemented in three out of the ten districts of the Greater Accra Region. These administrative units (AUs) were selected due to the characteristics required by the survey along the transect from the urban to peri-urban interface.
As in Bangalore, apart from the Accra Metropolitan Assembly (AMA) district that is exclusively urban, none of the other nine districts in the Greater Accra Region exhibit exclusive characteristics of peri-urban transition and peri-urban areas. Using local knowledge and mapping the built-up areas, a map of the three categories was produced and overlaid on the AUs. Two districts, Accra Metropolitan Assembly (AMA) and Adentan Municipal Assembly (ADMA), were selected for the Urban category, while one, Ga West Municipal, was selected for both peri-urban transition and peri-urban areas.
The research team first visited the three districts selected, informed the assemblies about the study, and sent a formal letter outlining the objectives of the study to the Chief Executives, who are representatives of the central government and manage the administrative areas. In addition, the Ministry of Food and Agriculture (MoFA) offices in each of the assemblies were visited and the target settlements were jointly selected with the directors and the respective Agricultural Extension Agents (AEA) in the districts. The AEAs informed the community members and Assemblies of the visits and data collection and also accompanied the research team to the target settlements. The District Agricultural Offices also received notice from the respective Assemblies about the survey. This approach greatly facilitated support for the survey as well as smooth entry into the communities.
The study covered 900 households, 450 from the urban area (300 producers and 150 non-producers), and 225 (150 producers and 75 non-producers) each from the peri-urban transition and peri-urban areas. Households were randomly selected in the target settlements and enumerators approached houses with some form of agriculture either inside the house or outside. Only a few households refused to answer the questionnaire.
Additional data was collected from secondary sources to complement survey data and focus group discussions were held with community members. On the day of the scheduled focus group discussions, there was a heavy downpour and the attendance was limited to 14 males and 23 females.
55 UrBAN AGrICULTUre: FINdINGS FroM FoUr CITY CASe STUdIeS
Seasonal Maize Farming (On- and Off-plot)
Farmers who primarily grow maize are located on land
owned by the University of Ghana in pockets of vacant
spaces in the city. In addition to maize, these farmers also
produce cassava (12 percent), okra (12 percent), and pepper
(12 percent). About 60 percent of the farmers estimated their
farm sizes to be between 4,000 and 12.000 square meters, 12
percent estimated the size up to 24,000 square meters, and
13 percent up to 36,000 square meters. The trend is towards
smaller lands due to competing needs for urban development.
All the farmers interviewed were male and over 50 years
old with no particular educational pattern. Half of the farmers
had been planting maize for over 20 years and had other
income-generating activities, such as cane-basket weaving,
office security services, and carpentry. Seasonal maize farming
is done primarily for sale and a means to supplement income, while about 25 percent of farmers grow maize for home consumption.
Farmers do not pay rent on the land but usually have an informal agreement with land owners or caretakers. Sharecropping is practiced, where some of the produce is offered to the owners in lieu of rent. In general, in the peri-urban areas land tenure becomes more secure as it is owned under customary rights whereby local chiefs assign land. However, with increasing land values, most chiefs are increasingly selling community plots for construction purposes.
Livestock Farming (On- and Off-plot)
Most livestock farms are located in La, Teshie, and Nungua to rear sheep, goats, pigs, cattle, and/or poultry. Approximately
Table E5: Summary of the types of urban agriculture practiced in Accra
Backyard Farming (On-site)
Open space (Off-plot) Farming
Seasonal Maize Farming (On- and Off-plot)
Livestock Farming (On- and Off-plot)
Mushroom Farming (On-plot)
Floriculture and Ornamental Farming (Off-plot)
Aquaculture (Off-plot)
Grasscutter, i.e., Bushmeat Production (On-plot)
Primary reason for activity
Home consumption
Income generation
Income generation
Primary source of income for small majority
Income generation; personal interest; medicinal and environmental value; relation to profession
Income generation
Slightly higher proportion for home consumption than sale
Supplementary source of income
Average number of years farmers are involved
-- -- > 20 -- Majority 6-10 < 5 -- < 5
Predominant gender of farmer
Equal between men and women
Cultivation: male; Marketing: female
All male Mostly male Mostly male Mostly male Mostly female Mostly female
Average age of farmer
Middle-aged 20-40 > 50 > 40 > 50 All age groups
-- --
Average education level of farmer
Generally higher level of education than other urban agriculture farming types
Often illiterate Various levels -- Various levels -- Basic level of education
--
Land/water for irrigation
Rain water and household drainage
Near streams and stormwater drains
Mostly vacant spaces
-- -- -- In some cases, wastewater treatment ponds
N/A
ANNeX e 56
75 percent are male and the rest are female, ranging in age from 40 years and above. A relatively higher proportion of farmers (52 percent) consider livestock farming as their main occupation whereas others used it as a supplementary source of income. It was found that there are more Christians than Muslims involved in livestock farming, which is different from the general perception that livestock keeping, especially in the city, is predominantly the work of Muslims.
The number of animals owned by individual farmers vary by type of animals. Numbers of small livestock range from 4 to 200 and poultry from 35 to 2,500. Other income-generating activities include trading and teaching. Commercial livestock farmers rear mostly poultry and pigs (Armar-Klemesu and Maxwell 2003).
Mushroom Farming (On-plot)
Most of the 250 registered mushroom farmers are located at the periphery of the metropolitan area and cultivate oyster mushrooms. The majority of the farmers are men and 40 percent are women, usually above the age of 50 years. All educational levels were recorded. The majority of the farmers have been growing mushrooms for 6 to 10 years and 20 percent of them for 11 to 15 years. The reasons for practicing mushroom cultivation are profitability, personal interest, medicinal and environmental value, and its relation to one’s profession. In most cases, the income from sale of mushrooms was supplemented by other sources of income, such as catering, consultancy services or preaching.
Floriculture and Ornamental Farming (Off-plot)
Twice the number of men compared to women practice this type of farming and were found to be of all age groups, with the majority between 31 to 40 years having various educational levels. The majority of the farmers had spent less than five years in floriculture, but one-third had been in floriculture farming for about 6 to 10 years. Sixty-six percent of the farmers indicated that it was the only income-generating activity they were involved in, whereas one-third were involved in other activities, such as carpentry or plumbing. A similar study by Danso and others (2002b) observed that many floriculture farmers were also engaged in landscaping activities (85 percent) and take on contracts from households, embassies, estate development and hotels.
The flowers are sold to individuals, institutions, and building contractors. Drechsel and others (2006) reported high income levels that are similar to vegetable farming, but in contrast, need more as start-up capital.
Aquaculture (Off-plot)
There are few opportunities for fish farming in Accra, excluding fishing in lagoons and the ocean. There are more women (80 percent) involved in this activity than men and they have at least basic education. Aquaculture is practiced by 60 percent for home consumption and by 40 percent as a business. Mudfish and tilapia are the main types of fish reared by farmers. Not all the ponds that were visited as part of the survey were functioning and some were overgrown with weeds. It was difficult for the farmers to estimate their monthly income from aquaculture. Some farmers also cultivated fish in wastewater treatment ponds.
Grasscutter (Bushmeat) Farming (On-plot)
A small number of farmers in Accra are engaged in this type of traditional bushmeat production. The study showed that most farmers were located in Accra (60 percent). Most reared only grasscutter (89 percent). There were more men (70 percent) than women involved in this type of urban agriculture, usually (85 percent) for less than five years. Although this is a predominantly rural activity, it is gaining popularity in the city. The majority of farmers involved (74 percent) also have other income-generating activities while only a small number (26 percent) are involved in it as their sole occupation.
Table E5 summarizes the types of urban agriculture practiced in Accra referred above.
Reasons for Participating in Urban Agriculture
The two main reasons cited for growing crops are access to additional income through sales (51 percent) and access to additional food (41 percent). Additional income from crops is an important consideration in peri-urban and urban areas while access to additional food is relatively more important for producers in the transition area. With respect to livestock, 54 percent of sampled households were involved, of which the majority (45 percent) cited access to additional food and to a lesser extent (28 percent) to additional income through sales of meat and related products. However, the reasons for rearing animals differed in the transect: For urban and peri-urban transition dwellers it was mainly for additional food, as opposed to peri-urban residents for whom it was additional income.
Also, 9.6 percent of respondents had stopped raising livestock, citing reasons such as lack of profitability, sickness of animals, lack of cash to replace animals, and loss of land to maintain the animals.
57 UrBAN AGrICULTUre: FINdINGS FroM FoUr CITY CASe STUdIeS
Length of Residence
The majority of respondents have either been living in Accra for more than 15 years or were born in the city, regardless of their location along the transect. A higher proportion of migrants tend to be subsistence farmers while those born in the city are more commonly commercial farmers.
A higher proportion of migrants are of middle socio-economic status compared to those who have always lived there. This may be due to the fact that migrants have better education and thus access to other occupations. The survey shows that the proportion of migrants who have completed a college/university degree is 1.8 times higher than the proportion of those born in the city. Those who have lived there all their lives tend to have bigger, commercial farms, which may suggest that they do not look elsewhere for jobs.
Types of Crops Grown
The main crops grown by producers include both staples and vegetables and are summarized in Table E6. There are slight variations in the types of crops grown along the transect. Maize is the most common crop grown everywhere. In urban areas, other popular crops include okra and lettuce, which are traditionally cash crops beyond what can be consumed by the household. In the transition and peri-urban areas, the focus seems to be more on basic staples required by households, such as cassava, plantain, and okra.
Subsistence farmers mainly grow maize, cassava, okra, and plantain, which are staple foods, while commercial farmers produce a wider variety of crops including maize, cassava, okra, lettuce, pepper, cabbage, spring onions, and tomato, as illustrated in Figure E1.
Types of Animals Reared
In terms of animals, the most common were poultry (mostly layers followed by broilers) and goats/sheep. Producers in the transition and peri-urban areas have more layers than their counterparts in the city center.
The principal livestock products produced by the households in the past six months were chicken, egg, beef, and mutton; which in total represent 96.4 percent of the total production.
Table E6: Common crops grown by households along the transect in Accra
Urban Peri-Urban Transition Peri-Urban
Crop Percent Households Crop Percent
Households Crop Percent Households
Maize 26.8 Maize 29.9 Maize 45.1
Okra 19.6 Cassava 28.5 Cassava 35.3
Lettuce 10.7 Plantain 23.4 Okra 3.8
Cassava 8.6 Okra 4.4 Plantain 3.0
Cassava
Crops grown by subsistence and commercial farmers
0 10 20 30 40 50 60 70 80 90 100
Other
Garden eggs
Cauliflower
Cabbage
Tomatoes
Spring Onion
Pepper
Lettuce
Plantain
Okra
Maize
Commercial
Subsistence
22.7
34.6 22.6 11.2 11.9 3.7 3.7 2 2.5 6.0
13.4 13.4 11.8 9.2 6.7 5.9 9.2 3.4
0.8 1.7
0.70.5
0.5
1.7
Figure E1: Crops grown by subsistence and commercial farmers in Accra
ANNeX e 58
Space Available for Growing Crops and Rearing Animals
About 98 percent of producers surveyed have access to a land/plot, including in the homestead or around it, that has been used to grow crops or raise livestock. Seventy-nine percent of these producers use this space for urban agriculture activities. Along the transect, producers in urban areas tend to use public land the most (39 percent); ownership or rent/lease of plots is highest in peri-urban areas (48 percent own; 38 percent leased/rented) and lowest in the urban areas (23 percent own; 16 percent leased/ rented), as shown in Figure E2. Using farm holdings as a proxy for land availability, the distribution suggests that land is more readily available in peri-urban areas and more limited in urban areas, while the transition area falls in between the two.
In the survey, a range of farm sizes were noted, as can be seen in Figure E3. Plot sizes were smaller in the urban and transition areas than in the peri-urban areas, where one would expect to have more space. Respondents of low socio-economic status have larger farms while those of middle socio-economic status tend to have smaller farms.
The majority of producers (89 percent) use their plots for crops, while a much smaller percentage use the plots for livestock (6 percent), followed by for both crops as well as livestock (5 percent). The majority of the plots are owned, leased, or rented, but almost a quarter of those surveyed either used available public space or areas without permission.
Figure E4 shows that across the transect, the majority of plots are located in the homestead (35 percent) and away from house (33 percent). Households in the urban area also have plots in urban open spaces (26 percent), while peri-urban producers have plots in rural farms (36 percent).
Inputs Used for Urban Agriculture
Eighty-five percent of producers reported that they owned farming tools. Producers in the peri-urban area tend to own or share farm tools more than those in other areas. A large fraction of producers in the peri-urban transition area did not have access to tools, compared to the other two locations. Some non-producers also own tools and use them to control weeds and prune trees around their houses or compounds.
Producers also used chemical fertilizers (46 percent), animal manure (24 percent), and compost on crops (18
Figure E2: Type of land owned by producers in AccraType of Land Owned by Producers
52
100
0
20
40
60
80
100
25 50 75 100
Owned
Leased/RentalLeased/Rental
Leased/Rental
Public Land
Public Land
Public LandUsed without Permission
Shared Among Group Shared Among GroupShared Among Group
OtherNot AnsweredOther
Other
Used without Permission
Used without Permission
Owned
Owned
Peri-Urban
Share of households by area, percent
Perc
enta
ge o
f hou
seho
lds
by c
ateg
ory
Peri-UrbanTransition
Urban
0
Figure E3: Farm size by location in Accra (ha) Farm Size by Location (ha)
Spring <0.80.4≤0.8<0.4
0 10 20 30 40 50 60 70 80 90 100
40.5 21.6 37.8
55.7 22.1 22.1
60.7 15.0 24.3
Peri-Urban
Urban
Peri-UrbanTransition
Percentage
59 UrBAN AGrICULTUre: FINdINGS FroM FoUr CITY CASe STUdIeS
percent), along with additional inputs such as seeds (81 percent), pesticides (51 percent), and hired labor (47 percent). Judging from producer responses regarding services accessed by them, a relatively small number of producers have access to extension services.
Figure E5 illustrates the fertilizers and other inputs used for crop production. By location, the survey shows that a relatively higher proportion of producers in the urban area use more fertilizers than in other areas.
The type of fertilizer used depends on the crop grown. For instance, producers mainly use animal manure and vegetative compost on lettuce, spring onion, and plantain, while chemical fertilizers are mainly applied on tomato and peppers. Maize and okra use both organic and chemical fertilizers. Other inputs were used more on the main crops grown, such as maize, cassava, and okra, and to a lesser extent on other crops.
Livelihood
With regard to the producers interviewed for the survey, 48 percent said that farming was their primary occupation (refer to Figure E6), while 28 percent said it was their secondary occupation. For those whose primary occupation was urban agriculture, approximately 33 percent were involved in growing crops, while 88 percent were involved in rearing animals (see Table E7). These numbers do not add up to 100 percent as some farmers are involved in both activities.
According to Figure E7, 69 percent of households who claimed
that farming is their primary occupation said that they do not
have a secondary occupation, while 18 percent participate in
informal business as a secondary occupation. This may imply
that for many respondents, urban agriculture is considered to
be the main source of income.
Figure E4: Location of space used by producers in AccraLocation of Space used by Producers
Homestead plot
Urban plot away from home
Urban Open Space
Rural farm
Containers in homesteads
Peri-urban plot
Squatted
0 10 20 30 40 50 60 70 80 90 100
20.9 34.5 3.4 34.5 6.1
0.7
59.7 25.5 2.7 10.7
1.3
29.1 35.8 25.8 2.3 6.0
Peri-Urban
Urban
Peri-UrbanTransition
Percentage
0.7
0.3
OtherInputs
Types of fertilizer and other inputs used for crop production by location
0 10 20 30 40 50 60 70 80 90 100
Purchased Seedlings/Seeds
Hired Labor
Water/Irrigation
Pesticides
Animal Manure
Vegetable Compost
Wastewater
Chemical Fertilizer
8.520.1
6.8
14.814.4
20.8
13.412
34.4
19.423.7
53.1
61.227.1
50
76.467.4
89.9
2552.9
63.8
49.3
58.718.4
Percentage
Fertilizer
Peri-Urban Peri-Urban Transition Urban
Figure E5: Types of fertilizers and other inputs used for crop production by location in Accra
ANNeX e 60
Planting decisions are mostly male-dominated in both
male- and female-headed households. Marketing activities
in the majority of urban male-headed households is primarily
the responsibility of the adult male family member. However,
in the peri-urban transition and peri-urban areas, female
adults were reported to be the most involved in marketing.
Farmers were also involved in other occupations. For
instance, the majority of those involved in urban agriculture as
their primary occupation also worked in informal businesses,
as casual laborers or in medium-sized enterprises.
The most common source of income for non-producers
is informal business. This is followed by medium-sized
enterprises and casual labor. Hence, both producers as well
as non-producers seemed to be involved in the same types of
non-farming activities.
Along the transect, there are significant differences
among producers when considering livestock, crops and
informal business. Considerably more producers rear animals
in the peri-urban area than in the urban and peri-urban
transition areas. The same goes for growing crops, although
Figure E6: Primary occupation of household heads in Accra
ProducerNon-Producer
Perc
enta
ge
Farmer
Informal business
Salaried employee (with or without benefits)
Medium enterprise owner
Casual labor
Other
0
10
20
30
40
50
60
70
80
90
100
14.7
Primary and secondary occupation of household heads
6.3
12.3
12.3
54.3 47.8
26.0
10.3
3.34.2
8.3
No secondary occupation
Informal business
Casual labor
Regular employee (no benefits)
Other
Secondary occupation of farmers
69.4
18.0
7.22.92.6
Figure E7: Secondary occupation of producers in Accra (percent)
Table E7: Percentage sources of income for producers and non-producers in Accra*
*Numbers add up to more than 100 percent because respondents could choose more than one answer.
61 UrBAN AGrICULTUre: FINdINGS FroM FoUr CITY CASe STUdIeS
it is interesting to note that over 70 percent of urban farmers grow crops. In the peri-urban area, 80 percent of producers are involved in growing crops. Producers in the peri-urban transition area tend to have more non-farming sources of income than farming-related income.
Income from Urban Agriculture
The proportion of income earned by producers from growing crops varies along the transect. Figure E8 shows that approximately 77 percent of urban producers make a “very important” and a “moderately important” percent of their income from crops. In the peri-urban transition, a smaller number of producers make that proportion of income from crops, and are more likely to make a “less important” percent of their income from crop growing. In the peri-urban area, the majority of producers make a “moderately important” percent of their income from crops.
When considering the proportion of income earned from raising animals, the results are more standardized across the transect, as shown in Figure E9. The majority of all farmers in all three zones make a “less important” percentage of their income from rearing animals, but this number is roughly equal in the urban and peri-urban areas, and highest in the peri-urban transition. Although one would expect producers in the peri-urban area to have the most space to be able to rear animals, it is there that the least number of producers are shown to make a “very important” percent of their income from raising livestock.
A description of the state of dwellings of producers and non-producers is detailed in Box E4.
Expenditure
For both producers and non-producers, the single highest expenditure is on food, followed by education and shelter. Non-producers spend a higher proportion of their income on food than producers do, although this is not statistically significant. On the other hand, producers spend a higher percentage of their total expenditure on education, clothing, health and family events than non-producers.
When considering both producer as well as non-producer expense categories along the transect, interesting differences show up, as seen in Table E8. In terms of food, urban respondents generally spend a smaller proportion of their income on food, while peri-urban respondents tend to spend increasingly higher proportions of their income on
food. In general, higher proportions of incomes are spent on
food in the transition and peri-urban areas than in the urban
area.
Almost all respondents spend less than 25 percent of their
total income on education, with those in peri-urban transition
Figure E8: Proportion of income from crop production along the transect in Accra*
Proportion of income from crop production along transect
52
100
0
20
40
60
80
100
25 50 75 100
Less Important
Less Important
Less Important
Moderately important
Moderately important
Moderately important
Very important Very important Very important
Peri-Urban
Share of households by area, percent
Perc
enta
ge o
f hou
seho
lds
by c
ateg
ory
Peri-UrbanTransition Urban
0
* Categories of income: Less important: less than 25%; Moderately important: 25-75%; Very important: more than 75%.
Figure E9: Proportion of income from rearing animals along the transect in Accra*
Proportion of income from rearing animals production along transect
52
100
0
20
40
60
80
100
25 50 75 100
Less Important
Less Important
Less Important
Moderately important
Moderately important
Moderately important
Very important Very important Very important
Peri-Urban
Share of households by area, percent
Perc
enta
ge o
f hou
seho
lds
by c
ateg
ory
Peri-UrbanTransition Urban
0
* Categories of income: Less important: less than 25%; Moderately important: 25-75%; Very important: more than 75%.
ANNeX e 62
area spending slightly higher than their urban and peri-urban counterparts. It is important to note that only 1 percent of the respondents spend more than 50 percent of their income in education.
Table E9 presents the impact of consumption of one’s food produced. It shows that 85 percent of producers interviewed claimed that growing their own crops or rearing animals saved money that was used to purchase other types of food. Participation in urban agriculture also allowed these families
to provide extra food for their families and saves money that can be used for other household purchases.
Respondents were asked about their food security in the prior four weeks as well as about their food situation in the last year. The majority of both producers and non-producers stated that they have enough food to eat but not always what they would like, while approximately one-third of both groups stated they always had enough to eat of what they wanted.
Box E4: General state of dwellings of producers and non-producers in Accra
Producers and non-producers were asked about the state of their dwellings as an indicator of how well off they are. Respondents were questioned about the kinds of materials used for the walls, flooring and roofing of their residences, the number of rooms, and type of latrine. In addition, they were also asked about the sources of water and fuel for cooking and lighting.
Overall, non-producers have better dwellings constructed from brick and/or cement compared to producers. More non-producers described the state of their dwelling as good compared to producers. In producer households, the type of material used for construction declined from the urban to the peri-urban area, with 46 percent of producers in the peri-urban zone living in homes constructed from mud/dirt.
With regard to flooring, most respondents used brick and/or cement, but more non-producers tend to have tiled/parquet/carpeting floors than producers across the transect. Producers in the peri-urban area tend to have fewer finished floors than in other areas, which is consistent with the materials used for the overall dwelling.
The most common type of roofing material used is corrugated metal/plastic/fiberglass sheets. Among other materials, bricks and/or cement tend to be more popular with non-producers in the urban and peri-urban zones, but not in the peri-urban transition. Approximately one-third of producers in the peri-urban area use straw/grass/plastic sheets as roofing.
Non-producers tend to have more rooms than producers, although the average for both groups seems to be 2 to 3 rooms. Surprisingly, urban respondents have more rooms than their counterparts in the other areas along the transect.
Forty percent of respondents do not have access to safe drinking water during the dry season and 24 percent during the rainy season. In general, non-producers have better access to safe drinking water than producers.
Non-producers also have better access to fuel for cooking and lighting. A higher number of non-producers used charcoal, bottled gas, and biogas for cooking, and are connected to the electric grid for lighting. On the other hand, producers tend to use firewood more commonly for cooking, which is considered to be a fuel source generally used by the poor.
Regarding household size, producers (4.9) tend to have a significantly larger number of people than non-producers (4.39).
Table E8: Household expenditures along the transect in Accra (percent)
Expenditure Item Urban Peri-Urban Transition Peri-Urban Total
Shelter 3.2 2.9 2.8 3.0
Education 16.7 18.5 15.0 16.7
Food 36.5 39.5 41.9 38.6
Loan/debt 1.4 1.2 1.0 1.3
Clothes 7.7 7.3 7.5 7.6
Health 8.2 9.2 9.4 8.8
Family events 4.5 3.8 5.2 4.5
Transport 7.9 8.1 7.8 7.9
Utilities 12.3 8.6 8.2 10.3
Domestic help 0.8 0.2 0.4 0.5
Other 0.8 0.6 0.9 0.8
63 UrBAN AGrICULTUre: FINdINGS FroM FoUr CITY CASe STUdIeS
In the previous year, both producers and non-producers had similar concerns and fears about their food situation. This included whether households worried about whether they would run out of food or the kind of food they wanted due to lack of money, they had to eat limited variety of food or eat food they did not want, or they had to eat less or eat fewer meals because there was not enough food.
When considering the food diversity, or the consumption of various food groups, over the previous 24 hours, there is a statistically significant difference between producers and non-producers for two food items: tubers, more of which is consumed by non-producers than producers, and green leafy vegetables, which more producers eat than non-producers, as illustrated in Figure E10. Along the transect, there are a number of significant differences as well. For instance, in
the urban area, non-producers consume more tubers and milk than producers, while the latter have more green leafy vegetables. In the peri-urban transition area, non-producers eat more fish and other fruits than producers, while producers have more milk and green leafy vegetables. In the peri-urban area, non-producers consume more milk, eggs, and fruit than producers do.
With regard to producers who grow their own food, the space used to grow crops or rear animals varies along the transect. In urban areas producers use space around their homes, publicly available space and plots away from the home, while in the peri-urban transition area most producers use space around their homes. In the peri-urban area, it is most common to find producers using their own plots that are away from their homes.
Table E9: The impact of consumption of one’s own food produced in Accra* (percent)
Effect of consuming own food Urban Peri-Urban Transition Peri-Urban Total
Saves money to purchase other types of food 82.1 87.2 89.8 84.4
Monetary saving on food purchases 25.4 31.3 28.6 27.5
Saves money for other household purchases 54.4 55.9 69.4 56.4
Provides extra food 65.8 76.3 83.7 70.6
Provides a more diverse diet 44.4 46.8 49.0 45.6
Has an effect in another way 5.4 6.7 8.2 6.0
Little or no effect 4.5 4.2 0.0 4.5
*Numbers add up to more than 100 percent because respondents could choose more than one answer.
Food diversity: Consumption of 15 food groups by producers and non producers in the previous 24 hours
0 10 20 30 40 50 60 70 80 90 100
Cereal or grain
Fish
Other vegetables
Tubers
Other meats
Legumes
Milk or milk products
Green leafy vegetables
Eggs
Other fruits
Yellow/orange fruit
Yellow/orange vegetables 8.07.2
10
14.118.7
25.525.4
37.826.1
33.932.1
41.437.6
49.049.3
76.181.8
88.690.4
90.693.5
98.097.0
6.8
Non-Producer Producer
Figure E10: Food diversity showing consumption of 15 food groups in the previous 24 hours in Accra*
*Annex A provides a detailed description of foods contained in each group
ANNeX e 64
In general, as one moves along the transect from urban to peri-urban, more producers tend to buy fresh food and prepare it at home (from 83 percent in urban to 93 percent in peri-urban). Buying ready-to-eat foods was a less common way of obtaining food during the week prior to the interview (13 percent). The highest percentage of households that purchase ready-to-eat food are peri-urban non-producers (25 percent). As expected, a higher percentage of non-producers (20 percent) in total reported obtaining ready-to-eat food preparations than producers (10 percent). This may be the case because producers may not have enough money to buy prepared foods. Also, peri-urban transition and peri-urban producers have access to relatively larger plots of land and cultivate more of their own food than urban farmers.
Figure E12: Map of Ghana
Figure E11: Map of Accra showing survey sites
65 UrBAN AGrICULTUre: FINdINGS FroM FoUr CITY CASe STUdIeS
ReferencesAmoah, P., R. Abaidoo, and P. Drechsel. 2008. “Sources of Pathogen Contamination in Urban Vegetable Farms in Ghana.” In
Agricultures et Développement Urbain en Afrique de l’Ouest et du Centre, ed. F.-R. Mahieu, Editions de L’Harmattan. Collection Éthique Économique, 123-132.
Amoah, P., P. Drechsel, R.C. Abaidoo, and M. Henseler. 2007. “Irrigated Urban Vegetable Production in Ghana: Microbiological Contamination in Farms and Markets and Associated Consumer Risk Groups.” Journal of Water and Health 5(3): 455-466.
Anyane, S. La. 1963. “Vegetable Gardening in Accra.” The Ghana Farmer 1 (6): 228-230.
Armar-Klemesu, M. and D. Maxwell. 2003. Accra. “Urban Agriculture as an Asset Strategy Supplementing Income and Diets.” Growing Cities, Growing Food: Urban Agriculture on the Policy Agenda, ed. Bakker, N., M. Dubbeling, S.Guendel, U. Sabel Koschella, H. de Zeeuw,183-208. Feldafing: Deutsche Stiftung für internationale Entwicklung (DSE).
Danso, G., B. Keraita, and A. Afrane. 2002. “Farming Systems in (Peri) Urban Accra, Ghana: Special Focus on Its Profitability, Wastewater Use and Added Malaria Risks.” IWMI Internal report, 73. Ghana Office.
Drechsel, P. S. Graefe, M. Sonou, O.O. Cofie. 2006. “Informal Irrigation in Urban West Africa: An Overview.” IWMI Research Report 102. Colombo, Sri Lanka: International Water Management Institute (IWMI). http://www.iwmi.cgiar.org/Publications/IWMI_Research_Reports/PDF/pub102/RR102.pdf
Drechsel, P.; Graefe, S.; Fink, M. 2007. “Rural-urban Food, Nutrient and Virtual Water Flows in Selected West African Cities.” IWMI Research Report 115.Colombo, Sri Lanka: International Water Management Institute (IWMI). http://www.iwmi.cgiar.org/Publications/IWMI_Research_Reports/PDF/pub115/RR115.pdf
Songsore, J. 2008. “Environmental and Structural Inequalities in Greater Accra.” The Journal of the International Institute 16 (1). http://quod.lib.umich.edu/cgi/t/text/text-idx?c=jii;view=text;rgn=main;idno=4750978.0016.105
Ghana Statistical Service. 2005. “2000 Population and Housing Census. Greater Accra Region Analysis of District Data and Implications for Planning.”
Hope, L., Cofie, O., Keraita, B. and Drechsel, P. 2009. “Gender and urban agriculture: the case of Accra, Ghana.” In Chapter 4 of Women Feeding Cities—Mainstreaming Gender in Urban Agriculture and Food Security, ed. A. Hovorka, H. de Zeeuw and M. Njenga, 65-78, published by PRACTICAL ACTION, Warwickshire. http://www.database.ruaf.org/gender/pdf/chapter%204.pdf
Keraita, B. Drechsel, P. Huibers, F. and Raschid-Sally, L. 2002. “Wastewater Use in Informal Irrigation in Urban and Peri-urban Areas of Kumasi, Ghana.” Urban Agriculture Magazine 8: 11-13.
Obosu-Mensah, K., 1999. “Food Production in Urban Areas. A Study of Urban Agriculture in Accra, Ghana.” Ashgate Publishing, 227. Aldershot, UK.
Obuobie, E. 2003. “Institutional Aspects of Urban Agriculture and Wastewater Use in Accra, Ghana.” Unpublished M.Sc. Thesis, Wageningen University. The Netherlands.
Obuobie, E., Keraita, B., Danso, G., Amoah, P., Cofie, O.O., Raschid-Sally, L. and P. Drechsel. 2006. “Irrigated Urban Vegetable Production in Ghana: Characteristics, Benefits and Risks.” IWMI-RUAF-IDRC-CPWF, 150. Accra, Ghana: International Water Management Institute (IWMI). www.cityfarmer.org/GhanaIrrigateVegis.html
World Gazetteer. http://world-gazetteer.com/
ANNeX F 66
annex F: nairobi (Kenya) Case StudyNairobi is Kenya’s political and economic capital and
was founded as a trading center between the Maasai and Kikuyu communities. It started out as a railway town on the Kenya-Uganda Railway in 1896 due to its convenient location between Mombasa and Kampala and grew to become the capital of British East Africa in 1907. When Kenya became independent in 1963, it remained the capital. It is popularly known as the “Green City in the Sun.” Key facts of Nairobi such as population and climate are detailed in Table F1.
Table F1: Key facts of Nairobi
Night-time population 3.1 million (2009)
Area (km2) 696 (2009)
Population density (inhabitants/km2) 4454 (2009)
Annual population growth rate (%) 4.2% (2010)
% of national population 8 (2010)
% of urban population 25 (2010)
Poverty level (% of total city population)
44% (2005)
Unemployment rate (%) 12.2 % (2010)
Climate Tropical highland
Major geographical features Escarpment
Elevation (m above sea level) 1660
Average annual rainfall (mm) 1025
Average low/high temperatures (°C) 10-26
Demographics
Nairobi’s population has grown from only 137,000 people in 1950 to over 3 million in 2009 (2009 Census), which makes it the most populous city in East Africa and the 12th largest city in Africa. It has about five times the population of the country’s second largest city, Mombasa, which has a population of 523,183. Kenya’s average population density is 66 persons per square kilometer, but that of Nairobi is 4,515 persons per square kilometer. Although the growth rate in Nairobi has been steadily declining over the last few decades, it is still higher than the national average. Currently, Nairobi hosts about 25 percent of the country’s total urban population.
Despite the declining population growth rate (see Figure F1), the city has continued to experience an increase in population due to new immigrants. Most of these new
immigrants to the city find accommodation in slums because of the low cost of living associated with such areas.
The top 10 percent of the population of Nairobi accounts for 45.2 percent of the city’s income, while the poorest 10 percent account for 1.6 percent. In terms of population below the poverty line, 30 percent of the Kenyan population in 1970 (Manda, Kimenyi and Mwabu 2001) earned less than $1 a day compared to 60 percent today. Nairobi is one of the most unequal cities in Africa.
Nairobi contributes to a significant 56.5 percent of all urban employment in Kenya. Wage employment in all sectors in Nairobi caters for 60.2 percent of the residents at present, although this number has declined from 72.7 percent in 1989. In terms of unemployment, 50 percent of women and 35 percent of men are unemployed.
Slums
It is estimated that approximately half of the total urban population lives in slums that are concentrated on only five percent of the land. According to Nairobi Process Mapping
Based on data provided in Njenga, M. and Karanja, N. 2011. Urban agriculture: A sustainable solution to alleviating urban pov-erty, addressing the food crisis, and adapting to climate change – Nairobi, Kenya. (Unpublished)
Figure F1: Trends in growth rates of households in Kenya and Nairobi, 1979 – 2009
Trends in growth rates of households in Kenya and Nairobi, 1979 – 2009 (KNBS, 2010)
52
100
1978-1979 1989-1999 1999-2009
Perc
enta
ge
Nairobi Kenya
0
1
2
3
4
5
6
7
6.5
3.9
5.3
3.8
4.2
3.2
67 UrBAN AGrICULTUre: FINdINGS FroM FoUr CITY CASe STUdIeS
(CORDAID 2009) about 70 percent of the city’s residents live in
slums and informal settlements. Nairobi has a very high level
of urbanization with the slum population expected to double
within the next 15 years.
Kibera is considered to be the biggest slum in Africa and
has approximately 700,000 inhabitants. Mukuru is the second
biggest slum in Nairobi with a population of around 500,000.
Other slums with significant populations are Mathare,
Korokocho, and Kawangware.
Although the population densities in the slums vary from
one region to another, they are considerably higher than the
urban average, as one would expect. For instance, in the same
Kibera division, Laini Saba location has a density of 75,942
while Karen has a density of 382.
Administration
Nairobi is one of eight provinces in Kenya, and is composed
of four districts (see Table F2). Nairobi was renamed a county in
the new 2010 constitution and comprises eight constituencies
or divisions and 56 wards and has one local authority, Nairobi
City Council.
Table F2: Districts and divisions in Nairobi
District Constituencies/Districts
Nairobi East Dagoretti
Nairobi West Embakasi
Nairobi North Kasarani
Westlands Kibera
Makadara
Nairobi Central
Pumwani
Westlands
The City Council of Nairobi provides ordinances and
regulations for land use and planning. The city is divided into
19 planning zones, but only two allow a mix of agriculture and
residential developments: Dagoretti in Zone 15 and Kasarani
in Zone 18, which allows conversion of agricultural land
into residential developments. The other area where urban
agriculture is mentioned is in Zone 19, which is identified
as a special scheduled area outside the city of Nairobi
boundary and in which a mix of agricultural and residential
developments is allowed.
Climate
Nairobi is at an elevation of 1,795 metres (5,889 ft), which
contributes to its moderate climate. Nairobi is classified as
having a subtropical highland climate. The warmest part of the year is from December to March, and the coolest from May to August. The annual average temperatures are a high of 23.4°C (74.1°F) and a low of 12°C (53.6°F). Rainfall on average is about 1,024 mm (40.3 inches) annually.
Urban Agriculture in Nairobi
Farming plays a significant role in the lives of the residents of Nairobi, with thousands of kilograms of crops, such as maize, beans, and vegetables, being produced annually (Ayaga and others 2004). In addition, livestock provide the city with a supply of meat, milk, and eggs. For instance, in a recent study in Dagoretti, a Nairobi neighborhood with a high number of urban farmers, the average daily production of a household dairy farm was 3,000 liters of milk (Kang’ethe and others 2005)
Urban agriculture in Nairobi is practiced in backyard farms, on open spaces under power lines, along roadsides, railway lines and riverbanks as well as on institutional land. In the mid-1980s, when the city’s population was around one million, 20 percent of Nairobi households were growing crops and 17 percent kept livestock within the city limits (Lee-Smith and others 1987). It is estimated that 30 percent of 985,016 households in Nairobi are involved in urban farming (Foeken and Mwangi 2000, Government of Kenya 2010).
In the peri-urban areas, urban agriculture is practiced as main source of income. The majority the farmers are women, many of whom are also household heads. There is limited provision for extension services to these farmers and crop and livestock production systems are as diverse as intensive vegetable production for the market, sometimes marked by the over-use of pesticides, small-scale crop-livestock systems with recycling of organic inputs, free-range livestock systems using mixed wastes as fodder, stall-fed livestock using managed organic waste or bought feed, and “sewage farmers” tapping the nutrients from wastewater to increase crop outputs.
For information about survey methodology of this study, please refer to Box F1.
Reasons for Participating in Urban Agriculture
During the year before the survey, 95 percent of the producers grew crops, mainly for access to additional food (78 percent) and, to a lesser extent, for additional income through sales (22 percent).
Two percent of producers ceased to grow crops in the previous year, with 33 percent citing unprofitability, 25 percent said they lacked space, and 17 percent indicating that did not have cash to purchase inputs.
ANNeX F 68
For those farmers who had access to land for agriculture, over 45 percent kept livestock. More farmers in the peri-urban area and peri-urban transition raised livestock (78 and 75 percent) compared to those in urban (15 percent) areas. As with growing crops, the primary reasons for rearing livestock include access to additional income (61 percent) and access to additional food (37 percent). Farmers ceased to keep livestock due to inadequate availability of land (64 percent) and lack of cash for animal replacements/inputs (47 percent).
Length of Residence
As in the other cities surveyed, the respondents who were involved in urban agriculture had stayed in the city the longest or always lived there, as illustrated in Figure F2. More non-producers, who had moved to the city 15 years or less prior, tend to be involved in non-agricultural activities.
Box F1: Survey methodology for the Nairobi case study
Three low-income neighborhoods were selected along the transect in Nairobi city that matched the prescribed criteria. Kibera was selected as the urban area, which is the most densely populated informal settlement in sub-Saharan Africa and is home to about 700,000 people. The majority of people in Kibera earn less than a dollar per day working in nearby industrial areas or engaging in informal businesses. Many people are now venturing into urban agriculture as a way of cutting down on expenses for their already very strained incomes.
Kahawa Soweto has a history of urban agriculture and was selected to represent the peri-urban transition area. Although the area has witnessed an increase in population since the 1970s it still has a dominance of urban agriculture due to a nearby river, an oxidation pond for Kenyatta University sewer waste, and land (mainly railway and riparian reserve) which supports agricultural production. The study sought to identify the factors that have promoted urban agriculture here and how this has contributed to the economy of the area. Lists of producers and non-producers were developed such that the whole informal settlement was covered.
Wangige is approximately 30 km from the city center of Nairobi and has been a major source of agricultural products in the city for many years due to its proximity to an urban market and its conducive climate for agriculture. Over time, Wangige has moved from a rural economy to a peri-urban zone due to the influx of urban residents and the subdivision of agricultural land into plots of up to one-eighth of an acre. The selection of Wangige as a study site captures both its importance as a food source for Nairobi and the effects of the city’s expansion into the area.
Lists of producers and non-producers were developed in collaboration with members of the local community with whom the researchers had worked with for over eight years. Random samples were then selected from the lists. In the urban area, lists of producers and non-producers were developed at the village level in all the ten villages comprising Kibera settlement. At the peri-urban transition level the list covered the whole settlement, which consists of one village, and in the peri-urban area four villages were covered.
A total of 900 respondents were interviewed comprising 600 producer and 300 non-producer households in the three zones along the transect.
Table F3: Information about the areas selected for the study in Nairobi
Location Male Population
Female Population
Total Population
Number of Households
Area (sq. km)
Population Density
Kibera 48,001 39,548 87,549 28,878 1.6 56,483
Kahawa 29,866 26,571 56,437 14,950 15.1 3,740
Wangige 20,591 20,869 41,460 12,802 15.8 2,625
Figure F2: Length of residence of producers and non-producers in NairobiLength of stay
52
100
0
20
40
60
80
100
30 100
Non-Producers
Share of households by type, percent
Perc
enta
ge o
f hou
seho
lds
by y
ears
Producers
0
5 years or less
6-15 years
Above 15 years
Always here
5 years or less
6-15 years
Above 15 years
Always here
69 UrBAN AGrICULTUre: FINdINGS FroM FoUr CITY CASe STUdIeS
Types of Crops Grown
There are variations in the types of crops grown by producers along the transect, as shown in Figure F3. For instance, producers in urban areas grow more green leafy vegetables, such as kale and spinach, whereas in the peri-urban transition and peri-urban areas maize and beans are the popular choice.
Types of Animals Reared
Poultry (mostly layers) were the most common type of animal reared across the three transect zones. Table F4 shows that urban farmers reared poultry exclusively, whereas their counterparts in the peri-urban transition and peri-urban areas raised a greater variety of animals.
Space Available for Growing Crops and Rearing Animals
Figure F4 illustrates that most producers in the urban area grow crops. In the peri-urban transition area, producers are almost equally likely to either grow crops or raise animals, whereas in the peri-urban area it is common to find producers doing both.
Most of the land used by households was public land (41 percent) and land owned by producers (40 percent). As shown in Figure F5, in the urban area it was more common to find producers using publicly available land, whereas in the peri-urban area most of the land was owned. It was also common to find that households leased land for urban agriculture,
indicating the importance of investing in agriculture as
a source of livelihood. This ties in with Figure F6, which
shows the location of the space of land used by producers.
As mentioned above, urban producers use more urban
open spaces, while those in the peri-urban area use land or
containers around the home for raising animals and growing
crops.
Forty-eight percent of urban farmers accessed land for
agricultural production in the previous six months, but in the
peri-urban area almost all of the farmers worked without
fear of eviction while in the urban area only 15 percent did.
Maize
Main crops grown by producers
0 10 20 30 40 50 60 70 80 90 100
Bananas
Arrow roots
Other
Amaranthus
Cowpeas
Potatoes
Spinach
BeansKales
Peri-Urban
Peri-UrbanTransition
Percentage
Urban
29.5 21.6 5.7 12.2 5.7 1.6 9.5
35.85.1 28.3 2.4 7.1 10.2 3.5 6.7
14.3
45.7 9.1 9.8 13.8 2.4 2.64.7 10.4
0.4
1.31.1
0.4
Figure F3: Main crops grown by producers in Nairobi
Table F4: Livestock owned along transect zone in Nairobi (percent)
Type of Animal Urban Peri-Urban Transition Peri-Urban Total
Cows 0.0 8.0 38.8 20.0
Bulls 0.0 2.8 5.1 3.4
Sows 1.8 2.8 5.1 3.7
Boars 0.0 2.3 1.0 1.5
Piglets/young pigs 0.0 3.3 3.1 2.8
Finishing/fattering pigs 0.0 2.8 1.5 1.9
Goats/Sheep 1.8 17.8 11.7 13.3
Poultry (layers) 69.6 39.9 27.6 38.3
Poultry (broilers) 26.8 17.8 4.6 13.3
Rabbits 0.0 2.3 1.5 1.7
ANNeX F 70
In the peri-urban transition area, the numbers are more equalized between crop production and animal rearing, although the former is still more popular among farmers. In the peri-urban area, it was common to find producers engaged in both forms of urban agriculture.
Farmers who had access to land but did not use it for crop production in the previous six months before the survey cited reasons that included not having enough land (41 percent), crop production not being profitable for family use (32 percent) and lack of cash to buy inputs (27 percent).
Those who practiced farming as their main occupation had larger
areas under cultivation or to raise animals than those whose main occupation was not farming. This trend was found in all areas of the transect.
Inputs Used for Urban Agriculture
Manure was the main nutrient used by almost 61 percent of producers across the transect. Wastewater was used most commonly by urban producers than their counterparts in other areas, as shown in Figure F7. The choice of fertilizer used was independent of the socio-economic status of the producers. Other inputs included purchased seedlings/seeds and water for irrigation.
Table F5 illustrates the inputs used for livestock production. Across the transect, the use of inputs such as veterinary services, animal feed, purchase of new animals, and hired labor increased from urban to peri-urban transition to peri-urban.
Livestock
Current land use by area
0 10 20 30 40 50 60 70 80 90 100
IdleBothCrops
Peri-Urban
Peri-UrbanTransition
Percentage
Urban
20.9 46.5
54.1 40.1 3.2 2.7
32.6
90.7 2.46.6
0.3
Figure F4: Current land use by area in Nairobi
Figure F5: Type of land owned by producers in NairobiType of Land Owned by Producers
0
20
40
60
80
100
25 50 75 100
Owned
Owned
Owned
Leased/Rental
Leased/Rental
Leased/Rental
Public Land
Public Land
Used without PermissionUsed without Permission
Used without Permission
Shared Among GroupOther
Peri-Urban
Share of households by area, percent
Perc
enta
ge o
f hou
seho
lds
by c
ateg
ory
Peri-UrbanTransition Urban
0
Table F5: Inputs used for livestock production in Nairobi
Inputs Urban Peri-Urban Transition Peri-Urban Total
Veterinary services 28.9 41.4 75.4 54.0
Purchase of feed 44.4 64.0 76.3 66.1
Hired labor 2.2 11.7 20.3 13.9
New animal stock 0.0 10.8 16.1 11.3
71 UrBAN AGrICULTUre: FINdINGS FroM FoUr CITY CASe STUdIeS
Livelihood
Farming is the primary occupation for producers reported by 36 percent of households, as shown in Figure F8. Figure F9 illustrates that 77 percent of households who said farming was their primary occupation do not have a secondary occupation, while 14 percent are casual laborers. For non-producers, casual labor is a common primary occupation followed by informal business.
Family time and labor spent on urban agriculture depends on the size of land, intensity of the practice, and number of livestock. In the peri-urban transition area, most labor for vegetable production was provided by women, while in the peri-urban and urban zones, vegetable production was highly commercialized and both men and women were involved. For poultry farming, labor was primarily provided by women and children, while men were more involved with the commercial aspects. This was mainly seen in the peri-urban transition area.
Table F6 shows sources of income for producers and non-producers, indicating that growing crops and rearing livestock were the main sources of income for those producers whose primary occupation is urban agriculture. On the other hand, for those producers whose secondary occupation is farming, the main sources of income were growing crops and
casual labor. For non-producers the main sources of income
were casual labor and informal business.
The majority of the producer households in the peri-urban
transition and peri-urban areas reported livestock and crops
as the main sources of income, followed by casual labor. In the
urban area, the most common form of urban agriculture being
Figure F6: Location of space used by producers in NairobiLocation of Space by Producers
0
20
40
60
80
100
25 50 75 100
Containers inhomestead
Containers inhomestead
Peri-Urban
Share of households by area, percent
Perc
enta
ge o
f hou
seho
lds
by c
ateg
ory
Peri-UrbanTransition Urban
0
Containers inhomestead
Homestead plot
Homestead plot
Homestead plot
Urban plot away from house
Urban plot away from house
Urban plot away from house
Urban open space
Urban open space
Rural farm Rural farm
OtherInputs
Types of fertilizer and other inputs used
0 10 20 30 40 50 60 70 80 90 100
Purchased seedlings/seeds
Hired labor
Water/irrigation
Pesticides
Manure
Vegetative Compost
Wastewater
Chemical Fertilizer
339.7
127.4
6.7
58.688.5
47.5
7.529.1
70.4
29.121.1
5.4
87.267.7
79.8
4.533.1
24.6
31.1
15.221.8
Percentage
Fertilizer
Peri-Urban Peri-Urban Transition Urban
Figure F7: Types of fertilizers and other inputs used for crop production in Nairobi
ANNeX F 72
practiced is crop production, whereas a very small number
of urban farmers rear livestock. Casual labor and informal
businesses are common forms of employment, primarily in
the urban area, followed by the peri-urban transition area
and less so in the peri-urban zone.
Income from Urban Agriculture
Figure F10 illustrates the proportion of income earned
from crop production. Along the transect, the majority of
producers seems to earn a “moderately important” percent
of their income from crops, while in peri-urban transition
area a negligible proportion earns a “very important” percent
of income through crops. In the case of rearing livestock
(Figure F11), the majority of producers earns a “moderately
important” percent of their income from livestock in peri-
urban and peri-urban transition areas. In the peri-urban area,
a similar number of producers receive a “very important” and
“less important” percentage of their income from this source.
In contrast, in the urban area the majority of producers
receive a “less important” percent of their income from this
Figure F8: Primary occupation of household heads in Nairobi
ProducerNon-Producer
Perc
enta
ge
Farmer
Informal business
Casual labor
Other
0
10
20
30
40
50
60
70
80
90
100
Primary and secondary occupation of household heads
15.7
50.7
33.6
19.5
28.6
15.6
No secondary occupation
Casual labor
Informal business
Other
Secondary occupation of farmers
76.7
14.2
6.82.3
36.3
Figure F9: Secondary occupation of producers in Nairobi (percent)
Table F6: Percentage sources of income for producers and non-producers in Nairobi*
*Numbers add up to more than 100 percent because respondents could choose more than one answer.
73 UrBAN AGrICULTUre: FINdINGS FroM FoUr CITY CASe STUdIeS
source, and none of them earned a “very important” percent of their income from livestock.
The general state of dwellings of producers and non-producers is described in Box F2.
Expenditure
Ninety-eight percent of the respondents spend their income on food, which accounts for almost 40 percent of the total expenditure while 2 percent of respondents depend purely on agricultural produce as their source of the food. It was observed that non-producers spend 40 percent of their income on food, which is higher but not significantly different from producers.
Producers spend about 20 percent of their income on education as compared to 13 percent spent by non-producers. On shelter, non-producers spend more (17.2 percent) than producers do (11.4 percent). However, only expenditure on education is found to be statistically significant between producers and non-producers, where producers spend more than non-producers do.
Table F7 shows the share of expenditures for producers and non-producers across the transect. Respondents tend to spend more on shelter in the urban area, while in the peri-urban area the expenditure on health is higher than in other areas.
General Food Situation
Table F8 summarizes the impact of consumption of one’s food produced. The majority of producers (82 percent) said that consuming their own food benefits them by providing extra food. Other benefits include being able to buy other types of food with the money saved and having a more diverse diet.
When producers and non-producers were asked about their food situation in the previous four weeks, it was found that both groups sometimes do not have enough to eat. There were no statistically significant differences between the two groups; however, differences were seen along the transect and were similar for both groups. For instance, those in the peri-urban areas always had enough to eat of what they wanted compared to those in the peri-urban transition area, and those in the peri-urban transition area were better off than their counterparts in the urban areas.
When considering the food situation in the previous year, there were only two situations in which there were statistically significant differences between producers
and non-producers. When asked if respondents had to eat
some foods that they did not want to eat due to lack of
money, more producers than non-producers answered yes.
Figure F10: Proportion of income from crop production along the transect in Nairobi*Proportion of income from crop production along the transect
52
100
0
20
40
60
80
100
25 50 75 100
Less Important
Less ImportantLess Important
Moderately important
Moderately important
Moderately important
Very importantVery important Very important
Peri-Urban
Share of households by area, percent
Perc
enta
ge o
f hou
seho
lds
by c
ateg
ory
Peri-UrbanTransition Urban
0
*Categories of income: Less important: less than 25%; Moderately important: 25-75%; Very important: more than 75%.
Figure F11: Proportion of income from rearing animals along the transect in Nairobi*Proportion of income from rearing animals along the transect
52
100
0
20
40
60
80
100
25 50 75 100
Less Important
Less Important
Less Important
Moderately important
Moderately important
Moderately important
Very importantVery important
Peri-Urban
Share of households by area, percent
Perc
enta
ge o
f hou
seho
lds
by c
ateg
ory
Peri-UrbanTransition Urban
0
*Categories of income: Less important: less than 25%; Moderately important: 25-75%; Very important: more than 75%.
ANNeX F 74
When asked if there were times when there was no food to
eat in the house due to lack of money, more non-producers
responded affirmatively than producers. Both groups were
equally concerned about running out of food and not having
the kind of food they liked due to lack of money. Along the
transect, more respondents, both producers as well as non-
producers, in the urban area had concerns about food than in the peri-urban transition and peri-urban areas.
Food Diversity
When considering food diversity, or the different types of food groups consumed, the survey results indicate a very low consumption of animal-based products, except for high levels of milk consumed, but this is primarily for making tea and is thus used in small quantities. There are no significant differences in household dietary diversity between producers and non-producers; however when analyzed against the individual food groups, there are statistical differences in the consumption of yellow/orange vegetables (e.g.: pumpkins, carrots, sweet potatoes) with a higher proportion being consumed by producers (18 percent) compared to non-producers (12 percent). Producers also eat more plant- and animal-source proteins, which could be associated with a higher purchasing power from the sale of leafy vegetables (Figure F12).
Along the transect, some significant differences are noted between producers and non-producers. In the urban area, more non-producers consume milk and meat products than producers. On the other hand, in the peri-urban transition area, more producers eat vegetables and meat compared to non-producers. In the peri-urban area, a higher proportion of producers eat legumes, yellow/orange vegetables, and tubers, while more non-producers eat yellow/orange fruit, such as mango and papaya.
Source of Food
Based on the responses to the survey, over 96 percent of respondents bought fresh food, which was prepared at home; however, there were statistically significant differences along
Box F2: General state of dwellings of producers and non-producers in Nairobi
As in the case of Lima, few differences were found between non-producers and producers, although the general quality of houses tended to improve along the transect from urban to peri-urban. For instance, in the urban area, most walls were made of mud/dirt, while in the peri-urban transition area, brick and wood are more commonly used. In the peri-urban area, most respondents use iron sheets and brick for their walls and floors.
Respondents in the peri-urban area tend to live in bigger and better quality houses than their counterparts in other areas.
Charcoal was the most common source of cooking fuel along the transect. Bottled gas is not commonly used, although the largest number of users tends to be in the peri-urban area surprisingly. The use of firewood increases along the transect.
For lighting purposes, a couple sources are commonly used. Kerosene is more common in the peri-urban transition area followed by the urban area, while electricity is more common in the urban and peri-urban areas than in the transition area. It is interesting to note that solar power is used in the transition area, which was not found in any other areas.
In Nairobi the number of household members is statistically significant higher in the case of producers than non-producers, with a mean of 4.6 and 3.8 respectively
Table F7: Household expenditures along the transect in Nairobi (percent)
Expenditure Item Urban Peri-Urban Transition Peri-Urban Total
Shelter 18.9 8.5 6.7 13.3
Education 16.9 19.8 16.4 17.5
Food 39.4 41.4 38.2 39.6
Loan/debt 0.4 1.8 1.8 1.1
Clothes 3.0 6.3 6.8 4.8
Health 5.1 6.7 10.3 6.8
Family events 0.2 1.1 0.4 0.5
Transport 2.5 5.3 5.6 4.0
Utilities 13.1 8.2 11.6 11.5
Domestic help 0.2 0.6 0.6 0.4
Other 0.2 0.4 1.6 0.6
75 UrBAN AGrICULTUre: FINdINGS FroM FoUr CITY CASe STUdIeS
the transect. A statistically significantly higher proportion of respondents in the urban (68 percent) and peri-urban transition area (74 percent) bought food prepared in restaurants and other eateries than those in the peri-urban area (33 percent). In the peri-urban transition area, households reported getting at least some of their food from government programs (12 percent), whereas almost no households from the urban and peri-urban areas cited this as a source.
There are some significant differences between producers and non-producers in some of the scenarios presented to the respondents. For instance, in the peri-urban transition area more producers buy fresh food and prepare it at home compared to non-producers. In the peri-urban area, more non-producers buy food from eateries than producers do.
Table F8: The impact of consumption of one’s own food produced in Nairobi*
Effect of consuming own food Urban Peri-Urban Transition Peri-Urban Total
Saves money to purchase other types of food 65.4 70.3 73.3 68.6
Monetary saving on food purchases 42.9 32.9 34.7 38.3
Saves money for other household purchases 34.9 36.1 36.0 35.5
Provides extra food 86.7 69.0 86.0 82.0
Provides a more diverse diet 59.5 60.0 70.7 62.4
Has an effect in another way 12.3 13.5 16.0 13.5
Little or no effect 3.3 12.9 4.0 5.9
*Numbers add up to more than 100 percent because respondents could choose more than one answer.
Food diversity: Consumption of 15 food groups by producers and non producers in the previous 24 hours
0 10 20 30 40 50 60 70 80 90 100
Cereal and grain
Green leafy vegetables
Milk and milk products
Other vegetables
Legumes
Tubers
Yellow/orange vegetables
Other fruits
Other meats
Fish
Yellow/orange fruit
Eggs 3.63.7
5.1
7.16.5
8.17.1
1413.9
17.712.2
35.629.6
42.639.8
60.659.2
74.570.3
73.971.1
98.698.2
3.5
Non-Producer Producer
Figure F12: Food diversity showing consumption of 15 food groups in the previous 24 hours in Nairobi*
*Annex A provides a detailed description of foods contained in each group
ANNeX F 76
Figure F13: Map of Nairobi showing survey sites
Figure F14: Map of Kenya
77 UrBAN AGrICULTUre: FINdINGS FroM FoUr CITY CASe STUdIeS
ReferencesAyaga, G., Kibata, G., Lee Smith, D., Njenga, M., Rege, R. 2004. “Policy Prospects for Urban and Peri-urban Agriculture in
Kenya.” Results of a Workshop Organized by the Kenya Agricultural Research Institute (KARI), Urban Harvest – CIP & International Livestock Research Institute (ILRI), 2004. Nairobi.
CORDAID. IHS and Eco-Build Africa. 2009. “Nairobi Process Mapping.” CORDAID. The Hague, Netherlands.
Foeken, D. and Mwangi, A. 2000. “Increasing food security through urban farming in Nairobi.” In Growing Cities, Growing Food: Urban Agriculture on the Policy Agenda, ed. Bakker N., Dubbeling M., Gündel S., Sabel-Koschella U. and de Zeeuw H, 303-328. Feldafing, Germany: Food and Agriculture Development Centre.
Kang’ethe, E.K., Randolph, T.F., McDermott, B., Lang’at, A.K., Kimani, V.N., Kiragu, M., Ekuttan, C., Ojigo, D., Onono, J., Ngonde, A. & Miriti, G. 2005. “Characterization of Benefits and Health Risks Associated Urban Smallholder Dairy Production in Dagoretti Division, Nairobi, Kenya.” Project Report to IDRC. Ottawa: IDRC.
Lee-Smith, D., Manundu, M., Lamba, D. & Gathuru P.K. 1987. “Urban Food Production and the Cooking Fuel Situation in Urban Kenya.” Nairobi: Mazingira Institute.
Manda, Kulundu, Mwangi Kimenyi and Germano Mwabu. 2001. “A Review of Poverty and Antipoverty Initiatives in Kenya.” KIPPRA Working Paper.
Republic of Kenya. 2009. “2009 Census.” Nairobi: Government of Kenya.
ANNeX G 78
annex G: Lima (Peru) Case StudyLima, built as the foundation of the Spanish “City of the
Kings” in 1535, is the capital of Peru and the fifth largest
metropolitan area in Latin America. Lima comprises of
the Province of Lima and the Constitutional Province of El
Callao and has a total population of 9,262,000 people. Some
information about Lima is described in Table G1.
Table G1: Key Facts of Lima
Night-time population Metropolitan area: 8.29 million (2011)
Area (km2) Metropolitan area: 2,821 (2008)
Population density (inhabitants/km2) 3280
Annual population growth rate (%) 1.1 (2008)
% of national population 30 (2009)
% of urban population 36 (2010)
Poverty level (% of total city population)
29.2 (2009)
Unemployment rate (%) 28.3 (2009)
Climate Cool desert
Major geographical features Coastal region Desert plain
Elevation (m above sea level) 0-500
Average annual rainfall (mm) 25
Average low/high temperatures (°C) 12-27
Demographics
Lima is the fifth most populous city in Latin America and
one of the 20 largest metropolitan areas in the world. Lima
Metropolitan Area has a population of 8,445,200 accounting
for 30.8 percent of the country´s population and El Callao
has a population of 876,900 that accounts for 3.2 percent of
the country´s total population. (INEI 2008) Fifty-one percent
of the population is female. In 2007, 75.9 percent of the
country’s population lived in urban areas compared to 35.4
percent in 1940 and 59.5 percent in 1971. This is because Lima
and Callao Metropolitan Area continue to attract migrants
from all over the country, thus reflecting considerable ethnic
and cultural diversity. (INEI 2009) In the last two decades,
the city has experienced major rural-urban migration due to
shifts in economic productivity and opportunities in the city.
This shift is reflected in the migration of the population from
the interior highlands to the coastal areas, where Lima and
Callao are located. In 2009, 11.8 percent of the population
in Lima was considered to be poor, while 17.4 percent lived below the poverty line. (ENAHO 2009)
Administration
The city of Lima is administered by the Metropolitan Municipality of Lima, which is subdivided into 43 districts. The Office of the Mayor is the executive entity and the Metropolitan Municipal Council is the regulatory and oversight entity. This council is made up of the Mayor and 38 councilors and is the legal representative for the municipality as well as its highest administrative authority. The Constitutional Province of Callao, made up of six Municipal Districts, is subject to a special regime, which gives the regional government and the provincial municipality the same territorial jurisdiction.
Geography and Climate
Lima Metropolitan Area and El Callao together form one city that is considered to be one of the largest urban sprawls in the world. The city is on average 101 meters above sea level and is located on desert plains that are characteristic of that coastal region. It is surrounded by hills and valleys through which the rivers Chillón, Rímac, and Lurín flow all year round.
Lima’s climate is considered to be subtropical, although its proximity to the Pacific Ocean gives it a cool climate. There are two distinct seasons: summer, from December to April, which tends to be warm, sunny, and humid; and winter, from June to October, when the weather is cool, humid, breezy, and grey. The average annual high and low temperatures are 22°C (71.8°F) and 16.7°C (62°F) respectively. Lima gets an average of 13 mm (0.5 inches) of rain a year, which impacts the amount of water supplied to the city, which mainly comes from wells and rivers originating in the Andes mountain range. Lima is severely impacted by El Niño, when temperatures tend to be warmer than normal, and La Niña, when cooler climate prevails.
Water Resources and Land Use
Due to the low average rainfall in the region, the Lima and El Callao Metropolitan Areas rely on water from the Chillón, Rimas, and Lurin rivers and a system of 20 lakes in the Yuracmayo reservoir area that capture water from the
Penny, M., H. Creed-Kanashiro, Carrasco, M., Marin, M., Merzthal, G., Santandreu, A. 2011. Urban Agriculture: A sustainable solution to alleviate urban poverty, respond to the food crisis and adapt to climate change Lima, Peru. (Unpublished)
79 UrBAN AGrICULTUre: FINdINGS FroM FoUr CITY CASe STUdIeS
Atlantic basin and transfers it to the Pacific basin. According to recent studies (LiWa 2009) and estimations made by SEDAPAL (Public Water Company for the Lima and Callao Metropolitan Area) these reserves are insufficient to deal with “water stress” situations or water scarcity that could come about as an effect of climate change. The strong competition for water use for both human consumption and for irrigation has led to the use of (not always treated) wastewater. In Lima and Callao Metropolitan Areas, there are 37 examples of wastewater use, which is used to irrigate a total of 985 hectares of agricultural and green areas. (Moscoso and Alfaro 2008) Even though in most of these sites the wastewater is treated, there are three vegetable sites that use untreated wastewater, covering about 40 percent of the total area of land irrigated with wastewater in Lima.
Although land use has been classified through ordinances in the Lima Metropolitan Area, various modifications, especially in some agriculture-intensive districts such as Lurin or Lurigancho-Chosica, made in recent years have been strongly criticized. In 2010, 23 municipal districts modified their territorial planning priorities towards urban development above other land use. As a consequence, the growing peripheries of the Lima and Callao Metropolitan Areas (in the so-called northern, eastern, and southern “cones”) have not only occupied uncultivated areas but also areas that were dedicated to farming activities in an unplanned manner. A good example of this is Lurigancho-Chosica, which between 2002 and 2006 lost 305 ha of agricultural land due to zoning
changes. (Castro and Juárez 2007) This situation directly influences the types of urban agriculture found in the city, both in the urban and transition zones.
Urban Agriculture in Lima
Despite the accelerated urban growth in the last few years, agriculture is still being practiced in the areas around Lima and to a lesser extent within the city itself. According to the records of the Chillón, Rimac, and Lurin rivers in 2006 there was a total of 12,680 ha under irrigation belonging to 7,601 farmers organized in 35 commissions responsible for river water irrigation.
In addition, there are other areas of the city that depend on water from wastewater treatment plants for agriculture. Parts of the districts of Villa El Salvador (130 ha), San Juan de Miraflores (12 ha), and Ventanilla (50 ha) are included in this type of agricultural area.
The most important crops grown are vegetables, grass, and forage in Rimac; fruit orchards, vegetables, ornamental plants, and maize in the valley of the Lurin river; and maize and aromatic plants in the valley of the Chillón. On a much smaller scale, urban agriculture is carried out in small spaces (patios, flower pots, small public spaces) ranging from 1 m2 to 10,000 m2. The crops grown in these areas are mostly used for home consumption and usually no chemicals are used in the cultivation. (Soto y Siura 2008)
Box G1: Survey methodology for the Lima case study
The project was implemented in four districts of Metropolitan Lima that were selected for their appropriateness along the transect from the urban to the peri-urban interface. For urban, two areas were selected: Villa María del Triunfo (VMT) with target settlements of Pachacutec, Nueva Esperanza, and Yanavilla, and Callao comprising target settlements of San Agustín and 200 Millas. Lurigancho-Chosica (LC), with target settlements of LC and Nieveria, was identified for the peri-urban transition, and Pachacámac with target settlement of Santa Anita for the peri-urban area.
These four districts were selected to represent the different degrees of urban development. The two urban districts—Callao and VMT—represent two distinct types of urban agriculture because of very different urban development scenarios. The peri-urban transition area, located in the eastern zone where agricultural practices are maintained, is an area where the city has begun to surround farmers, and a traditionally agricultural area in Pachacamac where food production has begun to compete fiercely with other land uses. Box 2 provides more information about the districts surveyed.
Table G2: Information about the municipal districts selected for the study in Lima (INEI 2007a; INEI 2007b)
Area Population Population Density per km²
Percentage of population in
poverty
Surface area (km²)
Villa María del Triunfo Intra urban 378,470 5,405.30 27.1 70.57
Callao Intra urban 415, 888 9,255.90 18.8 45.65
Lurigancho-Chosica Peri-urban transition
169,359 721.83 27.2 236.47
Pachacámac Peri-urban 68,441 430.5 34.0 160.23
ANNeX G 80
It is possible to identify and analyze urban agriculture experiences in intra- and peri-urban areas. While intra-urban agriculture is carried out in public and private spaces that are available within the city, peri-urban agriculture generally uses private spaces, located in the peripheral areas in transition. The main systems of production under this modality are:
(i) Micro agriculture in and around the home;
(ii) Communal/community horticulture;
(iii) Institutional urban agriculture (for example, in colleges and meal centers);
(iv) Small-scale (semi-) commercial horticulture; and
(v) Small scale (semi-) commercial livestock and fish
farming.
Box G1 provides details on the survey methodology used in
Lima, while Box G2 describes the sites surveyed.
Reasons for Participating in Urban Agriculture
As with other cities in the study, the primary reasons
for participating in urban agriculture are additional source
of income and access to additional food. In the peri-
Box G2: Description of sites surveyed in Lima
Villa María del Triunfo: The Municipal District of Villa Maria del Triunfo is 100 percent urban and is part of the poverty belt that surrounds Lima. The district is organized into six zones separated from each other by a complex mountainous geography. VMT is located in a desert with very low annual rainfall. Economic activity in the area includes unskilled labor, street vendors, unskilled/semi-skilled service workers, and informal businesses. In addition, there is also a small segment of the local economy that focuses on agriculture and fishing. The main agricultural activity is the production of fruits and vegetables on individual, community, and institutional land for self-consumption as well as for sale; however, this activity is not often registered in the census information. There is a major deficit of green areas, with only 0.5 m2/person. (INEI 2007a). The study areas include two neighborhoods of VMT: Pachacutec and Nueva Esperanza.
With respect to urban agriculture, VMT has four principal types of activity:
i) Production of agricultural supplies, such as compost and seeds, on a family/artisan basis;
ii) Food processing on a non-industrial/occasional basis, such as jam making;
iii) Cultivation of crops and animal husbandry, principally vegetables, fruit, and raising small animals;
iv) Commercialization of animal products on a small scale.
These activities are mostly carried out on private land, plots in the family garden, communal land, institutional farms (e.g.: areas belonging to schools, private institutions), and land that is not suitable for construction, such as land destined for roads and under high-tension electricity power lines. (IPES 2006)
Callao: Located on the banks of the Rimac River and to the northeast of downtown Lima, Callao Municipal District exhibits characteristics of the valleys of the Peruvian coast, with an altitude varying between 2 and 65 meters above sea level. The terrain leads to an extensive bay in the delta of the Rimac River. Within this setting, there are several areas where agricultural production takes place, especially around the airport, as construction is limited around that land.
Callao’s main economic activities are retail, commerce, communications, some industrial production, and real estate rental earnings. Similar to VMT, agricultural production accounts for a relatively insignificant proportion of economic activity. Callao’s soil is considered the most suitable for agricultural production in the province of Lima. (Matos Mar 1990) However, rapid urbanization and the growth of human settlements have resulted in the dominance of residential land use in the area.
Lurigancho-Chosica: The municipal district of Lurigancho-Chosica is a peri-urban transition area and the second largest district within Metropolitan Lima. Like Callao, it is also located on the banks of the Rímac River. As in VMT, the main occupations in the district are unskilled labor, informal commerce, unskilled service workers, and day laborers. There are about 150 shantytown settlements in the district.
The area consists of four irrigation sub-sectors: Ñaña, LC, Nievería, and Huachipa, in which there are 1,000 farmers who own their agricultural land and 3,000 agricultural producers without farmland who practice urban agriculture mostly in patios and flower pots. More than 4 percent of the population practice urban agriculture of which most of them are men. (INEI 2007a) The main agricultural activity is the production of fruits and vegetables and rearing of animals for sale and household use. The area has an average green space of 1 m2/person. (GEA 2010) The average size of the farms in this area is 1.5 ha and each family has an average of three plots.
Pachacamac: The Municipal District of Pachacamac is located in the central Peruvian coast 25 km south of Lima. The area is experiencing an expansion of human settlements and diversification of land use due to zoning changes. Unskilled labor, informal business, unskilled service work, and construction work are the main economic activities in the district. Agricultural activity accounts for 6.2 percent of the employment of which most are independent male workers over 50 years of age in addition to unpaid family workers. (INEI 2007a) The main agricultural activity is the production of fruits and vegetables for sale. There is 1.1 m2/person of green space in this area, which presents a deficit, although urban agriculture is practiced on nearly half of the total surface of the Pachacamac.
81 UrBAN AGrICULTUre: FINdINGS FroM FoUr CITY CASe STUdIeS
urban transition and urban district of Callao, 45 percent
of respondents cited that their reason for practicing urban
agriculture is to have an additional source of income, compared
to 15 percent of households in the other urban district, VMT.
Access to additional food was considered the principal reason
for cultivating crops by 43 percent of respondents in the peri-
urban area and 38 percent in the urban district of VMT. A
higher proportion of households (20 percent) in Lima grow
crops for recreation than in other cities in the study. In VMT,
a further 12 percent said the main reason was to make their
environment more attractive.
Fifty-six percent of producers cultivated their land in the
six months prior to the survey. For a very small percentage of
those who had ceased cultivation, the reasons cited were that
they found alternative work, cultivation was not economically
worthwhile, and they had no money for supplies.
Length of Residence
In almost all districts surveyed, there is a significant
difference between the producers and non-producers in
terms of how long they have lived there, as shown in Figure
G1. Agricultural families have been living in the zones along
the transect, except Callao, longer than non-producers.
Types of Crops Grown
The most common crops that are produced and sold or
consumed in the home are summarized in Table G3. The
study looked at crops that were either mostly consumed at home or sold and found that in the peri-urban transition area and in one urban area, Callao, a greater variety of foods are sold than consumed at home. In contrast, a higher number of crops are consumed at home in the urban area of VMT and the peri-urban area compared to the transition area and Callao. This illustrates the different patterns of use of the crop production along the transect. More vegetables are sold and fruits consumed in one urban area (Callao), the peri-urban transition, and peri-urban areas than in the other urban area (VMT), in which more fruit is sold and more vegetables tend to be consumed.
Types of Animals Reared
Overall, raising animals was more common than cultivating crops as over 67 percent of farmers had produced animal products or meat either on their own or also cultivating crops in the previous six months before the survey.
Table G4 shows the primary animals raised and their consumption by households. The most common farm animal raised was poultry. Fifty percent of all households surveyed engage in this activity, with the highest in the peri-urban and one urban area (Callao) and the lowest in the other urban area (VMT). Most of the production was used for household consumption. Eggs were a common product produced by 32 percent of the households across all the transects and mostly consumed at home.
Average length of stay for producers and non-producers along the transect (years)
0 5 10 15 20 25 30 35 40
Urban (Callao)
Urban (VMT)
Peri-Urban Transition
Peri-Urban
Non-producer
Producer
Figure G1: Average length of residence of producers and non-producers along the transect in Lima
ANNeX G 82
Guinea pigs were the other main source of animal
products. Between 12 to 23 percent of guinea pigs were
reared in households across the transect, of which more than
two-thirds were used for household consumption and one-
third sold. Beef/veal, pigs, and goats/sheep were raised to a
lesser extent in all the districts.
In general, it appears that across the transect chickens are mainly kept for home consumption of eggs and meat. If producers raise other animals it is more likely to be for sale although the family uses part of the production for its own consumption. The production of guinea pigs shows a more mixed pattern with about one-third going for sale.
Space Available for Growing Crops and Rearing Animals
Figure G2 illustrates the type of land owned by producers. Just over half the land (52 percent) used for raising animals and growing crops in the survey is owned by the household regardless of whether the primary occupation of the household is farming or not, and there seems to be little variation in the transect. Many respondents chose not to answer this question, so it is difficult to get an accurate picture of ownership.
The common locations for growing crops or raising livestock were in containers in the homestead (59 percent) or in plots around the home (29 percent). For those whose principal occupation is farming, plots around the house were used more frequently (43 percent).
The land used by producers is mostly used for raising livestock. This is likely because most of the producers in the survey raise animals as compared to growing crops, so it would be expected that they use their land more for rearing animals.
A comparison of the state of dwellings between producers and non-producers is presented in Box G3.
Inputs Used for Urban Agriculture
The inputs used by producers in the six months before the survey are shown in Table G5. The most common type of fertilizer used across the transect is animal manure, followed by chemical fertilizers. The latter is more frequently used in urban (Callao) and peri-urban transition areas than in peri-urban areas. In the other urban area, VMT, most households
Table G3: Top 20 crops grown for sale and home consumption in Lima
Food*Percent
Sold (>50%)
Food**Percent
Consumed (>50%)
Radish 73.8 Radish 40.6
Beetroot 63.3 Banana 88.2
Coriander 67.3 Sweet potato 73.7
Lettuce 51.3 Huacatay 20.5
Huacatay 79.3 Hot pepper 74.8
Basil 70.3 Figs 91.5
Parsley 64.9 Aloe vera 69.2
Celery 83.9 Avocado 76.2
Mint 55.6 Tomato 88.1
Turnip 89.5 Onion 50.4
Leek 79.2 Hierba luisa 74.5
Tomato 53.7 Chala 55.3
Chard 57.4 Oregano 75.0
Spinach 60.3 Potato 85.7
Spring onion 83.7 Passion fruit 92.1
Carrot 56.2 Pacae 98.6
Chala 53.2 Spring onion 79.6
Cabbage 67.1 Guayabas 84.6
Squash 61.5 Cassava 87.6
Chincho 94.0 Granada 90.0
* Twenty most commonly cultivated foods that at least 50% of the harvest is sold.
** Twenty most commonly cultivated foods that at least 50% is used for home consumption.
Table G4: Primary animals raised and their consumption by households in Lima* (percent)
District
Poultry Beef/Veal
Raised by Producer Household
Amount Consumed by Household
Raised by Producer Household
Amount Consumed by Household
Urban (Callao) 52.2 87.5 10.6 69.8
Urban (VMT) 28.5 100.0 14.0 91.4
Peri-Urban Transition 44.9 80.8 18.6 90.2
Peri-Urban 76.2 91.3 7.3 73.6
*Numbers add up to more than 100 percent because respondents could choose more than one answer.
83 UrBAN AGrICULTUre: FINdINGS FroM FoUr CITY CASe STUdIeS
used manure or organic compost probably because these
were mostly small household plots. A similar pattern is seen
for pesticide use. This may be due to the fact that organic
farming is being promoted in VMT and LC, although chemical
fertilizers and pesticides in LC are used by more than half the
producers surveyed.
There are also considerable differences in the use of hired labor, ranging from frequently used to hardly used, as in the case of VMT.
Livelihood
Figure G3 shows the primary occupation of household heads. In producer households, 23 percent are involved in urban agriculture as the primary occupation and 17 percent as the secondary occupation. Figure G4 illustrates that 67 percent of producers who said their primary occupation was farming did not have a secondary occupation, followed by those who were housewives (17 percent) and those involved in independent informal businesses (8 percent).
On average, adult females were slightly more active in sowing, cultivation, and harvesting activities than males.
Figure G2: Type of land used by producers in LimaType of Land Owned by Producers
TotalNot answeredOtherLeased/RentedOwned
52
68
34
100
Box G3: General state of dwellings between producers and non-producers in Lima
Few differences were found between producers and non-producers with regard to the state of their dwellings, but more differences were found along the transect.
In terms of materials used for walls, respondents in the urban area of Callao tended to use bricks and/or cement the least, while the opposite was true for urban respondents in VMT. In general, VMT households were better off than in other locations. In Callao, although few respondents had houses made of brick and/or cement, producers seem to be better off than non-producers. Callao respondents were found to be generally worse off than their counterparts in the peri-urban area.
More producers tend to have access to their own toilets than non-producers in all areas of the transect, except in VMT, where both groups had equal access to private latrines.
Electricity was found to be prevalent in all areas, although very few respondents, except those in VMT, had access to municipal water supply.
The mean household size in Lima for producers is 4.67 people while for non-producers it is 4.26 people, a difference that is statistically significant.
Table G5: Use of fertilizers and other inputs across transect zones in Lima (percent)
Fertilizers/ Other inputs Input Urban (Callao) Urban (VMT) Peri-Urban
Transition Peri-Urban Total
Fertilizer Manure 63.8 67.3 83.1 87.8 75.1
Organic Compost 30.4 46.9 25.8 28.4 34.2
Wastewater 36.2 24.8 13.5 33.8 26.1
Chemical fertilizer 59.4 9.7 58.4 29.7 36.5
Other 5.8 27.4 7.9 1.4 12.5
Other inputs Seedlings/Seeds 60.9 54.0 66.3 58.9 59.6
Hired labor 42.0 1.8 50.6 10.8 24.3
Water/Irrigation 72.5 50.4 74.2 68.9 64.9
Pesticide 55.9 8.0 57.3 25.7 34.0
Other 7.2 23.0 2.2 6.8 11.0
ANNeX G 84
Male-headed households were slightly more active than females in marketing their produce.
In non-producer households, the most common occupations were independent informal businesses (23 percent) and salaried work with benefits (23 percent).
Table G6 summarizes the sources of income for producers and non-producers. For those producers whose primary occupation is farming, a majority earns their income by growing crops rather than rearing animals. When urban agriculture is a secondary occupation, the number of producers who either rear livestock or grow crops is almost
the same. Those producers who are primarily involved in
urban agriculture also seem more likely to have other jobs,
such as salaried employment with or without benefits, casual
labor, or informal businesses.
Overall, 40 percent of households received income from urban
agriculture in the previous year. The peri-urban transition area
has the highest percentage of households that receive income
from agriculture (39 percent from crops and 35 percent from
livestock). On the whole, a similar percentage of households
receive income from growing crops and raising animals.
Figure G3: Primary occupation of household heads in Lima
ProducerNon-Producer
Perc
enta
ge
Farmer
Salaried employee (with benefits)
Regular employee (no benefits)
Informal business
Housewife
Other
0
10
20
30
40
50
60
70
80
90
100
26.2
Primary and secondary occupation of household heads
15.8
23.0
12.0
23.0 22.7
10.7
11.4
16.7
16.7
21.8
No secondary occupation
Housewife
Informal business
Casual labor
Other
Secondary occupation of farmers
67.1
17.1
7.95.72.2
Figure G4: Secondary occupation of producers in Lima (percent)
Table G6: Percentage sources of income for producers and non-producers in Lima*
*Numbers add up to more than 100 percent because respondents could choose more than one answer.
85 UrBAN AGrICULTUre: FINdINGS FroM FoUr CITY CASe STUdIeS
Income from Urban Agriculture
Figures G5 and G6 show the differences primarily between the two urban areas surveyed in Lima. In VMT, 80 percent of producers make a “less important” percent of their income from either crop production or raising livestock, while in Callao there seems to be a more widespread range. In the peri-urban transition area, the data show that producers get a higher proportion of their income from growing crops rather than rearing animals.
Expenditure
The mean percentage of household expenditures is similar across the transect as well as between producers and non-producers. The major expenditure item was food, at about 31 percent of total household expenditure, as presented in Table G7. This is despite the fact that on average, 20 percent of producers’ incomes come from some form of urban agriculture. Besides food, respondents spent roughly the same proportion on utilities, transport, education, and health.
General Food Situation
In general, it was found that over 96 percent of producers across the transect consume at least part of the food produced by them. The main benefits of participating in urban agriculture according to the respondents are that it saves money to purchase other types of food and provides extra food to producer households, as shown in Table G8.
In terms of food security, approximately 35 percent of both non-producers and producers across the transect said that they eat enough of what they want, and 53 percent said that they eat enough but not always of what they want. In the peri-urban transition and peri-urban areas, the differences between the producers and non-producers were more apparent, although not statistically significant.
In terms of examining food security in the past year, producer households tend to be more insecure than non-producer households, although there are no statistically significant differences between the two groups. Producers in both the urban areas of Callao and VMT tend to be more concerned about food insecurity than non-producers in these districts, whereas in the peri-urban area, the concerns are similarly shared between producers and non-producers.
Figure G5: Proportion of income from crop production along the transect in Lima*Proportion of income from crop production along the transect
52
100
0
20
40
60
80
100
25 50 75 100
Very Important
Moderately Important
Very ImportantVery Important
Moderately ImportantModerately Important
Moderately Important
Less Important
Less Important Less Important
Less Important
Peri-Urban
Share of households by area, percent
Perc
enta
ge o
f hou
seho
lds
by c
ateg
ory
Peri-UrbanTransition Urban (Callao) Urban (VMT)
0
*Categories of income: Less important: less than 25%; Moderately important: 25-75%; Very important: more than 75%.
Figure G6: Proportion of income from rearing animals along the transect in Lima*Proportion of income from rearing animals along the transect
52
100
0
20
40
60
80
100
25 50 75 100
Very Important
Moderately Important
Very Important Very Important
Moderately ImportantModerately Important
Moderately Important
Less Important
Less ImportantLess Important
Less Important
Peri-Urban
Share of households by area, percent
Perc
enta
ge o
f hou
seho
lds
by c
ateg
ory
Peri-UrbanTransition Urban (Callao) Urban (VMT)
0
*Categories of income: Less important: less than 25%; Moderately important: 25-75%; Very important: more than 75%.
ANNeX G 86
Regardless of the group, the principal reason for not eating enough or not having enough of what they would like to eat is insufficient money to purchase food.
Food Diversity
The food diversity in Lima, shown by the various types of food groups produced and consumed by producers in the week prior to the survey, illustrates different patterns across the transect. For instance, more roots and tubers were consumed in urban and peri-urban transition areas and less so in the peri-urban area, whereas more meat (e.g. chicken, duck) was consumed in the peri-urban area than the other areas.
Interestingly, among those who consumed their own produced food the previous day the frequency of consumption of certain foods during the previous week was quite high for a number of types of foods. Leeks/celery, broccoli/cabbage, herbs, onions, fruits, eggs, milk, lettuce, tomato and squash were eaten daily or more than once a day, indicating that they were a regular part of the diet, although amongst only a small proportion of the producers. The reporting of the
frequency of consumption during the previous week only for
those foods that were consumed on the previous day would
have underestimated the frequency and variety of all self-
produced foods consumed during the previous week.
Figure G7 shows the difference on food consumption
between producers and non-producers. The consumption of
the staple food groups, such as cereals and roots and tubers,
are similar between producers and non-producers and across
the districts. However, there is a tendency for more producer
households to consume vegetables than non-producers, and is
a significant difference between the two groups in the urban
area of VMT. When disaggregated by type of vegetable, a
higher proportion of producer households consume yellow/
especially in VMT and the peri-urban transition area, and
green leafy vegetables, specifically in Callao and the peri-
urban area. In general there is a tendency but not a significant
difference for more non-producers to consume fruits; only in
VMT is there a tendency for more producer households to
consume yellow/orange fruits rich in beta-carotene.
Table G7: Household expenditures along the transect in Lima (percent)
Expenditure Item Urban (Callao) Urban (VMT) Peri-Urban Transition Peri-Urban Total
Food 31.1 33.6 31.5 28.7 31.2
Education 10.8 10.4 12.5 12.4 11.5
Utilities 14.1 16.2 11.6 13.4 13.7
Health 12.2 10.8 10.6 11.6 11.3
Transport 13.3 12.0 11.9 13.4 12.6
Clothes 8.3 6.3 6.3 8.4 7.3
Family events 1.5 1.4 1.8 1.7 1.6
Shelter 2.4 4.0 6.5 3.9 4.2
Loan/debt 4.3 4.2 5.4 5.6 4.9
Other 1.9 0.9 1.5 1.0 1.4
Domestic help 0.2 0.1 0.3 0.0 0.2
Table G8: The impact of consumption of one’s own food produced in Lima* (percent)
Effect of consuming own food Urban (Callao) Urban (VMT) Peri-Urban Transition Peri-Urban Total
Saves money to purchase other types of food 66.9 82.8 73.7 70.4 73.4
Monetary saving on food purchases 55.4 76.8 63.5 58.6 63.5
Saves money for other household purchases 33.1 37.7 30.1 36.2 34.3
Provides extra food 69.4 65.6 74.4 73.0 70.6
Provides a more diverse diet 57.3 60.9 62.8 71.7 63.1
Has an effect in another way 15.3 20.5 17.9 21.7 18.8
Little or no effect 0.0 0.0 0.0 0.7 0.2
*Numbers add up to more than 100 percent because respondents could choose more than one answer.
87 UrBAN AGrICULTUre: FINdINGS FroM FoUr CITY CASe STUdIeS
Most households consume meat with little difference between producer and non-producers. Only in the peri-urban transition area do more producer families consume meat. The percent of families who consume fish is low. Only in Callao, which is near the seaport, do more producer families consume seafood than non-producers. More non-producers consume milk and dairy products than producers, which is significantly different in the peri-urban area.
Source of Food
Twenty-three percent of producer households consumed at least one food from their own production on the day prior to the survey; this is considered to be a high proportion given that the query pertained to only one day. Interestingly, this is lower in Callao where much of the production is for commercial purposes and higher in VMT where the production is generally more for home consumption.
The most common source of food during the week prior to the survey for both producers as well as non-producers and along the transect was purchasing raw food and preparing it at home (99 and 98 percent, respectively). Consuming self-produced food was not included in the questionnaire; however, the data collected through the survey as well as from the focus group discussions indicate that self-produced food is
Food diversity: Consumption of 15 food groups by producers and non producers in the previous 24 hours
along the transect (years)
0 10 20 30 40 50 60 70 80 90 100
Cereal or grain
Tubers
Other meat
Milk and milk products
Yellow/orange vegetables
Other vegetables
Other fruits
Legumes
Eggs
Green leafy vegetables
Yellow/orange fruit
Fish 10.6
9.5
21.5
36.630
4244.5
53.346.7
50.453.3
57.759
7366.6
70.178.9
81.180.5
84.682
97.597.6
20
Non-Producer Producer
Figure G7: Food diversity showing consumption of 15 food groups in the previous 24 hours in Lima*
*Annex A provides a detailed description of foods contained in each group
Figure G8: Map of Lima showing survey sites
ANNeX G 88
not a principal source of food although it does contribute to the total food available in producer families. When asked, women producers from the peri-urban transition area said they consumed food that they grow more than producers from other areas. The main foods in this category were vegetables and fruits, although staple foods, such as sweet potatoes and potatoes, were also mentioned.
Consuming food obtained from outlets, such as restaurants or kiosks, is mentioned by around 30 percent of households and is similar between producers and non-producers. This varied by zone, for instance, in Callao and the peri-urban transition area, more producers used this source than non-producers, while in VMT and the peri-urban area, it was the opposite. Food programs were more commonly found in VMT and the peri-urban area (26 and 29 percent, respectively), and within these, slightly more among producers.
Figure G9: Map of Peru
ReferencesMalena Castro y Henry Juárez. 2007. “Propuesta Metodológica de Protección de Zonas Agrícolas en Zonas Peri-urbanas de
Lima Metropolitana.” http://www.laboratoriosanaliticosdelsur.com/includes/CAP_MalenaCastro_PaginaWeb_LAS.pdf
ENAHO. 2009. “Encuesta Nacional Continua de Hogares 2004-2009.” Lima, Perú: INEI.
GEA 2010. “Reporte Ambiental de Lima y El Callao 2010.” Lima, Perú: Grupo GEA,
INEI (Instituto Nacional de Estadística e Informática). “2007 XI Censo de población y VI de Vivienda.” Lima Perú: INEI. http://www.inei.gob.pe/
____. 2007b. “Indicadores de Pobreza.” Lima Perú: INEI. http://www.inei.gob.pe/
_____. 2008. “Perfil Sociodemográfico del Perú. XI Censo de Población y VI de Vivienda.” Lima Perú: INEI. http://desa.inei.gob.pe/censos2007/tabulados/
IPES (Promoción Del Desarrollo Sostenible). 2006. “Villa María Sembrando para la Vida: Situación, Limitaciones, Potenciales y Actores de la Agricultura Urbana en Villa María del Triunfo.” Lima.
LiWa. 2009. “Análisis de la Situación del Agua en Lima Metropolitana y el Callo.” http://www.lima-water.de/es/documents.html?Menu=5
Matos Mar, José; Matos Lagos, Rubén. 1990. “Aguas Residuales, Agricultura y Alimentación en la Gran Lima.” Lima: Organización Panamericana de la Salud.
Moscoso, Julio y Tomas Alfaro. 2008. “Panorama de Experiencias de Tratamiento y Uso de Aguas Residuales en Lima Metropolitana y Callao.” Cuaderno de Agricultura Urbana N° 6. Lima, Perú: IPES, RUAF, MVCS y SWITCH. http://www.ipes.org/index.php?option=com_content&view=article&id=161&Itemid=179
Soto, Noemí; Castro, Cecilia. 2007. “La Red de Agricultores Urbanos de Villa María del Triunfo.” Revista Agricultura Urbana 17 (9): 48.
Previous Knowledge Papers in this Series
Lessons and Experiences from Mainstreaming HIV/AIDS into Urban/Water (AFTU1 & AFTU2) Projects Nina Schuler, Alicia Casalis, Sylvie Debomy, Christianna Johnnides, and Kate Kuper, September 2005, No. 1
Occupational and Environmental Health Issues of Solid Waste Management: Special Emphasis on Middle and Lower-Income Countries Sandra Cointreau, July 2006, No. 2
A Review of Urban Development Issues in Poverty Reduction Strategies Judy L. Baker and Iwona Reichardt, June 2007, No. 3
Urban Poverty in Ethiopia: A Multi-Faceted and Spatial Perspective Elisa Muzzini, January 2008, No. 4
Urban Poverty: A Global View Judy L. Baker, January 2008, No. 5
Preparing Surveys for Urban Upgrading Interventions: Prototype Survey Instrument and User Guide Ana Goicoechea, April 2008, No. 6
Exploring Urban Growth Management: Insights from Three Cities Mila Freire, Douglas Webster, and Christopher Rose, June 2008, No. 7
Private Sector Initiatives in Slum Upgrading Judy L. Baker and Kim McClain, May 2009, No. 8
The Urban Rehabilitation of the Medinas: The World Bank Experience in the Middle East and North Africa Anthony G. Bigio and Guido Licciardi, May 2010, No. 9
Cities and Climate Change: An Urgent Agenda Daniel Hoornweg, December 2010, No. 10
Memo to the Mayor: Improving Access to Urban Land for All Residents – Fulfilling the Promise Barbara Lipman, with Robin Rajack, June 2011, No. 11
Conserving the Past as a Foundation for the Future: China-World Bank Partnership on Cultural Heritage Conservation Katrinka Ebbe, Guido Licciardi and Axel Baeumler, September 2011, No. 12
Guidebook on Capital Investment Planning for Local Governments Olga Kaganova, October 2011, No. 13
Financing the Urban Expansion in Tanzania Zara Sarzin and Uri Raich, January 2012, No. 14
What a Waste: A Global Review of Solid Waste Management Daniel Hoornweg and Perinaz Bhada-Tata, March 2012, No. 15
Investment in Urban Heritage: Economic Impacts of Cultural Heritage Projects in FYR Macedonia and Georgia David Throsby, Macquarie University, Sydney, September 2012, No. 16
Building Sustainability in an Urbanizing World: A Partnership Report Dan Hoornweg, Mila Freire, Julianne Baker-Gallegos and Artessa Saldivar-Sali, eds., July 2013, No. 17
This guide has benefited from the support of the Trust Fund for Environmentally & Socially Sustainable Development (TFESSD) made available by the governments of Finland and Norway.
For more information, contact: Urban Development and Resilience UnitSustainable Development NetworkThe World Bank1818 H Street, NWWashington, DC 20433USA