66
Ramathan Ggoobi Daniel Lukwago George Bogere ACODE Policy Research Paper Series No. 100, 2020 PUBLIC EXPENDITURE GOVERNANCE IN THE ROADS SECTOR

Ramathan Ggoobi Daniel Lukwago George Bogere
ACODE Policy Research Paper Series No. 100, 2020
PUBLIC EXPENDITURE GOVERNANCE IN THE ROADS
SECTOR


PUBLIC EXPENDITURE GOVERNANCE IN THE ROADS
SECTOR
Ramathan Ggoobi Daniel Lukwago George Bogere
ACODE Policy Research Paper Series No. 100, 2020

Published by ACODE
P. O. Box 29836, KampalaEmail: [email protected]; [email protected]: https://www.acode-u.org
Citation:
Ggoobi, R., Lukwago, D., and Bogere, G. (2020). Public Expenditure Governance in the Roads Sector, Kampala: ACODE. Policy Research Paper Series No. 100.
© ACODE 2020
All rights reserved. No part of this publication may be reproduced, stored in a retrieval system or transmitted in any form or by any means electronic, mechanical, photocopying, recording or otherwise without the prior written permission of the publisher. ACODE policy work is supported by generous donations and grants from bilateral donors and charitable foundations. Reproduction or use of this publication for academic or charitable purposes or for purposes of informing public policy is excluded from this restriction.
ISBN: 978-9970-56-725-6
Cover Illustration: Kajjansi Interchange on the 51.4km Kampala - Entebbe Expressway (Photo Credit © Uganda National Roads Authority, 2018).

iii | Public Expenditure Governance in the Roads Sector
CONTENTS
List of Tables and Figures .......................................................................................................vAcknowledgements .................................................................................................................viList of Acronyms .......................................................................................................................viiExecutive Summary ..................................................................................................................ix
1.0 INTRODUCTION ...................................................................... 11.1 Background of the Study ................................................................................................... 11.2 Overall Objective of the Study .....................................................................................31.3 Structure of the Report .....................................................................................................31.4 Assessment Framework and Methodology .............................................................3
2.0 METHODOLOGY .................................................................... 62.1 Data Sources ...........................................................................................................................62.2 Data Analysis ........................................................................................................................72.3 Scope of the Study ............................................................................................................72.4 Limitations of the Study ................................................................................................7
3.0 FINDINGS ............................................................................... 83.1 Governance inputs .............................................................................................................83.1.1 Actors and Coordination in the Roads Sector ........................................................................................... 83.1.2 Legal and Policy Framework for the Roads Sub-Sector ............................................................... 103.1.3 Participation of Non-State Actors ................................................................................................................................ 11
3.2 Governance processes .................................................................................................... 133.2.1 Weak accountability in the Road Sector ............................................................................................................. 133.2.2 Poor performance on value for money audits ..............................................................................................143.2.3 Corruption in the Roads sub-sector .......................................................................................................................143.2.4 High unit cost of road construction ..........................................................................................................................153.2.5 High costs of construction materials and land ............................................................................................16
3.3 Governance Outcomes .................................................................................................. 173.3.1 Condition of Roads ..................................................................................................................................................................... 173.3.2 Road Sector Performance ...............................................................................................................................................193.3.3 Road Sector Financing ...........................................................................................................................................................213.3.4 Road Sector Budget Allocations .............................................................................................................................233.3.5 Road Budgets outside the Road Sector .......................................................................................................243.3.6 Financing Road Maintenance .....................................................................................................................................25

Public Expenditure Governance in the Roads Sector | iv
3.3.7 Operational Efficiency ............................................................................................................................................................293.3.8 Allocative Efficiency ................................................................................................................................................................343.3.9 Spatial Efficiency .............................................................................................................................................................................37
4.0 CONCLUSIONS AND RECOMMENDATIONS ...................404.1 Conclusions ........................................................................................................................ 404.2 Recommendations ........................................................................................................ 40
REFERENCES .............................................................................. 43ANNEX: Status of Implementation of NDPII Core Roads Projects .................. 47

v | Public Expenditure Governance in the Roads Sector
List of FiguresFigure 1: Governance as a Production Process .................................................................................................................. 4Figure 2: Relationships among key actors in the Road Sector in Uganda ....................................... 9Figure 3: Proportion of road network in fair to good condition ...................................................................18Figure 4: Works & Transport Sector budget allocations against NDP II ..............................................21Figure 5: Trends in Roads sub-sector funding ............................................................................................................... 22Figure 6: Trends in Roads sub-sector funds absorption rates .....................................................................23Figure 7: Trends in Roads sub-sector budget allocations ................................................................................24Figure 8: Road funding outside the Works and Transport Sector ..........................................................25Figure 9: Trends in Road maintenance funding between FY2015/16 and FY2018/19.......26Figure10: Trends in distribution of road maintenance funding ......................................................................27Figure 11: Road Maintenance Funding Gap ..........................................................................................................................28Figure 12: Trends in Roads sub-sector allocations and spending ...........................................................29Figure 13: Difference between MTEF, Approved Budgets and Spending in the Roads
sector ...........................................................................................................................................................................................................30Box 1: Discrepancies between planning, budgeting and expenditure performance in
Uganda’s roads sector ..............................................................................................................................................................32Figure 14: Trends in UNRA performance .................................................................................................................................32Figure 15: Trends in Roads Sub-Sector MDA budgets (Approved, Releases, and
Spending) ................................................................................................................................................................................................33Figure 16: Trends in spending on land acquisition of land by GoU for select road
projects .................................................................................................................................................................................................... 35Figure17: Trends in Roads Sub-sector Development versus Recurrent (Share) .....................36Figure 18: Regional Distribution of Road Network Constructed during NDP II ........................38
List of TablesTable 1: Cost of Road Construction per km for Different Work Types, by work category
(in USD) .......................................................................................................................................................................................................15Table 2: NDP II targets under the roads sub-sector ....................................................................................................19Table 3: Annual Construction Productivity in Roads ............................................................................................... 20Table 4: Road Maintenance Funding for FY2015/16-FY2018/19 (UGX Billion) ............................27Table 5: Trends in Road Sector Capital Purchases (excluding AIA) .....................................................36
LIST OF TABLES AND FIGURES

Public Expenditure Governance in the Roads Sector | vi
ACKNOWLEDGEMENTS
ACODE acknowledges the contribution of both individuals and organizations that made this work possible. In particular, the contribution of staff in government ministries, departments and agencies that informed data collection and discussions of drafts of this publication. Their views were pivotal in framing the arguments and conclusions arrived at in this work. ACODE is convinced that this publication will be instrumental in improving the performance of the Road Sector in Uganda.
vii | Public Expenditure Governance in the Roads Sector
LIST OF ACRONYMS
ACODE Advocates Coalition for Development and Environment
Bn Billion
CBEG Center for Budget and Economic Governance
CG Central Government
CISCOT Civil Society Coalition on Transport in Uganda
CPPA Consultative and Participatory Process Approach
CRC Current Replacement Cost
CSOs Civil Society Organizations
DFID Department for International Development
DUCAR District, Urban and Community Access Roads
EU European Union
FY Fiscal / Financial Year
GDP Gross Domestic Product
GoU Government of Uganda
JICA Japan International Cooperation Agency
KCCA Kampala Capital City Authority
LED Local Economic Development
LG Local Government
LGA Local Governments Act
MAAIF Ministry of Agriculture, Animal Industry and Fisheries
MDA Ministry, Department and Agencies
MoEMD Ministry of Energy and Mineral Development
MoES Ministry of Education, and Sports
MoFPED Ministry of Finance Planning and Economic Development
MoLG Ministry of Local Government

Public Expenditure Governance in the Roads Sector | viii
MoLGs Ministry of Local Governments
MoLHUD Ministry of Land, Housing and Urban Development
MoWT Ministry of Works and Transport
NDP National Development Plan
NMT Non-Motorized Transport
NPA National Forestry Authority
OAG Office of Auditor General
OECD Organization for Economic Co-operation and Development
OPM Office of the Prime Minister
OPM Office of the Prime Minister
PEG Public Expenditure Governance
PEGS Public Expenditure Governance Studies
PER Public Expenditure Review
PPPs Public Private Partnerships
UGX Uganda Shillings
UN United Nations
UNRA Uganda National Roads Authority
URF Uganda Road Fund
USD United States Dollar
UTSDPG Uganda Transport Sector Development Partners Group

ix | Public Expenditure Governance in the Roads Sector
EXECUTIVE SUMMARY
This study examines how funds in the roads sub-sector were allocated and managed during the Fiscal Year (FY) 2015/16-2018/19. The aim is to assess the impact of these investments, and the effectiveness of the planning, budgeting and execution and plans and budgets in the roads sub-sector. The study was motivated by government priority tagging of the Road Sector as “fundamental” for the achievement of the Uganda Vision 2040. Consequently, the roads have claimed the largest share of the national budget over the last decade. However, Uganda’s road transport network is still very small by international standards, with only 21.4 percent of the national road network paved. Only 0.4 percent and 5.6 percent of the district and urban roads respectively, are paved. Despite continuous investment in the Road Sector with an average of 17 percent of the annual national budget over the last decade, there are reports of persistent public outcry about the poor state of roads and the deteriorating quality of works being executed. The country also faces a huge backlog in road maintenance supposedly due to underfunding. Other concerns are evident that expenditure on road construction has outstripped road maintenance, leading to very rapid deterioration of the road network, increased road safety risks, high vehicle operating costs and other maintenance costs. Recent studies have shown that the underlying causes of the challenges that have beset the roads sector are rooted in failures in governance including, poor planning, ambiguity and inconsistency in the strategic vision of the sector, limited capacity of agencies to implement their mandates, inefficient utilization of resources, inadequate effort to fight corruption, weak accountability in the sector, to mention but a few.
The study employs the Public Expenditure Governance (PEG) framework for assessing governance inputs, processes and outcomes. The governance inputs include participation, coordination and strategic vision while the governance processes refer to transparency, accountability and control of corruption; the attributes that characterise the budget cycle. The outcomes refer to the nature of the outcomes of public expenditure including effectiveness and efficiency, equity and responsiveness. The study evaluates the effectiveness & efficiency, and equity of public expenditure in Uganda’s Road Sector over the FY 2015/16 – FY 2018/19. The period also coincides with the first three years of the National Development Plan II (FY 2015/16 – FY 2019/20). The PER analysis looks at four efficiency measures namely: operational, administrative, functional, and spatial efficiency.
Governance inputs
Coordination of Uganda’s Roads Sector In Uganda, roads fall under the Works and Transport Sector with the Ministry of Works and Transport taking the responsibility for coordinating this sector. Other key implementing institutions in the roads sub-sector include Uganda National Roads

Public Expenditure Governance in the Roads Sector | x
Authority (UNRA), Uganda Road Fund (URF), Kampala Capital City Authority (KCCA), and Local Governments (LGs). However, there are other institutions outside the works and Transport Sector that implement road projects, which include: Office of the Prime Minister (OPM), Ministry of Local Government (MoLG), Ministry of Land, Housing and Urban Development (MoLHUD) Ministry of Agriculture, Animal Industry and Fisheries (MAAIF), Ministry of Education and Sports, National Forestry Authority, Ministry of Energy and Mineral Development (MoEMD), as well as, Public Universities. Studies have found that technical staff in the roads sub-sector have very little autonomy, and they have serious coordination challenges. The institutional set up in the Ministry of Works and Transport and its agencies does not allow proper coordination, functionality and utilization of the resources in the Transport Sector, especially, when it comes to other institutions outside the works and Transport Sector.
Strategic visionThe strategic vision for the Sector is captured in the Legal and Policy Framework for Roads in Uganda. The major road related laws and policies include the Roads Act, 2019, UNRA Act 2008, URF Act 2010, Local Government Act 1997, Land Act 1998, Physical Planning act 2010, KCCA Act 2010, Vision 2040, National Development Plan (NDP III), National Land Policy, Urban Physical Plans. The legal and policy framework is characterized by contradictions and ambiguities that make it difficult to differentiate roles and responsibilities of actors. The situation is compounded by implementation challenges. The Roads Act 2019 repealed some pieces of legislation yet in the regulations indicate that the same regulations remain in force. For example, the act provides for five road types and numerous sub-types including national roads (with four categories), district roads (with three categories), urban roads (with two categories), park roads and Community Access Roads (CARs). However, the classifications overlap greatly making roads that may be eligible falling in multiple classifications. Moreover, the act does not provide for specification of the technical attributes (width, surface type and allowable load) of the different road categories. It also does not provide for how roads may be upgraded from one type or category to another. There is need to review other laws including the Local Government Act, URF Act, UNRA Act to address these inconsistencies. The most glaring policy implementation gaps for Uganda’s Road Sector include: i) failure to operationalize a 2G road fund, slow demarcation of road reserves, especially, along national roads, and inaccurate planning data on road condition length and traffic volume. As Uganda ushers in the NDP III, there is need to plan for adequate road maintenance, as well as, improved project preparation and execution. The plan should also bring together objectives under the Road Sector Development Program (RSDP), the Transport Sector Development Plan (TSDP) and Urbanization Plans.
ParticipationThere is a wide range of involvement of non-government actors in Uganda’s Road Sector from private firms undertaking road works to monitoring road projects by citizens. There are several challenges that beset non-government actors. There is concern that whereas building the capacity of the local construction industry is one of the major sector objectives, international firms are slowly edging out local firms. The proportion of value of construction works executed by local firms stood at only 30 percent in 2018. There
xi | Public Expenditure Governance in the Roads Sector
is a perception that international firms have overwhelming financial power and political influence that get the larger contracts compared to local firms. The local contractors feel disadvantaged by the tendering criteria, which require them to demonstrate financial capacity and sufficient staffing and equipment in advance of being awarded a contract. The data on financing of the sector shows that development partners are key actors in the sector contributing up to XX% over the period under review. Participation of project-affected persons in planning, implementation and monitoring road projects is provided for in the policy frameworks and has been improving. Nevertheless, there is still significant variation from project to project.
Governance processes
Accountability and Value for Money Despite commitments to accountability and transparency in the sector, there are concerns about the integrity of the information on the roads sector, especially, information on the condition of the road network. There is virtually no data, mechanisms and tools to track performance and hold the roads sector accountable for the quality of spending, especially, for institutions outside the Works and Transport Sector. There appears to be no mechanisms in place to relate expenditures to physical outcomes or decision tools to support review of budget proposals or evaluate the efficiency of Sector expenditures.
On value for money, a recent value for money audit report on budget performance by the OAG, identified key factors impacting on the delivery of the expected output, that included: failure to translate plans into budget interventions; low levels of released budgets and absorption; re-allocation/virement of the budget; diversion of funds leading to mischarge of expenditure to budget lines with no relation to the expenditure in question; and inherent lags or delays in the procurement system and cost variations, which affected timely delivery of outputs.
Control of Corruption in the Roads sub-sectorCorruption in public infrastructure contracts is widespread in Uganda, and according to the World Bank, corruption in transport projects can account for as much as 5 to 20 percent of transaction costs. Corruption in road construction results into increased costs of construction. Consequently, Uganda has some of the most expensive road projects in the region. For instance, the Kampala-Entebbe Expressway that cost USD 9.27 million per kilometer to construct is probably the most expensive road among low and middle-income countries. Therefore, higher costs, both in terms of capital and recurrent costs are purely remediable if corruption is addressed. See value for money audits and Auditor General’s Reports.
TransparencyTransparency is the accessibility of information about road works tenders, Road Sector financing and performance by citizens and the existence of clear channels for feedback from citizens to decision-makers. Whereas availability of information on financing to the roads sector has improved with improved general budget transparency in Uganda, the sector remains mired in opacity with limited access to important information by citizens.

Public Expenditure Governance in the Roads Sector | xii
Road project appraisal documents including costs and partnership documents in the case of Public Private Partnerships (PPPs) are difficult to access in real time. Most of the project appraisal documents available are for projects that started several years ago and were or had been completed. This makes it difficult for non-government stakeholders to independently evaluate the viability of the road projects and monitor progress. The information on road works by agencies that undertake road works, namely, the UNRA, Local Governments and other MDAs outside the Road Sector, is very scanty. It is important to note, however, that transparency in relation to compensation of Project Affected Persons for large projects has greatly improved.
Governance outcomes
Road Sector PerformanceThe findings of the latest Road User Satisfaction Survey (URF, 2019), showed that, road user satisfaction was at the highest ever at 57.2 percent. The report further showed that West and Central regions registered the highest satisfaction scores. East Kampala and the North registered the least satisfaction scores in that order. The report notes that the score for Kampala was the highest ever. In terms of the NDP II, the target was to increase paved national roads from 3,795Km to 6,000Km by 2020. Despite the fact that the paved national road network improved from 19 percent in 2008 to 23.83 percent in 2018, it was 1,029 km short of the NDP II target of 6,000 km by FY2019/20. This was attributed to slow implementation of key road projects. The NDP II target for annual rate of production (paving) of roads was set at 520km equivalent per year, however, UNRA was only able to achieve 329km equivalent per year. Thus, out of the 22 NDP II core road projects, only 9 were on schedule, while 13 were either at feasibility stage or had not yet started. The underperformance was largely attributed to financial constraints and procurement delays.
There was deterioration in condition of national (paved and unpaved), and KCCA (paved and unpaved) during FY 2018/19. The bad condition of roads was exacerbated by narrow width of most roads in Uganda. According to the 2019 Road User Satisfaction Survey, narrow road width was the most common reason why road users felt unsafe on Uganda’s roads, in addition to, presence of potholes on roads, inadequate road maintenance, and poor drainage. DUCAR roads were rated lowest on all road attributes. The low satisfaction with DUCAR could be attributed to failure of the Local Governments and KCCA to effectively maintain roads due to inadequate funding.
Road Sector funding Government, to a great extent, fulfilled its commitment to funding roads, in line with the NDP II. In this period, the total planned public expenditure for the Works and Transport Sector was UGX 21,247 billion. On the other hand, Government allocated over UGX 22,935 billion, that is 8 percent more of the planned allocation. The budget allocations to the Road Sector increased from UGX 2,897.6 billion in 2015/16 to UGX 4,140.5 billion in 2018/19. However, as a share of the national budget, the Works and Transport Sector received on average 17 percent of the national budget compared to 19 percent which was planned under the NDP II period. This shows that other priorities cut into the

xiii | Public Expenditure Governance in the Roads Sector
allocation for roads during the NDP II period.
The resources for the Road Sector consist of Government of Uganda (GoU) funds and external funding. External funding has been growing from 20 percent in 2015/16 to 51 percent in 2017/18 and 44 percent in 2018/19. However, dependence of external funding in supporting Uganda’s roads infrastructure is a big challenge in ensuring sustainability given the fact that external funding is often unpredictable. The study finds huge fluctuations in absorption of external funds from 92 percent in FY 2015/16 to 23 percent the 2016/17, up to 56 percent in FY 2017/18 and 39 percent in 2018/19. Thus, reliance on external funding is seen as nonviable as a long-term strategy for construction and maintenance of the road network.
In terms of intra sector allocations, UNRA took three-quarters of the sector budget, followed by the Uganda Road Fund (URF). However, LGs were allocated a meagre 1 percent of the total sector budget despite the fact that 80 percent of Uganda’s road network was under DUCAR. Over the period FY2015/16 - FY2018/19, the road maintenance funding averaged UGX 450 billion, which is about 12 percent of the total approved roads budget. The current road maintenance financing can only meet about 26 percent of the needs, leaving a big chunk of the road network unattended to. This has created a total backlog of 51,735 Km of public roads that had not been maintained. The growing backlog of road maintenance results into higher replacement costs of road asset in future.
Agencies outside the Road Sector with funds for roads include, the Office of the Prime Minister (OPM), Ministry of Local Government (MoLG), Ministry of Lands Housing and Urban Development (MoLHUD) and Ministry of Agriculture Animal Industry and Fisheries (MAAIF). There was concern, however, that the absorption of funds for roads under these MDAs was very low with almost 70 percent of allocated funds not spent during the period FY 2015/16 and FY 2018/19.
Efficiency of Public Expenditure in RoadsOperational efficiency is the capability of the road agencies to deliver roads infrastructure in the most cost-effective manner possible while still ensuring their high quality. The operational efficiency of roads sector agencies was affected by uncertainty of funds allocations in medium term and on annual basis. During the period under review there has been considerable variance in planning (MTEF and BFP) and approved budget) and execution (spending). With exception of the initial year of NDP II (FY 2015/16), the approved budget for roads was lower than the MTEF projections. In FY 2015/16, approved budget exceeded MTEF by 22 percent while in the rest of the years it was below MTEF by 5 percent in 2016/17, 14 percent in 2017/18, and by 13 percent in 2018/19. During the four FYs (2015/16 - 2018/19), releases were less than the approved budget by an average of 19 percent. On the other hand, the expenditures were less than the releases by an average of 29 percent. It is likely that absence of multi-year planning and budgeting, combined with insufficient institutional capacity, leading to underspent budgets year upon year in the roads sector.
Administrative efficiency examines the capacity of the MDAs engaged in roads infrastructure to produce desired results with a minimum expenditure of time, money,

Public Expenditure Governance in the Roads Sector | xiv
personnel, and material. During the period under review, planned budget allocations, to a larger extent, favored UNRA (despite its poor performance at budget absorption) and to a smaller extent, URF at the expense of MoWT headquarters and LGs that were responsible for the DUCARs. The poor performance of UNRA can partly be attributed to delays in road construction and to non-payment of compensation to the affected persons due to the tokenism in allocation of funds.
Under functional efficiency, we considered a few functions that budget spending in the roads sector favour. These included land acquisition and consumptive spending. Several reports indicated that road construction projects in Uganda were experiencing delays partly due to challenges in land acquisition. These begin with poor and uncoordinated planning based on poor methods used to allocate funds for land acquisition. Different roads with different lengths and location (in different parts of the country) are allocated equal budgets for land acquisition. Moreover, each MDA plans in isolation of the other, leading to budget fragmentation. However, in the recent years there has been improvement in budgeting consolidation of land acquisition funds, although planning is still disjointed.
An economic decomposition of public spending on roads in Uganda shows that although development expenditures dominate both planning and spending, consumptive expenses are hidden under the development budget. There is misclassification of ‘development budget’ whereby many items reported as development expenditures serve to fund recurrent activities such as buying and maintaining vehicles, paying allowances, travel, rather than capital spending. Data shows that capital purchases in the roads sector during the NDP II constituted less than two-thirds of the total roads budget.
When it comes to spatial efficiency, that is, the geographic distribution of roads under construction, the study found that in a sample of 43 national road projects implemented by UNRA during the NDP II period, there was overinvestment in the regions where road conditions were relatively good, i.e. central and western regions. These regions account for about 70 percent of the road network, compared to 30 in eastern and northern.
The study concludes that, while the Road Sector in Uganda faces serious funding challenges, the situation is compounded by low rates of return on investment. This situation is underpinned by high costs of construction coupled with poor project selection, preparation and management characterized by construction delays, cost overruns and sub-standard works. The recommendations from the study are thus:
• MoFPED needs to re-think the way funds are allocated taking into consideration the internal capacities of the MDAs to spend/absorb the funds.
• UNRA and other Agencies should ensure proper sequencing of road projects and align the budget to the sector plans.
• MoFPED and MoWT should increase allocations for Local Governments, especially, the Greater Kampala Metropolitan Area (GKMA).
• MoFPED should operationalize the second generation (2G) road fund to increase funding to road maintenance.
• MoWT and UNRA need to seriously consider spatial efficiency, that is, the geographic distribution of roads to be constructed or maintained.

Public Expenditure Governance in the Roads Sector | 1
1.0 INTRODUCTION
Roads are a vital drive for economic development. Investment in transport infrastructure is widely recognized as crucial in facilitating economic growth and socio-economic transformation (SDG 9), in reducing inequalities (SDG 10) and in promoting peaceful and inclusive societies (SDG 16) (AfDB, 2016). Academics and policy makers have long considered adequate supply of road infrastructure to be essential for economic development (see Calderón and Servén, 2003; Bosker & Garretsen 2012; Calderón et al, 2014 and Ng et al, 2019). By reducing the overall transportation times and costs, good road infrastructure not only lowers the physical barriers by stimulating the movements of people, goods and services, but also improves access to markets, social services and employment. There are, however, a few contradictory evidences and debates about the importance of roads to economic growth on account of endogeneity, identification, and reverse causality problems (e.g. those reported by World Bank, 2015).
Road infrastructure in Africa remains inadequate. The international road federation shows that the proportion of paved roads on the continent remains below 36 percent with South Africa leading the way at 35.4 percent followed by East Africa at 29.5 percent, Central Africa 23 percent and West Africa 18.3 percent. African roads are also the deadliest with 26.6 fatalities per 100,000 people way above the world average of 17.5. The continent is not able to raise funds required to close the infrastructure gap. The African Development Bank (2018) suggested that the continent’s infrastructure needed up to $130–170 billion a year, with a financing gap in the range $68–$108 billion. Yet the utilization of the meager resources available was characterized by inefficiencies due to poor planning, high construction costs and corruption. Improving the quality of roads in Africa requires construction of strategic roads that have high rate of return greater than unity and thus contributing to economic growth. This study is premised on the notion that improving public expenditure governance in the Road Sector would lead to improved quality of roads in Africa through improved public financial management in the Road Sector, allocative efficiency and spatial efficiency. The study uses a framework developed by Bogere and Makaaru (2014) to assess public expenditure governance in Uganda’s Road Sector. In this framework, public expenditure governance is defined as ‘the manner in which decisions over public expenditure are made and implemented and the nature of interaction among actors in pursuit of specific objectives.’ The framework views governance as a process with inputs and outcomes. It is through the outcomes that governance ultimately impacts on the quality of public services and welfare of citizens.
1.1 Background of the Study The Government of Uganda (GoU) considers infrastructure (particularly roads) as “fundamental” for the achieving of the Uganda Vision 2040 (Republic of Uganda, 2010).

2 | Public Expenditure Governance in the Roads Sector
Road transport is specifically important for Uganda because it is the dominant means of transport for both people and goods. It accounts for over 90 percent of cargo freight and passengers’ movement (MoWT, 2017). Roads were prioritized under the NDP II and National Annual Budgets for the period 2015/16 -2019/20. In particular, the GoU prioritized road corridors that would boost the economic growth drivers, referred to as the ATMs (Agriculture, Tourism, and Minerals including Oil and Gas), the Kampala and tourism roads, as well as, regional connections (Republic of Uganda, 2015).
Roads claim the largest share of the national budget as indicated in Section 3.2 of this report. The prioritization of roads is underpinned by the desire to facilitate movement of goods and services to markets locally, with in the region and beyond. As a result, the stock of paved road has increased to 5,015 km (22.2 percent) of the total national road network (21,544 km) from 3,795 km in 2013 (MoWT, 2018; World Bank, 2019). The target was to increase the stock of paved roads to 6,000 km by 2020 (Republic of Uganda, 2015). The Uganda National Roads Authority (UNRA) indicated that this target was expected to be met by FY 2021/22. They, however, cautioned that this projection is contingent on adequate funding which in the past had not performed as expected. The proportion of the national road network in fair to good condition had also increased from 85 percent to 97 percent for paved national roads and from 70 percent to 83 percent for unpaved national roads (MoWT, 2018).
Until 2008, investment in the road infrastructure was minimal, despite various analytical studies showing that infrastructure, including roads, was a major constraint to sustainable development in Uganda (World Bank, 2010). Therefore, beginning in the FY 2007/08, the GoU decided to address this issue and increased investment in the roads sector. At the same time, a decision was made to transfer some 10,000 km of district roads into the national network (ibid). To execute this plan, new entities were created: Uganda National Roads Authority (UNRA), to take charge of an expanded portfolio of national roads, and the launching of a Road Fund in 2009 to address the maintenance backlog. MoWT was left with only policy formulation, strategic planning, sector oversight and monitoring. Due to these reforms, public expenditure on national roads went up in absolute terms and as a proportion of the national budget in every year since 2009 (ODI, 2015). This has caused its own problems. Combined with the fact that the establishment of UNRA was followed in 2009 by a reclassification exercise that nearly doubled the scale of the national road network, the increased volume of funded activity put a severe strain on UNRA’s absorptive capacity. Complaints about the slowness of UNRA’s contracting processes have been persistent since then.
However, despite the prioritization and noticeable improvement in the roads sector, there still existed challenges that were critical to the performance of the sector. Some of these included: poor project selection, preparation and management; high construction costs due to a host of factors; and inadequate funding of maintenance of roads among others. Yet, projections by the Uganda National Roads Authority (UNRA) showed the demand for transport services in Uganda were likely to increase by 50 percent in the next five years (2020 – 2025).

Public Expenditure Governance in the Roads Sector | 3
1.2 Overall Objective of the Study The overall objective of the study was to examine Public Expenditure Governance (PEG) in Uganda’s Road Sector and its implications for performance of the sector.
Specific objectives were to:
a) Assess governance practices at the roads sector level.
b) Assess the adequacy, effectiveness, and efficiency of public expenditure towards achievement of the roads sector objectives for the period FY 2015/16 - 2018/19.
c) Make policy recommendations for improving public expenditure in the roads sub-sector.
1.3 Structure of the ReportThis report is structured as follows: Section 1 provides the background on Uganda’s road network, as well as, the rationale for undertaking Public Expenditure Governance Study (PEGS) Road Sector in Uganda. Section 2 provides the methodology used in undertaking the study. Section 3 describes the institutional framework for roads in Uganda. Section four provides the analysis of public expenditure on roads in Uganda, assessing efficiency in spending. Section 5 discusses the accountability and value for money in the Road Sector, while the final Section 6 concludes with the main deductions and commendations.
1.4 Assessment Framework and MethodologyThis is the second PEGS in the Road Sector undertaken by the Advocates Coalition for Development and Environment (ACODE) under its Center for Budget and Economic Governance (CBEG). In the study framework (Bogere et al, 2014), public expenditure governance is defined as the way in which decisions over public expenditure are made and implemented, as well as, the interaction of different actors in pursuit of objectives for which funds are allocated. The term covers both revenue and expenditure. Public expenditure governance is described as a process with inputs and outcomes. The study relies on analysis of the governance inputs, processes, and outcomes as shown in Figure 1.

4 | Public Expenditure Governance in the Roads Sector
Figure 1: Governance as a Production Process
Source: Bogere G., et al (2014)
Governance Inputs: Decision-making and implementation entail the design of policies rules and regulations, setting goals and priorities. Governance inputs encompass three principles of governance, including participation, strategic vision and coordination. Participation involves the interactions of individuals or organized groups in the process of formulation and implementation of public policies within a governance arena. From a public administration perspective, OECD (2013) defines strategic vision as the long-term big picture of objectives for the economy and society. These objectives shape and reflect both public sector and societal values. Coordination represents a purposeful alignment of tasks and efforts of public sector units. It generally aims to create greater coherence in policy and to reduce redundancy, lacunae, and contradictions within and between policies.
Governance Processes: Governance processes basically refer to three mutually enforcing attributes (also principles) characterizing the implementation of rules and procedures governing public expenditure. The attributes are Transparency, Accountability and Control of Corruption. Transparency is generally defined as the free flow and accessibility of information. Accountability is defined as a relationship between an actor and a forum, in which the actor has an obligation to report, explain and justify his or her conduct, while the forum can pose questions and pass judgment, and the actor can be sanctioned. Corruption is defined by the World Bank as

Public Expenditure Governance in the Roads Sector | 5
the abuse of public office for private gain and argues that all societies have features.
Governance Outcomes: These are the socially desirable outcomes that arise from implementation of the public expenditure processes using public expenditure inputs. Governance outcomes include effectiveness and efficiency, which are usually associated with each other. Effectiveness is about answering the question of whether an intervention achieves its objectives or which intervention would yield certain results. Efficiency is often divided into two, including technical efficiency that relates in-puts to outputs with higher levels of output-input ratios being adjudged to be more efficient. The other is allocative efficiency, which is about distributing resources in accordance with the capacity of public programmes in meeting strategic objectives (Bogere G., et al, 2014). The other governance outcome is responsiveness which has been defined by Best (2008) as “effective planning, evaluation, and feedback with regard to particular actions, as well as, the conduct of regular review processes to ensure that programmes reflect the needs and preferences of stakeholders”. Equity is defined as “the expansion of capabilities and opportunities to which everybody should have access” (UNDP, 1997).
Over the last decade, the Uganda Government has invested heavily in the Transport Sector, especially, the roads. However, the country’s road transport network is very small by international standards, with only 21.4 percent of the national road network, 0.4 percent of the district roads, and 5.6 percent of urban roads paved. According to the World Economic Forum (2016), Uganda’s quality of road infrastructure was rated at 4.1, compared to Kenya (4.3), Rwanda (3.8), and Tanzania (3.9). Rating 1 = extremely poor; 7 = extremely good. (World Economic Forum, 2016).
The key question being asked is: to what extent governance practices are responsible for service delivery failure in the Roads Sub-sector? The perspective of this study is that the underlying causes of the challenges are rooted in governance failures including inadequate anti-corruption effort, weak accountability, lack of clarity and consistency in the strategic vision of the Sector. This study uses an approach that links governance outcomes (effectiveness and efficiency of public expenditure) to governance processes and inputs in the Roads Sector.

6 | Public Expenditure Governance in the Roads Sector
2.0 METHODOLOGY
The study uses a mixed methods approach combining qualitative and quantitative techniques in order to enhance the validity of the findings. To achieve this, the reviewed and analysed government expenditures for the period FY 2015/16 – FY 2018/19 to assess consistency with policy priorities and achieved results. The study examines how expenditure in roads sector was allocated and managed, with the aim of assessing the efficiency of public spending on roads over the period under review. Efficiency analysis involves assessing how implementing entities in the roads sub-sector were making the best use of inputs to provide outputs in the form of roads and their associated public services. The analysis looks at four efficiency measures of: operational (the capability of the road agencies to deliver roads infrastructure in the most cost-effective manner possible while still ensuring high quality); administrative (the capacity of the MDAs engaged in roads infrastructure to produce desired results with minimum expenditure of time, money, personnel, and material); functional (the composition of public expenditures by main functions and at how these expenditures are aligned with national policies, strategies, sector objectives and other priorities); and spatial efficiency (geographic distribution of roads in Uganda).
The PER was complemented by document review, Consultative and Participatory Process Approach (CPPA) involving key stakeholders. This was important for garnering information on the different governance principles as indicated in the framework. It was also useful in enlisting perspectives of key stakeholders on the findings of the PER. The aim that the CPPA should bolster ownership of the results among policy makers.
2.1 Data SourcesThe study involved extensive review of key documents that included: the NDP II, and Works and Transport Sector Development Plan (2015/16 – 2019/20); the National Budget Framework Papers for FY2015/16 - FY2019/20; the Works and Transport Sector Budget Framework Papers for FY 2015/16 and FY 2019/20; the Approved Annual Budgets (Approved Estimates of Revenue and Expenditure) - FY2015/16 - FY2019/20; the Annual/Semi-Annual Budget Performance Reports - FY2015/16 - FY2019/20; and Quarterly Budget Performance Reports. Several academic and policy research papers were reviewed, analysed and critiqued to gain the insights necessary to meet the study objectives. Open-source data were used extensively for spatial analysis and to supplement information on the road network in Uganda.
Following the PER, consultative meetings were organised with the key actors in the roads sub-sector to enlist their perspectives. The key actors were drawn from MoWT, UNRA, URF, LGs, Development Partners, and CSOs.

Public Expenditure Governance in the Roads Sector | 7
2.2 Data Analysis A single Excel raw data file of budget data was developed. The analysis uses four core variables extracted directly from the database, in line with the PER framework (World Bank, 1996). These include: Sector, MDA, Programme, Sub-Program and Output. Data analysis generated descriptive statistics for the public expenditure review. Data gaps and implications were identified and reported.
2.3 Scope of the Study The study focuses on analysis of the roads at the national level covering the key MDAs in the Roads Sector of Ministry of Works and Transport (MoWT), Uganda National Roads Authority (UNRA), Uganda Road Fund (URF), other Ministries, Departments and Agencies with roads funding (such as Ministry of Lands, Housing, and Urban Development -MLHUD, Office of the Prime Minister –OPM, Ministry of Local Governments (MoLGs), for the period FY 2015/16 – FY 2018/19.
2.4 Limitations of the Study First, data gaps, especially, on disaggregated spending on road projects affected detailed analysis of the performance of the Road Sector. Secondly, scanty reporting on the external funding, especially, on road projects, hindered the possibility of getting a full picture on performance. Thirdly, the study only covered national roads, since the biggest percentage of road funding was allocated to national MDAs. However, despite these limitations, the criteria and data used in this analysis were sufficient to give credible findings.

8 | Public Expenditure Governance in the Roads Sector
3.0 FINDINGS
This section presents findings of the study along the three attributes of governance described in the PEG framework, namely, governance inputs, processes, and outcomes. In terms of inputs, the findings focus on Road Sector actors and coordination of their roles, the legal and policy framework for roads, as well as, participation of non-government actors in the sector. On governance processes, the findings focus on accountability & value for money in the sector and corruption. The findings on governance outcomes focus on Road Sector performance, financing, and efficiency – operational, allocative, and spatial efficiency.
3.1 Governance inputs
3.1.1 Actors and Coordination in the Roads Sector Uganda’s roads sub-sector is one of the three sub-sectors under the Works and Transport Sector. The mandate of the sector is to: (i) plan, develop, and maintain an economic, efficient, and effective transport infrastructure and transport services by road, rail, water and air; (ii) manage public works including government structures; and (iii) promote standards in the construction industry. The Ministry of Works is responsible for coordinating the entire works and Transport Sector. It is charged with policy formulation, supervision, and monitoring in the sector. The MoWT is specifically responsible for planning, developing and maintaining an economic, efficient and effective transport infrastructure and services; managing public buildings and developing standards in the construction industry.
Other key implementing institutions in the roads sub-sector include Uganda National Roads Authority (UNRA) whose mandate is to develop and maintain the national roads network, advise Government on general roads policy and contribute to addressing of transport concerns. Uganda Road Fund (URF) is mandated to finance routine and periodic maintenance of public roads in Uganda from mainly reserved road user charges. Kampala Capital City Authority (KCCA) constructs and maintains roads in Kampala city, where the District Local Governments (DLGs), Lower Local Governments (sub-counties) and urban councils maintain District Urban and Community Access roads (DUCAR).
Other institutions outside the Works and Transport Sector that have projects with road sub-components include: the Office of the Prime Minister (OPM), Ministry of Local Government (MoLG), Ministry of Land, Housing and Urban Development (MoLHUD) Ministry of Agriculture, Animal Industry and Fisheries (MAAIF), Ministry of Education, National Forestry Authority, Ministry of Energy and Mineral Development (MoEMD), as well as, Public Universities. These implement specific road projects which are mainly funded by development partners through projects like: District Livelihood Support Programme, Community Agriculture and Infrastructure Improvement Project (CAIIP), Millennium Villages Projects, Restoration of Livelihoods in Northern Region (PRELNOR), Albertine Region Sustainable Development Project, Vegetable Oil Development Project,

Public Expenditure Governance in the Roads Sector | 9
Mineral Wealth and Mining Infrastructure Development project, and Dry lands Integrated Development Project, among others. Some of these MDAs sign and implement infrastructure contracts due to institutional gaps, political directives and emergencies.
The Ministry of Finance, Planning and Economic Development (MoFPED) is responsible for financing and assessment of the efficiency of sector expenditures. The relationships among the actors as shown in Figure 2 included issuance of guidelines for utilization of funds which is normally accompanied by supervision and monitoring in one direction and reporting in the other direction. The figure depicts a multiplicity of reporting channels used by actors in the sector. It is important to note that there are other actors that impact on outcomes of the sector not included in the diagram including: Parliament, the Inspector General of Government (IGG), Police, Courts of Law, etc. (Bogere et al., 2014).
Figure 2: Relationships among key actors in the Road Sector in Uganda
Source: Adapted from Bogere, G. et al. (2014)
Development Partners (DPs), especially, the World Bank, African Development Bank (AfDB), the European Union (EU), Japan through Japan International Cooperation Agency (JICA) and China were key funders of roads in Uganda. Their funding and influence were collaborated under the Uganda Transport Sector Development Partners Group (UTSDPG). Other actors include: Office of the Auditor General (OAG) which is mandated to undertake financial audit (on annual basis) and value for money audits
TSWG
UTSDPG
OAG
PPDA
PS (Contractors
& Financiers)
Civil Society
MoFPEDDonors (i.e EU, WB, Japan, China, AfDB)
MoWTOPM MoLG
MDAs (i.e. MAAIF, MEMD, MLH&UD
etc.)
Districts, Municipalities,
TCs, & SCs
URF
UNRA
KCCA
PolicyFunding Reporting

10 | Public Expenditure Governance in the Roads Sector
(when required) of the roads sub-sector; the Public Procurement and Disposal Authority (PPDA) which issues guidelines followed in procurement related to road works, as well as, any procurement by the implementing institutions. The private sector undertakes most of the road works under different contractual arrangements including those that involve financing of road works by the sector; and the civil society organizations, are championing different causes in the sector (Bogere et al, 2014).
There are indications that the elaborate Road Sector institutional set up has not delivered the expected results. For instance, one of the reasons Government created UNRA was the widespread belief that public expenditures on roads were technically inefficient. The idea, therefore, was to shift resources from MoWT to a pseudo-private sector semi-autonomous UNRA that would utilize the resources more efficiently. However, there is no evidence that the creation of UNRA has delivered this benefit. Also, despite the fact that the Uganda Road Fund (URF) was established to operate as a 2G (Second Generation) Fund, it still receives funding through the consolidated fund, which are inadequate to meet the road maintenance requirements. This has led to huge road maintenance backlog as discussed in sub-section 5.4.
A 2017 report by Ministry of Public Service, noted that “the creation of Agencies under the Ministry has denied it control of the regulatory mandate and process”. In addition, “the institutional set up in the Ministry of Works and Transport and its Agencies that does not allow proper coordination, functional and utilization of the resources in the Transport Sector”. Furthermore, studies found that technical staff in the roads sub-sector have very little autonomy. Cabinet, Ministerial and Parliamentary approvals are required at various procurement and implementation stages (Ggoobi, 2019). The budget and project execution systems are process-heavy, complex, and time consuming – there is low visibility on the location of bottlenecks and the overall result is low execution rates for the sector.
3.1.2 Legal and Policy Framework for the Roads Sub-Sector The key laws and policies that govern the roads sub-sector in Uganda include the: Roads Act, 2019, UNRA Act 2006; the URF Act, 2008; the Local Governments Act (Cap 243, Schedule II); Traffic and Road Safety Act, 1998; PPDA Act, 2003; Sustainable Development Goals (SDS), Goal 91; National Development Plan (NDP II), and the Works and Transport Sector Development Plan (2015/16 – 2019/20). The Works and Transport Sector Development Plan is implemented through a sector-wide approach. Ministry of Works and Transport (MoWT) is the lead agency in the implementation of the Works and Transport Sector Development Plan (WTSDP). It is therefore responsible for policy formulation, legislation, regulation, standard setting and strategic planning. However, the Ministry, is also involved in the implementation of various road construction projects in the country (OAG, 2015). This is in conflict with its core mandate and perhaps constrains the Ministry in fulfilling its oversight role in the Transport Sector.
The Roads Act 2019 reformed the law relating to planning, construction, management and maintenance of public roads, bridges and ferry landings. It repealed the Roads
1 Build resilient infrastructure, promote inclusive and sustainable industrialization and foster innovation

Public Expenditure Governance in the Roads Sector | 11
Act, (Cap. 358) and the Access to Roads Act, (Cap. 350). It specifically provides for road tolls (introducing tolls payable in respect of such roads by a statutory instrument by all vehicles except presidential convoy and emergency vehicles – fire brigade and ambulances); Public Private Partnerships (PPPs) to operate tolls or collect toll revenue; and appointment of road authorities (responsible for construction, alteration, rehabilitation, maintenance, protection and supervision of roads falling within their jurisdiction).
The Road Act, 2019 also provides for road reserves (where now, there is flexibility in determining the width of road reserves unlike the older Acts that had set it at fifty feet from the center line of any road. Land acquisition and compensation is also catered for in accordance with the Constitution. The law also introduces new offences and high penalties against destroying roads, obstruction and interference on roads such as improper erection of billboards, clogging drains by depositing sewage, refuse or garbage, nuisance on roads and offences relating to toll roads among others. In addition, various offences have been removed from the Traffic and Road Safety Act and provided for under this Act such as failure to comply with speed limits.
If properly implemented, the new law may help to remedy Uganda’s Road Sector of some of its perennial challenges. Some of the notable penalties introduced under the Road Act 2019 on conviction include:
• A fine not exceeding two million currency points (UGX 40 billion) for a contractor who constructs a road which does not meet the requirements of standards prescribed by the Minister of Works and Transport. In addition, the court may require the contractor to remedy the defects in the road, road construction or road furniture.
• A fine not exceeding one hundred sixty-eight currency points2 (UGX 3.36 million) or imprisonment not exceeding seven years or both for failure to observe a building line. The Act also provides for an additional fine not exceeding two thousand currency points (UGX 40 million) for each day on which the offence continues.
• A fine not exceeding five thousand currency points (UGX100 million), while littering attracts a fine not exceeding one hundred twenty currency points (UGX 2.4 million) or imprisonment not exceeding five years, or both for obstructing an officer acting under the Act.
3.1.3 Participation of Non-State ActorsParticipation involves the interactions of individuals or organized groups in the process of formulation and implementation of public policies within a governance arena (Graham et al, 2003). Participation is a process through which stakeholders influence and share control over development initiatives and the decisions and resources which affect them (World Bank, 1995). In this sub-section we discuss the involvement of the non-state actors in roads sub-sector, particularly, in construction, maintenance, and decision making.
The Road Sector reforms which were instituted during mid-2000s increased the role of the private sector suppliers of roads’ services especially construction firms and consulting engineers. These include both local and international firms. Other non-state actor includes organized road construction industry associations and organized road transport users (including bus and truck associations, and other road user bodies), and
2 A currency point is equivalent to twenty thousand shillings.

12 | Public Expenditure Governance in the Roads Sector
Civil Society Organizations (CSOs).
Private sector participation is mainly through provision of consultancy services and construction. Over time the number of international firms has increased due to increased funding, especially, by external sources for the roads sector. However, there is perceived view that international firms have overwhelming financial power and political influence that get the larger contracts compared to local firms. In addition, the ‘tying’ of aid or loans by external funders, especially, China, to Chinese firms, has only disadvantaged local firms but has also raised concerns on low quality of roads, cost inflation, corruption, poor labor standards, and environmental damage.
Although the MoWT has initiatives for encouraging participation of Ugandan private sector nationals through (i) promoting utilization of local consultants and contractors, and (ii) capacity building for the same groups. However, the proportion of value of construction works executed by local firms stood at only 30 percent in 2018. The local contractors feel disadvantaged by the tendering criteria which require them to demonstrate financial capacity and sufficient staffing and equipment in advance of being awarded a contract. Chinese and other international firms have access to credit on terms that local providers cannot obtain from banks in Uganda. The engagement of local firms in further constrained by use of ‘Force Account’ (that is, using its own staff and equipment) by MoWT, UNRA, and district councils to undertake ‘emergency’ road works. Force Account reduced effective demand for private construction services in precisely the fields of business where the local suppliers had existing capacity, such as, rehabilitation and maintenance of marram (gravel) roads.
Since road investments are capital-intensive, the use of Public Private Partnerships (PPPs) has been encouraged. The PPP policy supports private sector provision of transport services including road construction. Through PPPs pressure on the budget envelope may be relieved to an extent if some future road investments are partly financed by the private sector. The private sector can fund, own and maintain a proportion of the road infrastructure especially high traffic roads where road tolls are viable. Through arrangements like design-and-build and public-private partnerships (PPP), the private sector participation can help to reduce on the long lead periods (which in practice often takes nine years or more in Uganda) in implementation of road project. The Roads Act, 2019 has put provisions for the imposition of road tolls on certain public roads especially those constructed through PPPs, to enable the concessionaire to collect tolls to recover its investment.
Civil Society Organizations (CSOs) are to some extent involved in policy making and implementation through participating in joint annual sector review meetings, Sector working group meetings, and monitoring of road works. For instance, under their umbrella Civil Society Coalition on Transport in Uganda (CISCOT) (with a membership of 25 organizations) participate in the Works and Transport Joint Annual Sector Review meetings in which issues concerned implementation on roads are discussed. Among the key issues raised by CISCOT during the 14th Works and Transport Joint Annual Sector Review held in August 2018 was the high cost of roads works in Uganda compared to other countries in the region. In their statement, CISCOT noted that “A number of costs have been queried by the public being more expensive than similar roads some of which
Public Expenditure Governance in the Roads Sector | 13
are even bigger than the ones we are constructing in Uganda. UNRA has never come out with any statement to explain such expensive roads.”
In addition, CISCOT, and Uganda Road Sector Support Initiative (URSSI) assess and evaluate the Road Sector performance. For instance, in the 2014 CISCOT monitoring exercise found that some of the new roads could not live to their estimated lifespan. The CSOs are also part of the Joint Monitoring Mission which assesses the progress of implementation of specific infrastructure projects which include roads.
3.2 Governance processesPublic expenditure processes under the Road Sector are characterized by four interrelated problems including weak accountability, poor performance on value for money audits, high profile corruption scandals and high unit costs of road construction. This sub-section presents details of the findings of the study on these four issues.
3.2.1 Weak accountability in the Road SectorAccountability is a fluid and contested concept in governance. For this study we adopt Bovens’ (2007) perspective in which accountability is defined as a relationship between an actor and a forum3, in which the actor has an obligation to explain and to justify his or her conduct, while the forum can pose questions and pass judgment, and the actor can be sanctioned. Thus, accountability in the roads sub-sector is about the implementing institutions being held to account by different forums including citizen forums.
Despite commitments to accountability and transparency in the Sector, information on the Sector remains inaccessible in terms of both access and clarity. The situation is particularly bad at Local Governments where information of road works is very scanty (Bogere et al, 2014). There is also concern about the integrity of the information on the Roads Sector, especially, information on the condition of the road network. The road condition surveys are not consistently undertaken across the different institutions involved in implementation of road works (ibid).
While Sector and institutional policy guidelines include mandatory requirement to disseminate information, they do not explicitly define the information to be disseminated. Further, while the Annual Joint Transport Sector Review provides information on performance on governance commitments in the sector, the reports are not readily accessible. Also, institutions outside the works and Transport Sector do not individually report on their performance, thus, no performance information is available.
In Uganda, there is an almost complete absence of data, mechanisms and tools to track performance and hold the roads sector accountable for the quality of spending. Therefore, in absence of consistent, good disaggregated quality data on both physical and financial aspects of roads, it is hard to ensure accountability in the roads sector. There are no mechanisms in place to relate expenditures to physical outcomes or decision tools to support review of budget proposals or evaluate the efficiency of sector
3 The actor can be an individual, an official/ civil servant, or government agency, while the forum can be a specific person such as a superior, minister, or an agency such as parliament, a court, audit office, etc

14 | Public Expenditure Governance in the Roads Sector
expenditures.
3.2.2 Poor performance on value for money auditsRoads have certain characteristics which magnify the importance of getting value for money (VfM) right, including long time frames, high sunk costs, path dependency (lock-in to decisions once made) and their central role in poverty reduction. There are concerns in Uganda that road construction is very expensive without clear estimates of the unit cost per Kilometer of road and also the rampant delays of major road projects that are delivered with poor quality. A recent value for money audit report on budget performance in the works and Transport Sector identified key factors impacting on the delivery of the expected outputs for the sector namely: failure to translate plans into budget necessary to achieve NDP II targets; low levels of budget performance (releases vis-à-vis approved budgets) and absorption; budget re-allocation/virement4 diversion of funds leading to mischarge of expenditure to budget lines with no relation to the expenditure in question. A total of UGX 24 billion and UGX 281.67 billion was found to have been diverted by MoWT and UNRA towards unrelated activities during the FY 2017/18 (OAG, 2018). Accounting officers in the sector attributed this practice to budget constraints imposed by the MTEF limits issued by MoFPED and the priority demands accounting officers have to meet even in instances where resources are not forthcoming.
The Auditor General also found that inherent lags or delays in the procurement system together with cost variations in the roads sector negatively impacted on timeliness of projects. For UNRA, procurement delays were mainly attributed to administrative reviews and sometimes bureaucratic processes to which procurements are subjected in fulfillment of the financing requirements. The Auditor General’s report found disagreements over land ownership and land compensation rates as one of the main causes of delays in implementation of road projects. Weak monitoring and evaluation (M&E) of implemented activities was also cited in the OAG (2018) report. For example, it was established that despite its critical role in UNRA, no funds were specifically allocated to the M&E function. The OAG (2018) also cited lack of adequate performance information as that makes it difficult to assess the extent of delivery of planned outputs by the works and Transport Sector. As a result, there are no standardized indicators for assessment of performance by the sector.
3.2.3 Corruption in the Roads sub-sector Recent studies show that corruption in public infrastructure contracts is widespread, according to the World Bank, corruption in transport projects can account for as much as 5 percent to 20 percent of transaction costs. Public procurement has been cited as the sector most vulnerable to corruption in Uganda. It is estimated that 9.4 percent of total contract values is lost to corruption at the local and central government levels (GAN, 2019). Uganda has over the years seen several high-profile road projects corruption scandals. Some of the notable ones include, the construction of the UGX 165 billion Mukono-Katosi road, UGX 250 Billion Kawempe-Kaffu road, UGX 350 Billion Entebbe-4 For example, during the FY 2017/18, the MoWT made reallocations amounting to UGX 15 billion to outputs that had not been initially planned but did not adjust the planned outputs to reflect the respective changes in budgetary allocations (OAG, 2018).
Public Expenditure Governance in the Roads Sector | 15
Zana road, UGX 109 Billion Hoima-Tonya road, and UGX 18 Billion Kanoni-Sembabule road among others.
Corruption in the roads sector prompted President Yoweri Museveni in 2015 to set up a Commission of inquiry into misuse of funds at Uganda National Roads Authority (UNRA) which revealed that an astronomical UGX4 Trillion had been misappropriated between 2008 and 2015. The Commission found that top officials in UNRA connived with consultants and contractors to swindle the Authority’s funds. The inquiry also found that there was no genuine competition for road projects and contractors were paid billions for no work done or shoddy work. For instance, the Pakwach-Nebbi and Fort Portal-Hoima roads began disintegrating even before they were handed over to the Government.
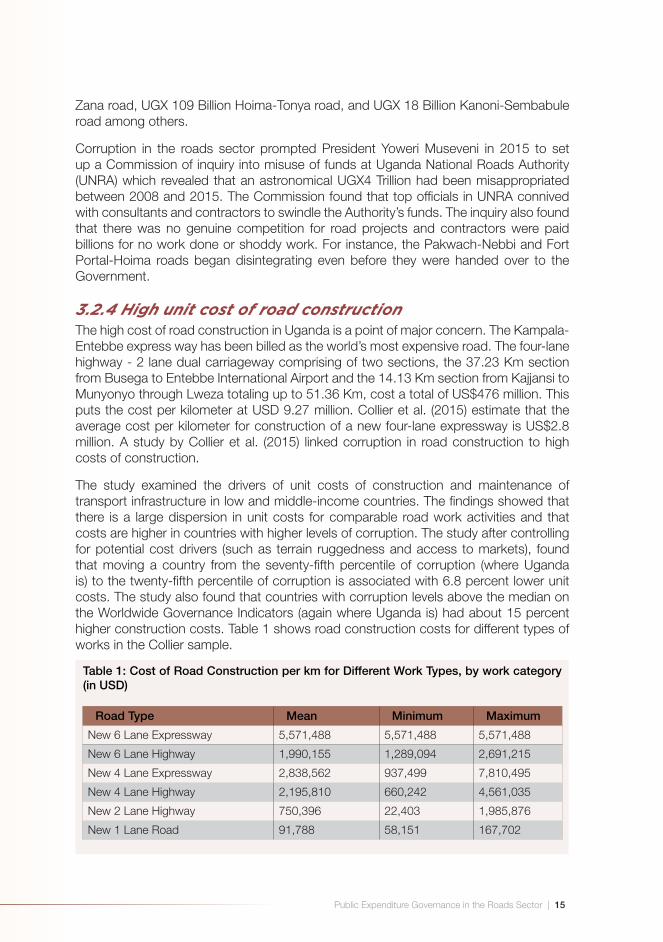
3.2.4 High unit cost of road constructionThe high cost of road construction in Uganda is a point of major concern. The Kampala-Entebbe express way has been billed as the world’s most expensive road. The four-lane highway - 2 lane dual carriageway comprising of two sections, the 37.23 Km section from Busega to Entebbe International Airport and the 14.13 Km section from Kajjansi to Munyonyo through Lweza totaling up to 51.36 Km, cost a total of US$476 million. This puts the cost per kilometer at USD 9.27 million. Collier et al. (2015) estimate that the average cost per kilometer for construction of a new four-lane expressway is US$2.8 million. A study by Collier et al. (2015) linked corruption in road construction to high costs of construction.
The study examined the drivers of unit costs of construction and maintenance of transport infrastructure in low and middle-income countries. The findings showed that there is a large dispersion in unit costs for comparable road work activities and that costs are higher in countries with higher levels of corruption. The study after controlling for potential cost drivers (such as terrain ruggedness and access to markets), found that moving a country from the seventy-fifth percentile of corruption (where Uganda is) to the twenty-fifth percentile of corruption is associated with 6.8 percent lower unit costs. The study also found that countries with corruption levels above the median on the Worldwide Governance Indicators (again where Uganda is) had about 15 percent higher construction costs. Table 1 shows road construction costs for different types of works in the Collier sample.
Table 1: Cost of Road Construction per km for Different Work Types, by work category (in USD)
Road Type Mean Minimum Maximum
New 6 Lane Expressway 5,571,488 5,571,488 5,571,488
New 6 Lane Highway 1,990,155 1,289,094 2,691,215
New 4 Lane Expressway 2,838,562 937,499 7,810,495
New 4 Lane Highway 2,195,810 660,242 4,561,035
New 2 Lane Highway 750,396 22,403 1,985,876
New 1 Lane Road 91,788 58,151 167,702

16 | Public Expenditure Governance in the Roads Sector
Road Type Mean Minimum Maximum
Widening and Reconstruction 874,209 178,494 6,532,523
Upgrading 250,472 3,551 940,837
Source: Adopted from Collier et al. (2015)
Therefore, higher costs, both in terms of capital costs (since delays increase the construction costs) and in terms of recurrent costs, such as, the supervision and implementation support budgets in countries such as Uganda are purely remediable. High procurement costs and other factors that hike unit cost of the paving works (upfront costs of roads construction) are a result of corruption. It is estimated that the average construction cost for upgrading roads to paved standard with bituminous surface treatment in Uganda was UGX 2.36 billion per Km during the NDP II period (UNRA, 2018). This cost excludes the cost of land acquisition. This is because the value of land is dependent on many factors which may not be easily benchmarked among projects or even road sections in different geographical locations. The average cost of reconstruction or rehabilitation of the paved roads was UGX 1.96 billion per Km (ibid). In addition, according to UNRA, the average construction cost for upgrading roads to paved standard with bituminous surface treatment during the FY 18/19 was UGX 3.1 billion per kilometer as compared to UGX 2.36 billion per kilometer in the FY17/18. A high percentage of “poor” condition roads may be the result of corruption. The causes are a bias toward large capital projects instead of maintenance of existing networks; a tendency to misuse resources generally by not investing sufficiently in routine maintenance; poor quality of construction and repair work, and fraud in construction and repair work.
3.2.5 High costs of construction materials and landThis has led to overpricing of road works, for instance, the Commission of Inquiry into the Uganda National Roads Authority (UNRA) in 2016 found that the unit cost of asphalt concrete in Uganda was 19 per cent higher than the unit cost in Rwanda and 52 per cent higher than the corresponding cost in Ethiopia. The cost of base course of crushed stone or natural gravel in Uganda is 6 percent higher than the cost in Rwanda and 130 percent higher than the corresponding cost in Ethiopia. The cost of subbase in Uganda is 221 percent higher than the corresponding cost in Rwanda while for sub grade layers out of selected material; the cost in Uganda was 69 percent higher than the cost in Rwanda and 125 percent higher than the corresponding cost in Ethiopia.
The high cost of compensation is another key driver of road construction cost in Uganda. The situation is compounded by speculators who acquire and/or develop land along the proposed transport infrastructure corridors in anticipation of high compensation from government (NPA, 2020). Projects such Kampala-Entebbe Expressway (with land and property compensation valued at UGX 331 billion/USD 89 million), Kampala Northern Bypass (where land and property compensation were worth UGX 83 billion/USD 22 million) have been cited as having escalated the construction costs (ibid).
During the study validation meeting, officials of the key stakeholders in the roads sub-sector cited low capacity of local contractors that lead to over-reliance on relatively

Public Expenditure Governance in the Roads Sector | 17
expensive foreign contractors; volatile exchange rates that raise costs; collusion and escalation of land compensation costs; procurement delays caused by whistle-blowers and administrative reviews leading contractors to charge for wasted time; and scarcity of good quality local road construction materials (such as gravel, sand, etc.), as some of the reasons making road construction expensive in Uganda. They also cited pre-financing arrangements used by UNRA, where contractors were sometimes expected to temporally meet the construction costs for a defined period until the GoU secures funding for the road project. This is of course done at extra cost.
3.3 Governance Outcomes
3.3.1 Condition of RoadsUganda’s total road network is 159,366 Km comprising of 20,854 Km of National Roads; 38,603 Km of District Roads; 19,959 Km of Urban Roads and 79,947 Km of Community Access Roads (NPA, 2020). The national roads link border posts, airports and ports to each other as well as to the capital city. District roads link district headquarters to the national road network and sub-county administrative centers. Urban roads are those within the boundaries of urban areas, while community access roads are those within villages that link communities and also provide access to administrative, social and economic services (MoWT, 2017).
Available data indicate that only about 5,100 Km (4 percent) of Uganda’s road network is paved, while the rest of the network is of gravel or earth surface. Of the national road network, only 4,387 Km is paved representing 21.4 percent, while only 145 Km (0.4 percent) of the district roads is paved. For Urban roads, only 570.8 Km is paved (5.6 percent) while all community access roads are not paved (MoWT, 2017).
The condition of roads is mainly measured using the indicator of fair to good condition, based on the available data from sector performance reports, there was deterioration in condition of national (paved and unpaved), and KCCA (paved and unpaved) during FY 2018/19 (see, Figure 3).

18 | Public Expenditure Governance in the Roads Sector
Figure 3: Proportion of road network in fair to good condition
Source: Author’s calculations based on MoWT (Sector Performance reports)
The bad condition of roads is exacerbated by narrow width of most roads in Uganda. According to the 2019 Road User Satisfaction Survey, narrow width of road was the most common reason why 25 percent of road users felt unsafe on Uganda’s roads, presence of potholes on roads scored 19 percent, inadequate road maintenance scored 16 percent, and poor drainage 9.75 percent (URF, 2019). National roads were rated better than both DUCAR and KCCA roads on all road attributes assessed in the survey, namely quality road surface, road signs, road markings, durability, absence of traffic congestion, and absence of potholes. However, DUCAR roads were rated as lowest on all road attributes. The low satisfaction with DUCAR can be attributed to poor funding hence the failure of the Local Governments and KCCA to effectively maintain roads. In the urban areas, especially, Kampala City, many roads are so narrow and so saturated with traffic that some motorists have resorted to driving on road shoulders. In the same manner, roadside parking has made pedestrian and cyclist accessibility inoperable and dangerous due to weak enforcement measures and poor safety culture (UN, 2018). To address this challenge, KCCA opted to constructing the Non-Motorized Transport (NMT) corridor in some parts of Kampala City (Namirembe Road and Luwum Street), to decongest that part of the city thereby facilitating inclusive access to all parts of the city.
The lack of a mass transit system in the Greater Kampala Metropolitan Area (GKMA) to efficiently convey large volumes of passengers leads to congestion and delays resulting into loss of productivity within the GKMA. The average travel time in GKMA is 4 minutes per kilometer compared to 2.5 minutes per kilometer in other cities and 1 minute per kilometer on district and national roads.

Public Expenditure Governance in the Roads Sector | 19
Thus, wider roads, though costly due to policies that make land acquisition expensive, are needed to accommodate the increasing number of vehicles plying the roads annually, particularly, to segregate traffic, enhance safety, and reduced journey times. The urban population is increasing at 5.43 percent per annum and is expected to grow to over 20 million people in 2040 from 6 million people in 2013. In addition, Uganda should start considering holistic road development, that is, road designs that integrate components such as marketplaces for local produce, schools, health facilities, streetlights, and so on. There must be linkages between the road and economic activities fully catered for in the road design.
3.3.2 Road Sector Performance The Vision 2040 target is to develop the road network infrastructure in Uganda to improve transport connectivity, effectiveness, and efficiency and achieve average paved road density of 100 Km per 1000 Sq. km by 2040 (The Republic of Uganda, 2015). During NDP II (FY 2015/16 – FY 2019/20), the Works and Transport Sector had a total of 160 road projects, of which sixty-three (63) were NDP I on-going or “retained” road projects, while the rest were NDP II pipeline projects. The overall NDP II target was to upgrade national roads from 3,795 Km to 6,000 Km by 2020. NPA (2020) indicates that although the paved national road network improved from 19 percent in 2008 to 23.83 percent in 2018, it was 1,029 Km short of the NDP II target of 6,000 Km by FY2019/20. The GoU also planned to improve 1,525 Kms of Community Access Roads per year to foster Local Economic Development (LED). Other key NDP II targets under the roads sub-sector were to: upgrade 2,205 Km of gravel roads to tarmac, rehabilitate 700 Km of old paved roads, maintain 2,500 Km of paved roads and 10,000 Km of unpaved roads and open up community access roads to link farmers to markets and social services. The NDP II targets are summarized in Table 2.
Table 2: NDP II targets under the roads sub-sector
Critical Indicators NDPII Baseline 2012/13
NDPII Target 2019/20
Increase in the total paved national road network (Km) 3,795 6,000
Increase in proportion of paved national to total national roads (%)
16.6 25
Increase in proportion of paved urban roads to national roads (%)
3.57 4.29
Increased in paved KCCA roads to total KCCA roads (%) 38.36 46.64
Source: NDP II
To realize the NPD II targets, the following core road projects were to be implemented: Kampala-Jinja Expressway; Kibuye-Busega-Nabingo; Kampala Southern By-pass; Kampala-Bombo Expressway; Upgrading of Kapchorwa-Suam Road; Kampala-Mpigi Expressway; Rwekunye-Apac-Lira-Kitgum-Musingo Road; Road Construction Equipment; Albertine region roads (Hoima-Butiaba-Wanseko, Karugutu-Ntoroko, Kabwoya–Buhuka, and Rwenkunye-Apac-Lira- Acholibur); and key tourism roads

20 | Public Expenditure Governance in the Roads Sector
(Hamurwa-Kerere-Kanungu/Buleme-Buhoma-Butogota-Hamayanja-Ifasha-Ikumba, Ishasha-Katunguru, Kisoro-Rubuguli-Muko, Kabale-Bunyonyi, Nakapiripiriti-Muyembe, and Apoka Lodge-Kotido). However, there has been slow implementation of these key road projects. Out of the 22 NDP II core road projects, only 9 are on schedule, while 13 are either at feasibility stage or have not yet started (details are contained in the Annex).
During the validation meeting of this study, stakeholders reported that the sector was far behind some of the targets. For example, KCCA was reported to have lapsed instead of progressing to the extent that they were even behind the baseline target of 38.36 percent of paved KCCA roads by the time off this study. Officials from KCCA believed there was need to overhaul most of the roads in the city since they had worn out beyond routine repair and maintenance.
The NDP II target for annual rate of production of roads was set at 520 Km equivalent per year, however, UNRA had been able to achieve 329 Km equivalent per year. This created a total gap/deficit of 766 Km during the NDP II period (see, Table 3). The underperformance is partly attributed to financial constraints and procurement delays. In addition, the lifecycle of road development that entails a number of activities to be undertaken before actual construction commences, such as planning and putting together financing arrangements and procurement, does not often get sound attention to these steps. This means that the substantially completed projects depended majorly on the speed of implementation and that of their lead times for project preparation and procurement. However, the numerous administrative reviews, interference in the procurement process by outside lobbyists and the anonymous whistle-blowers resulted into the slow progress of the procurement of contracts (UNRA, 2018).
Table 3: Annual Construction Productivity in Roads
Year NDP II expected Annual Av. Rate (Km)
Actual Km Equiv. Achieved
Deficit (Km)
2015/16 520 300 -220
2016/17 520 310 -210
2017/18 520 305 -215
2018/19 521 400 -121
Average 520 329
Source: UNRA (2018)
Government fulfilled its commitment to funding roads in line with the NDP II (2015/16 – 2019/20). During this period, the total planned public expenditure for the Works and Transport Sector was UGX 21,247 Bn. Also, Government allocated at least UGX 22,935 Bn or 8 percent more than the planned allocation (see Figure 4).

Public Expenditure Governance in the Roads Sector | 21
Figure 4: Works & Transport Sector budget allocations against NDP II
Source: Authors’ calculations based on Approved Budget Estimates & NPA Projections
3.3.3 Road Sector FinancingThe Roads Sector is financed through a complex mechanism involving multiple domestic and external financing sources, channeled through the national on-budget and sometimes off-budget. However, in this paper, we only analyze the on-budget funding. The resources for the Road Sector consist of Government of Uganda (GoU) funds and external funding, often from multilateral and bilateral sources such as the IBRD (World Bank), AfDB, EU, JICA, the Republic of China, among others. The Roads Sector funding is channeled through MDAs under Works and Transport Sector and other MDAs as discussed in sub-section 3.1. External funding has been growing from 20 percent in 2015/16 to 51 percent in 2017/18 and 44 percent in 2018/19 (see, Figure 5).

22 | Public Expenditure Governance in the Roads Sector
Figure 5: Trends in Roads sub-sector funding
Source: Authors’ calculations based on Approved Budget Estimates
Dependence on external funding in supporting Uganda’s roads infrastructure is a big challenge in ensuring sustainability because external funding is usually unpredictable in two major ways: (i) it is not always clear when the funds will be disbursed; and (ii) in some cases, failure of external funders to disburse funds that are recorded in the MTEF causing uncertainty in the operational funds and disrupting implementation of road programmes. Thus, any funding cuts by external funders can adversely affect road infrastructure developments.
As shown in Figure 6, the reliance on external funding is not a viable long-term strategy for construction and maintenance of the road networks. Budget execution rates are higher for GoU funding compared to external funding (averaging 44 percent during the four FYs). External funds are quite unpredictable as shown by the fluctuations in absorption levels from 92 percent in FY 2015/16 to 23 percent in 2016/17, then to 56 percent in 2017/18 and down to 39 percent in 2018/19. There were various reasons for minimal execution of external funds but the most was the untimely and insufficient release of counterpart funds by Government and delays in procurement of works by the relevant MDAs.
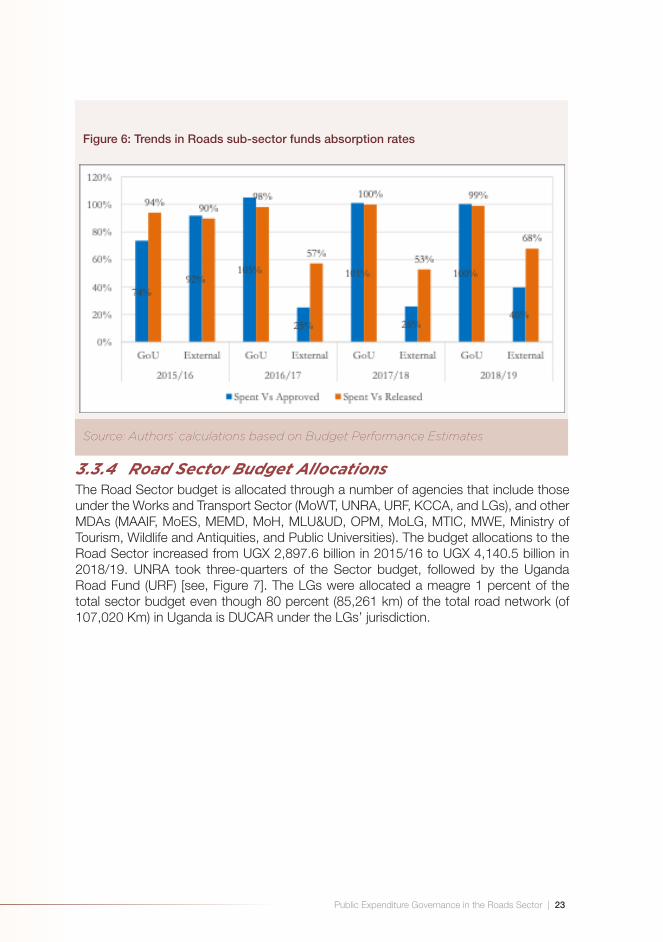
Public Expenditure Governance in the Roads Sector | 23
Figure 6: Trends in Roads sub-sector funds absorption rates
Source: Authors’ calculations based on Budget Performance Estimates
3.3.4 Road Sector Budget Allocations The Road Sector budget is allocated through a number of agencies that include those under the Works and Transport Sector (MoWT, UNRA, URF, KCCA, and LGs), and other MDAs (MAAIF, MoES, MEMD, MoH, MLU&UD, OPM, MoLG, MTIC, MWE, Ministry of Tourism, Wildlife and Antiquities, and Public Universities). The budget allocations to the Road Sector increased from UGX 2,897.6 billion in 2015/16 to UGX 4,140.5 billion in 2018/19. UNRA took three-quarters of the Sector budget, followed by the Uganda Road Fund (URF) [see, Figure 7]. The LGs were allocated a meagre 1 percent of the total sector budget even though 80 percent (85,261 km) of the total road network (of 107,020 Km) in Uganda is DUCAR under the LGs’ jurisdiction.

24 | Public Expenditure Governance in the Roads Sector
Figure 7: Trends in Roads sub-sector budget allocations
Source: Authors’ calculations based on Approved Budget Estimates
The meagre allocation of DUCAR funding has led to little or no road maintenance thus wastage of resources and deterioration of the roads. Improving earth roads to provide all-weather access requires a judicious review of the planning, budgeting, the technologies available, as well as, institutional set up to improve such roads.
3.3.5 Road Budgets outside the Road Sector There are 11 MDAs outside the Works and Transport Sector that implement road projects, these are: MAAIF, MoES, MEMD, MoH, MLU&UD, OPM, MoLG, MTIC, MWE, Ministry of Tourism, Wildlife and Antiquities, and Public Universities. As shown in Figure 8, the biggest beneficiaries have always been MDAs under the Public Sector Management (i.e. OPM and MoLG), followed by Lands, Housing and Urban Development; and lately MAAIF. It should be noted here that these MDAs are implementing externally funded projects.

Public Expenditure Governance in the Roads Sector | 25
Figure 8: Road funding outside the Works and Transport Sector
Source: Authors based Approved Budget Estimates and budget performance reports
The major concern is that the absorption capacity of funds under the other MDAs is very low with almost 70 percent of allocated funds not spent during the FY 2015/16 to FY 2018/19 period. The inability of the MDAs to spend the allocated funds can be attributed partly to the capacity constraints (especially, the lack of requisite human resources) within the agencies since road construction is not their mandate.
3.3.6 Financing Road Maintenance Since beginning of the prioritization of roads, the GoU has focused on expansion of the national paved road network nearly at the expense of maintenance of existing and newly paved roads. To fund maintenance of all roads, the Uganda Road Fund (URF) was created by an Act of Parliament in 2008 and became fully operational on July 1, 2010. It was created to operate as a Second-Generation Fund with the objective of financing routine and periodic maintenance of public roads in Uganda. It was envisaged that to carry out its mandate, the URF would get revenues from road user charges including fuel levy, license and other road related charges.5 URF is to finance the implementation of the Annual Road Maintenance Programmes (ARMP) carried out by the UNRA, KCCA and the other designated agencies responsible for DUCARs. Uganda’s classified road network funded by the URF is 107,020 Km. These are broken down as 20,552 Km under UNRA, 1,207km under KCCA and 85,261 Km under DUCAR or the Local Governments’ jurisdiction.
Over the FY 2015/16 – FY 2018/19 period, the road maintenance funding received averaged UGX 450 billion, which is about 12 percent of the total approved roads Sector
5 The sources of funds, listed in section 21 of the Act, include: Road user charges, including: fuel levy, transit fees, road license, axle load fines; tolls, weight/distance charges; and Traffic and road safety fines

26 | Public Expenditure Governance in the Roads Sector
budget (see, Figure 9). The current road maintenance financing gap is 74% what has been given can only meet about 26 percent of the needs. This leaves a big chunk of the road network unattended to. Persistent failure to adequately maintain the road infrastructure has created a backlog of 51,735 Km of public roads that have not been maintained over a long period of time despite statutory or approved increase in the budget allocation into the development of the Roads Sub-sector. Instead, priority has been given to construction of new roads. Yet URF is one of the best performing MDAs at budget absorption. For example, MoFPED (2019b) reported very good performance at 91 percent against a 99.8 percent (UGX 541.221billion) release of the budget during the FY 2018/19 for maintenance of both DUCAR and national roads.
Figure 9: Trends in Road maintenance funding between FY2015/16 and FY2018/19
Source: Authors based Approved Budget Estimates and budget performance reports
Although more than 80 percent (85,261 km) of the total road network (107,020 Km) in Uganda are DUCAR and under the Local Governments’ jurisdiction, only 35 percent of the road maintenance funding is provided to LGs (see, Figure 10). This explains the poor state of most district, urban, and community access roads. For instance, the proportion of the district unpaved roads in fair to good condition was estimated at 65 percent in FY 2018/19.

Public Expenditure Governance in the Roads Sector | 27
Figure10: Trends in distribution of road maintenance funding
Source: Authors based Approved Budget Estimates and budget performance reports
The unmet road maintenance needs are steadily increasing at a rate faster than the increment in available funding. Reports indicate that available funding will only meet 25 percent of the needs, leaving a funding gap for road maintenance of 75 percent (see, Table 4). The road maintenance needs for the FY 2018/19 was UGX 1,807.2 Bn. However, only UGX 527.3 Bn was allocated for the purpose, representing only 28.3 percent of the annual road maintenance needs funded (MoWT, 2019). This imbalance contributed to the unmanageable development of the roads network while the backlog on maintenance continues to grow leading to higher replacement costs of the road asset in the future (UNRA, 2018).
Table 4: Road Maintenance Funding for FY2015/16-FY2018/19 (UGX Billion)
Needs Available* Unmet Needs
Mai
nten
ance
Bac
klo
g
Tota
l
Mai
nten
ance
Oth
ers*
*
Tota
l
Am
oun
t
Per
cent
age
2015/16 1,273.3 822.4 2,095.7 410.9 441.6 852.5 1,243.2 59.3
2016/17 1,732.8 1235.8 2,968.6 406.8 583.5 990.3 1,978.3 66.6
2017/18 1,756.7 1243.5 3,000.2 406.8 335.4 742.2 2,258.0 75.3
2018/19 1,807.2 1258.0 3,065.2 527.3 337.1 864.4 2,200.8 71.8
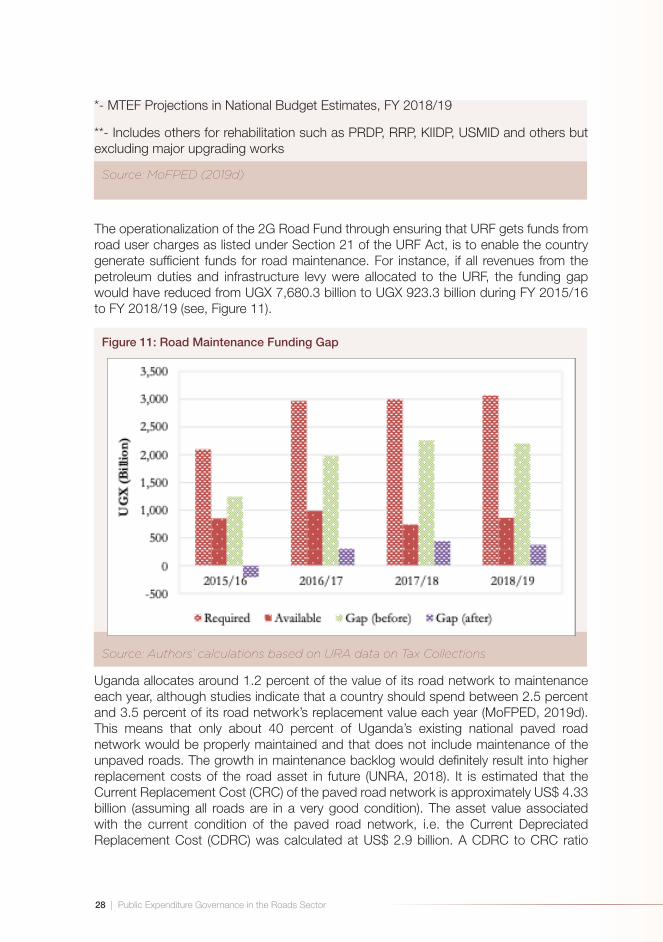
28 | Public Expenditure Governance in the Roads Sector
*- MTEF Projections in National Budget Estimates, FY 2018/19
**- Includes others for rehabilitation such as PRDP, RRP, KIIDP, USMID and others but excluding major upgrading works
Source: MoFPED (2019d)
The operationalization of the 2G Road Fund through ensuring that URF gets funds from road user charges as listed under Section 21 of the URF Act, is to enable the country generate sufficient funds for road maintenance. For instance, if all revenues from the petroleum duties and infrastructure levy were allocated to the URF, the funding gap would have reduced from UGX 7,680.3 billion to UGX 923.3 billion during FY 2015/16 to FY 2018/19 (see, Figure 11).
Figure 11: Road Maintenance Funding Gap
Source: Authors’ calculations based on URA data on Tax Collections
Uganda allocates around 1.2 percent of the value of its road network to maintenance each year, although studies indicate that a country should spend between 2.5 percent and 3.5 percent of its road network’s replacement value each year (MoFPED, 2019d). This means that only about 40 percent of Uganda’s existing national paved road network would be properly maintained and that does not include maintenance of the unpaved roads. The growth in maintenance backlog would definitely result into higher replacement costs of the road asset in future (UNRA, 2018). It is estimated that the Current Replacement Cost (CRC) of the paved road network is approximately US$ 4.33 billion (assuming all roads are in a very good condition). The asset value associated with the current condition of the paved road network, i.e. the Current Depreciated Replacement Cost (CDRC) was calculated at US$ 2.9 billion. A CDRC to CRC ratio

Public Expenditure Governance in the Roads Sector | 29
greater than 80 percent is indicative of a well-maintained road network (UNRA, 2018). However, Uganda’s CDRC is currently 68 percent of the CRC (implying an asset loss of 32 percent) that indicates a decline in road maintenance of paved road network in Uganda.
Buffie & Balma (2019) find that investment in road maintenance in Uganda is only 10 percent of its optimal level and that this slices 5.9 years of the service life of the infrastructure. They further report that allocating one percent of GDP to maintenance instead of new investment in infrastructure would increase GDP, aggregate consumption, and real wages of the poor in Uganda by another 1 percent and deliver more efficiency gains by decreasing the depreciation rate from 7.09 percent to 5.6 percent.
3.3.7 Operational Efficiency Operational efficiency is the capability of the road agencies to deliver roads infrastructure in the most cost-effective manner possible while still ensuring high quality. The operational efficiency of roads sector agencies was affected by uncertainty of funding allocations in medium term and on annual basis. During the period under review, there has been considerable variance in MTEF and approved annual budget figures. With exception of the initial year of NDP II (FY 2015/16), the approved budget for roads was lower than the MTEF projections. In addition, the releases were less than the approved budget, and spending was less than the releases (see, Figure 12). This implies a bad combination of poor planning, budgeting, and execution. The lower spending discipline in the sector jeopardizes justification for additional funding to the sector.
Figure 12: Trends in Roads sub-sector allocations and spending
Source: Authors’ calculations based on BFP and Approved Budget Estimates and budget performance reports
This trend and data are in line with the findings of a recent study that indicated that the national budget dictates what planning should do, instead of the other way around (see,

30 | Public Expenditure Governance in the Roads Sector
Ggoobi, 2019). MDAs have no guarantee that they will get the money projected in the MTEF and the approved annual budget. Increased resources to the sector have been accompanied by considerable volatility in the annual approved and revised budgets. Since 2015/16, year-to-year budgets have seen large fluctuations that tend to undermine effective planning, project selection, and implementation. Apparently budgeting leads planning which is odd.
There are notable gaps between MTEF projections, approved annual budgets, budget releases and spending. In FY 2015/16, approved budget exceeded MTEF by 22 percent while in the rest of the years, it was below MTEF by 5 percent in 2016/17, 14 percent in 2017/18, and by 13 percent in 2018/19. Significant discrepancies existed between the approved budgets and releases; and releases and spending. During the four FYs (2015/16 - 2018/19), releases were less than the approved budget by an average of 19 percent. On the other hand, the expenditure was less than the releases by an average of 29 percent (see, Figure 13). It is likely that absence of multi-year planning and budgeting, combined with insufficient institutional capacity, has led to perennial unspent balances in the roads sector. The lumpy multi-year nature of road contracts does not allow large sums of money to be absorbed without advance planning.
Figure 13: Difference between MTEF, Approved Budgets and Spending in the Roads sector
Source: Authors’ calculations based on BFP and Approved Budget Estimates and budget performance reports
The implications here are that either the MTEF targets were set arbitrarily too high, may be for political reasons, or the budgets were approved and disbursed without taking into consideration the internal capacities of the MDAs to spend/absorb the funds. However, stakeholders also attribute the poor budget performance to untimely release of funds by MoFPED, although evidence from top officials at the MoFPED indicates budget releases have in the recent past improved. A schedule of quarterly releases at MoFPED shows that by the 10th of the month at the beginning of each quarter, MDAs get funds. Officials
Public Expenditure Governance in the Roads Sector | 31
at Finance, however, admit that this is a recent improvement. Stakeholders in the Roads Sector were of the view that going forward, released fund absorption should guide allocations in any subsequent budgets. That is, MDAs that spend more effectively and efficiently should receive more funds instead of ring-fencing the money under poorly performing MDAs.
Operational efficiency in the roads sector is further jeopardized by poor planning, and execution of road projects (see, Box 1). For instance, money allocated for monitoring under the roads sub-sector seems apparently did not take into account the location and size of the project. Available information shows that the Sector spends the same amount of funds to monitor a road in Kabale (South Western Uganda), and Kyaliwajjala (Wakiso District). For example, during the FY 2019/20, the allocation for monitoring was mostly UGX 100 million per road which was far below the required amount. For example, Hoima-Wanseko Road (83Km), UGX 3.07 billion was approved. What informed these allocations is not clear. Secondly, among the items under Monitoring and Capacity Building Support, travel abroad to benchmark roads such as Seeta-Kyaliwajjala-Matugga-Wakiso-Buloba-Nsangi was allocated UGX 154 million in FY 2019/20; the same amount was allocated for the Najjanankumbi-Busabala Road and Nambole-Namilyango-Seeta road benchmark visits.
Other studies have found similar levels of inefficiency in other Sectors (World Bank 2019; OPM, 2007). Most road projects do not comply with multi-year commitments as required under MTEF. Budgets are scattered and there is evidence of under provisioning for multi-year projects leading to delays. A project that requires UGX 100 billion for land compensation, for example, is allocated UGX 1 billion, implying it would take 100 years to pay off the claimants.
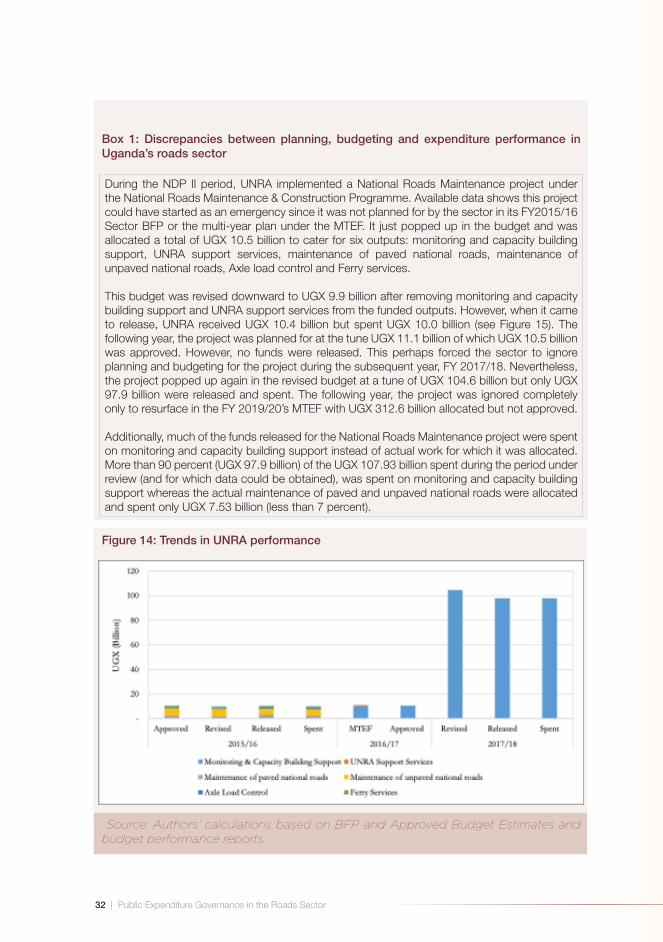
32 | Public Expenditure Governance in the Roads Sector
Box 1: Discrepancies between planning, budgeting and expenditure performance in Uganda’s roads sector
During the NDP II period, UNRA implemented a National Roads Maintenance project under the National Roads Maintenance & Construction Programme. Available data shows this project could have started as an emergency since it was not planned for by the sector in its FY2015/16 Sector BFP or the multi-year plan under the MTEF. It just popped up in the budget and was allocated a total of UGX 10.5 billion to cater for six outputs: monitoring and capacity building support, UNRA support services, maintenance of paved national roads, maintenance of unpaved national roads, Axle load control and Ferry services. This budget was revised downward to UGX 9.9 billion after removing monitoring and capacity building support and UNRA support services from the funded outputs. However, when it came to release, UNRA received UGX 10.4 billion but spent UGX 10.0 billion (see Figure 15). The following year, the project was planned for at the tune UGX 11.1 billion of which UGX 10.5 billion was approved. However, no funds were released. This perhaps forced the sector to ignore planning and budgeting for the project during the subsequent year, FY 2017/18. Nevertheless, the project popped up again in the revised budget at a tune of UGX 104.6 billion but only UGX 97.9 billion were released and spent. The following year, the project was ignored completely only to resurface in the FY 2019/20’s MTEF with UGX 312.6 billion allocated but not approved.
Additionally, much of the funds released for the National Roads Maintenance project were spent on monitoring and capacity building support instead of actual work for which it was allocated. More than 90 percent (UGX 97.9 billion) of the UGX 107.93 billion spent during the period under review (and for which data could be obtained), was spent on monitoring and capacity building support whereas the actual maintenance of paved and unpaved national roads were allocated and spent only UGX 7.53 billion (less than 7 percent).
Figure 14: Trends in UNRA performance
Source: Authors’ calculations based on BFP and Approved Budget Estimates and budget performance reports
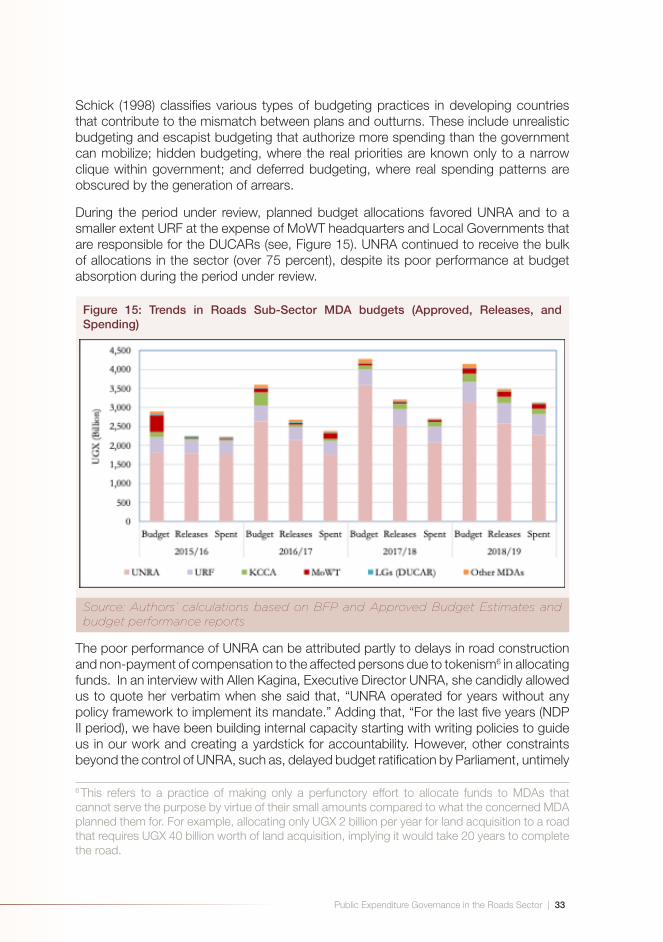
Public Expenditure Governance in the Roads Sector | 33
Schick (1998) classifies various types of budgeting practices in developing countries that contribute to the mismatch between plans and outturns. These include unrealistic budgeting and escapist budgeting that authorize more spending than the government can mobilize; hidden budgeting, where the real priorities are known only to a narrow clique within government; and deferred budgeting, where real spending patterns are obscured by the generation of arrears.
During the period under review, planned budget allocations favored UNRA and to a smaller extent URF at the expense of MoWT headquarters and Local Governments that are responsible for the DUCARs (see, Figure 15). UNRA continued to receive the bulk of allocations in the sector (over 75 percent), despite its poor performance at budget absorption during the period under review.
Figure 15: Trends in Roads Sub-Sector MDA budgets (Approved, Releases, and Spending)
Source: Authors’ calculations based on BFP and Approved Budget Estimates and budget performance reports
The poor performance of UNRA can be attributed partly to delays in road construction and non-payment of compensation to the affected persons due to tokenism6 in allocating funds. In an interview with Allen Kagina, Executive Director UNRA, she candidly allowed us to quote her verbatim when she said that, “UNRA operated for years without any policy framework to implement its mandate.” Adding that, “For the last five years (NDP II period), we have been building internal capacity starting with writing policies to guide us in our work and creating a yardstick for accountability. However, other constraints beyond the control of UNRA, such as, delayed budget ratification by Parliament, untimely
6 This refers to a practice of making only a perfunctory effort to allocate funds to MDAs that cannot serve the purpose by virtue of their small amounts compared to what the concerned MDA planned them for. For example, allocating only UGX 2 billion per year for land acquisition to a road that requires UGX 40 billion worth of land acquisition, implying it would take 20 years to complete the road.
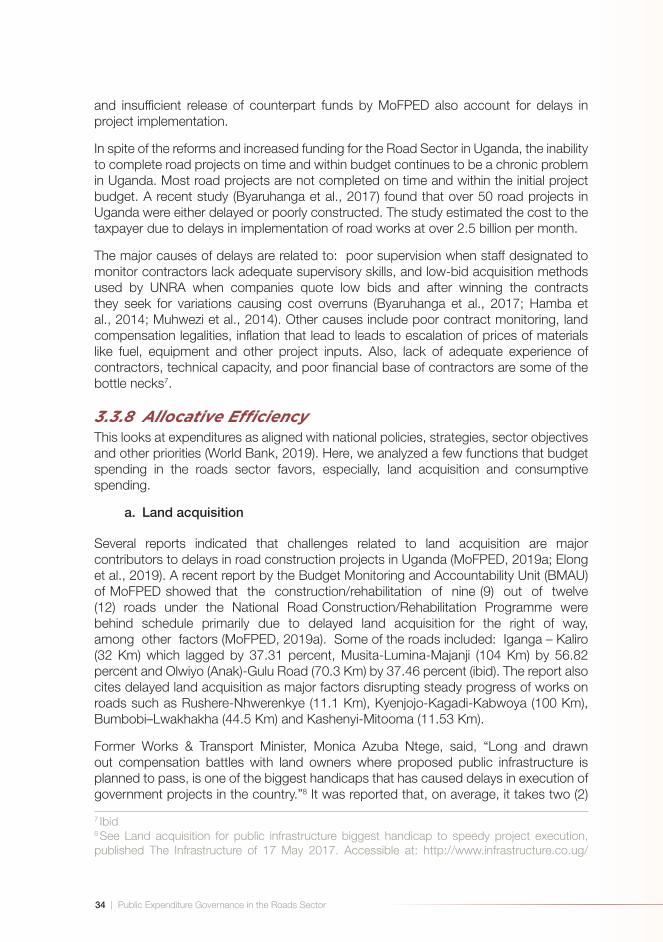
34 | Public Expenditure Governance in the Roads Sector
and insufficient release of counterpart funds by MoFPED also account for delays in project implementation.
In spite of the reforms and increased funding for the Road Sector in Uganda, the inability to complete road projects on time and within budget continues to be a chronic problem in Uganda. Most road projects are not completed on time and within the initial project budget. A recent study (Byaruhanga et al., 2017) found that over 50 road projects in Uganda were either delayed or poorly constructed. The study estimated the cost to the taxpayer due to delays in implementation of road works at over 2.5 billion per month.
The major causes of delays are related to: poor supervision when staff designated to monitor contractors lack adequate supervisory skills, and low-bid acquisition methods used by UNRA when companies quote low bids and after winning the contracts they seek for variations causing cost overruns (Byaruhanga et al., 2017; Hamba et al., 2014; Muhwezi et al., 2014). Other causes include poor contract monitoring, land compensation legalities, inflation that lead to leads to escalation of prices of materials like fuel, equipment and other project inputs. Also, lack of adequate experience of contractors, technical capacity, and poor financial base of contractors are some of the bottle necks7.
3.3.8 Allocative Efficiency This looks at expenditures as aligned with national policies, strategies, sector objectives and other priorities (World Bank, 2019). Here, we analyzed a few functions that budget spending in the roads sector favors, especially, land acquisition and consumptive spending.
a. Land acquisition
Several reports indicated that challenges related to land acquisition are major contributors to delays in road construction projects in Uganda (MoFPED, 2019a; Elong et al., 2019). A recent report by the Budget Monitoring and Accountability Unit (BMAU) of MoFPED showed that the construction/rehabilitation of nine (9) out of twelve (12) roads under the National Road Construction/Rehabilitation Programme were behind schedule primarily due to delayed land acquisition for the right of way, among other factors (MoFPED, 2019a). Some of the roads included: Iganga – Kaliro (32 Km) which lagged by 37.31 percent, Musita-Lumina-Majanji (104 Km) by 56.82 percent and Olwiyo (Anak)-Gulu Road (70.3 Km) by 37.46 percent (ibid). The report also cites delayed land acquisition as major factors disrupting steady progress of works on roads such as Rushere-Nhwerenkye (11.1 Km), Kyenjojo-Kagadi-Kabwoya (100 Km), Bumbobi–Lwakhakha (44.5 Km) and Kashenyi-Mitooma (11.53 Km).
Former Works & Transport Minister, Monica Azuba Ntege, said, “Long and drawn out compensation battles with land owners where proposed public infrastructure is planned to pass, is one of the biggest handicaps that has caused delays in execution of government projects in the country.”8 It was reported that, on average, it takes two (2)
7 Ibid8 See Land acquisition for public infrastructure biggest handicap to speedy project execution, published The Infrastructure of 17 May 2017. Accessible at: http://www.infrastructure.co.ug/
Public Expenditure Governance in the Roads Sector | 35
years for land compensation disputes to be resolved, a process that has been wrought with corruption, ballooned compensation claims, and stubborn land owners conniving with lawyers to delay works in a bid to attract hefty compensation (ibid). Elong et al. (2019) identified eighteen (18) land acquisition processes and three most significant challenges: delayed compensation awards; injurious affections and other damages; and access difficulties for some families.
Acquisition of land by GoU is planned and budgeted for under Output 045171 of the budget. The available data shows that although some landowners may be acting stubbornly and in cartel with a corrupt system, poor planning and budgeting have exacerbated the problem. At planning level, there seems to be no scientific method used to allocate funds for land acquisition. Different roads with different dimensions and location (in diverse parts of the country) were allocated the same (equal) budget for land acquisition. For example, regardless of length and location, each of the following roads was allocated UGX 5 billion for land acquisition in FY 2015/16: Gulu - Atiak - Bibia/Nimule (104 Km), Vurra - Arua - Koboko-Oraba (92 Km), Kapchorwa-Suam road (77 Km), Mukono-Katosi-Nyenga (72 Km), Nyendo - Sembabule (48 Km) and Ishaka-Kagamba (35 Km) (see, Figure 16).
Figure 16: Trends in spending on land acquisition of land by GoU for select road projects
Source: Authors’ calculations based on Approved Budget Estimates
Corruption and poor planning are not problems of the Roads Sector alone; they affect every single Sector. According UNRA leadership, land acquisition challenges begin with poor and uncoordinated planning. Each MDA plans independent of the other, leading to budget fragmentation. However, in the recent years, there have been improvements in budgeting in consolidation of land acquisition funds, although planning is still disjointed. For example, in FY 2018/19, UNRA asked for UGX 500 billion for land acquisition, but the authorities (MoFPED, Cabinet and Parliament) approved only UGX 200 billion. To avoid extended delays, land is expropriated before compensation.
land-acquisition-public-infrastructure-biggest-handicap-speedy-project-execution

36 | Public Expenditure Governance in the Roads Sector
b. Consumptive spending
An economic decomposition of public spending on roads in Uganda shows that although development expenditures dominate both budgeting and spending (see, Figure 17), consumptive expenses are hidden under the development budget.
Figure17: Trends in Roads Sub-sector Development versus Recurrent (Share)
Source: Authors’ calculations based on BFP and Approved Budget Estimates and budget performance reports
As the World Bank (2019) notes, “In Uganda, ‘development expenditure’ is not synonymous with ‘capital expenditure’.” There is misclassification of the ‘development budget’ whereby many items reported as development expenditures served to fund recurrent activities. Although Figure 18 shows that ‘development expenditure’ during the period under review was over 80 percent of the total roads’ budgets, it is noted that this was not just for capital expenditure (on acquiring or maintaining fixed assets) as is usually assumed. The so-called development budget is often heavily oriented towards non-wage recurrent expenditures such as buying and maintaining vehicles, paying allowances, travel, rather than capital spending. Data shows that capital purchases in the Roads Sector during the NDP II constituted less than two-thirds of the total roads budget (see, Table 5).
Table 5: Trends in Road Sector Capital Purchases (excluding AIA)
2015/16 2016/17 2017/18 2018/19 Average
Roads and Bridges 1,594.68 2,272.18 2,798.11 2,812.40
Share of Roads 64% 65% 66% 68% 66%
Source: Authors’ calculations based on BFP and Approved Budget Estimates and budget performance reports
Public Expenditure Governance in the Roads Sector | 37
Data challenges notwithstanding, we observe that duplications in budgeting are common. Funds are hidden in consultancy work for MDAs whose mandate is not road infrastructure development. There are also expenditures that may raise doubts in their accuracy such as acquisition of land for a ferry. Who owns land on the shores of the lake where ferry piers are constructed or on riverbank/wetland where bridges are constructed? Why does GoU have to buy land for every single project, including simple bridges? Why does GoU have to acquire land for a project that is supposed to reconstruct (not widen and reconstruct) an existing road e.g. Mbarara-Katuna road? A deeper study is perhaps needed to establish the specific factors that point to these questionable acquisitions and see how some of them could be avoided to save resources for other sector needs.
3.3.9 Spatial EfficiencyIn Uganda, attainment of balanced and equitable development is a constitutional obligation. The Government is obliged to take necessary measures to bring about balanced development of the different areas of the country. Although the NDP II recognized that there were regional disparities with the Eastern and Northern regions, in particular, with East-Central (Busoga), Mid-North (Acholi), North-East (Karamoja), and West Nile lagging behind other regions, it did not provide precise spatial targets for roads spending. Nevertheless, it recognized that lack of spatial focus in national planning compounded the problem of regional disparities. One of the reasons for regional disparities was access to good infrastructure, particularly, roads.
Access to the road network, particularly, in rural areas, varies significantly across sub-regions of Uganda because of the geographically skewed distribution of paved roads and differences in population and road density. Budget allocations on road construction appeared to favor the Western and Central regions, considering the distribution the road projects (both on-going and planned). A sample of 43 national road projects implemented by UNRA during the NDP II period showed that in broad terms, there was overinvestment in the regions where road conditions were relatively good, i.e. the Central and Western regions, leaving roads in the Northern and Eastern regions in worse condition and with inadequate investment.
The Central and Western regions accounted for about 70 percent of the road network that either had already been constructed or was under construction by UNRA during the NDP II period. By contrast, the Eastern and Northern regions had only 30 percent of the road network implemented (see, Figure 18).

38 | Public Expenditure Governance in the Roads Sector
Figure 18: Regional Distribution of Road Network Constructed during NDP II
Source: Author’s calculations based on Approved Budget Estimates
Apart from low maintenance and operation funding, there were also concern that spatial allocation and type of capital works funded could be inappropriate, especially, if expenditure requirements were based on guesswork regarding traffic and road conditions. Conducting a comprehensive survey of the paved road network, developing mechanisms for regular updates of the roads database and making these data publicly available alongside budget data were perhaps the best guarantees of improving value for money in the Roads Sector.
Studies have shown that rural road network, although less critical from an economic standpoint, is important for social equity and rural development. In Uganda’s case, a move toward sustained, universal access, especially, in remote areas remain as a challenge that requires much effort. Most of the road projects constructed during the period under review, were approved based more on financial Net Present Values (NPVs) and less on economic NPVs. Relatedly, MoFPED (2019c) finds that, over the NDP II period, although the Works and Transport Sector budgeting had been averagely compliant with the gender and equity requirements, designs of transport projects in Uganda had not sufficiently considered the travel needs of vulnerable groups. MoFPED (2019c) recommends involvement of all key stakeholders including user groups and affected communities in planning, designing, constructing, operating and maintaining transport infrastructure and services. Gender analysis needed to be undertaken to inform the design of transport investments.
While responding to these findings, officials from the Road Sector said that the issue of spatial efficiency and inclusive infrastructure development had been catered for under

Public Expenditure Governance in the Roads Sector | 39
NDP III. However, perusal through the NDP III showed that, apart from a few planned interventions under Programme 15 of the plan (Regional Development) that were mainly focused on developing “community access and motorable feeder roads,” there were no explicit interventions in the plan to ensure fair and equitable distribution of road works in the country. In particular, there were no interventions to provide affirmative action to regions that were lagging behind in road infrastructure.

40 | Public Expenditure Governance in the Roads Sector
4.0 CONCLUSIONS AND RECOMMENDATIONS
This study examined public expenditure governance in Uganda’s Road Sector and its implications for performance of the sector. The study used a framework that entails governance, inputs, processes and outcomes. It examined Roads Sector expenditure for the period FY 2015/16-2018/19, the related investments, and the effectiveness &efficiency of the expenditure. This section draws conclusions from the study findings and makes recommendations.
4.1 Conclusions The findings show that while the Road Sector in Uganda faces serious funding challenges, the situation is compounded by low rates of return on investment. This situation is underpinned by high costs of construction coupled with poor project selection, preparation and management characterized by construction delays, cost overruns and sub-standard works. The findings accentuate the governance challenges that beset the Sector including,
– Inadequate governance inputs namely poor planning and poor coordination among road sector agencies.
– Weak public expenditure processes characterized by low levels of accountability engendered by absence of standard road classification specifications, unit cost for construction and inadequate information on road network condition and length. Furthermore, the anti-corruption efforts have not been effective as the country continues to lose money in bogus road contracts. The sector also continues to be shrouded in opacity. Information on road contracts remains highly guarded.
– On public expenditure outcomes, the findings show that the allocation of resources in the sector is ineffective and inefficient. Less than optimal resources are allocated to road maintenance and land acquisition all of which impact on the longevity of the roads and pace of construction respectively. The study also highlighted significant unspent balances and accentuated the problem of poor forecasting of funding in the sector. The study also unearthed misclassification of consumption expenditure as development expenditure. Finally, the study unmasked the spatial bias in regional distribution of major road projects with a concentration in the Western and Central parts of the country compared to the Eastern and Northern regions.
4.2 Recommendations In line with the findings, the following recommendations are made aiming to guide an informed debate in the Roads Sector with policy makers and implementers to improve Uganda’s Public Expenditure Governance of the sector.

Public Expenditure Governance in the Roads Sector | 41
a. MoFPED needs to re-think the way funds are allocated: To ensure the highest economic return on investment, as well as, time and cost overruns in road projects, there is need to rethink the way funds are allocated. Budgets for road construction during the NDP III period should be approved and disbursed taking into consideration the internal capacities of the MDAs expected to spend/absorb the funds.
b. UNRA and other Agencies should ensure proper sequencing of road projects: Develop a robust standard that sequences road projects under UNRA upon exit of an old project and the criterion should be adhered to. New projects should be considered only when the on-going projects have either been completed or there are clear resource, technical commitments, and timelines to complete them.
c. UNRA and other Agencies should align the budget to the plans: Order to improve economic or allocative efficiency of public expenditure in roads, there is need to adhere to agreed priorities as defined in the Sector Development Plans.
d. MoFPED and MoWT should increase allocations for Local Governments: Prioritisation of national road construction should not be interpreted as a trade-off of other important roads, particularly the DUCARs. Optimisation of the roads budget is needed to increase allocations for Local Governments given that Uganda’s productive economy is largely rural-based and nearly 80 percent of the population is rural.
e. MoFPED should operationalise the second generation (2G) road fund: Government should ensure that the RF gets funds from road user charges including fuel levy, license and other road related charges as listed under Section 21 of the URF Act, to enable the country to generate sufficient funds for road maintenance. Thus, all revenues from the petroleum duties and infrastructure levy should be allocated to the URF. In addition, URF should develop a comprehensive multiyear road rehabilitation and maintenance plan to guide resource allocation in line with best practice.
f. MoWT need to provide technical guidance to MDAs outside the works and Transport Sector: Road project manuals on project preparation should be written and compiled to highlight profiles, feasibility studies, design studies and project implementation plans that define supervision and accountability arrangements.
g. MoWT, KCCA and Municipalities should implement the Greater Kampala Metropolitan Area (GKMA) Development Strategy (2018): The road network in the GKMA is poor and deteriorating leading to poor connectivity, yet it hosts two thirds of Uganda’s GDP. There is need for increasing the budget for roads to improve connectivity and overall urban infrastructure.
h. Road Sector agencies should consider holistic road infrastructure development: Road designs should integrate components such as market places for local produce, schools, health facilities, street lights among others.
i. Consolidated Sector budgeting: UNRA should ensure that budgets for land acquisition and monitoring and capacity building are consolidated to avoid

42 | Public Expenditure Governance in the Roads Sector
budget tokenism and possible abuse.
j. MoWT and UNRA needs to seriously consider spatial efficiency: The geographic distribution of roads to be constructed or maintained should be sensitive to regional needs and equity. NDP III roads plan should prioritise roads in Northern and Eastern regions to stimulate economic activity in the regions, and also to achieve social equity, rural development, and universal access to good infrastructure.
k. MoFPED should allocate and provide the required counter-part funding: The GoU counterpart funding for the externally financed projects should be prioritized to ensure that the loans are effectively disbursed as planned without delays.
l. MoWT should strengthen the local road construction industry: MoWT should implement the affirmative action plan to facilitate the emergence of a strong locally based road construction industry in the face of what is perceived as overwhelming financial power and political influence of the few internationally connected firms.

Public Expenditure Governance in the Roads Sector | 43
REFERENCES
African Development Bank. (2018). African Economic Outlook, African Development Bank Group. Access mode: www.afdb. org/fileadmin/uploads/afdb/Documents/Publications/African_Economic_Outlook_2018_-_EN.Pdf
Best, E. (2008). The Assessment of Regional Governance: Principles, Indicators and Potential Pitfalls. United Nations University, CRIS.
Bogere, G., Kayabwe, S., Kabasweka, F., G., and Achola, I. (2014). Assessing Public Expenditure Governance in Uganda’s Road Sector: Application of an Innovative Framework and Findings from the Sector, Kampala, ACODE Policy Research Series, No. 66.
Buffie, E. F. & L. Balma. (2019). Leveraging Oil for Public Investment and Inclusive Growth in Uganda.
Byaruhanga, A., Benon, C., & Basheka. (2017). “Contractor Monitoring and Performance of Road Infrastructure Projects in Uganda: A Management Model”. Journal of Building Construction and Planning Research, 5, 30-44.
Calderón, C. and L. Servén. (2004). The effects of infrastructure development on growth and income distribution, World Bank Policy Research Working Paper 3400.
Calderón, C., E. Moral-Benito and L. Servén. (2014). “Is infrastructure capital productive? A panel heterogeneous approach.” Journal of Applied Econometrics.
Collier, P., Kirchberger, M., & Söderbom, M. (2015). The Cost of Road Infrastructure in Low- and Middle-Income Countries. Policy Research working paper; no. WPS 7408. Washington, D.C.: World Bank Group.
Elong, S., Muhwezi, L., and Acai, J., (2019). “Assessment of the Challenges and Effects of Delays in Compulsory Land Acquisition on the Performance of Road Construction Projects in Uganda”. International Journal of Scientific and Engineering Research.
GAN. (2019). Uganda Corruption Report. Accessed at: https://www.ganintegrity.com/portal/country-profiles/uganda/
Graham, J., Amos, B., & Plumptre, T., (2003). Principles for good governance in the 21st century. Ottawa: Institute on Governance.
Ggoobi, R., (2019). From Paper to Practice: Implementation of Uganda’s Industrialization Agenda, Kampala, Friedrich-Ebert-Stiftung. Available at: http://library.fes.de/pdf-files/bueros/uganda/15865-20191212.pdf
Hamba, I., (2014). Time overruns for road infrastructure projects in Uganda. Unpublished Dissertation at Makerere University.
Kuluudhi, Z., R., (2015). Provision of Road Furniture in Uganda and its Effect on Road

44 | Public Expenditure Governance in the Roads Sector
Safety
Kuluudhi, Z., R., (2015). Provision of Road Furniture in Uganda and its Effect on Road Safety.
Ministry of Finance, Planning and Economic Development. (2019a). How are Land Related Challenges Affecting Service Delivery in Uganda? BMAU Briefing Paper 27/19, Kampala, Budget Monitoring and Accountability Unit (BMAU), Ministry of Finance, Planning and Economic Development.
Ministry of Finance, Planning and Economic Development. (2019b). Roads Sub-Sector Annual Budget Monitoring Report for Financial Year 2018/19, Kampala, Budget Monitoring and Accountability Unit, Ministry of Finance, Planning and Economic Development.
Ministry of Finance, Planning and Economic Development. (2019c). Gender Responsiveness in the Transport Sector. BMAU Briefing Paper (23/19), Kampala, Budget Monitoring and Accountability Unit (BMAU). Ministry of Finance, Planning and Economic Development.
Ministry of Public Service. (2017). A Final Report on Comprehensive Review and Restructuring of Government Ministries, Departments and Agencies (MDAs), Kampala, Ministry of Public Service.
Ministry of Finance, Planning and Economic Development. (2019d). The road maintenance backlog: A cause for concern. BMAU Briefing Paper (11/19), Kampala, Budget Monitoring and Accountability Unit (BMAU), Ministry of Finance, Planning and Economic Development.
Ministry of Works and Transport. (2017). Works and Transport Sector Development Plan (WTSDP) 2015/16 – 2019/20, Kampala, Ministry of Works and Transport.
Ministry of Works and Transport. (2018). Annual Sector Performance Report for FY 2017/18, Kampala, Ministry of Works and Transport.
Ministry of Works and Transport. (2018). Annual Sector Performance Report FY 2017/18. Kampala, Ministry of Works and Transport.
Ministry of Works and Transport. (2019), 15th Joint Transport Sector Review Report, Kampala, Ministry of Works and Transport.
Ministry of Works and Transport. (2019). 15th Joint Transport Sector Review Report, Kampala, Ministry of Works and Transport.
Muhwezi, L., & Acai, J., & Otim, G. (2014). “An Assessment of the Factors Causing Delays on Building Construction Projects in Uganda”. International Journal of Construction Engineering and Management, 2014, 3(1): 13-23 DOI: 10.5923/j.ijcem.20140301.02
Ng C. P, Law, T. H., F, Jakarni, M., and Kulanthayan S. (2019). Road infrastructure development and economic growth. IOP Conference Series: Materials Science and Engineering
National Planning Authority. (2020). Third National Development Plan (NDPIII) 2020/21 – 2024/25, Kampala, National Planning Authority.
Public Expenditure Governance in the Roads Sector | 45
Office of the Auditor General. (2018). A Value for Money Audit Report on Budget Performance in the Works and Transport Sector: A Report by the Auditor General, Kampala, Office of Auditor General.
Office of the Auditor General. (2015). Regulation of the Construction Sector by Ministry of Works and Transport, Kampala, Office of the Auditor General.
Overseas Development Institute. (2015). Reforming the roads sector in Uganda: a six-year retrospective, London, Overseas Development Institute.
OECD. (2013). Poland: Implementing Strategic-State Capability, OECD Public Governance Reviews: OECD.
OPM (2007). Uganda: Agricultural Sector Public Expenditure Review, Phases 1 and 2. Final Report. July. Oxford, UK.
National Planning Authority. (2015). National Development Plan 2015/15 -2019/20, Kampala, National Planning Authority.
Government of Uganda (2016). Review Report on Uganda’s Readiness for Implementation of the 2030 Agenda: Ensuring that no One is Left Behind.
Schick, A. (1998). A Contemporary Approach to Public Expenditure Management. Washington DC: World Bank.
National Planning Authority. (2010). Uganda Vision 2040, Kampala, National Planning Authority.
National Planning Authority. (2015). Second National Development Plan (NDPII) 2015/16 – 2019/20, Kampala, National Planning Authority.
Uganda Bureau of Statistics. (2017). Uganda National Household Survey, Kampala, Uganda Bureau of Statistics.
UN (2018). Road Safety Performance Review Uganda
Uganda National Roads Authority. (2018). Annual Performance Report 2017/18, Kampala, Uganda National Roads Authority.
Uganda Roads Fund. (2019). The 2019 Road User Satisfaction Survey, Kampala, Uganda Roads Fund.
World Bank. (1995). The World Bank Participation Sourcebook
World Bank. (1996). Evaluating Public Spending: A Framework for Public Expenditure Reviews, Washington, DC, The World Bank Group.
World Bank. (2010). Uganda: Public Expenditure Review. Strengthening the Impact of the Roads Budget. Report No. 55672-UG, Washington, DC: The World Bank Group.
World Bank. (2015). Highways to Success or Byways to Waste: Estimating the Economic Benefits of Roads in Africa. Africa Development Forum series, Washington, DC: The World Bank Group.
World Bank. (2016). From smart budgets to smart returns: Unleashing the power of public investment management. Uganda Economic Update, Seventh Edition, April 2016, Washington, DC: The World Bank Bank.

46 | Public Expenditure Governance in the Roads Sector
World Economic Forum. (2016). The Global Enabling Trade Report 2016, Accessed at: http://reports.weforum.org/global-enabling-trade-report-2016/enabling-trade-rankings/#series=ETI.C.04.04

Public Expenditure Governance in the Roads Sector | 47
ANNEX: Status of Implementation of NDPII Core Roads Projects
Project Status
Under Implementation and on Schedule
1. Rwekunye-Apac-Lira-Kitgum-Musingo Road Upgrade completed
2. Kisoro-Rubuguli-Muko Upgrade completed
3. Kabale-Bunyonyi Upgrade completed
4. Upgrading of Kapchorwa – Suam road Construction is ongoing
5. Entebbe Expressway Construction is ongoing (95.6 % cumulative physical progress)
6. Hoima-Butiaba-Wanseko Construction is ongoing
7. Nakapiripiriti-Muyembe Construction is ongoing
8. Olwiyo-Gulu- Kitgum – Musingo road Construction is ongoing. Lot one is almost complete
9. Road Construction Equipment Completed and launched
Feasibility Completed, Ready for Implementation
1. Kampala – Jinja Expressway Feasibility finalized (procurement of contractor ongoing)
2. Kibuye – Busega Express Highway Feasibility finalized (Sourcing of financing ongoing
3. Kampala-Mpigi Expressway Feasibility study and designs to be carried out
4. Kampala Southern bypass Feasibility finalized (procurement of contractor ongoing)
5. Busega – Mpigi expressway Feasibility finalized and under procurement
6. Rwenkunye – Apac – Lira-Kitgum-Musingo Feasibility finalized. Under procurement.
7. Kampala - Bombo Express highway. Feasibility Study, Detailed designs prepared.
8. Hamurwa - Kerere -Kanungu/ Buleme - Buhoma - Butogota - Hamayanja - Ifasha - Ikumba
Feasibility study and designs to be carried out
9. Karugutu-Ntoroko Feasibility finalized and under procurement
10. Rwenkunye-Apac-Lira- Acholibur Feasibility finalized and under procurement
11. Kabwoya - Buhuka Feasibility finalized and under procurement
12. Ishasha-Katunguru Feasibility finalized Procurement completed

48 | Public Expenditure Governance in the Roads Sector
Project Status
Not Yet Started
13. Apoka Lodge-Kotido
Source: Author’s based on Sector and Budget Performance Reports


ABOUT THE AUTHORS
Ramathan Ggoobi is an Economist and Policy Analyst. He is a Lecturer of Economics at Makerere University Business School (MUBS), where he heads the MUBS Economic Forum. He is also the Chief Economist for Operation Wealth Creation in Uganda. He has extensive knowledge and experience in both quantitative and qualitative research, with special interest in rural economy, economic development, policy analysis and political economy. Ramathan is also a Member of the Board of Directors at Uganda Development Corporation (UDC). He holds an M.A in Economic Policy and Planning, and a B.A. in Economics from Makerere University. He also holds an International Certificate in Sustainable Development (With Distinction), Columbia University U.S.A, 2015, and a Certificate in Energy Economics, Total France.
Daniel Lukwago is an Economist, Policy Analyst and Independent Consultant. He is a Director of Nonner Consults, a development consultancy company based in Kampala Uganda. He has more than 15 years working experience in various areas such as policy analysis, public expenditure reviews, poverty assessments, community development and policy advocacy. He previously worked with the World Bank Group in Washington D.C, USA and Kampala, Uganda Office; Advocates Coalition for Development Environment (ACODE); and Uganda Debt Network (UDN). Daniel holds a Masters of Public Administration Degree (MPA) from Columbia University, USA; a Postgraduate Diploma in Monitoring and Evaluation from Uganda Management Institute, Kampala Uganda; and a Bachelor of Science in Quantitative Economics Degree from Makerere University, Kampala.
George Bogere is a Research Fellow and Manager of the Center for Budget and Economic Governance (CBEG) at ACODE. He holds an MA Economics Degree from Makerere University. His areas of interest include economic growth and development, poverty, decentralization, governance and service delivery as well as natural resources management particularly land. George has over ten years’ experience in public policy research. Before joining ACODE in 2011, George was a Researcher at Makerere Institute of Social Research (MISR) - Makerere University. His work at MISR focused mainly on property rights, gender and land management. He has undertaken several consultancies in the area of involuntary resettlement related to public infrastructure project.
9 789970 5650099 789970 5650169 789970 5650239 789970 5650309 789970 5650479 789970 967407
à È 9
9 789970 5660069 789970 5660139 789970 5660209 789970 5660379 789970 5660449 789970 5660519 789970 5660689 789970 5660759 789970 5660829 789970 5660999 789970 5661059 789970 5661129 789970 5661299 789970 5661369 789970 5661439 789970 5661509 789970 5661679 789970 5661749 789970 5661819 789970 5661989 789970 5662049 789970 5662119 789970 5662289 789970 5662359 789970 5662429 789970 5662599 789970 5662669 789970 5662739 789970 5662809 789970 5662979 789970 5663039 789970 5663109 789970 5663279 789970 5663349 789970 5663419 789970 5663589 789970 5663659 789970 5663729 789970 5663899 789970 5664029 789970 5663969 789970 5664199 789970 5664269 789970 5664339 789970 5664409 789970 5664579 789970 5664649 789970 5664719 789970 5664889 789970 5664959 789970 5670039 789970 5670109 789970 5670279 789970 5670349 789970 5670419 789970 5670589 789970 5670659 789970 5670729 789970 5670899 789970 5670969 789970 5671029 789970 5671199 789970 5671269 789970 5671339 789970 5671409 789970 5671579 789970 5671649 789970 5671719 789970 5671889 789970 5671959 789970 5672019 789970 5672189 789970 5672259 789970 5672329 789970 5672499 789970 567256
ISBN: 978-9970-56-725-6Advocates Coalition for Development and Environment
Plot 96, Kanjokya Street, Kamwokya.
P. O. Box 29836, Kampala. Tel: +256 312 812150
Email: [email protected]; [email protected].
Website: www.acode-u.org


