28
Management Presentation PT Chandra Asri Petrochemical Tbk [TPIA.JK] Jakarta, September 2016

Management Presentation
PT Chandra Asri Petrochemical Tbk [TPIA.JK] Jakarta, September 2016

1. Company Profile
2. Operational & Financial Performance
3. Project Updates
4. Industry Outlook
2
1. Company Profile 2. Operational & Financial Performance 4. Industry Outlook
3. Project Updates
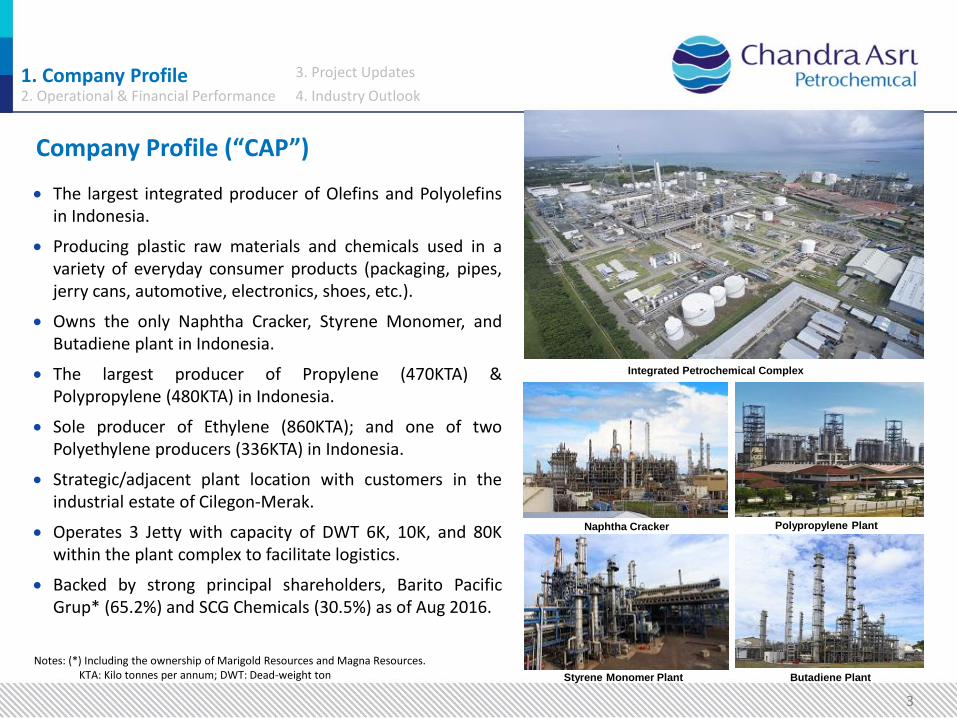
Company Profile (“CAP”)
The largest integrated producer of Olefins and Polyolefins in Indonesia.
Producing plastic raw materials and chemicals used in a variety of everyday consumer products (packaging, pipes, jerry cans, automotive, electronics, shoes, etc.).
Owns the only Naphtha Cracker, Styrene Monomer, and Butadiene plant in Indonesia.
The largest producer of Propylene (470KTA) & Polypropylene (480KTA) in Indonesia.
Sole producer of Ethylene (860KTA); and one of two Polyethylene producers (336KTA) in Indonesia.
Strategic/adjacent plant location with customers in the industrial estate of Cilegon-Merak.
Operates 3 Jetty with capacity of DWT 6K, 10K, and 80K within the plant complex to facilitate logistics.
Backed by strong principal shareholders, Barito Pacific Grup* (65.2%) and SCG Chemicals (30.5%) as of Aug 2016.
Integrated Petrochemical Complex
Styrene Monomer Plant Butadiene Plant
Naphtha Cracker Polypropylene Plant
Notes: (*) Including the ownership of Marigold Resources and Magna Resources. KTA: Kilo tonnes per annum; DWT: Dead-weight ton
3
1. Company Profile 2. Operational & Financial Performance 4. Industry Outlook
3. Project Updates
4
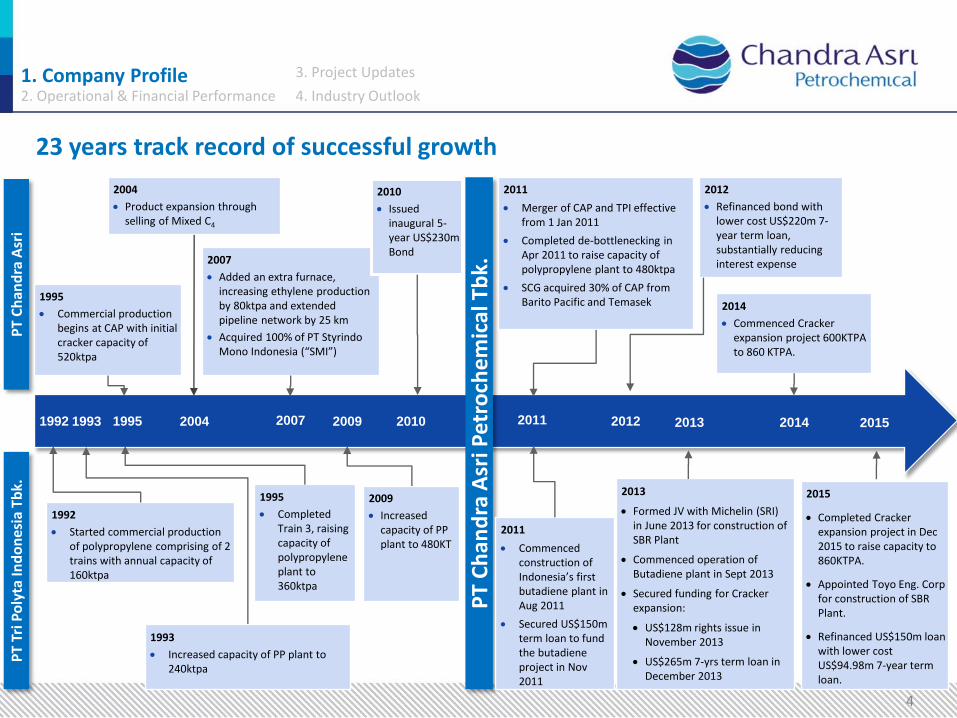
1992
Started commercial production of polypropylene comprising of 2 trains with annual capacity of 160ktpa
PT
Ch
and
ra A
sri P
etro
che
mic
al T
bk.
PT
Tri P
oly
ta In
do
nes
ia T
bk.
P
T C
han
dra
Asr
i
2011 1992 1993 1995 2004 2010
1993
Increased capacity of PP plant to 240ktpa
1995
Completed Train 3, raising capacity of polypropylene plant to 360ktpa
2007
Added an extra furnace, increasing ethylene production by 80ktpa and extended pipeline network by 25 km
Acquired 100% of PT Styrindo Mono Indonesia (“SMI”)
2004
Product expansion through selling of Mixed C4
1995
Commercial production begins at CAP with initial cracker capacity of 520ktpa
2011
Merger of CAP and TPI effective from 1 Jan 2011
Completed de-bottlenecking in Apr 2011 to raise capacity of polypropylene plant to 480ktpa
SCG acquired 30% of CAP from Barito Pacific and Temasek
2012
2011
Commenced construction of Indonesia’s first butadiene plant in Aug 2011
Secured US$150m term loan to fund the butadiene project in Nov 2011
2012
Refinanced bond with lower cost US$220m 7-year term loan, substantially reducing interest expense
2013
2013
Formed JV with Michelin (SRI) in June 2013 for construction of SBR Plant
Commenced operation of Butadiene plant in Sept 2013
Secured funding for Cracker expansion:
US$128m rights issue in November 2013
US$265m 7-yrs term loan in December 2013
2010
Issued inaugural 5-year US$230m Bond
2009
2009
Increased capacity of PP plant to 480KT
2007
2014
Commenced Cracker expansion project 600KTPA to 860 KTPA.
2014 2015
2015
Completed Cracker expansion project in Dec 2015 to raise capacity to 860KTPA.
Appointed Toyo Eng. Corp for construction of SBR Plant.
Refinanced US$150m loan with lower cost US$94.98m 7-year term loan.
23 years track record of successful growth

1. Company Profile 2. Operational & Financial Performance 4. Industry Outlook
3. Project Updates
5
Erwin Ciputra President Director
Kulachet
Dharachandra(1) VP Director of
Operations
Terry Lim Chong
Thian Director of
Finance
Fransiskus
Ruly Aryawan Director of
Monomer Commercial
Baritono
Pangestu VP Director of
Polymer Commercial
Piboon
Sirinantanakul(1) Director of
Manufacturing
Suryandi Director of Human
Resource and Corp.
Administration
Djoko Suyanto Tan Ek Kia Ho Hon Cheong Agus Salim
Pangestu
Loeki
Sundjaja Putera Chaovalit Ekabut(1)
Cholanat
Yanaranop(1)
(1) Appointed by SCG.
4 years in industry
1 year with CAP
41 years in industry
5 years with CAP
9 months in industry
9 months with CAP
10 years in industry
9 years with CAP
15 years in industry
14 years with CAP
11 years in industry
4 years with CAP
28 years in industry
4 years with CAP
13 years in industry
12 years with CAP
Board of Commissioners
Senior Management
19 years in industry
Started June16 with CAP
13 years in industry
13 years with CAP
22 years in industry
Started Jan16 with CAP
10 years in industry
9 years with CAP
26 years in industry
26 years with CAP
34 years in industry
10 years with CAP
Strong management team with extensive industry experience

Integrated Business Operations “Integrated business operations from upstream to downstream resulting in higher efficiency, lower costs, and value-added”.
6
New Generation Synthetic Rubber
Polypropylene Polyethylene Styrene Monomer
Up
stre
am
Pe
tro
che
mic
al
Ethylene Propylene Py-Gas Mixed C4
Mid
stre
am
Pe
tro
che
mic
al
O
il &
Gas
CAP Products Future products by SRI
Crude Oil
Diesel Kerosene Gasoline
Refinery
Naphtha Cracker
Naphtha LPG
Raffinate - 1 Butadiene
Condensate
CAP Facility Legend:
1. Company Profile 2. Operational & Financial Performance 4. Industry Outlook
3. Project Updates

Integrated Business Operations (cont’d)
Notes: (1) LLDPE: Linear Low Density Polyethylene (2) HDPE: High Density Polyethylene
Homopolymer
Random
Copolymer
Impact (Block) Copolymer
Ethylene
Key Products Plant Main Process Key Markets
330 KTPA
860 KTPA
430 KTPA
100 KTPA
Propylene
470 KTPA
Py-Gas
400 KTPA
Crude C4
315 KTPA
Domestic
Exporr
Domestic
Domestic
Export
Export
Domestic
Export
Domestic
Naphtha Cracker
licensed by Lummus and
KBR. Polypropylene
W.R. Grace
480 KTPA
Styrene Monomer
Licensed by Mobil-Badger and Lummus
340 KTPA
LLDPE(1)
HDPE(2)
Polyethylene
Licensed by Univation
336 KTPA
Naphtha
2,300 KTPA
Butadiene
BASF/Lummus
100 KTPA
Improved margins along the integration of the production value chain
7
1. Company Profile 2. Operational & Financial Performance 4. Industry Outlook
3. Project Updates
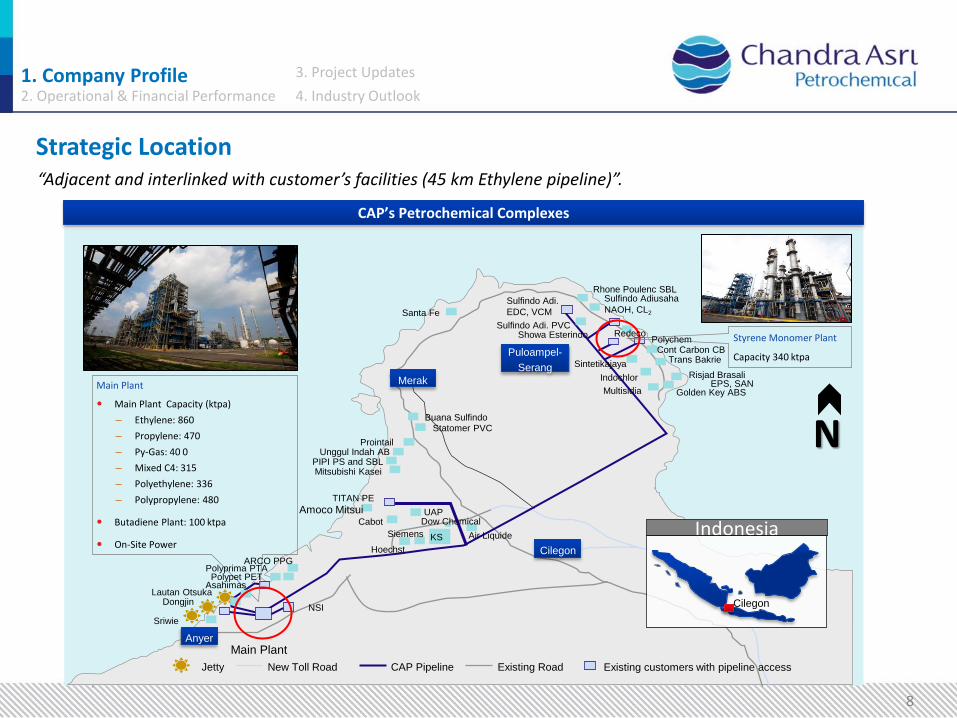
Strategic Location “Adjacent and interlinked with customer’s facilities (45 km Ethylene pipeline)”.
8
Anyer
Cilegon
Merak
Jetty CAP Pipeline New Toll Road Existing Road
Puloampel-
Serang
Main Plant
Main Plant Capacity (ktpa)
– Ethylene: 860
– Propylene: 470
– Py-Gas: 40 0
– Mixed C4: 315
– Polyethylene: 336
– Polypropylene: 480
Butadiene Plant: 100 ktpa
On-Site Power
Styrene Monomer Plant
Capacity 340 ktpa
Sriwie
Dongjin Lautan Otsuka
Asahimas Polypet PET
Polyprima PTA ARCO PPG
Amoco Mitsui TITAN PE
Mitsubishi Kasei PIPI PS and SBL
Unggul Indah AB Prointail
Statomer PVC Buana Sulfindo
Santa Fe
Rhone Poulenc SBL Sulfindo Adiusaha
NAOH, CL2
Golden Key ABS Multisidia
Risjad Brasali EPS, SAN
Trans Bakrie Cont Carbon CB
Indochlor
Sintetikajaya
Showa Esterindo Sulfindo Adi. PVC
Polychem Redeco
Cabot
Siemens
Hoechst
KS
Dow Chemical
Air Liquide
UAP
Existing customers with pipeline access
NSI
Sulfindo Adi.
EDC, VCM
Indonesia
Cilegon
Main Plant
CAP’s Petrochemical Complexes
N
1. Company Profile 2. Operational & Financial Performance 4. Industry Outlook
3. Project Updates
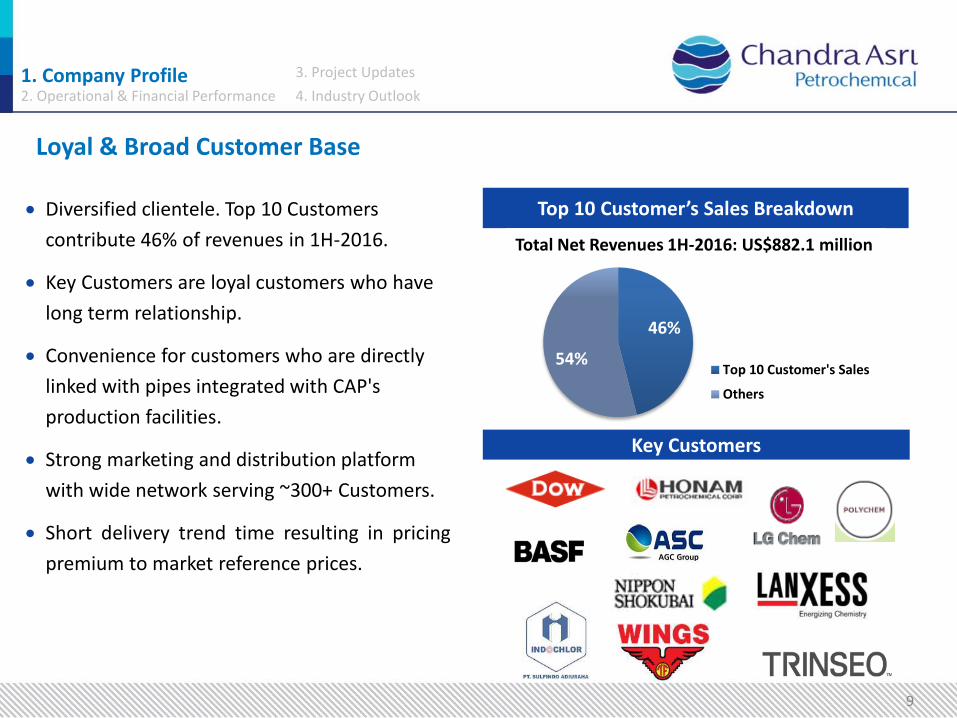
Loyal & Broad Customer Base
9
Top 10 Customer’s Sales Breakdown Diversified clientele. Top 10 Customers
contribute 46% of revenues in 1H-2016.
Key Customers are loyal customers who have
long term relationship.
Convenience for customers who are directly
linked with pipes integrated with CAP's
production facilities.
Strong marketing and distribution platform
with wide network serving ~300+ Customers.
Short delivery trend time resulting in pricing
premium to market reference prices.
Key Customers
46%
54% Top 10 Customer's Sales
Others
Total Net Revenues 1H-2016: US$882.1 million
1. Company Profile 2. Operational & Financial Performance 4. Industry Outlook
3. Project Updates
1. Company Profile
2. Operational & Financial Performance
3. Project Updates
4. Industry Outlook
10

Ethylene
Plan Utilization Rate (%)
Polyethylene, Polypropylene, Styrene Monomer, Butadiene
Consistently achieved high utilization rate of above 90%.
Decline of utilization in 2015 was due to shutdowns in the 4th quarter for Tie-in work of the Cracker Expansion project. In addition, within the 85-day shutdowns period were also conducted a Turnaround Maintenance (TAM).
Post Expansion completion in Dec-2015, Cracker plant operates with new capacity of 860 KTA (up to 43%).
Butadiene Plant operates since Sept-2013.
1. Company Profile
2. Operational & Financial Performance 4. Industry Outlook
3. Project Updates
11
94 93
80
91 95
99 92 93 95
74 69
80 76 79
47
88
2013 2014 2015 1H-16
Polyethylene Polypropylene Styrene Monomer Butadiene
99 94
57
79
2013 2014 2015 1H-16

12
Ethylene
Volume (KT)
Price & spread (US$/ton)
Propylene
Volume (KT)
Price & spread (US$/ton)
208
337
48
161
YTD Jun-15 YTD Jun-16
52 107
13 31
2Q-15 2Q-16
111
185
18
50
YTD Jun-15 YTD Jun-16
677 624
581
404
1.258
1.028
2Q-15 2Q-16
556 604
578 392
1.134 996
YTD Jun-15 YTD Jun-16
350 325
581
404
931 729
2Q-15 2Q-16
309 306
578
392
887 698
YTD Jun-15 YTD Jun-16
99
198
29
110
2Q-15 2Q-16
Volume and Price by products Olefins
1. Company Profile
2. Operational & Financial Performance 4. Industry Outlook
3. Project Updates
13
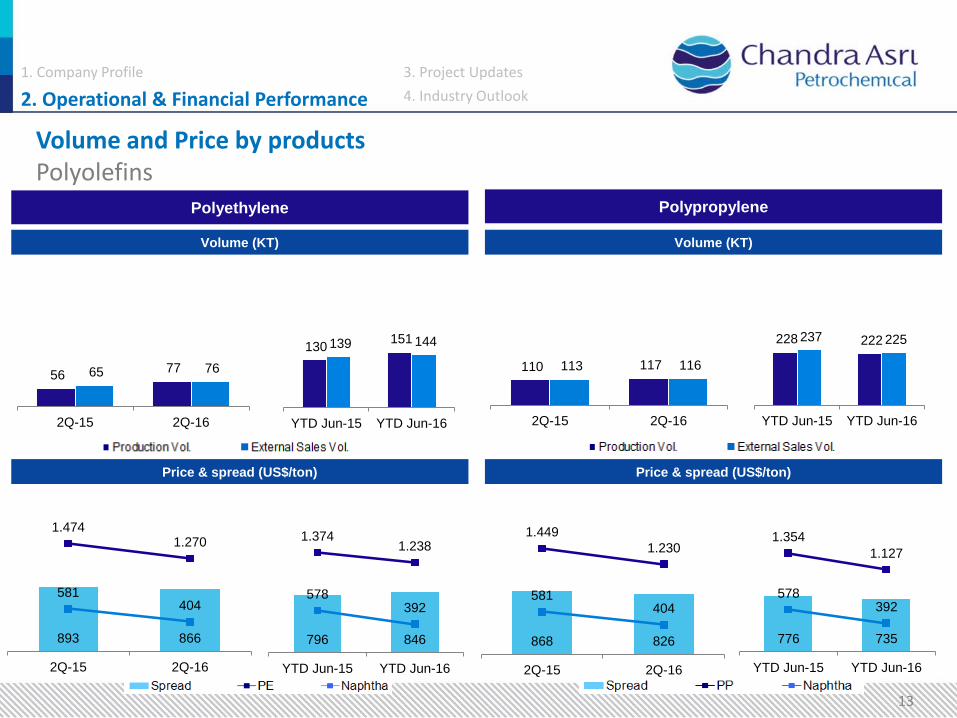
Volume and Price by products Polyolefins
Polypropylene
Volume (KT)
Price & spread (US$/ton)
110 117 113 116
2Q-15 2Q-16
228 222 237 225
YTD Jun-15 YTD Jun-16
868 826
581 404
1.449
1.230
2Q-15 2Q-16
776 735
578 392
1.354
1.127
YTD Jun-15 YTD Jun-16
Polyethylene
Volume (KT)
Price & spread (US$/ton)
56 77 65 76
2Q-15 2Q-16
130 151 139 144
YTD Jun-15 YTD Jun-16
893 866
581 404
1.474 1.270
2Q-15 2Q-16
796 846
578 392
1.374 1.238
YTD Jun-15 YTD Jun-16
1. Company Profile
2. Operational & Financial Performance 4. Industry Outlook
3. Project Updates

14
Volume and Price by products Styrene Monomer and Butadiene
14 25
15 26
2Q-15 2Q-16
Butadiene
Volume (KT)
Price & spread (US$/ton)
(1)Styrene Monomer and by products (Toluene and Ethyl Benzene)
Styrene Monomer(1)
Volume (KT)
Price & spread (US$/ton)
(3)
30
44
28
43
YTD Jun-15 YTD Jun-16
68 76 64 66
2Q-15 2Q-16
120 136 113 128
YTD Jun-15 YTD Jun-16
313 576
581
404
894 980
2Q-15 2Q-16
274 494
578 392
852 886
YTD Jun-15 YTD Jun-16
462 451
792
611
1.254 1.062
2Q-15 2Q-16
365 420
765 591
1.130 1.011
YTD Jun-15 YTD Jun-16
1. Company Profile
2. Operational & Financial Performance 4. Industry Outlook
3. Project Updates

Financial Highlights: Profit or Loss 1H-2016
15
1. Company Profile
2. Operational & Financial Performance 4. Industry Outlook
3. Project Updates
2Q-15 1Q-16 2Q-16 2Q-16 1H-15 1H-16
(US$ mn) (US$ mn) (US$ mn) YoY QoQ (US$ mn) (US$ mn) YoY
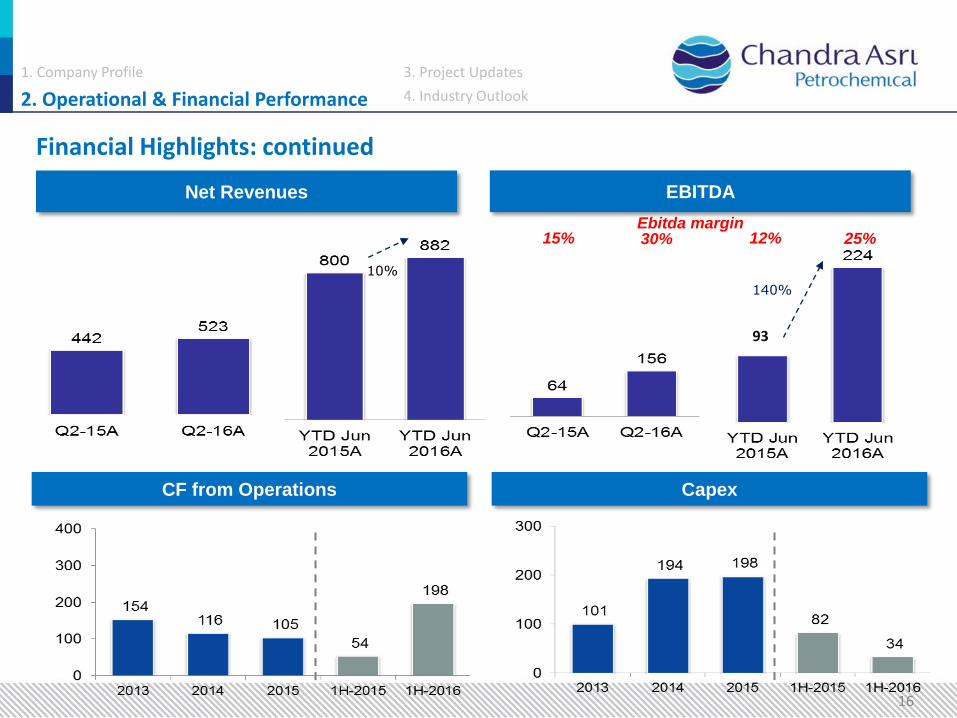
Net Revenues 442 359 523 18% 46% 799 882 10%
Cost of Revenues 370 296 368 -1% 24% 711 664 -7%
Gross Profit 72 63 156 116% 149% 88 218 147%
Operating Profit (Loss) 48 46 135 181% 193% 46 180 291%
Profit (Loss) For The Year 15 35 96 538% 172% 18 132 636%
EBITDA 65 68 156 141% 129% 93 224 140%
Gross Profit Margin 16% 17% 30% 11% 25%
Operating Profit Margin 11% 13% 26% 6% 20%
Net Profit Margin 3% 10% 18% 2% 15%
EBITDA Margin 15% 19% 30% 12% 25%
1. Company Profile
2. Operational & Financial Performance 4. Industry Outlook
3. Project Updates
15% Ebitda margin
12% 25%
Net Revenues EBITDA
30%
10%
140%
93
CF from Operations Capex
16
Financial Highlights: continued
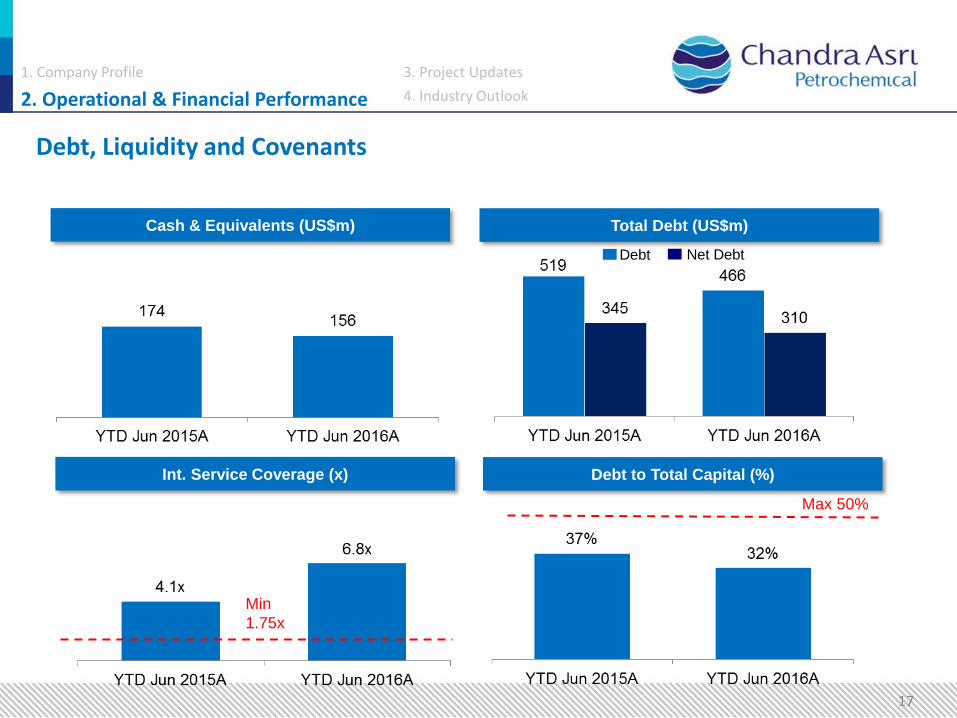
Debt, Liquidity and Covenants
17
1. Company Profile
2. Operational & Financial Performance 4. Industry Outlook
3. Project Updates
Total Debt (US$m) Cash & Equivalents (US$m)
Int. Service Coverage (x)
Max 50%
Min
1.75x
Debt to Total Capital (%)
Debt Net Debt
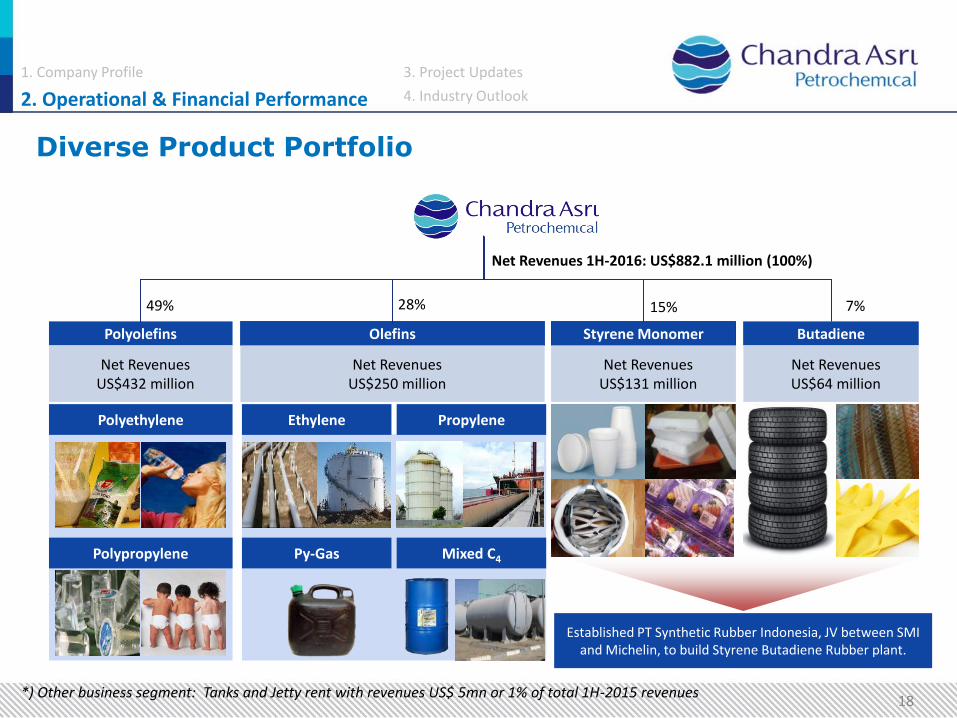
Diverse Product Portfolio
Olefins Polyolefins Butadiene Styrene Monomer
Ethylene
Py-Gas
Propylene
Mixed C4 Polypropylene
Polyethylene
Established PT Synthetic Rubber Indonesia, JV between SMI and Michelin, to build Styrene Butadiene Rubber plant.
Net Revenues US$432 million
Net Revenues US$250 million
Net Revenues US$131 million
Net Revenues US$64 million
49% 28% 15%
Net Revenues 1H-2016: US$882.1 million (100%)
7%
18
1. Company Profile
2. Operational & Financial Performance 4. Industry Outlook
3. Project Updates
*) Other business segment: Tanks and Jetty rent with revenues US$ 5mn or 1% of total 1H-2015 revenues

1. Company Profile
2. Operational & Financial Performance
3. Project Updates
4. Industry Outlook
19

1. Company Profile
2. Operational & Financial Performance 4. Industry Outlook 3. Project Updates
20 20
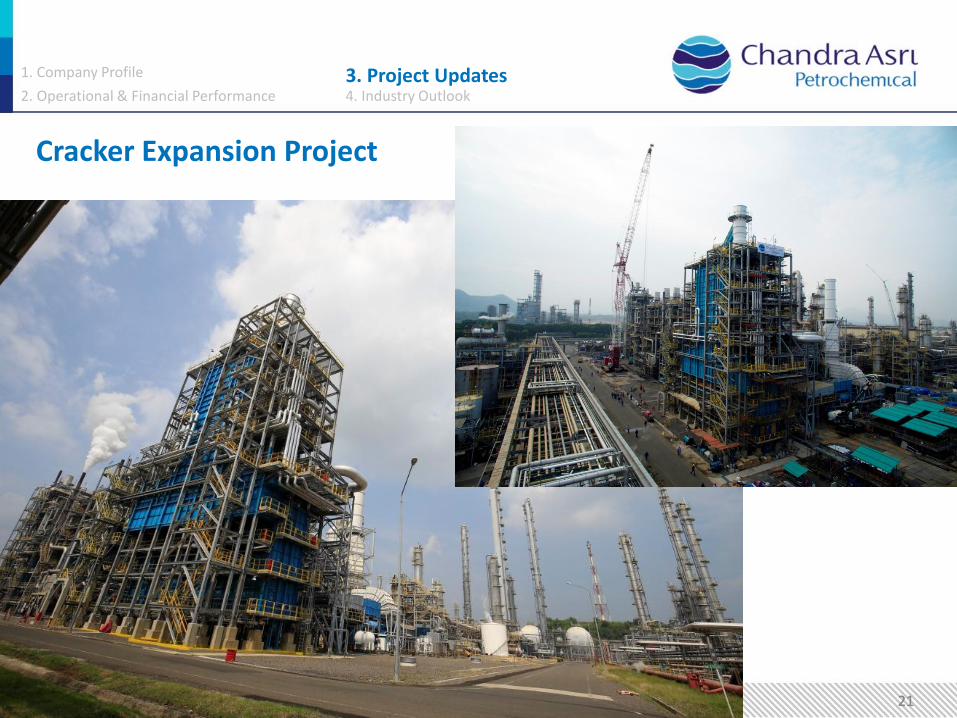
DA-415 New Propylene Tower EBR Compressor BA-109 New Furnace
Achieved Mechanical Completion on 9 December 2015.
TAM/Expansion tie-in works successfully completed on
schedule. Cracker re-started with on-spec products on
19 December, 5-days ahead of plan.
Total spending inline with budget ca. US$380m.
Cracker facility capacity increased to 860 KTA (up to
43%) since 2016.
Cracker Expansion Project
"With Cracker capacity equivalent to world-class capacity added with plant
modernization, CAP further established its position in the
petrochemical industry in Indonesia".
21 21
Cracker Expansion Project
1. Company Profile
2. Operational & Financial Performance 4. Industry Outlook 3. Project Updates

22 22
EPC contract awarded to Toyo Engineering & IKPT in June 2015.
CAP has fully injected total equity of US$54m.
Overall progress 32% as of June 2016.
Drainage work & temporary site facility completed.
Soil improvement work, civil construction work, structure and
building erection, on-going.
Further value add CAP’s Butadiene and Styrene Monomer
products into high technology Synthetic Rubber products and
enhance CAP’s netback. Future SBR Plant Facility Area
Soil Improvement CCR & Substation Temporary Site Facility
SBR plant project
1. Company Profile
2. Operational & Financial Performance 4. Industry Outlook 3. Project Updates

1. Company Profile
2. Operational & Financial Performance 4. Industry Outlook 3. Project Updates
23 23
Licence: UNIPOL Polyethylene Process from Univation
Technologies, LLC.
Capacity: new facility of total 400 KTA to produce
LLDPE, HDPE and Metallocene LLDPE.
FID target in mid 2017.
Plant come on-stream in 2019/2020.
It will capture more market shares of PE in domestic
where the country is still short of supply. Market
demand is estimated +/- 1.4mn TPA.
Polyethylene plant expansion
"Following the completion of its Cracker expansion and in line with its
strategy of pursuing vertical integration, CAP has a strategic plan to build a new PE plant to add value
to its excess Ethylene product"
Existing PE plant in Cilegon with capacity 336 KTA where 1 train is
UNIPOL PE Technology 200 KTA and another train 136 KTA is SDK

1. Company Profile
2. Operational & Financial Performance
3. Project Updates
4. Industry Outlook
24

1. Company Profile
2. Operational & Financial Performance 4. Industry Outlook
3. Project Updates
80%
82%
84%
86%
88%
90%
0
100
200
300
400
500
600
700
2009 2011 2013 2015 2017F 2019F 2021F
% U
tilis
atio
n ra
tes
Gap
ove
r na
phth
a (D
olla
rs p
er to
n)
Ethylene Delta Over Net Raw Material Cost Global utilisation rates
Note:
- 2015 is based on actual on year to date basis (Jan-Nov)
- Forecast price is based on Brent Crude at $30 (2016-2020) and $50 (2021-2022) per barrel
60%
70%
80%
90%
0
200
400
600
800
1000
1200
2009 2011 2013 2015 2017F 2019F 2021F
% U
tilis
atio
n ra
tes
Gap
ove
r na
phth
a (D
olla
rs p
er to
n)
Polyolefins Delta Over Net Raw Material Cost
Global polyolefins utilisation ratesNote:
- 2015 is based on actual on year to date basis (Jan-Nov)
- Forecast price is based on Brent Crude at $30 (2016-2020) and $50 (2021-2022) per barrel
SEA Ethylene price spreads over naphtha
“Demand fundamental remain good for petrochemical industry over the next few years, new capacity additions post 2015 resulting in modest decline in average margins following period of sustained higher profitability”
Source: Nexant (Feb 2016)
SEA Polyolefins price spreads over naphtha
Industry Outlook
25

70%
80%
90%
100%
0
100
200
300
400
500
600
2009 2011 2013 2015 2017F 2019F 2021F
% U
tilis
atio
n ra
tes
Gap
ove
r ne
t raw
mat
eria
l cos
t (D
olla
rs p
er to
n)
Styrene Delta Over Net Raw Material Cost* Global utilisation rates
Note: - 2015 is based on actual on year to date basis (Jan-Nov)
- Forecast price is based on Brent Crude at $30 (2016-2020) and $50 (2021-2022) per barrel
* Styrene market price less net raw material prices (benzene*.0.78 + ethylene*0.28)
26
60%
70%
80%
90%
100%
0
500
1000
1500
2000
2500
2009 2011 2013 2015 2017F 2019F 2021F
% U
tilis
atio
n ra
tes
Gap
ove
r na
phth
a (D
olla
rs p
er to
n)
Butadiene Delta Over Net Raw Material Cost Global utilisation rates
Note:
- 2015 is based on actual on year to date basis (Jan-Nov)
- Forecast price is based on Brent Crude at $30 (2016-2020) and $50 (2021-2022) per barrel
SEA Butadiene price spreads over Net Raw Material Cost SEA SM price spreads over Net Raw Material Cost
Source: Nexant (Feb 2016)
Industry Outlook (Cont’d)
1. Company Profile
2. Operational & Financial Performance 4. Industry Outlook
3. Project Updates
27
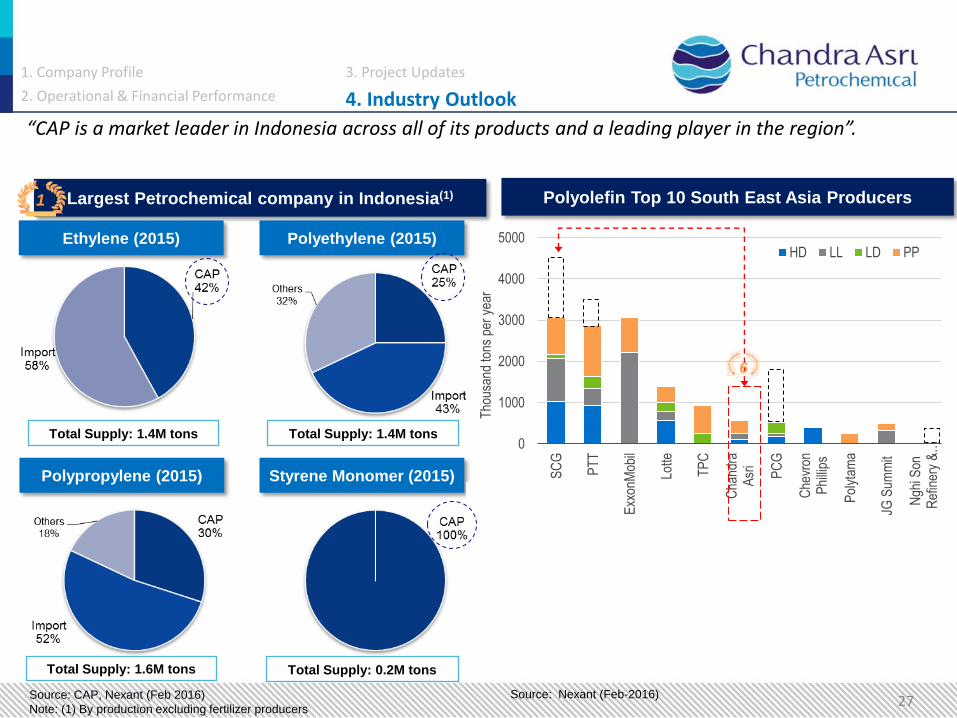
“CAP is a market leader in Indonesia across all of its products and a leading player in the region”.
0
1000
2000
3000
4000
5000
SC
G
PT
T
Exx
onM
obil
Lotte
TP
C
Cha
ndra
Asr
i
PC
G
Che
vron
Phi
llips
Pol
ytam
a
JG S
umm
it
Ngh
i Son
Ref
iner
y &
…
Tho
usan
d to
ns p
er y
ear
HD LL LD PP
Polyolefin Top 10 South East Asia Producers Largest Petrochemical company in Indonesia(1)
Ethylene (2015) Polyethylene (2015)
1
Polypropylene (2015) Styrene Monomer (2015)
Source: CAP, Nexant (Feb 2016)
Note: (1) By production excluding fertilizer producers
Total Supply: 1.4M tons
Total Supply: 1.6M tons Total Supply: 0.2M tons
6
Source: Nexant (Feb-2016)
Total Supply: 1.4M tons
1. Company Profile
2. Operational & Financial Performance 4. Industry Outlook
3. Project Updates

Thank You
Disclaimer: Important Notice • This document was prepared solely and exclusively for the parties presently being invited for the purpose of discussion. Neither this document nor any
of its content may be reproduced, disclosed or used without the prior written consent of PT Chandra Asri Petrochemical Tbk. • This document may contain statements that convey future oriented expectations which represent the Company’s present views on the probable future
events and financial plans. Such views are presented on the basis of current assumptions, are exposed to various risks and are subject to considerable changes at any time. Presented assumptions are presumed correct, and based on the data available on the date, which this document is assembled. The company warrants no assurance that such outlook will, in part of as a whole, eventually be materialized. Actual results may diverge significantly from those projected. The information in this document is subject to change without notice, its accuracy is not verified or guaranteed, it may be incomplete or condensed and it may not contain all material information concerning the Company.
• None of the Company, PT Chandra Asri Petrochemical Tbk or any person connected with any of them accepts any liability whatsoever for any loss howsoever arising from any use of this document or its contents or otherwise arising in connection therewith.
Address: PT Chandra Asri Petrochemical Tbk Wisma Barito Pacific Tower A, Lt. 7 Jl. Let. Jend. S. Parman Kav. 62-63 Jakarta 11410
Contact: Investor Relations Email: [email protected] Tel: +62 21 530 7950 Fax: +62 21 530 8930
Visit our website at www.chandra-asri.com
28


![PT CHANDRA ASRI PETROCHEMICAL TBK [TPIA.JK] relations... · PT CHANDRA ASRI PETROCHEMICAL TBK [TPIA.JK] Citi Asia Pacific Investor Conference Hong Kong –February 8th, 2018 Company](https://static.documents.pub/doc/80x56/5eb5cd874435c960002ef8f3/pt-chandra-asri-petrochemical-tbk-tpiajk-relations-pt-chandra-asri-petrochemical.jpg)


![PT CHANDRA ASRI PETROCHEMICAL TBK [TPIA.JK] · PDF filenew polyethylene plants, ... Macroeconomic Growth and Consumption Trends 11 (1) GDP, ... Plastic bags Drinks cups Food containers](https://static.documents.pub/doc/80x56/5ab0ef327f8b9ad9788ba5a5/pt-chandra-asri-petrochemical-tbk-tpiajk-polyethylene-plants-macroeconomic.jpg)
![PT CHANDRA ASRI PETROCHEMICAL TBK [TPIA.JK]barito-pacific.com/files/Investor relations/managementPresentation/c… · PT CHANDRA ASRI PETROCHEMICAL TBK [TPIA.JK] Citi Asia Pacific](https://static.documents.pub/doc/80x56/607fc4a288f0f94c624ff284/pt-chandra-asri-petrochemical-tbk-tpiajkbarito-relationsmanagementpresentationc.jpg)


