A report of child deaths in Kentucky for the 2010 calendar year, using data from the Office of Vital Statistics files Public Health Child Fatality Review Program 2012 Annual Report Child Fatality and Injury Prevention Program Division of Maternal and Child Health Kentucky Department for Public Health
Transcript
1
A report of child deaths in Kentucky for
the 2010 calendar year, using data from
the Office of Vital Statistics files
Public Health Child Fatality
Review Program 2012 Annual Report
Child Fatality and Injury Prevention Program Division of Maternal and Child Health Kentucky Department for Public Health
1
INTRODUCTION
Acknowledgements
The Kentucky Child Fatality Review System (CFR) 2012 Annual Report is prepared by the Department for Public Health Child Fatality Review and Injury Prevention Program. The Department for Public Health would like to acknowledge the time and effort of many individuals who contributed toward the completion of this 2012 Annual Report. Data used in this report is for the year 2010, which is the latest year of completed Vital Statistics records that are available. The data is still preliminary and numbers could change. Monica Clouse, MPH Stephanie Mayfield Gibson, MD, FCAP
Epidemiologist Commissioner Child and Family Health Improvement Branch Department for Public Health Teddy Slone, MPH Ruth Ann Shepherd, MD, FAAP Child Fatality Review Program Administrator Director Child and Family Health Improvement Branch Division of Maternal and Child Health Tracey D. Jewell, MPH Shelley Adams, MSN, RN Epidemiologist, Branch Manager Division of Maternal and Child Health Child and Family Health Improvement Branch Joyce M. Robl, EdD, MS, CGC Sandi Clark, RN Senior Genetic Counselor Pediatric Section Supervisor Division of Maternal and Child Health Child and Family Health Improvement Branch
Manza Agovi, MPH, PhD(c) Susan Pollack, MD, FAAP Intern Pediatric Injury Prevention Specialist Health Resources Services and Administration (HRSA) DPH Child Fatality& Injury Prevention Program University of Kentucky Injury Prevention and Dee Sparks Research Center Administrative Specialist Child and Family Health Improvement Branch Thanks to all members and consultants of the State Child Fatality Review team who volunteer their time and efforts to reviewing this data and reducing child fatalities across the state. Questions concerning this report should be directed to: Child Fatality Review and Injury Prevention Program Administrator Child and Family Health Improvement Branch Division of Maternal and Child Health KY Department for Public Health 275 East Main Street, HS2W-A Frankfort, KY 40621 Phone: 502-564-2154
This report may be viewed at the following web address: http://chfs.ky.gov/dph/mch/cfhi/childfatality.htm
Public Health Child Fatality Review 2012 Annual Report
Table of Contents
2012 EXECUTIVE SUMMARY Page 3
THE PUBLIC HEALTH CHILD FATALITY REVIEW PROCESS Page 5 Map of currently active Local CFR teams Page 6 TOP 10 LEADING CAUSES OF CHILD DEATHS IN KENTUCKY Page 7 THE 2010 KENTUCKY CHILD DEATH DATA Page 8
KENTUCKY PUBLIC HEALTH CHILD FATALITY REVIEW SYSTEM 2012 ANNUAL REPORT
EXECUTIVE SUMMARY
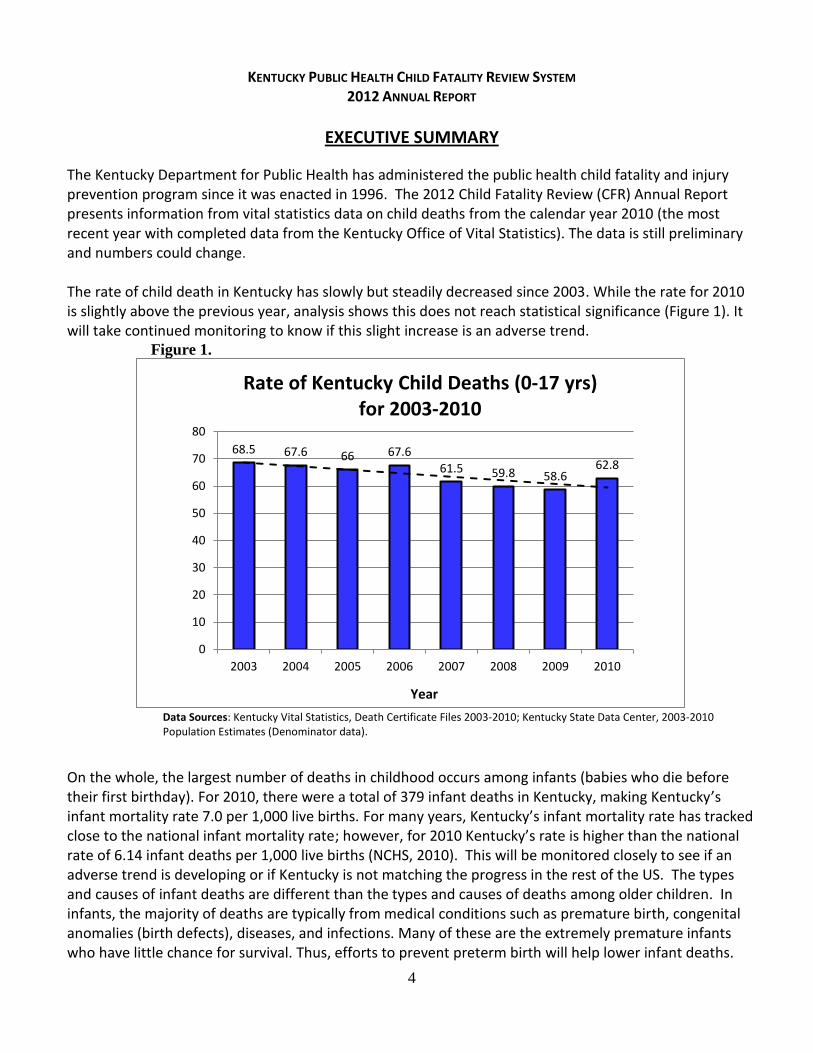
The Kentucky Department for Public Health has administered the public health child fatality and injury prevention program since it was enacted in 1996. The 2012 Child Fatality Review (CFR) Annual Report presents information from vital statistics data on child deaths from the calendar year 2010 (the most recent year with completed data from the Kentucky Office of Vital Statistics). The data is still preliminary and numbers could change. The rate of child death in Kentucky has slowly but steadily decreased since 2003. While the rate for 2010 is slightly above the previous year, analysis shows this does not reach statistical significance (Figure 1). It will take continued monitoring to know if this slight increase is an adverse trend.
Figure 1.
Data Sources: Kentucky Vital Statistics, Death Certificate Files 2003-2010; Kentucky State Data Center, 2003-2010 Population Estimates (Denominator data).
On the whole, the largest number of deaths in childhood occurs among infants (babies who die before their first birthday). For 2010, there were a total of 379 infant deaths in Kentucky, making Kentucky’s infant mortality rate 7.0 per 1,000 live births. For many years, Kentucky’s infant mortality rate has tracked close to the national infant mortality rate; however, for 2010 Kentucky’s rate is higher than the national rate of 6.14 infant deaths per 1,000 live births (NCHS, 2010). This will be monitored closely to see if an adverse trend is developing or if Kentucky is not matching the progress in the rest of the US. The types and causes of infant deaths are different than the types and causes of deaths among older children. In infants, the majority of deaths are typically from medical conditions such as premature birth, congenital anomalies (birth defects), diseases, and infections. Many of these are the extremely premature infants who have little chance for survival. Thus, efforts to prevent preterm birth will help lower infant deaths.
68.5 67.6 66 67.6
61.5 59.8 58.6 62.8
0
10
20
30
40
50
60
70
80
2003 2004 2005 2006 2007 2008 2009 2010
Year
Rate of Kentucky Child Deaths (0-17 yrs) for 2003-2010
5
Other infant deaths, such as those associated with unsafe sleep practices, have even higher potential for prevention. Education programs, such as the National “Safe to Sleep,” formerly known as the Back to Sleep Campaign, have demonstrated significant reductions in unsafe sleep practices. Deaths among children ages 1-17 represent about 40% of all childhood deaths for the year. However, injury deaths, comprise over half of the deaths in children after infancy. The potential for prevention is high with these deaths. The most common cause of injury death among Kentucky’s children aged 1-17 is motor vehicle collisions. These deaths have been decreasing in Kentucky, particularly among the age group 15-17 years, which could be the result of recently enacted safe driving laws for teens that went into effect in 2006.
Figure 2.
2010 Data is preliminary and numbers may change.
Data Source: Kentucky Vital Statistics, Death Certificate File 2010.
The data in this report has been reviewed by the multidisciplinary State Child Fatality Review Team, including Kentucky’s pediatric experts in injury prevention and child fatality and other organizations that promote child health and safety. They have identified priorities to prevent child deaths in Kentucky and include:
Improving data collection and quality for prevention efforts.
Promoting safe sleep practices – unsafe sleep environments have contributed to many of Kentucky’s infant deaths.
Increasing child restraint use – booster seats can save children’s lives but only if used properly and in accordance with the most recent recommendations that take into account the child’s height, not age.
The full report can be found at: http://chfs.ky.gov/dph/mch/cfhi/childfatality.htm
Non-Injury Deaths, Infants
(53%)
Injury Deaths, Infant (6%)
Injury Deaths, 1-17 yrs (24%)
Non-Injury Deaths, 1-17 yrs
(17%)
Percent of 2010 Non-Injury (N=447) and Injury (N=193) Deaths Among Infants and Children 1-17 yrs.
KENTUCKY CHILD FATALITY REVIEW SYSTEM 2012 ANNUAL REPORT
THE PUBLIC HEALTH CHILD FATALITY REVIEW PROCESS
The goal of the Kentucky Public Health Child Fatality Review Program is ultimately to decrease child deaths through prevention efforts. This is done by monitoring data; identifying trends, injuries, and deaths that may be preventable in Kentucky; and reviewing and learning from the reported deaths. In collaboration with key partners, this learning is applied to developing recommendations and community interventions that may help prevent injuries and future child deaths. The Kentucky Department for Public Health established the State Child Fatality Review Team in 1996 in accordance with Kentucky Revised Statute (KRS) 211.684. The State Team is a voluntary, multidisciplinary body that may assume certain duties. Those duties include:
Facilitate the development of local child fatality review teams that may include training opportunities and technical assistance.
Develop and distribute model protocols for local child fatality review teams that investigate child fatalities.
Review and approve local protocols prepared and submitted by local teams.
Analyze received data regarding child fatalities to identify trends, patterns and risk factors.
Evaluate the effectiveness of adopted prevention and intervention strategies.
Make recommendations regarding state programs, legislation, administrative regulations, policies, budgets, and treatment and service standards that may facilitate development of strategies for prevention and reduction of the number of child deaths.
The State Child Fatality Review Program works with the state CFR team to assure a strong child fatality review and injury prevention system throughout Kentucky. Local development of child fatality review teams continues to be one of the most important infrastructure-building responsibilities of the State Team. According to KRS 211.686, local child fatality review team composition includes multidisciplinary representation from coroners, law enforcement, health departments, Department for Community Based Services, Commonwealth and county attorneys, medical professionals and other members whose participation the local team believes is important to carry out its purpose. The local team assists the coroner in gathering as much information as possible to determine the most accurate manner and cause of a child’s death. Team members have the opportunity to share information, discuss and prioritize child health and risk factors, and promote local education and community-based prevention programs. The goal of the program is to have local teams in every county so that local initiatives for injury prevention can be implemented. Currently, 80 counties have an active local child fatality review team (Map 1). The State Team reviews this information to identify injury trends happening in multiple communities and develop strategies that will help save the lives of children across the Commonwealth.
7
Map
1.
Da
ta S
ou
rce:
Ch
ild
Fat
alit
y R
evie
w T
eam
Rep
ort
s
8
Leading Causes of Child Death in Kentucky
Table 1 below provides the top 10 leading causes of child death in Kentucky by age group for the combined years of 2006 to 2010. Unintentional injury is the leading cause of death for all age groups after the age of one. Table 1.
10 Leading Causes of Child Death, Kentucky
Combined years 2006 – 2010
Age Groups
Rank <1 1 to 4 5 to 9 10 to 14 15 to 17
1 Prematurity Related
(495) Unintentional Injury
(131) Unintentional Injury
(67) Unintentional Injury
(108) Unintentional Injury
(257)
2 Congenital Anomalies
(378)
Congenital Anomalies
(32)
Neoplasms (33)
Neoplasms (33)
Suicide (66)
3 SIDS (300)
Homicide (30)
Disease of the Nervous System
(<20)
Disease of the Nervous System
(<20)
Homicide (29)
4 Perinatal Conditions
(183) Neoplasms
(25)
Congenital Anomalies
(<20)
Suicide (<20)
Disease of the Circulatory System
(20)
5 Unintentional Injury
(114)
Disease of the Nervous System
(<20)
Homicide
(<20)
Homicide (<20)
Neoplasms (<20)
6 Undetermined
(65)
Disease of the Circulatory System
(<20)
Disease of the
Circulatory System (<20)
Disease of the Circulatory System
(<20)
Disease of the Nervous System
(<20)
7 Respiratory Disease
(46) Infection
(<20) Metabolic Disorders
(<20) Metabolic Disorders
(<20) Respiratory Disease
(<20)
8 Infection
(39) Respiratory Disease
(<20) Infection
(<20) Respiratory Disease
(<20)
Injury of Undetermined Intent
(<20)
9 Disease of the
Circulatory System (36)
Undetermined (<20)
Respiratory Disease (<20)
Infection (<20)
Congenital Anomalies
(<20)
10 Disease of the
Nervous System (25)
Metabolic Disorders (<20)
Undetermined (<20)
Injury of Undetermined
Intent (<20)
Metabolic Disorders
(<20)
2010 Data is preliminary and numbers may change.
Note: Shaded areas denote potential preventive deaths.
Data Source: Kentucky Vital Statistics, Death Certificate Files 2006-2010.
9
THE 2010 KENTUCKY CHILD DEATH DATA
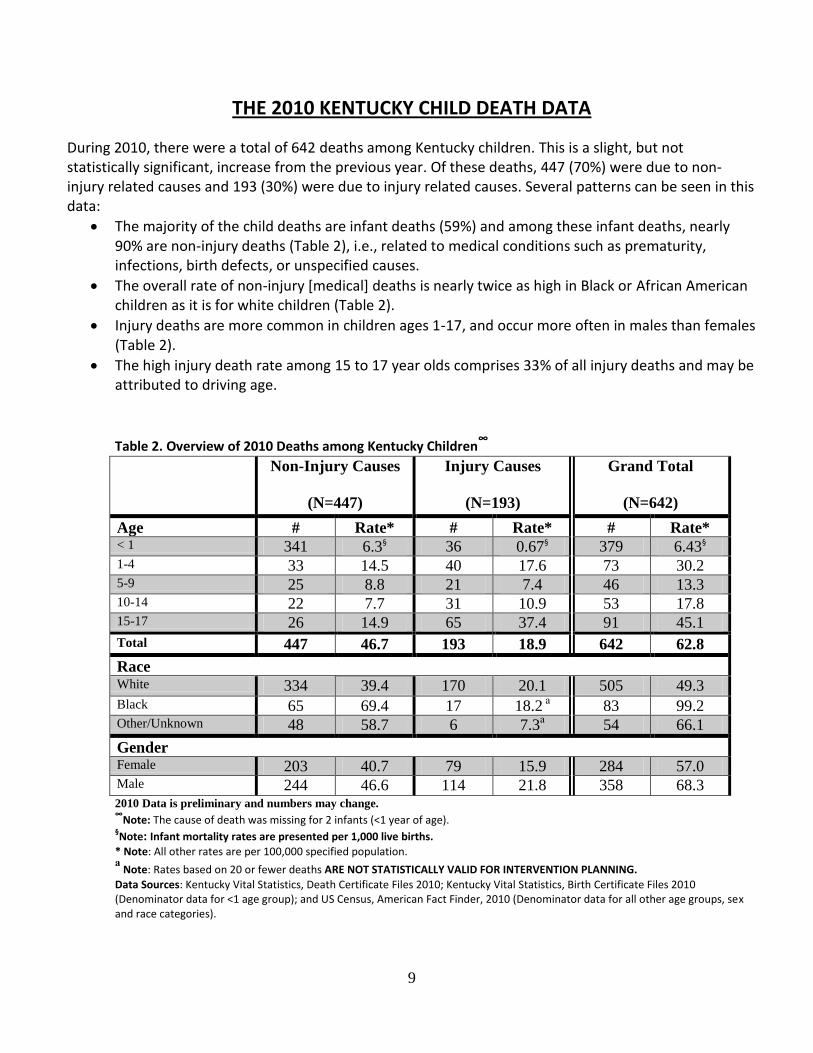
During 2010, there were a total of 642 deaths among Kentucky children. This is a slight, but not statistically significant, increase from the previous year. Of these deaths, 447 (70%) were due to non-injury related causes and 193 (30%) were due to injury related causes. Several patterns can be seen in this data:
The majority of the child deaths are infant deaths (59%) and among these infant deaths, nearly 90% are non-injury deaths (Table 2), i.e., related to medical conditions such as prematurity, infections, birth defects, or unspecified causes.
The overall rate of non-injury [medical] deaths is nearly twice as high in Black or African American children as it is for white children (Table 2).
Injury deaths are more common in children ages 1-17, and occur more often in males than females (Table 2).
The high injury death rate among 15 to 17 year olds comprises 33% of all injury deaths and may be attributed to driving age.
Table 2. Overview of 2010 Deaths among Kentucky Children∞
Race White 334 39.4 170 20.1 505 49.3 Black 65 69.4 17 18.2
а 83 99.2
Other/Unknown 48 58.7 6 7.3а 54 66.1
Gender Female 203 40.7 79 15.9 284 57.0 Male 244 46.6 114 21.8 358 68.3 2010 Data is preliminary and numbers may change.
∞Note: The cause of death was missing for 2 infants (<1 year of age).
§Note: Infant mortality rates are presented per 1,000 live births.
* Note: All other rates are per 100,000 specified population. а
Note: Rates based on 20 or fewer deaths ARE NOT STATISTICALLY VALID FOR INTERVENTION PLANNING.
Data Sources: Kentucky Vital Statistics, Death Certificate Files 2010; Kentucky Vital Statistics, Birth Certificate Files 2010 (Denominator data for <1 age group); and US Census, American Fact Finder, 2010 (Denominator data for all other age groups, sex and race categories).
10
Infant Mortality Infant mortality is the death of a child any time after birth and before reaching his or her first birthday. Nearly all of these deaths are non-injury deaths related to medical conditions. The National 2010 infant mortality rate of 6.14 infant deaths per 1,000 live births is a historically low figure for the United States, and represents the largest single-year decrease in infant mortality in more than a decade (NCHS Data Brief, 2012). Across the United States, infant mortality rates are generally higher in the South and Midwest and lower in other regions (National Vital Statistics Reports, 2010). For 2010, there were a total of 379 infant deaths in Kentucky, making Kentucky’s infant mortality rate 7.0 infant deaths per 1,000 live births. Kentucky’s infant mortality rate has historically run close to the national average. However, the rate of infant mortality in Kentucky for 2010 was above the national rate (Figure 3). This was the first increase in Kentucky’s infant mortality rate since 2006, but this increase does not reach the level of statistical significance and it is too soon to tell if this is the beginning of an actual change in trend or if this increase is due to the random variation in the data. Figure 3.
*Note: Data for 2010 is preliminary.
Data Sources: National Vital Statistics Reports, Births, Marriages, Divorces, and Deaths: Provisional Data (1970-2009); Deaths: Preliminary Data for 2010; Kentucky Vital Statistics, Death and Birth Certificate Files, 1970-2010.
0
5
10
15
20
25
Rat
es o
f D
eat
h p
er 1
,00
0 L
ive
Bir
ths
Year
Infant Mortality Rate, 1970-2010 Kentucky and U.S.
US
KY
11
Infant Mortality - Non-Injury Deaths
In Kentucky and nationally, over half of the total child deaths are non-injury deaths in infancy, or babies who die before they reach their first birthday. Over 90% of infant deaths are classified as non-injury [medical-related] deaths (Figure 2), and the majority (54%) of these deaths occurred among infants <1 month of age. Many of these are the extremely premature infants who have little chance for survival. Thus, efforts to prevent preterm birth will help lower infant deaths. Other leading causes of infant death in Kentucky and nationally are congenital anomalies, and Sudden Unexpected Death in Infancy (SUDI), formerly called SIDS.
Prematurity-related causes of death are the leading cause of infant death. Thus the recent rise in preterm birth, in Kentucky and in the nation, is cause for concern. Efforts to reduce preterm birth should also lead to reductions in infant deaths. Many of these conditions are not believed to be preventable in the same way accidents are preventable. While some conditions cannot be prevented, early prenatal care, with early detection and prompt, appropriate treatment for problems can often prevent prematurity and its consequences, including deaths.
Congenital anomalies (birth defects), the second leading cause of infant mortality, were the cause of more than 1 in 5 of Kentucky infant deaths for 2010. According to Center for Disease Control and Prevention, congenital heart defects are the most common type of birth defect in the United States and are the leading cause of birth defect-associated infant illness and death (CDC, 2011). Not all birth defects can be prevented, but there are some measures that can be taken to ensure a healthy pregnancy and a healthy baby. All women of childbearing age should be encouraged to take a multivitamin that contains folic acid during critical periods of organ formation. Folic Acid supplementation before and during pregnancy has been associated with lower rates of neural tube defects (spine defects), congenital heart defects, obstructive urinary tract anomalies, limb deficiencies, orofacial clefts and congenital hypertrophic pyloric stenosis. In addition, promotion of preconception health activities for all women may lead to the identification of specific risk factors (i.e. family history, medication use) for birth defects that can be addressed prior to pregnancy. Kentucky currently completes newborn metabolic screening for 49 disorders, and is currently expanding to include critical congenital heart defects.
The rate of Sudden Unexpected Death in Infancy (SUDI) remains relatively stable in Kentucky, around 1 death per 1,000 live births, but this is still twice the national average. Kentucky’s high rates of smoking during pregnancy and second-hand smoke after the baby’s birth certainly contribute to these rates. Nationally and in Kentucky, when the SIDS death rates decrease, the rate of deaths due to “undetermined causes” increase, suggesting that these changes may be largely due to changes in the way these deaths are classified (American Academy of Pediatrics, 2011). For that reason, Kentucky and other states are now focusing on all sleep related deaths in infancy, rather than how the deaths are classified.
Infant Mortality - Injury Deaths Among infants, injury deaths are not as prevalent as non-injury deaths. In Kentucky, injury deaths in infants accounted for only 10% of all infant deaths in 2010. The most common injury death among infants is suffocation; other causes of injury deaths among infants are rare but have included deaths due to homicide, motor vehicle collisions, fire, drowning, and poisoning. Deaths due to suffocation accounted for 70% of the total infant deaths due to injury in the 2010 Kentucky data, making suffocation the leading cause of injury deaths among Kentucky infants for the year. In many cases these may be difficult to
12
distinguish from Sudden Unexplained Death in Infancy or other unsafe sleep deaths. The increase in the suffocation deaths may be largely the result of a re-categorization of the cause of infant death driven by improvements in the quality of death scene investigations. Previously, many of these deaths were categorized as sudden infant death syndrome (SIDS). With the improved investigations, more cases are being identified where a child suffocates from soft pillows, mattresses, or mattress coverings in the crib or from bed sharing. Infant deaths from injury causes in the suffocation category include deaths from suffocation, strangulation and choking, as well as confinement in airtight places. The National Center for Health Statistics reports, 1,160 infants died of suffocation in 2009 in the United States. In many of these cases, a safe sleep environment may have prevented the death. The high incidence of infant suffocation highlights the importance of a safe sleeping environment as recommended by the American Academy of Pediatrics, which includes supine (on back) positioning, a firm sleep surface, room-sharing without bed-sharing, and avoiding excessive loose bedding.
Infant Mortality – Sleep-Related Deaths Over the past few years, as SIDS deaths have decreased other similar causes of infant death (accidental suffocation, asphyxia, and undetermined) have increased. Now new terminology is evolving to describe this phenomenon, and the CDC is recommending the term Sudden Unexpected Death in Infancy (SUDI) or Sudden Unexpected Infant Death (SUID). From a prevention standpoint, the distinction between these causes is not as important as understanding the risk factors, particularly unsafe sleep practices, that are associated with these deaths. The Maternal and Child Health Division, within Kentucky’s Department for Public Health, was recently chosen by the federal Health Resources Services and Administration (HRSA) for a Graduate Student Internship Program. The Graduate Student Intern, Manza Agovi, MPH, PhD(c) completed an epidemiological analysis of co-sleeping deaths among infants in Kentucky during the summer of 2012. All infant deaths occurring from 2007 through 2011 were reviewed for identification of risk factors related to the sleep environment. All data described below was gathered by Ms. Agovi during her internship. The data is currently being prepared for publication along with additional analyses. The preliminary results are included here because they are findings that are significant regarding prevention efforts. There were a total of 1,718 infant deaths from 2007 through 2011 (M.Agovi, 2012). These infant deaths were reviewed and placed into cause categories. There were three main categories associated with sleep-related deaths including: Suffocation/Strangulation in Bed 5.70% (n=98), SUDI/SIDS 17.81% (n=306), and Undetermined 5.06% (n=87). Figure 4 provides the prevalence of sleep-related risk factors among these three main causes/categories of death for the five year period.
There was a sleep-related risk factor present for nearly 94% of infant deaths due to suffocation/strangulation in bed occurring during 2007-2011.
86.6% of SUDI/SIDS deaths occurring during this time period had a documented risk factor related to sleep environment.
Of the Undetermined infant deaths occurring from 2007 through 2011, 83.9% had a sleep-related risk factor present.
The data presented here is preliminary data and further studies will need to be conducted. However, this
study does highlight the major contribution of co-sleeping risk factors to infant deaths in Kentucky. The
sleep environment is a modifiable risk factor and one that can be the target for prevention and health
13
promotion activities in Kentucky in order to reduce infant deaths. By identifying the areas and
populations at risk in the state, educational campaigns and programs on safe sleeping environments can
be targeted to those at greatest risk.
Figure 4.
∞Sleep-related risk factor includes: Bed sharing or co-sleeping, sofa/couch sleeping, soft bedding, use of an adult bed, and placed
prone or side position. §Preliminary data: 2009-2011.
Data Source: Kentucky Vital Statistics, Death Certificate File 2007-2001; Kentucky Medical Examiner Reports, 2007-2011;
Coroner’s Reports; and Child Fatality Review Team Reports.
Data Compiled and Analyzed by Manza Agovi, MPH, PhD(c)
14
Kentucky’s Child Deaths, Age 1-17
Child Deaths - Non-Injury Causes Child deaths by non-injury cause are the result of natural processes such as disease, prematurity or congenital anomalies (birth defects). A death due to a non-injury cause can result from one of many serious health conditions, some of which are not believed to be preventable in the same way unintentional injuries are preventable. However, with some illnesses such as asthma, infectious diseases and inherited metabolic disorders, under certain circumstances, fatalities may be prevented. Some conditions may be prevented through better education and preventive intervention during preconception, such as folic acid preventing neural tube defects and smoking cessation reducing the risk of having a low birth weight baby. While some conditions cannot be prevented, early detection and prompt, appropriate treatment can often prevent death, such as we have seen with expanded newborn metabolic screening. The non-injury deaths in children after the first year of life are usually related to specific health conditions. While these deaths are less common than injury deaths in children after infancy, they are significant (17% of all child deaths) and in some cases could be prevented with better education, access to care, and interventions. There were a total of 106 non-injury deaths among Kentucky children aged 1-17 for 2010. Childhood cancer, Central Nervous System Disease, and Congenital Anomalies were the three leading non-injury causes of death among these children.
Childhood cancers were the leading cause of non-injury deaths among Kentucky children 1 -17 years of age for 2010. According to the National Cancer Institute, incidence of childhood cancer for children over the age of one has increased from less than 20 percent in the 1960’s to almost 80 percent today.
The second leading cause of non-injury deaths among children aged 1-17 was Nervous System Disease. Cerebral palsy and other paralytic syndromes accounted for over half of these child deaths. Some of the other types of Nervous System Disease responsible for childhood death include bacterial meningitis, epilepsy, and spinal muscular atrophy. Many of these disabilities are mild enough to allow children to eventually function independently in society. Others are not. Damage to the developing nervous system is a major cause of chronic, disabling disorders and sometimes death.
Congenital anomalies or birth defects were the third leading cause of non-injury deaths among children above the age of one during 2010. Death due to congenital malformations of the heart was the leading cause of birth defect deaths for Kentucky children. Congenital heart defects range in severity from tiny pinholes between chambers that may resolve spontaneously to major malformations that can require multiple surgical procedures or result in death. Other congenital anomalies responsible for death in children 1 to 17 years of age include anencephaly and similar malformations, abnormalities of the respiratory system, and chromosomal abnormalities. The disease process associated with many birth defects may not be fatal in the first year of life, but still results in childhood deaths.
15
Child Deaths - Injury Causes According to the Center for Disease Control and Prevention, injuries are the leading cause of death for people ages 1-44 in the United States. Injury deaths account for nearly one of every 4 child deaths in Kentucky. Injury cause of death includes but is not limited to: suffocation, poisoning, drowning, fire, child abuse, suicide, homicide, and vehicular collisions. Injury related deaths are more likely to be preventable than non-injury deaths. Many factors have been associated with increased risk of injury or death in children including socioeconomic factors, cultural factors, geographical location, education level, and health and safety issues in the community. Understanding these factors is critical to developing prevention strategies to reduce injuries in child deaths throughout the state. More children aged 1 to 17 die in Kentucky from deaths due to injury causes than deaths due to non-injury causes. There were a total of 193 injury deaths among Kentucky children aged 1-17 for 2010. Motor Vehicle Collisions, Homicides and Suicides were the leading injury causes of death among these children.
Of the 193 injury deaths, 73 or 38% were due to all types of motor vehicle collisions (MVCs), the leading cause of injury deaths for 2010. Nationally, motor vehicle collisions are also the leading cause of death for children 1-17 years of age (Vital Signs, 2012). However, Kentucky has the fifth highest motor vehicle death rate in the nation (KIPRC Annual Report, 2012). Kentucky State Police reported a total of 760 fatalities on Kentucky highways for 2010. MVCs continue to be the leading cause of injury deaths for Kentucky’s children.
o MVCs were the leading cause of death among children 5-9 years of age in Kentucky and made up 62% of all injury deaths occurring among this age group. This same group also represents the required age for booster seat use, according to Kentucky’s booster seat law. Kentucky’s booster seat law went into effect in July 2008 with only verbal warnings given at this time but after June 30, 2009 violators were required to pay a fine of $30.00.
o Deaths due to MVCs in Kentucky remain the leading cause of injury deaths among children 10-14 years of age, making up 52% of all injury deaths and among teens 15-17 years of age, making up 46% of all injury deaths in 2010. Deaths due to MVCs are preventable.
There are several laws in Kentucky that protect children in vehicles, including primary enforcement for child passenger safety restraints (2006), Graduated Licensing law for teens (2006), legislation requiring booster seats (2008). More recent legislation includes prohibiting texting and driving and cell phone use for teens while driving (2010). According to Kentucky’s Injury Prevention Research Center at the University of Kentucky, 97% of children aged four and under are restrained in some way when traveling in motor vehicles in Kentucky, but child passenger safety (CPS) checkup events have shown us that many restraints are used incorrectly (KIPRC Annual Report, 2012). Improvements in seat belt use, child safety seat and booster seat use, and limiting distracted driving hazards will likely contribute to a decline in deaths due to MVCs in the future.
Homicide and Suicide tied as the second leading cause of injury deaths among 1-17 year olds during 2010. Violence against children and youth is far too common. Parents, guardians, and children experience personal crises, relationship problems, or emotional distress that can contribute to homicide and suicide. Legislation that passed in 2010 requires suicide prevention and education training for professionals working with middle and high school students in hopes of promoting further decreases in suicide rates among children. Looking at both children and adults, Kentucky has one of the highest suicide rates in the nation, so recognition of warning signs and early interventions are paramount. Child abuse deaths most commonly occur in infants and toddlers ages 1-4 year old. Abusive head trauma accounted for 49% of the physical abuse
16
fatalities/near fatalities for state fiscal year 2010-2011 and can be attributed to this age group’s homicide deaths (DCBS, 2011). Recent legislation requiring provider trainings on abusive head trauma may improve and prevent some of these homicide deaths in the future. Both suicide and homicide deaths in children were fewer in 2010 compared to 2009, but the numbers are small and there is not yet a consistent downward trend.
Drowning is most common in the 1-4 year old age group, where toddlers unobserved may drown
in very small amounts of water. Most pool-related drownings in Kentucky occur at home, not in
public pools.
Poisonings include both the toddler age group (accidental poisoning from medications or chemicals not secured out of their reach), as well as teens who accidentally overdose. Increasing trends in poisoning deaths among those aged 15-17 years is consistent with reported increases in drug poisoning deaths seen throughout the United States, in which there is little or no evidence that the injury or poisoning occurred with intent to harm or cause death. Accidental poisoning by and exposure to narcotics and psychodysleptics include: cocaine, codeine, heroin, and lysergide (LSD) among others. Another prevalent poisoning category is exposure to other gases and vapors (i.e. carbon monoxide and nitrogen oxide). Poisoning deaths from prescription drug use is a growing concern for Kentucky in both children and adults.
Fire deaths are random, but more often it is the younger children who are unable to escape. According to the United States Fire Administration, Kentucky had the 9th highest death rate due to fire (US Fire Administration, 2009). The Office of the Kentucky State Fire Marshal, Richard Peddicord, recommends identification and improvements in substandard housing, more smoke detectors and a population more educated on both fire prevention and fire escape for reducing this death toll.
17
PREVENTION PRIORITIES AND RECOMMENDATIONS Improving Kentucky’s Child Death Review Process Since 1996, the Kentucky State Child Fatality Review Team has been working with many partners to review available data on child deaths, encouraging local reviews, and seeking to identify trends and interventions for prevention. The State Public Health Child Fatality Review Team has said “If even one child dies, we should try to understand why.” Even though current statutes authorizing the child fatality review process do not require reviews of all child deaths, from the team’s point of view, that would be ideal. Kentucky has made some progress in accomplishing this goal. This is evident because Kentucky now has 80 counties participating in local team review. The number of local teams has increased by 33% just within the last 4 years. The Centers for Disease Control and Prevention (CDC) and the Healthy People 2020 initiative aims to have 90% of all child (17 years and under) deaths that are due to external causes reviewed by a child fatality review team. Kentucky will continue to work towards that goal.
The Public Health State Child Fatality Team plans to work closely with the new Child Fatality and Near Fatality External Review Panel appointed by Governor Steve Beshear to develop a more comprehensive system for child death review. The more comprehensive reviews from the External Panel are likely to assist local teams by providing expert input and better information for the local child fatality review teams to use in prevention planning. Monitoring the occurrence of all childhood deaths and performing an appropriate review when deaths occur provide child death review teams a unique ability to gather the detailed information necessary for effective injury/disease prevention activities. To understand why one Kentucky child dies may save the lives of others in our communities. Safe Sleep Environments for Infants An in-depth review of Kentucky infant deaths from all data sources (death certificates, Medical Examiner reports, coroner’s reports and child fatality review team reports) discussed on page 11 highlights the importance of safe sleep for Kentucky’s infants. The high percentage of these deaths with a documented risk factor related to sleep environment means there is great potential for prevention through promoting safe sleep practices. The American Academy of Pediatrics (AAP) has promoted the “Safe to Sleep” formerly known as the Back to Sleep Campaign since 1994, and health care professionals, health educators, and injury prevention advocates have all embraced the AAP recommendations. In October 2011, the AAP formally recommended that the national campaign reduce the risk of SIDS by including a major focus on safe sleep environments and ways to reduce the risk of all sleep-related infant deaths, including SIDS, suffocation, and other accidental deaths. In spite of the ‘Back to Sleep’ national campaign, the AAP notes that sleep-related deaths in the United States have increased in incidence.
Schnitzer et.al (2012) found 64% of infants with SUIDS were sharing a sleep surface and 70% were on a surface not intended for infant sleep.
Shapiro-Mendoza & colleagues (2009) found that infant mortality rates attributed to accidental suffocation or strangulation have quadrupled since 1984 (1984-2004).
Based on this information, the CDC is currently revising their safe sleep recommendations and campaign. The Kentucky CFR and Injury Prevention team have already recognized this need and will begin promoting this approach when the materials are released by the CDC. In addition to public messages, areas for
18
improvement include improving the data, collecting more specific information about unsafe sleep practices, and promoting consistency in reporting the cause and classification of death. Child Passenger Safety
Injury deaths are a leading cause of death among children in Kentucky. Based on report findings, the
Child Fatality Review Program identified key data (page 13) to support Kentucky’s efforts to improve child
passenger safety. Kentucky’s booster seat law passed legislation and went into effect July 15, 2008.
Currently the law requires that children less than seven years old and between forty and fifty inches tall
must ride properly restrained in a federally approved booster seat. Booster seats “boost” a child up higher
so that the car's seatbelt fits properly over the child to provide the desired protection from
injury. However, in October 2011, both the American Academy of Pediatrics (AAP) and the National
Highway Traffic Safety Administration recommended that children remain in booster seats until they
reach 4-feet 9-inches tall (57 inches), when the seatbelt should fit properly across their chest and lap,
regardless of the child’s age. The earlier recommendations based on age did not take into account that
children have varying cycles of growth. The new recommendations stress the difference in child body sizes
as more relevant than age. According to the Kentucky Office of Highway Safety, a total of 13 motor vehicle
occupants aged 5 to 9 years died in 2010 and 2011. Of these, over half were not in any restraint, and
others were not using an age-appropriate child safety restraint.
In the last 5 years, significant additional legislation has passed regarding child passenger safety and teen
drivers, including the requirement for booster seats in young children (2008), the graduated driver
licensing for teen drivers (2006), and prohibiting texting and cellular use while driving (July, 2010). As we
continue to track the data, we expect to see improvements in child deaths from motor vehicle collisions
as these laws become widely implemented.
SUMMARY
In 2010, over 600 Kentucky families suffered the loss of a child. Every child death is a tragedy, but even more so if the death was preventable and we did not learn from it to use the information to prevent other children from dying. The Public Health Child Fatality Review Program will continue to use child death data to assist coroners, to identify prevention strategies, and to work with communities to reduce these deaths that are potentially preventable. Priorities for the coming year will focus on improving the state Child Fatality Review system, including more reviews by local teams; promoting safe sleep practices for infants with new information from the CDC; and a continued emphasis on child passenger safety. Together we can work to make policies stronger for children to reduce “preventable” child deaths in the future.
American Academy of Pediatrics, Task Force on Sudden Infant Death Syndrome. (2011). SIDS and other sleep-related infant deaths: expansion of recommendations for a safe infant sleeping environment. Pediatrics, 128(5), 1030-1039. doi: 10.1542/peds.2011-2284.
Centers for Disease Control and Prevention, National Center for Injury Prevention and Control, Division of
Unintentional Injury Prevention (2011). Teen drivers: Fact sheet, Injury prevention & control: Motor vehicle safety. Retrieved 3/28/12 from http://www.cdc.gov/Motorvehiclesafety/Teen_Drivers/teendrivers_factsheet.html. CDC. (2011) Congenital Heart Defects Data & Statistics – United States, 2011. Retrieved on 10/02/2012 http://www.cdc.gov/ncbddd/heartdefects/data.html Kentucky Department of Community Based Services. (2011). Child Abuse and Neglect Annual Report of
Child Fatalities and Near Fatalities State Fiscal Year 2011 (July 1, 2010 to June 30, 2011). Retrieved August 28, 2012 from https://cms.chfs.ky.gov/NR/rdonlyres/0E24608E-DA8A-49E6-A844-504F1E8E472F/0/ANNUALREPORTOFFATALITIESandNEARFATALITIES.PDF
Kentucky Injury Prevention and Research Center. (2012). Kentucky Injury Prevention and Research Center
(KIPRC) 2012 Annual Report on Activities and Impact. Retrieved http://www.kiprc.uky.edu/PDFFiles/KIPRCannualreport2012.pdf
Kentucky Vital Statistics. (2010). Death Certificate Files. Retrieved September 1, 2011. Kentucky Vital Statistics Files; Linked Live Birth and Death Certificate Files; 2002-2010. M.Agovi, personal communication, August 8, 2012 National Center for Injury Prevention and Control. (2012). Vital Signs; Injury The #1 Killer of children in the
U.S. Retrieved September 5, 2012, from http://www.cdc.gov/vitalsigns/ChildInjury/infographic.html?s_cid=bb-vitalsigns-123.
NCHS Data Brief: National Vital Statistics System. Death in the United States, 2010. Volume 58, Number 99. (July 2012). http://www.cdc.gov/nchs/data/databriefs/db99.pdf
Schnitzer et al, 2012: Sudden Unexpected Infant death: Sleep Environment and Circumstances. 2005-2008 data from 9 US states using web-based National child death review case reporting system. Shapiro-Mendoza, C. K., Kimball, M., Tomashek, K. M., Anderson, R. N., & Blanding, S. (2009). US infant mortality trends attributable to accidental suffocation and strangulation in bed from 1984 through 2004: are rates increasing? Pediatrics, 123(2), 533-539. doi: 123/2/533 [pii]10.1542/peds.2007-3746
US Fire Administration. (2009). Rank Order of States by Fire Death Rate in 2009. Retrieved
October 11, 2012 from http://www.usfa.dhs.gov/statistics/estimates/states.shtm.
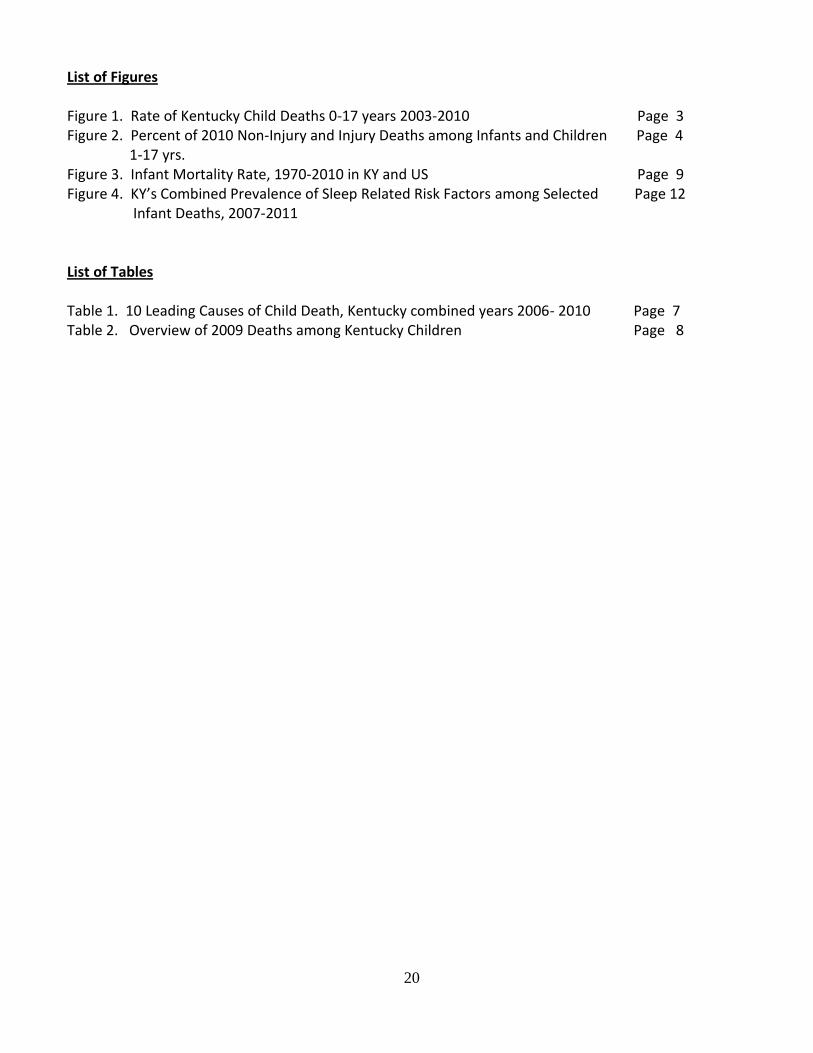
List of Figures Figure 1. Rate of Kentucky Child Deaths 0-17 years 2003-2010 Page 3 Figure 2. Percent of 2010 Non-Injury and Injury Deaths among Infants and Children Page 4
1-17 yrs. Figure 3. Infant Mortality Rate, 1970-2010 in KY and US Page 9 Figure 4. KY’s Combined Prevalence of Sleep Related Risk Factors among Selected Page 12
Infant Deaths, 2007-2011 List of Tables Table 1. 10 Leading Causes of Child Death, Kentucky combined years 2006- 2010 Page 7 Table 2. Overview of 2009 Deaths among Kentucky Children Page 8