154
Public Health Screening Programme Annual Report 1 April 2016 to 31 March 2017 Published: 23 January 2018 Public Health – Health Services
Public Health Screening Programme
Annual Report
1 April 2016 to 31 March 2017
Published: 23 January 2018 Public Health – Health Services

Table of Contents
Section 1 – Pregnancy and Newborn and Child Vision Screening
Chapter 1 - Pregnancy Screening ........................................................................... 1
Chapter 2 - Newborn Bloodspot Screening ......................................................... 33
Chapter 3 - Universal Newborn Hearing Screening ............................................. 46
Chapter 4 - Child Vision Screening ....................................................................... 54
Section 2 – Adult Screening
Chapter 5 - Abdominal Aortic Aneurysm Screening ........................................... 73
Chapter 6 - Bowel Screening Programme ............................................................ 86
Chapter 7 - Breast Screening Programme ......................................................... 103
Chapter 8 - Cervical Screening ........................................................................... 110
Chapter 9 - Diabetic Retinopathy Screening ...................................................... 137
Introduction This annual report presents information about the following screening programmes period 2016/17:
1. Pregnancy Screening:
Antenatal Haemoglobinopathies screening
Communicable Diseases in Pregnancy
Down’s syndrome and other congenital anomalies
2. Newborn Screening:
Newborn Bloodspot
Universal Newborn Hearing
3. Child Vision Screening
4. Aortic Abdominal Aneurysm Screening
5. Bowel Screening
6. Breast Screening
7. Cervical Screening
8. Diabetic Retinopathy Screening
The report includes analysis of uptake among people with learning disabilities and uptake by ethnicity. The purpose of screening is to detect early disease or risk factors among people who have not yet developed symptoms. Early management should result in better outcomes. Screening programmes do not detect all cases of disease and will be positive among some people who are healthy. They therefore contribute to early detection but do not obviate the need for detecting and treating symptomatic patients.
Section 1
Pregnancy & Newborn Screening
1
Chapter 1 - Pregnancy Screening Summary During 2016/17, of 15,998 women booked to attend antenatal clinics in NHSGCC 13,278 (83%) were NHSGGC residents. 9,451 women (71.2%) were White British, 1009 (7.6%) Asian, 192 (4.1%) Chinese and 496 (3.7%) of any other ethnic origin. 10,394 (86%) of first antenatal booking appointments were offered within 12 weeks gestational age. Gestational Diabetes Mellitus (GDM) and Obesity Within NHSGGC, the assessment of pregnant women and risks associated with GDM are based on a BMI>= 35, previous macrosomic baby (weighing >4kg at birth), family history of diabetes, previous gestational diabetes and mother’s ethnic origin. 3,912 (24%) of bookers were recorded as having ‘any risk ‘of GDM and were offered an OGTT at 24-28 weeks gestation. Only 5,832 (43.9%) of pregnant women had a normal weight at the time of their first antenatal booking appointment. 3,700 (27.9%) pregnant women were overweight and 1861(14%) obese and 1168 (8.8%) severely obese (35<=BMI >=45). Haemoglobinopathies Screening Of the 13,278 women booked for their first antenatal booking, 12,995 (97.9%) consented to haemoglobinopathies screening, 18 declined and 265 were not asked. The Family Origin Questionnaire (FOQ) is completed as part of routine early antenatal risk assessment. For low prevalence areas like NHSGGC, it provides the basis for testing for haemoglobin variants and in the interpretation of results and the need for partner testing. 12,840 (98.8%) women had a completed FOQ. The samples tested for haemoglobinopathies identified 35 as sickle cell carriers (HbAS), 7 women as Hb D carriers (HbAD) and 6 women as HbE carriers (HbAE). 11,188 women were screened for antenatal haemoglobinopathies and 117 men had to be offered partner testing as they were either from a high risk area or due to the women’s test results. Less than 5 women were identified with a foetus ‘at high risk’ for major haemoglobinopathy. The screening for thalassaemia showed that there were 50 (0.44%) Beta thalassaemia carriers and 740 possible alpha zero thalassaemia carriers and/or iron deficiency.

2
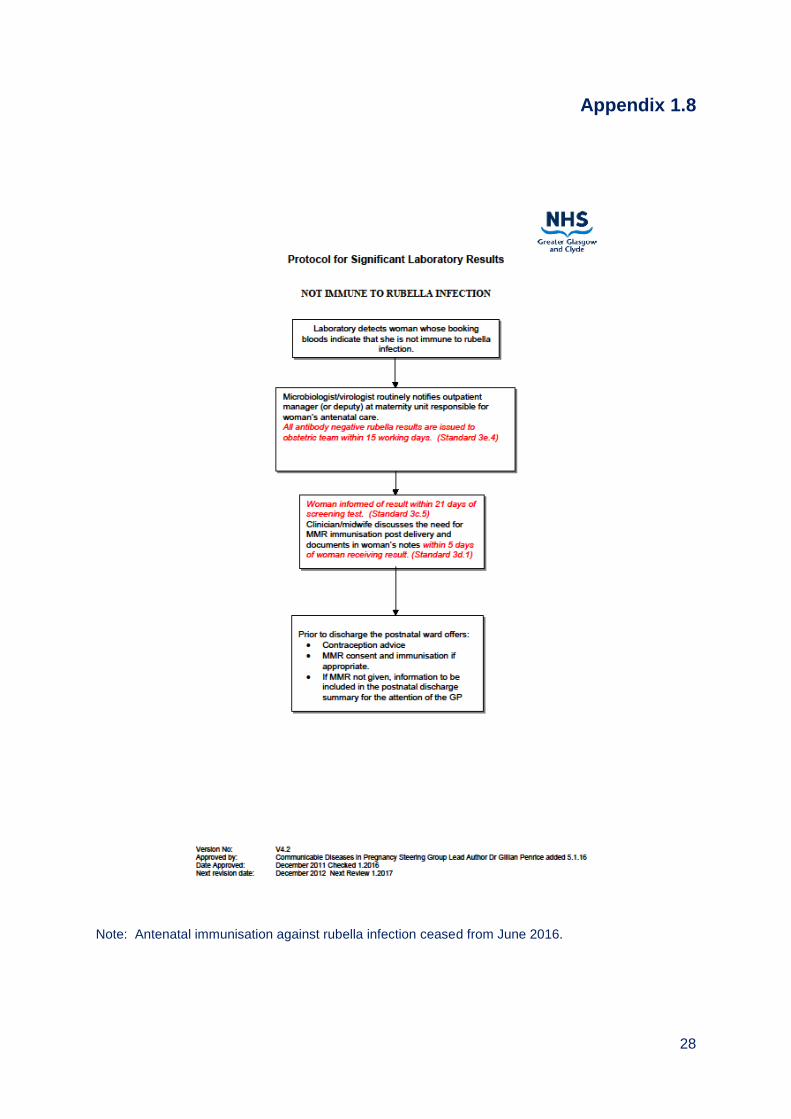
Communicable diseases Uptake was greater than 99% for all of the communicable diseases in pregnancy screening tests. Screening identified 15 women infected with HIV (13 were previously known); 48 women were infected with hepatitis B (22 were previously known) and 5 women infected with syphilis. 579 (22.4%) women were identified as susceptible to rubella and were offered immunisation with MMR vaccine after delivery. Down’s syndrome and other congenital anomalies screening Of the 13,278 women booked at antenatal clinics, 10,887 (82%) consented for either a 1st or 2nd Trimester Down’s syndrome screening. Of these 7053 (64.8%) of samples were taken in the 1st Trimester and 1832 (16.8%) in the 2nd Trimester. There were 240 (2.7%) high risk results recorded for Down’s syndrome for both Trimesters. 198 amniocentesis samples were analysed and 32 abnormalities detected (16.1%) and of these 21 (10.6%) had a diagnosis of trisomy 21 (Down’s syndrome). 91 chorionic villus biopsies were analysed and 28 abnormalities detected (30.7% of tests) and 19 of those (20.9% of tests) had a diagnosis of trisomy 21(Down’s syndrome). Congenital anomalies screening 9,929 (76.6%) fetal anomaly scans were performed and 163 anomalies detected; 50 were confirmed postnatally and the outcomes for 53 are not known. The phrase less than five has been used in line with NHS Scotland information governance which is intended to protect privacy and avoid identifying individuals.
3
Table Of Contents
1.1. Aims of Pregnancy Screening Programmes................................................... 4
1.2. Eligible Population ............................................................................................ 4
1.3. The Screening Tests ......................................................................................... 4
1.4. Delivery of NHSGGC Pregnancy Screening Programmes ............................. 5
1.5. Gestational Diabetes Mellitus (GDM) ............................................................... 7
1.6. Body Mass Index (BMI) and Pregnant Women ............................................... 7
1.7. NHSGGC Antenatal Haemoglobinopathies Screening Programme .............. 9
1.8. NHSGGC Communicable Diseases in Pregnancy Screening ..................... 12
1.9. NHSGGC Down’s Syndrome and Other Congenital Anomalies Screening Programme ............................................................................................................. 13
1.10.1st and 2nd Trimester Down’s Syndrome Testing ......................................... 13
1.11. Amniocentesis ............................................................................................... 15
1.12. Chorionic Villus Biopsies (CVS) ................................................................... 15
1.13. Other Congenital Anomalies Screening ...................................................... 16
1.14. Information Systems ..................................................................................... 18
1.15. Challenges and Priorities ............................................................................. 18

4
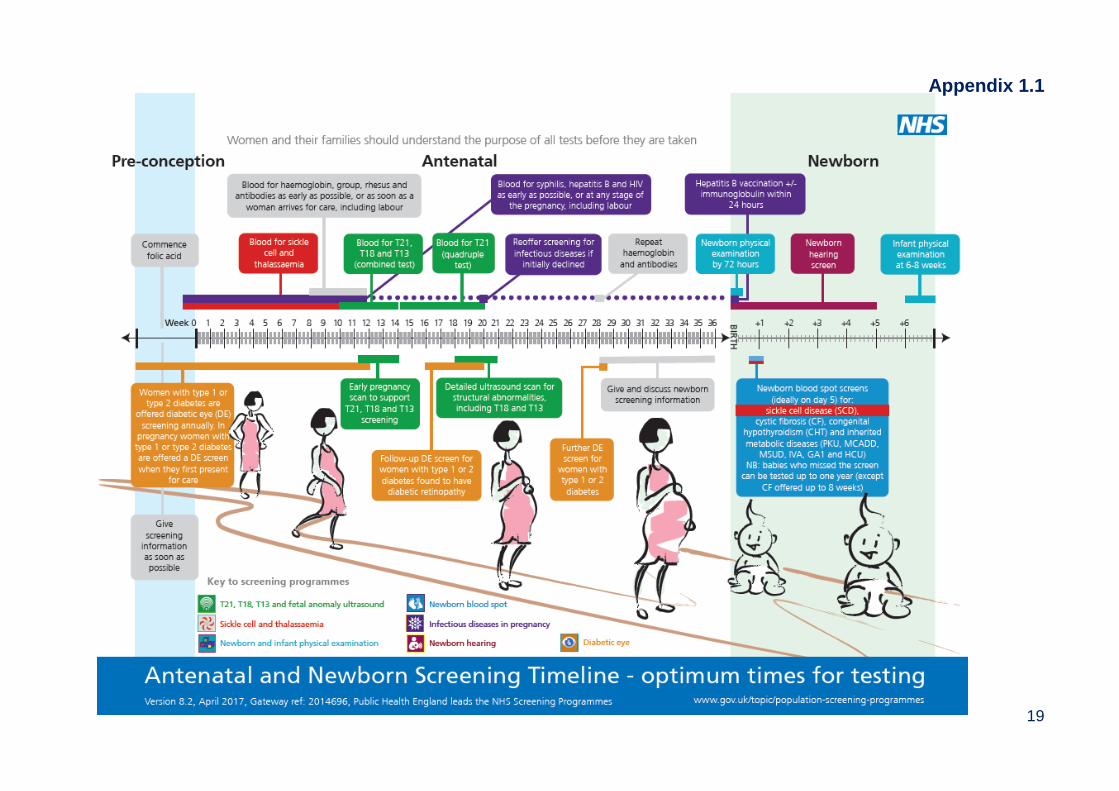
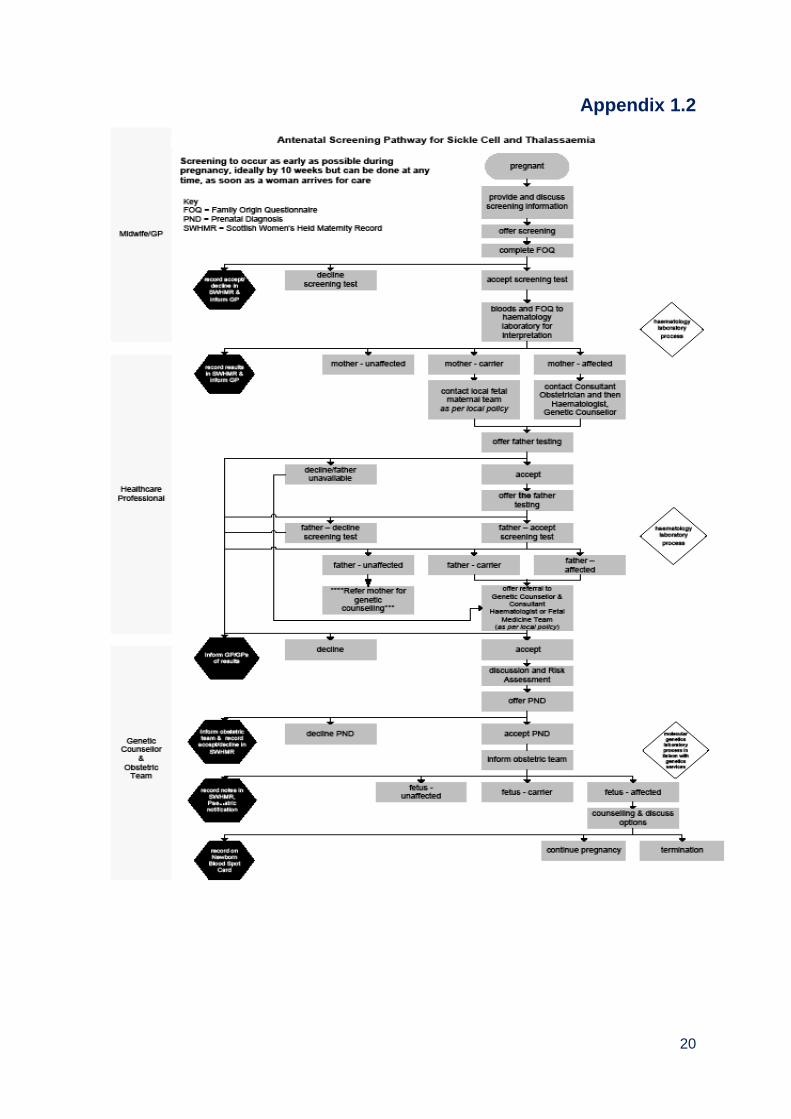
1.1. Aims of Pregnancy Screening Programmes Antenatal haemoglobinopathies screening for sickle cell and thalassaemia aims to identify couples who are at risk of having an affected child and thereby offer them information on which to base reproductive choices. Communicable diseases in pregnancy screening aims to identify infection and ensure a plan for treatment and management of affected individuals and their babies is put in place at the earliest opportunity. Screening allows undiagnosed infection to be identified and treatment to be given, which can reduce the risk of mother to child transmission, improve the long-term outcome and development of affected children, and ensure that women, their partners and families are offered appropriate referral, testing and treatment. Down’s syndrome and other congenital anomalies screening aims to detect Down’s syndrome and other congenital anomalies in the antenatal period. This provides women and their partners with informed choice regarding continuation of pregnancy. It also allows, where appropriate, management options (such as cardiac surgery or delivery in a specialist unit) to be offered in the antenatal period. 1.2. Eligible Population The pregnancy screening programmes are offered universally to all pregnant women during antenatal visits. 1.3. The Screening Tests Appendix 1.1 illustrates the gestational age when pregnancy tests are carried out. All pregnant women are offered pregnancy screening for the following conditions. Antenatal haemoglobinopathies screening The pregnant woman and her partner are asked to complete a family origin questionnaire (see appendix 1.10). The information from the questionnaire is used to assess the risk of either parent being a carrier for sickle cell and other haemoglobin variants. In addition, a blood test is taken at the first antenatal booking to screen the woman for sickle cell, thalassaemia and other haemoglobin variants. Where testing shows that the woman is a carrier, the baby's father will also be offered testing. The full screening pathway is shown in Appendix 1.2. Screening for sickle cell disorders and thalassaemia should be offered to all women as early as possible in pregnancy, and ideally by 10 weeks for women to make a decision on whether to continue with the pregnancy.
5
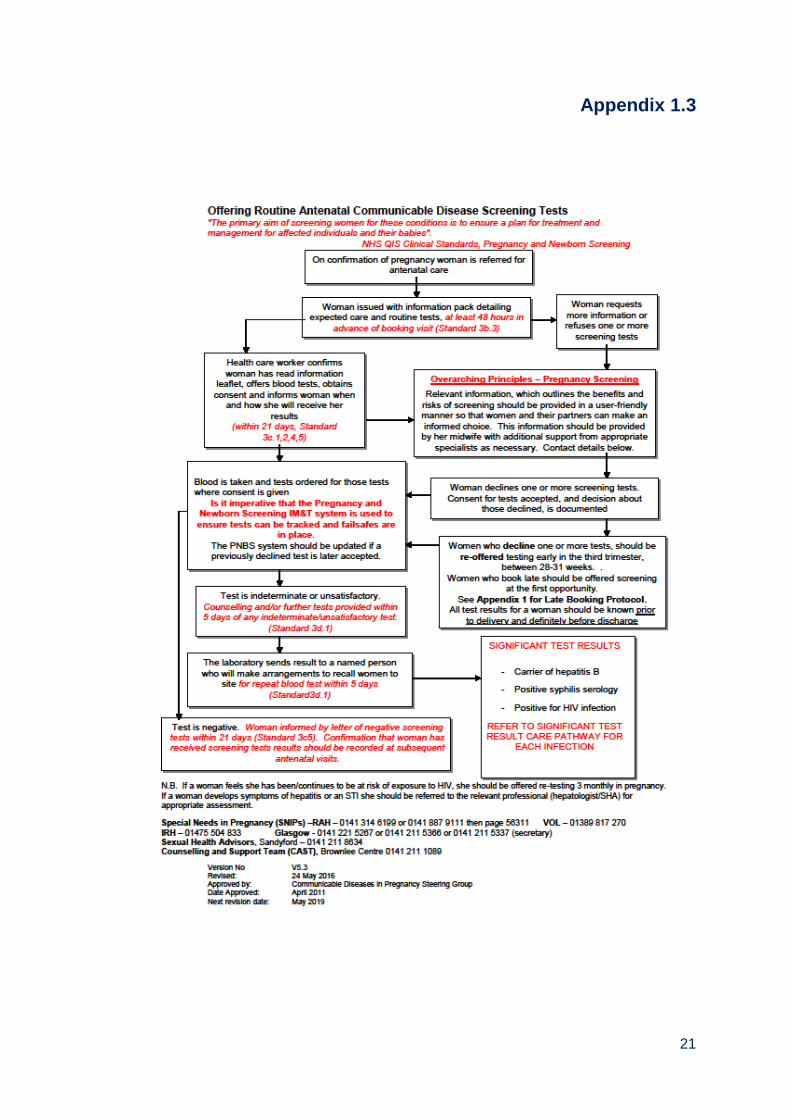
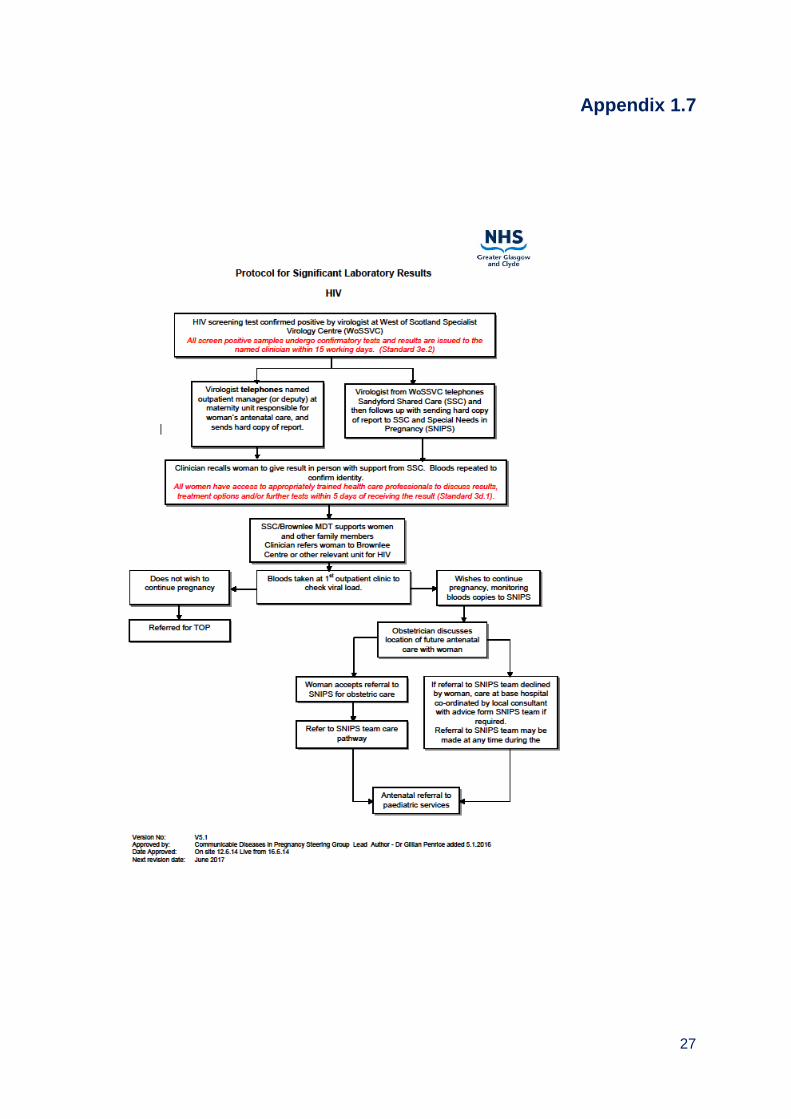
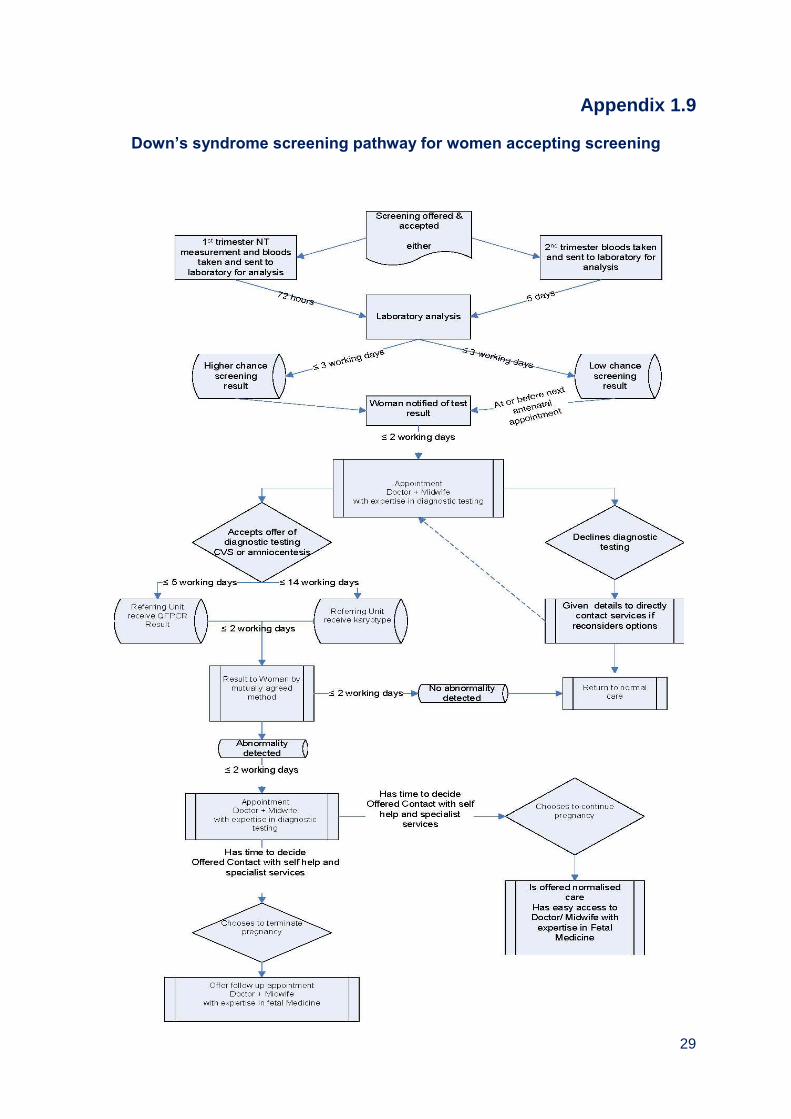
Communicable diseases in pregnancy screening Testing for HIV, hepatitis B, syphilis infection and immunity to rubella is carried out at first antenatal booking when a blood sample is taken. The full screening pathway is shown in Appendices 1.3 – 1.8. Down’s syndrome and other congenital anomalies Screening for Down’s syndrome can be carried out using two different screening methods depending on gestational age. The screening tests, using blood and ultrasound scans, together with maternal risk factors, are used to derive an overall risk of having a baby with Down’s syndrome. The full screening pathway is shown in Appendix 1.9. Ultrasound scanning is used to look for other congenital anomalies between 18 and 21 weeks. The decision to accept screening for Down’s syndrome and other congenital anomalies raises particular moral and ethical issues for women. Uptake of Down’s syndrome or other congenital anomalies screening depends on whether women would wish further investigation or management.
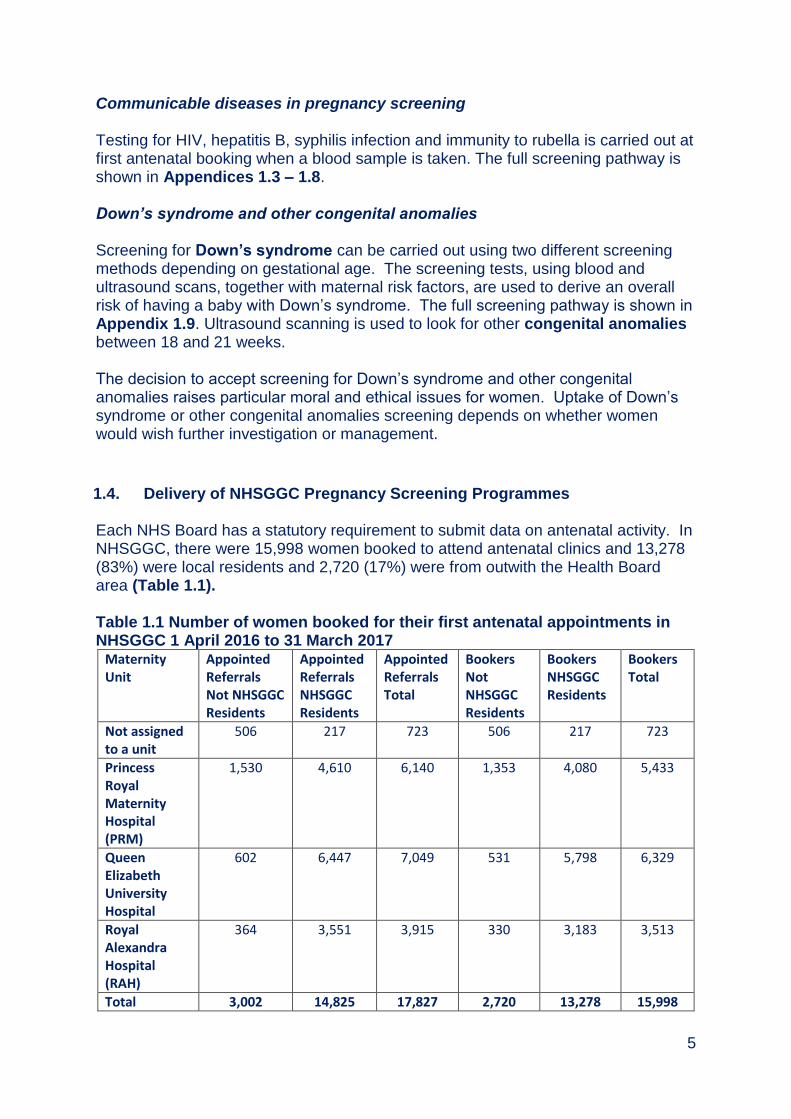
1.4. Delivery of NHSGGC Pregnancy Screening Programmes Each NHS Board has a statutory requirement to submit data on antenatal activity. In NHSGGC, there were 15,998 women booked to attend antenatal clinics and 13,278 (83%) were local residents and 2,720 (17%) were from outwith the Health Board area (Table 1.1). Table 1.1 Number of women booked for their first antenatal appointments in NHSGGC 1 April 2016 to 31 March 2017
Maternity Unit
Appointed Referrals Not NHSGGC Residents
Appointed Referrals NHSGGC Residents
Appointed Referrals Total
Bookers Not NHSGGC Residents
Bookers NHSGGC Residents
Bookers Total
Not assigned to a unit
506 217 723 506 217 723
Princess Royal Maternity Hospital (PRM)
1,530 4,610 6,140 1,353 4,080 5,433
Queen Elizabeth University Hospital
602 6,447 7,049 531 5,798 6,329
Royal Alexandra Hospital (RAH)
364 3,551 3,915 330 3,183 3,513
Total 3,002 14,825 17,827 2,720 13,278 15,998
6
Source: Pregnancy & Newborn Screening System, July 2016
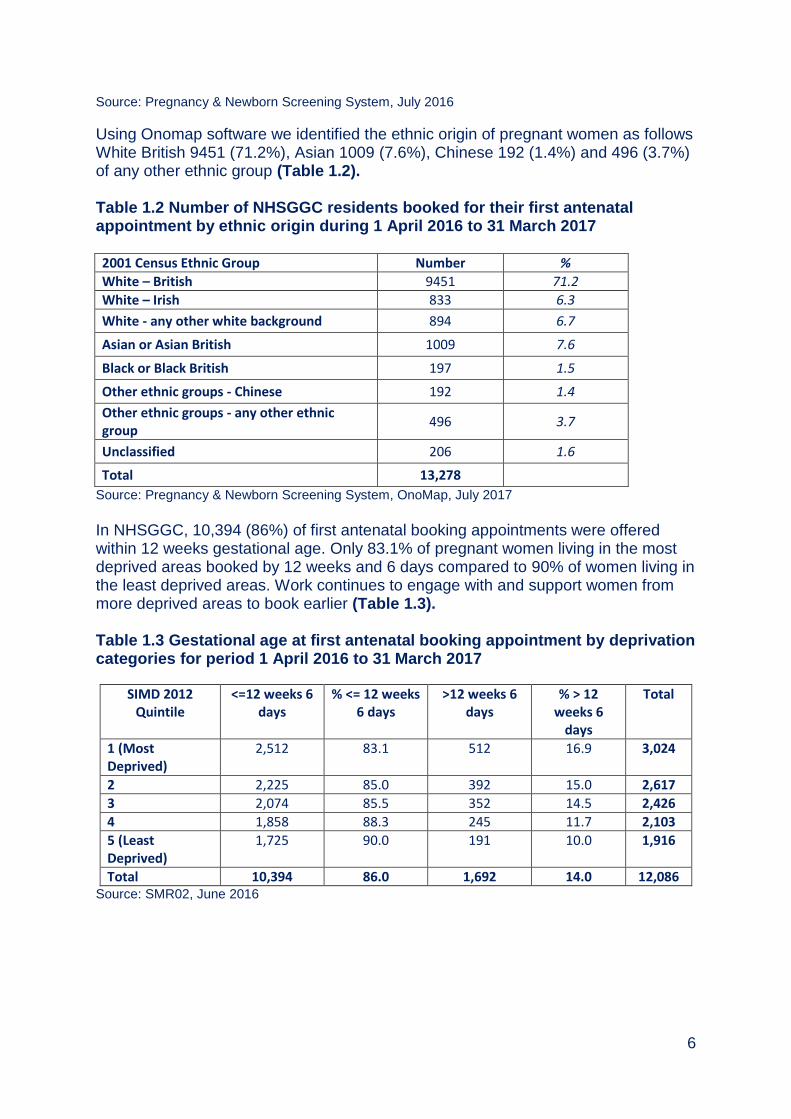
Using Onomap software we identified the ethnic origin of pregnant women as follows White British 9451 (71.2%), Asian 1009 (7.6%), Chinese 192 (1.4%) and 496 (3.7%) of any other ethnic group (Table 1.2). Table 1.2 Number of NHSGGC residents booked for their first antenatal appointment by ethnic origin during 1 April 2016 to 31 March 2017 2001 Census Ethnic Group Number %
White – British 9451 71.2
White – Irish 833 6.3
White - any other white background 894 6.7
Asian or Asian British 1009 7.6
Black or Black British 197 1.5
Other ethnic groups - Chinese 192 1.4
Other ethnic groups - any other ethnic group
496 3.7
Unclassified 206 1.6
Total 13,278
Source: Pregnancy & Newborn Screening System, OnoMap, July 2017
In NHSGGC, 10,394 (86%) of first antenatal booking appointments were offered within 12 weeks gestational age. Only 83.1% of pregnant women living in the most deprived areas booked by 12 weeks and 6 days compared to 90% of women living in the least deprived areas. Work continues to engage with and support women from more deprived areas to book earlier (Table 1.3). Table 1.3 Gestational age at first antenatal booking appointment by deprivation categories for period 1 April 2016 to 31 March 2017
SIMD 2012 Quintile
<=12 weeks 6 days
% <= 12 weeks 6 days
>12 weeks 6 days
% > 12 weeks 6
days
Total
1 (Most Deprived)
2,512 83.1 512 16.9 3,024
2 2,225 85.0 392 15.0 2,617
3 2,074 85.5 352 14.5 2,426
4 1,858 88.3 245 11.7 2,103
5 (Least Deprived)
1,725 90.0 191 10.0 1,916
Total 10,394 86.0 1,692 14.0 12,086 Source: SMR02, June 2016
7
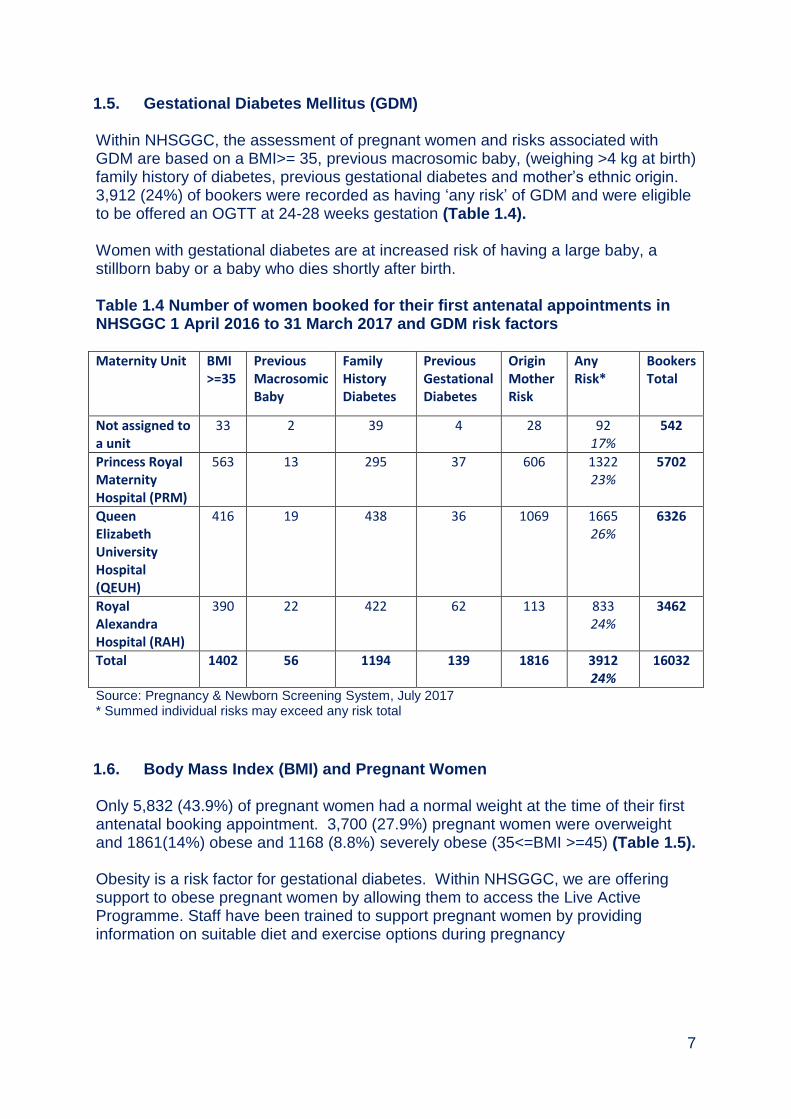
1.5. Gestational Diabetes Mellitus (GDM) Within NHSGGC, the assessment of pregnant women and risks associated with GDM are based on a BMI>= 35, previous macrosomic baby, (weighing >4 kg at birth) family history of diabetes, previous gestational diabetes and mother’s ethnic origin. 3,912 (24%) of bookers were recorded as having ‘any risk’ of GDM and were eligible to be offered an OGTT at 24-28 weeks gestation (Table 1.4). Women with gestational diabetes are at increased risk of having a large baby, a stillborn baby or a baby who dies shortly after birth. Table 1.4 Number of women booked for their first antenatal appointments in NHSGGC 1 April 2016 to 31 March 2017 and GDM risk factors Maternity Unit BMI
>=35 Previous Macrosomic Baby
Family History Diabetes
Previous Gestational Diabetes
Origin Mother Risk
Any Risk*
Bookers Total
Not assigned to a unit
33 2 39 4 28 92 17%
542
Princess Royal Maternity Hospital (PRM)
563 13 295 37 606 1322 23%
5702
Queen Elizabeth University Hospital (QEUH)
416 19 438 36 1069 1665 26%
6326
Royal Alexandra Hospital (RAH)
390 22 422 62 113 833 24%
3462
Total 1402 56 1194 139 1816 3912 24%
16032
Source: Pregnancy & Newborn Screening System, July 2017 * Summed individual risks may exceed any risk total
1.6. Body Mass Index (BMI) and Pregnant Women Only 5,832 (43.9%) of pregnant women had a normal weight at the time of their first antenatal booking appointment. 3,700 (27.9%) pregnant women were overweight and 1861(14%) obese and 1168 (8.8%) severely obese (35<=BMI >=45) (Table 1.5). Obesity is a risk factor for gestational diabetes. Within NHSGGC, we are offering support to obese pregnant women by allowing them to access the Live Active Programme. Staff have been trained to support pregnant women by providing information on suitable diet and exercise options during pregnancy

8
Table 1.5 Number and percentage of women booked for their first antenatal appointments by body mass index and by maternity unit from 1 April 2016 to 31 March 2017
Maternity Unit
BMI Category Not
Assigned
to a Unit
% Princess Royal
Maternity
Hospital (PRM)
% Queen
Elizabeth
University
Hospital
(QEUH)
% Royal
Alexandra
Hospital
(RAH)
% Total %
BMI Not Recorded
38 17.5 132 3.2 124 2.1 20 0.6 314 2.4
Underweight BMI<18.5
8 3.7 119 2.9 198 3.4 78 2.5 403 3.0
Normal 18.5<=BMI<25
76 35.0 1,660 40.7 2,789 48.1 1,307 41.1 5,832 43.9
Overweight 25<=BMI<30
42 19.4 1,172 28.7 1,588 27.4 898 28.2 3,700 27.9
Obese 30<=BMI<30
33 15.2 593 14.5 718 12.4 517 16.2 1,861 14.0
Severely Obese 35<=BMI<40
10 4.6 253 6.2 270 4.7 254 8.0 787 5.9
Severely Obese 40<=BMI<45
9 4.1 102 2.5 79 1.4 82 2.6 272 2.0
Severely Obese BMI>=45
1 0.5 49 1.2 32 0.6 27 0.8 109 0.8
Total 217 4,080 5,798 3,183 13,278 Source: PNBS
9
1.7. NHSGGC Antenatal Haemoglobinopathies Screening Programme Haemoglobinopathies
The haemoglobinopathies are a large group of inherited blood disorders which affect the haemoglobin (oxygen carrying) component of blood. They fall into two main groups – the haemoglobin variants (such as sickle cell disorders) which are associated with the production of abnormal forms of haemoglobin, and the Thalassaemias in which there is an abnormality in the amount of haemoglobin produced.
Sickle cell disorders, caused by a haemoglobin variant, often result in severe life threatening clinical symptoms. Those with beta thalassaemia major require regular blood transfusions to maintain life. All pregnant women will be offered screening for thalassaemia based on a low prevalence screening model.
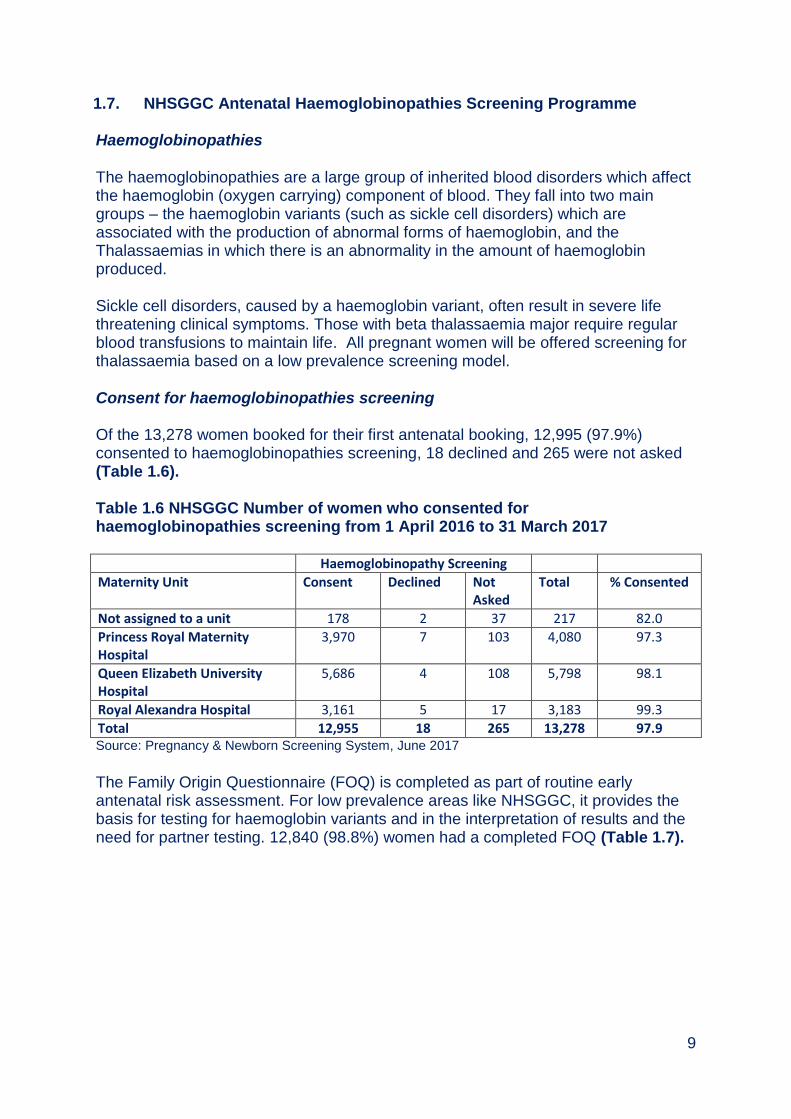
Consent for haemoglobinopathies screening Of the 13,278 women booked for their first antenatal booking, 12,995 (97.9%) consented to haemoglobinopathies screening, 18 declined and 265 were not asked (Table 1.6). Table 1.6 NHSGGC Number of women who consented for haemoglobinopathies screening from 1 April 2016 to 31 March 2017 Haemoglobinopathy Screening
Maternity Unit Consent Declined Not Asked
Total % Consented
Not assigned to a unit 178 2 37 217 82.0
Princess Royal Maternity Hospital
3,970 7 103 4,080 97.3
Queen Elizabeth University Hospital
5,686 4 108 5,798 98.1
Royal Alexandra Hospital 3,161 5 17 3,183 99.3
Total 12,955 18 265 13,278 97.9 Source: Pregnancy & Newborn Screening System, June 2017
The Family Origin Questionnaire (FOQ) is completed as part of routine early antenatal risk assessment. For low prevalence areas like NHSGGC, it provides the basis for testing for haemoglobin variants and in the interpretation of results and the need for partner testing. 12,840 (98.8%) women had a completed FOQ (Table 1.7).

10
Table 1.7 Number of women who completed FOQ from 1 April 2016 to 31 March 2017 in NHSGGC Family Origin Questionnaire
Maternity Unit Completed Not Completed
Total % Completed
Not assigned to a unit 171 7 178 96.1
Princess Royal Maternity Hospital (PRM)
3898 72 3970 98.2
Queen Elizabeth University Hospital (QEUH)
5618 68 5686 98.8
Royal Alexandra Hospital (RAH) 3153 8 3161 99.7
Total 12840 155 12995 98.8
Source: Pregnancy & Newborn Screening System, June 2017
11,188 women were tested for antenatal haemoglobinopathies screening, Less than 5 women were identified with a foetus ‘at high risk’ for major haemoglobinopathy. Partner testing should have been offered to 117 men as they were either from a high risk area or due to the women’s test results (Table 1.8). Table 1.8 Antenatal Haemoglobinopathy screening outcome by Maternity hub, for the period 1 April 2016 to 31 March 2017
Source: Pregnancy & Newborn Screening System, June 2017
The samples tested for haemoglobinopathies identified 35 as sickle cell carriers (HbAS), 7 women as Hb D carriers (HbAD) and 6 women as HbE carriers (HbAE) (Table 1.9).
Hub
Antenatal Haemoglobinopathies Screening Outcome
Not assigned to
a unit
Princess Royal
Maternity Hospital (PRM)
Queen Elizabeth
University Hospital (QEUH)
Royal Alexandra Hospital
(RAH)
Total
Foetus at risk for major haemoglobinopathy.
0 0 <5 0 <5
Foetus not at risk for major haemoglobinopathy.
0 1 14 0 15
None Recorded 2 181 22 9 214
Partner testing not required as woman from a low risk area.
<5 67 142 16 228
Partner testing not required.
115 3182 4600 2714 10611
Partner testing should be offered if from high risk area.
<5 <5 9 <5 15
Partner testing should be offered.
<5 45 48 6 102
Total 124 3479 4838 2747 11188
11
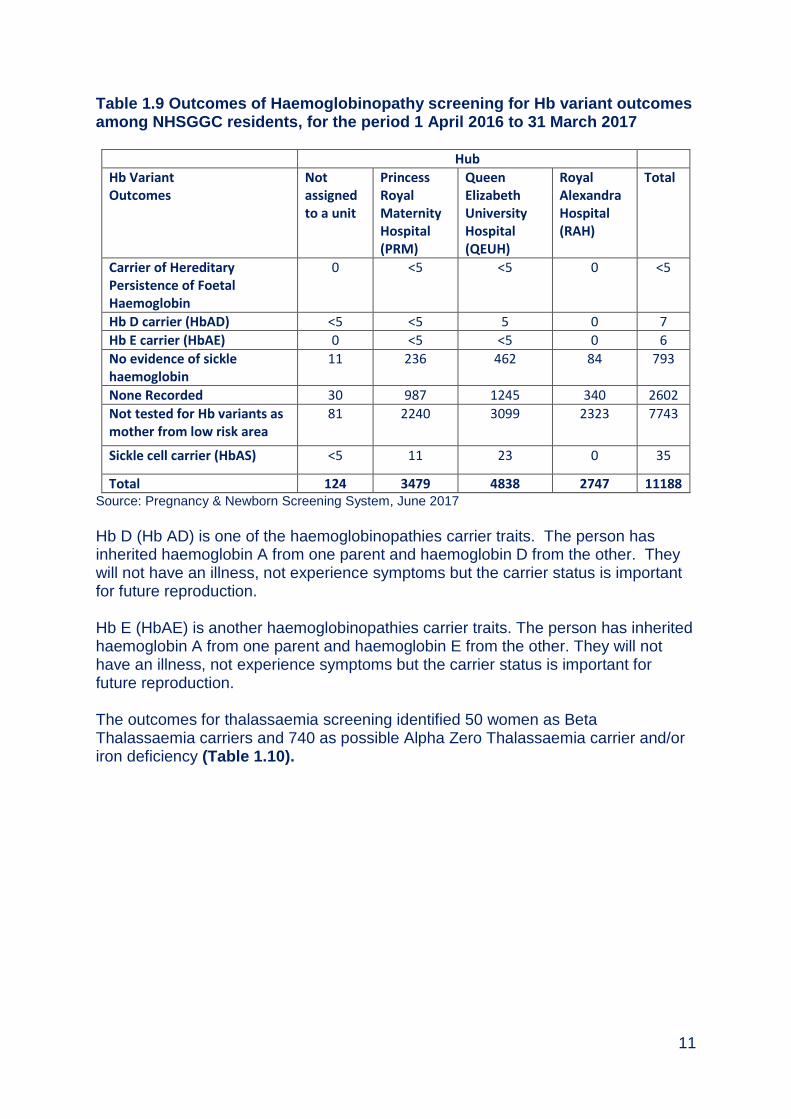
Table 1.9 Outcomes of Haemoglobinopathy screening for Hb variant outcomes among NHSGGC residents, for the period 1 April 2016 to 31 March 2017
Hub
Hb Variant Outcomes
Not assigned to a unit
Princess Royal Maternity Hospital (PRM)
Queen Elizabeth University Hospital (QEUH)
Royal Alexandra Hospital (RAH)
Total
Carrier of Hereditary Persistence of Foetal Haemoglobin
0 <5 <5 0 <5
Hb D carrier (HbAD) <5 <5 5 0 7
Hb E carrier (HbAE) 0 <5 <5 0 6
No evidence of sickle haemoglobin
11 236 462 84 793
None Recorded 30 987 1245 340 2602
Not tested for Hb variants as mother from low risk area
81 2240 3099 2323 7743
Sickle cell carrier (HbAS) <5 11 23 0 35
Total 124 3479 4838 2747 11188 Source: Pregnancy & Newborn Screening System, June 2017
Hb D (Hb AD) is one of the haemoglobinopathies carrier traits. The person has inherited haemoglobin A from one parent and haemoglobin D from the other. They will not have an illness, not experience symptoms but the carrier status is important for future reproduction. Hb E (HbAE) is another haemoglobinopathies carrier traits. The person has inherited haemoglobin A from one parent and haemoglobin E from the other. They will not have an illness, not experience symptoms but the carrier status is important for future reproduction. The outcomes for thalassaemia screening identified 50 women as Beta Thalassaemia carriers and 740 as possible Alpha Zero Thalassaemia carrier and/or iron deficiency (Table 1.10).
12
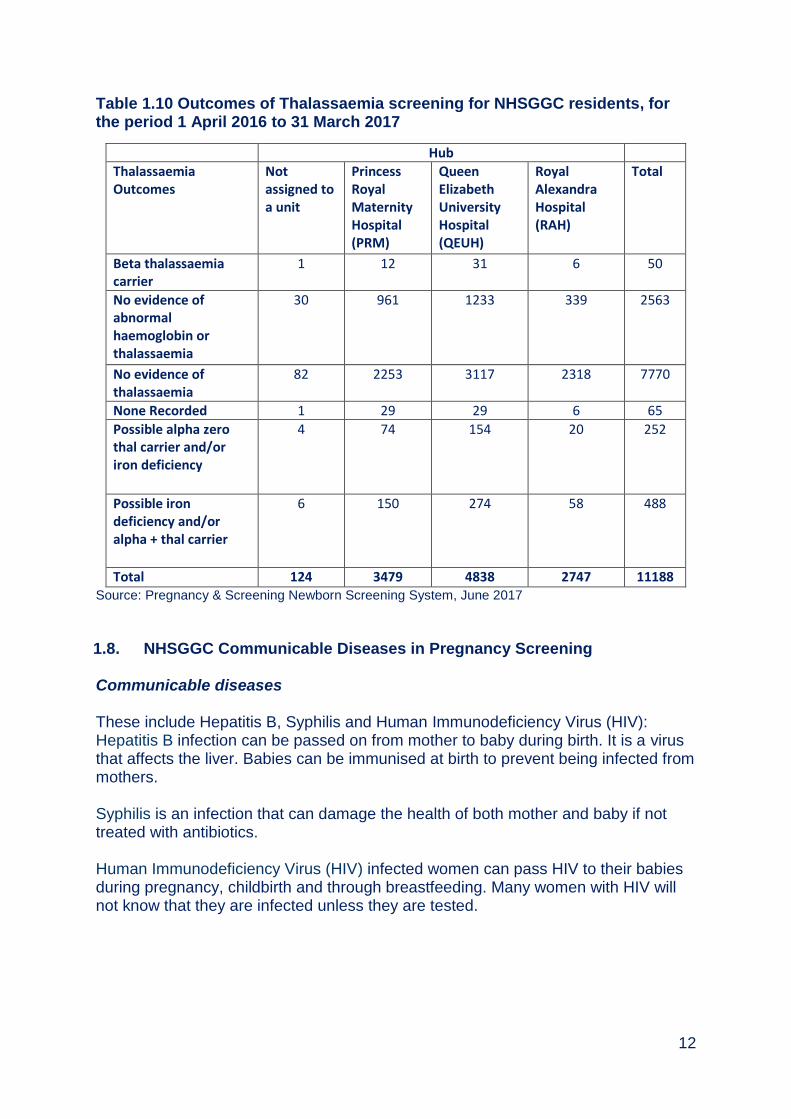
Table 1.10 Outcomes of Thalassaemia screening for NHSGGC residents, for the period 1 April 2016 to 31 March 2017
Hub
Thalassaemia Outcomes
Not assigned to a unit
Princess Royal Maternity Hospital (PRM)
Queen Elizabeth University Hospital (QEUH)
Royal Alexandra Hospital (RAH)
Total
Beta thalassaemia carrier
1 12 31 6 50
No evidence of abnormal haemoglobin or thalassaemia
30 961 1233 339 2563
No evidence of thalassaemia
82 2253 3117 2318 7770
None Recorded 1 29 29 6 65
Possible alpha zero thal carrier and/or iron deficiency
4 74 154 20 252
Possible iron deficiency and/or alpha + thal carrier
6 150 274 58 488
Total 124 3479 4838 2747 11188 Source: Pregnancy & Screening Newborn Screening System, June 2017
1.8. NHSGGC Communicable Diseases in Pregnancy Screening Communicable diseases These include Hepatitis B, Syphilis and Human Immunodeficiency Virus (HIV): Hepatitis B infection can be passed on from mother to baby during birth. It is a virus that affects the liver. Babies can be immunised at birth to prevent being infected from mothers. Syphilis is an infection that can damage the health of both mother and baby if not treated with antibiotics. Human Immunodeficiency Virus (HIV) infected women can pass HIV to their babies during pregnancy, childbirth and through breastfeeding. Many women with HIV will not know that they are infected unless they are tested.

13
Screening tests and results for Communicable diseases An estimate of the percentage uptake of each of the tests has been calculated by dividing the number requesting the test by the total number of samples. The number of women referred for booking cannot be used as the denominator to calculate uptake as it is does not accurately represent the number of women who have been offered screening. Some women would not have been offered screening because they have had an early pregnancy loss. A small number of women will transfer out of the health board area. Uptake across NHSGGC was greater than 99% for all of the screening tests (Table 1.11). Table 1.11 NHSGGC Communicable diseases tests and results
1 April 2016 – 31 March 2017 Results
Total Number of samples
No. Requesting individual test
No. Not requesting individual test
Uptake Antibody detected1,2,3
Antibody not detected4
(N) (N) (N) % (N) % (N) %
HIV 15768 15746 22 99.9 151 0.1 15731 99.9
HBV 15767 15751 16 99.9 482 0.3 15703 99.7
Rubella 25863 2583 3 99.9 20044
77.6 5795 22.4
Syphilis 15769 15747 22 99.9 5 0.03 15742 99.97 Sources: West of Scotland Specialist Virology Centre Notes: 1. 13 of the 15 HIV infections were previously known about 2. 22 of the 48 HBV infections were previously known about 3. Rubella screening was discontinued on 1
st June 2016
4. Rubella antibody detected means that the woman is immune to rubella 5. No antibody detected means that the woman is susceptible to rubella and should be offered
immunisation with MMR vaccine after delivery
1.9. NHSGGC Down’s syndrome and Other Congenital Anomalies Screening Programme
Down’s syndrome is characterised an extra copy of chromosome 21 (trisomy 21) and older mothers are more likely to have a baby with Down’s syndrome although it can occur in women of any age.
1.10. 1st and 2nd Trimester Down’s syndrome Testing Of the 13,278 women booked at antenatal clinics, 10,887 (82%) consented for either a 1st or 2nd Trimester Down’s syndrome screening. Of these 7053 (64.8%) of samples were taken in the 1st Trimester and 1832 (16.8%) in the 2nd Trimester. There were 240 (2.7%) high risk results recorded for Down’s syndrome for both Trimesters (Table 1.12).

14
Table 1.12 NHS Greater Glasgow & Clyde Residents. Women who gave consent for Down's screening and sample taken either at 1st or 2nd Trimester & Overall Risk Booked Number
consented either 1st or 2nd trimester
% consented either 1st or 2nd trimester
Number sample taken 1st or 2nd trimester
Number sample taken 1st trimester
% sample taken 1st trimester
Number sample taken 2nd trimester
% sample taken 2nd trimester
Number high risk results
% high risk results
Not assigned to a unit
217 150 69.1 98 75 50.0 24 16.0 2 2.0
Princess Royal Maternity Hospital (PRM)
4080 3607 88.4 2982 2364 65.5 632 17.5 81 2.7
Queen Elizabeth University Hospital (QEUH)
5798 4853 83.7 3928 3126 64.4 806 16.6 122 3.1
Royal Alexandra Hospital (RAH)
3183 2277 71.5 1854 1488 65.3 370 16.2 35 1.9
Total 13,278 10,887 82.0 8,862 7,053 64.8 1,832 16.8 240 2.7 Source: PNBS
15
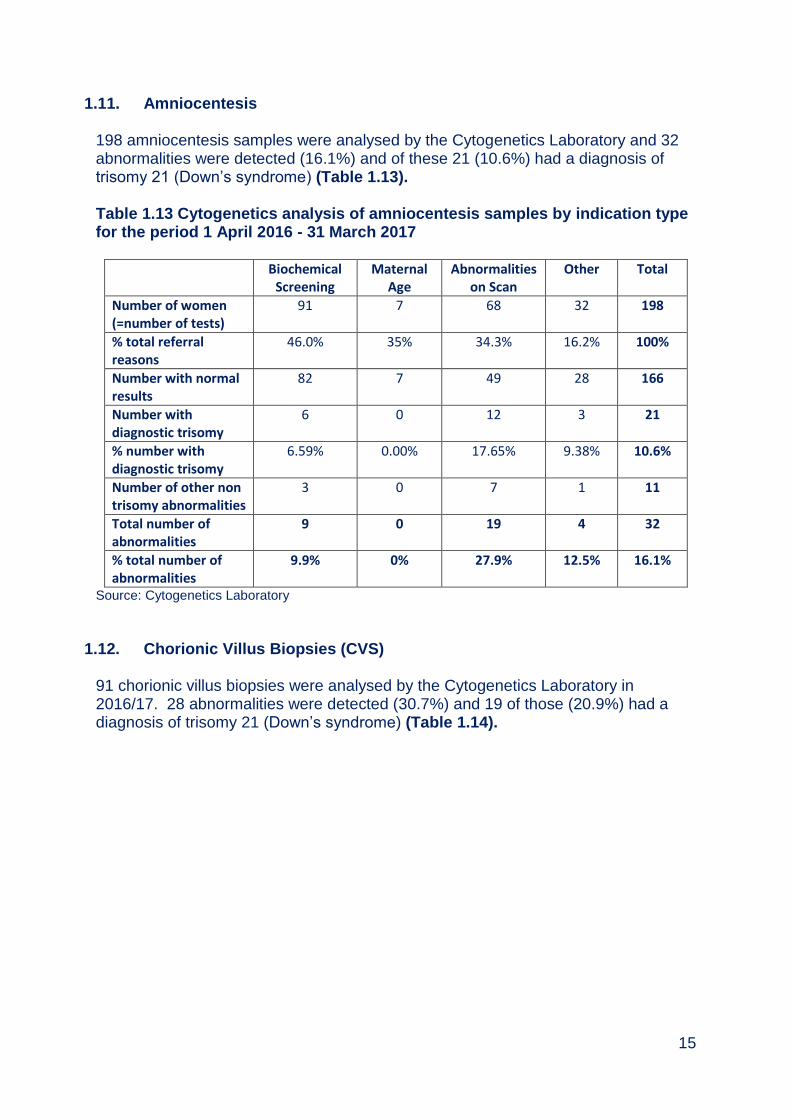
1.11. Amniocentesis 198 amniocentesis samples were analysed by the Cytogenetics Laboratory and 32 abnormalities were detected (16.1%) and of these 21 (10.6%) had a diagnosis of trisomy 21 (Down’s syndrome) (Table 1.13). Table 1.13 Cytogenetics analysis of amniocentesis samples by indication type for the period 1 April 2016 - 31 March 2017
Biochemical Screening
Maternal Age
Abnormalities on Scan
Other Total
Number of women (=number of tests)
91 7 68 32 198
% total referral reasons
46.0% 35% 34.3% 16.2% 100%
Number with normal results
82 7 49 28 166
Number with diagnostic trisomy
6 0 12 3 21
% number with diagnostic trisomy
6.59% 0.00% 17.65% 9.38% 10.6%
Number of other non trisomy abnormalities
3 0 7 1 11
Total number of abnormalities
9 0 19 4 32
% total number of abnormalities
9.9% 0% 27.9% 12.5% 16.1%
Source: Cytogenetics Laboratory
1.12. Chorionic Villus Biopsies (CVS) 91 chorionic villus biopsies were analysed by the Cytogenetics Laboratory in 2016/17. 28 abnormalities were detected (30.7%) and 19 of those (20.9%) had a diagnosis of trisomy 21 (Down’s syndrome) (Table 1.14).

16
Table 1.14 Cytogenetics analysis outcomes of chorionic Villus Biopsy samples by indication for the period 1 April 2016 - 31 March 2017
Referral Type
Biochemical Screening
Maternal Age
Abnormalities on Scan
Other Total
Number of women (= number of tests)
8 3 44 36 91
% total referral reasons
8.8% 3.3% 48.4% 39.6% 100
Number with normal results
6 3 25 28 62
Number with diagnostic trisomy
2 0 14 3 19
% total with diagnostic trisomy
25.0% 0.0% 31.8% 8.3% 20.9
Number of other non trisomy abnormalities
0 0 4 5 9
Total number of abnormalities
2 0 18 8 28
% total number of abnormalities
25 0 40.9 22.2 30.7
Source: Cytogenetics Laboratory
1.13. Other Congenital Anomalies Screening Fetal Anomalies Scan
All women are offered an ultrasound scan between 18 and 21 weeks to confirm the gestation age and identify any possible problems that may require medical intervention during pregnancy or after birth.
The number of women who gave consent for a fetal anomaly scan was 12,967 (97.6%) and 9,929 scans were performed (Table 1.15).

17
Table 1.15 Uptake rate for other congenital anomalies (fetal anomaly scan) for the period 31 March 2016 to 1 April 2017
Maternity Unit Number of Bookers
Number of Consents
% Consented
Number of fetal anomaly scans performed
% fetal anomaly scans performed
% Uptake
Not assigned to a unit
217 186 85.71 110 59.1 50.7
Princess Royal Maternity Hospital
4,080 4,038 98.97 3,136 77.7 76.9
Queen Elizabeth University Hospital
5,798 5,673 97.84 4,281 75.5 73.8
Royal Alexandra Hospital
3,138 3,070 96.45 2,402 78.2 75.5
Total 13,278 12,967 97.66 9,929 76.6 74.8 Source: Pregnancy & Newborn Screening System, June 2017
9,929 (76.6%) fetal scans were performed and 163 anomalies were detected. Of these 50 were confirmed postnatally, and 60 had no anomaly detected postnatally. The outcomes for 53 anomalies are not known (Table 1.16). Table 1.16 Outcome of fetal anomaly scans performed for the period 1 April 2016 to 31 March 2017 Maternity Unit Fetal
Anomaly scan performed
Fetal anomaly detected
% Fetal anomaly detected
Anomaly detected postnatally
No anomaly detected postnatally
Outcome not known
Not assigned to a unit
110 0 1.82 0 0 0
Princess Royal Maternity Hospital
3,136 45 1.43 16 16 13
Queen Elizabeth University Hospital
4,281 81 1.89 23 30 28
Royal Alexandra Hospital
2,402 35 1.46 11 13 11
Total 9,929 163 1.64 50 60 53 Source: Congenital Anomalies Surveillance Tool, Pregnancy & Newborn Screening System, June 2017

18
1.14. Information Systems PNBS IT application is used to support all pregnancy and newborn screening programmes. The application brought improvements in both the reporting and management of cases identified through the screening programme and introduced additional failsafe mechanisms into the screening programmes. The NHSGGC Maternity Services are commissioning a new IT system – BadgerNet which will record all future pregnancy screening programmes. NHSSS has decommissioned the Prenatal Screening Laboratory in Glasgow from November 2016. The sample analysis and reporting for 1st Trimester Down’s syndrome screening will be at the NHS Lothian Laboratory and the 2nd Trimester samples at the Bolton Laboratory.
1.15. Challenges and Priorities
Meeting testing and reporting timelines for pregnancy screening programmes
Recording full pregnancy screening programmes pathway data electronically including data collection on BadgerNet
Improving uptake of partner screening for haemoglobinopathies
Re-engineering of 1st and 2nd Trimester Down’s syndrome screening
19
Appendix 1.1
20
Appendix 1.2
21
Appendix 1.3

22
Appendix 1.4
Managing Communicable Diseases Screening Tests In Late Bookers
Late bookers are women who present for the first time on or after 24 weeks pregnancy. This is the stage at which the baby is potentially viable if early labour occurred. The results of the communicable disease screening tests could affect the management at or after delivery, therefore all communicable disease screening test results for a woman should be known prior to delivery and certainly before discharge. If a woman presents to maternity services as a late booker i.e. on or after 24 weeks it is important to ensure that screening has been offered and results are received: 1) The woman presents to the antenatal clinic, and there is no immediate risk of delivery:
Seek informed consent for screening (HIV, Syphilis, hepatitis B)
Fill one 9ml purple topped EDTA bottle and complete a virology request form, clearly indicating which tests (HIV, Syphilis hepatitis B) are to be carried out. Even if a woman does not consent to all four tests, please fill one 9ml purple topped EDTA bottle. Do not send two 5ml bottles, or other combinations to make up to 9 ml, the machines in the lab won’t accept them and the sample will not be processed.
Ensure tests are recorded on PNBS
Mark the sample as URGENT and telephone the West of Scotland Specialist Virology Centre to let them know it is in the system. (Tel 0141 201 8722)
Send the sample to the virus lab, via normal routine processes
Ensure that the name and contact details of the person and a deputy who will be responsible for any positive results are clearly appended
Note that to view a result on portal a CHI number is essential
2) The woman presents to maternity assessment i.e. in pain, bleeding etc therefore the risk of delivery is high:
Seek informed consent for screening (HIV, Syphilis, hepatitis B, rubella)
Fill one 9ml purple topped EDTA bottle and complete a virology request form, clearly indicating which tests (HIV, Syphilis hepatitis B) are to be carried out.
Please fill one 9ml bottle regardless of how many tests are requested. Sending multiple 5 ml tubes is not acceptable and the sample will not be processed.
Ensure tests are recorded on PNBS at next opportunity
Mark the sample as ‘URGENT’.
In hours (i.e. 9.00 – 17.00 Monday – Friday and 9.00 – 12.30 Saturday), telephone the Laboratory (Tel 0141 201 8722) and
Explain that an urgent sample is being sent
Discuss the travel arrangements

23
Arrange when and to whom the results will be communicated. You must provide the laboratory with adequate contact details to include the name and preferably two contact numbers of the main results recipient and a deputy.
Out of hours you must telephone the on-call virologist via the Switchboard 0141 211 3000 and discuss the above.
If the timing of the local transport systems does not facilitate urgent transfer order a taxi to ensure the sample reaches the laboratory. (see NHSGGC Amended Protocol Ordering and Use of Taxis and Couriers October 2011)
http://www.staffnet.ggc.scot.nhs.uk/Corporate%20Services/Communications/Briefs/Documents/amended%20taxi%20protocol%20-%20phase%201_acute%20services.pdf
In normal hours the lab is able to process and produce results within 1-2 hours of receipt. Note that reactive samples will need to be confirmed on the next day. Note that to view a result on portal a CHI number is essential. 3) The woman presents in labour:
It is the responsibility of the labour ward staff to ensure that virology screening tests are offered and results received. Even intrapartum diagnosis can significantly, positively modify neonatal outcome therefore it is important to ensure women are offered screening tests no matter how late.
It is essential that you telephone the virology lab as soon as possible to discuss emergency testing of the woman.
Seek informed consent for screening (HIV, Syphilis, hepatitis B,).
Fill one 9ml purple topped EDTA bottle and complete a virology request form, clearly indicating which tests (HIV, Syphilis hepatitis B) are to be carried out.
Please fill one 9ml bottle regardless of how many tests are requested. Sending multiple 5 ml tubes is not acceptable and the sample will not be processed.
Mark the sample as ‘URGENT’.
In hours (i.e. 9.00 – 17.00 Monday – Friday and 9.00 – 12.30 Saturday), telephone the Laboratory (Tel 0141 201 8722) and explain that an urgent sample is being sent discuss the travel arrangements.
Arrange when and to whom the results will be communicated. You must provide the laboratory with adequate contact details to include the name and preferably two contact numbers of the main results recipient and a deputy.
Out of hours you must telephone the on-call virologist via the Switchboard 0141 211 3000 and discuss the above.
Order a taxi to ensure the sample reaches the laboratory (see NHSGGC Amended Protocol Ordering and Use of Taxis and Couriers October 2011).

24
http://www.staffnet.ggc.scot.nhs.uk/Corporate%20Services/Communications/Briefs/Documents/amended%20taxi%20protocol%20-%20phase%201_acute%20services.pdf
As with ALL emergency blood tests ensure results are followed up immediately they are available. In normal hours the lab is able to process and produce results within 1-2 hours of receipt.
Communication with paediatricians is essential as their management may be significantly altered by these results however the responsibility for taking and sending these investigations and obtaining these results remains with the midwifery / obstetric team.
Ensure tests are recorded on PNBS at next opportunity.

25
Appendix 1.5
Microbiologist telephones outpatient manager (or
deputy) at maternity unit responsible for woman’s
antenatal care, and sends hard copy of report.
All results are confirmed to requesting clinician in
writing within 21 days of screen being performed.
(Standard 3c.2)
Microbiologist telephones Sexual Health Advisors
at Sandyford (GUM Services) on
0141 211 8634
And
Sends hard copy of the labatory report to
Sandyford Initative FAO Sexual Health Advisors
Mother receives antenatal care as per appropriate pregnancy pathway.
Healthcare worker ensures appropriate instructions for follow-up of baby are documented in relevant place in
mother’s notes.
Maternity staff contact paediatrician at delivery Paediatrician reviews and arranges follow
up of baby at birth.
Microbiologist detects positive syphilis serology from booking blood.
All screen positive samples undergo confirmatory tests and results
issued to named clinician within 15 days. (Standard 3e2)
Clinician/midwife recalls woman, explain
result, and repeats blood to confirm identity,
with support from sexual health advisor from
Sandyford within 5 days of mother receiving
test result
(Standard 3d 1), and within 21 days of
blood test. (Standard 3c 4)
Woman seen at GUM services for
treatment and care of syphilis infection.
GUM services arrange follow up of any
contacts as required.
Protocol for Significant Laboratory Results
SYPHILIS
Version No: V4.2
Approved by: Communicable Diseases in Pregnancy Steering Group Lead Author Dr Gillian Penrice added 6.1.2016
Date Approved: December 2011 Checked 1 2016
Next Revision Date: December 2014 Next Review 31/01/2017
26
Appendix 1.6
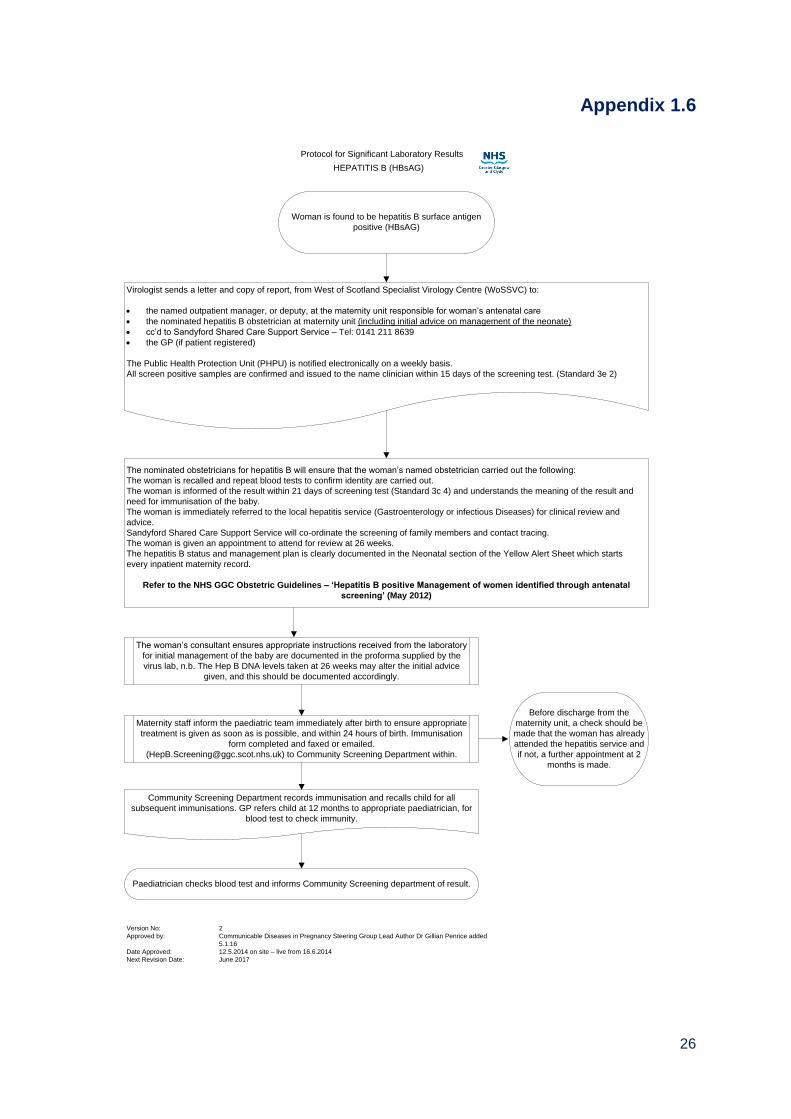
Woman is found to be hepatitis B surface antigen
positive (HBsAG)
Virologist sends a letter and copy of report, from West of Scotland Specialist Virology Centre (WoSSVC) to:
the named outpatient manager, or deputy, at the maternity unit responsible for woman’s antenatal care
the nominated hepatitis B obstetrician at maternity unit (including initial advice on management of the neonate)
cc’d to Sandyford Shared Care Support Service – Tel: 0141 211 8639
the GP (if patient registered)
The Public Health Protection Unit (PHPU) is notified electronically on a weekly basis.
All screen positive samples are confirmed and issued to the name clinician within 15 days of the screening test. (Standard 3e 2)
The nominated obstetricians for hepatitis B will ensure that the woman’s named obstetrician carried out the following:
The woman is recalled and repeat blood tests to confirm identity are carried out.
The woman is informed of the result within 21 days of screening test (Standard 3c 4) and understands the meaning of the result and
need for immunisation of the baby.
The woman is immediately referred to the local hepatitis service (Gastroenterology or infectious Diseases) for clinical review and
advice.
Sandyford Shared Care Support Service will co-ordinate the screening of family members and contact tracing.
The woman is given an appointment to attend for review at 26 weeks.
The hepatitis B status and management plan is clearly documented in the Neonatal section of the Yellow Alert Sheet which starts
every inpatient maternity record.
Refer to the NHS GGC Obstetric Guidelines – ‘Hepatitis B positive Management of women identified through antenatal
screening’ (May 2012)
The woman’s consultant ensures appropriate instructions received from the laboratory
for initial management of the baby are documented in the proforma supplied by the
virus lab, n.b. The Hep B DNA levels taken at 26 weeks may alter the initial advice
given, and this should be documented accordingly.
Maternity staff inform the paediatric team immediately after birth to ensure appropriate
treatment is given as soon as is possible, and within 24 hours of birth. Immunisation
form completed and faxed or emailed.
([email protected]) to Community Screening Department within.
Community Screening Department records immunisation and recalls child for all
subsequent immunisations. GP refers child at 12 months to appropriate paediatrician, for
blood test to check immunity.
Paediatrician checks blood test and informs Community Screening department of result.
Before discharge from the
maternity unit, a check should be
made that the woman has already
attended the hepatitis service and
if not, a further appointment at 2
months is made.
Protocol for Significant Laboratory Results
HEPATITIS B (HBsAG)
Version No: 2
Approved by: Communicable Diseases in Pregnancy Steering Group Lead Author Dr Gillian Penrice added
5.1.16
Date Approved: 12.5.2014 on site – live from 16.6.2014
Next Revision Date: June 2017
27
Appendix 1.7
28
Appendix 1.8
Note: Antenatal immunisation against rubella infection ceased from June 2016.
29
Appendix 1.9
Down’s syndrome screening pathway for women accepting screening

30
Appendix 1.10
31
Appendix 1.11
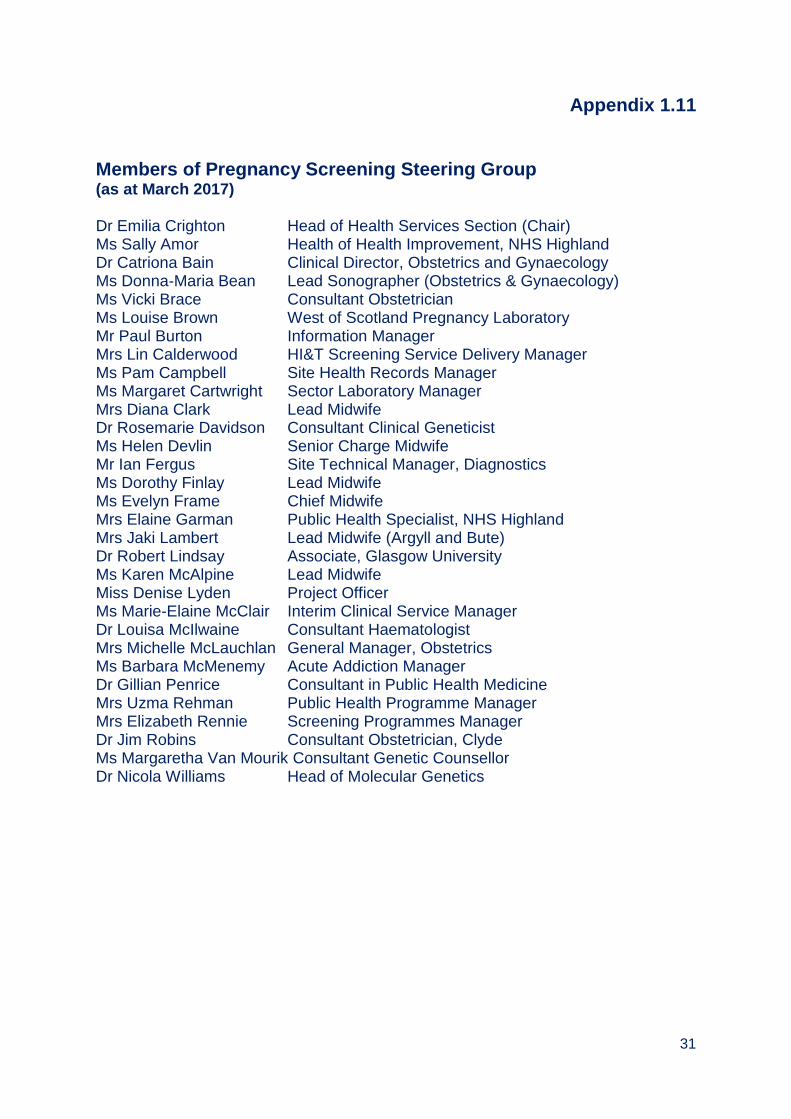
Members of Pregnancy Screening Steering Group (as at March 2017) Dr Emilia Crighton Head of Health Services Section (Chair) Ms Sally Amor Health of Health Improvement, NHS Highland Dr Catriona Bain Clinical Director, Obstetrics and Gynaecology Ms Donna-Maria Bean Lead Sonographer (Obstetrics & Gynaecology) Ms Vicki Brace Consultant Obstetrician Ms Louise Brown West of Scotland Pregnancy Laboratory Mr Paul Burton Information Manager Mrs Lin Calderwood HI&T Screening Service Delivery Manager Ms Pam Campbell Site Health Records Manager Ms Margaret Cartwright Sector Laboratory Manager Mrs Diana Clark Lead Midwife Dr Rosemarie Davidson Consultant Clinical Geneticist Ms Helen Devlin Senior Charge Midwife Mr Ian Fergus Site Technical Manager, Diagnostics Ms Dorothy Finlay Lead Midwife Ms Evelyn Frame Chief Midwife Mrs Elaine Garman Public Health Specialist, NHS Highland Mrs Jaki Lambert Lead Midwife (Argyll and Bute) Dr Robert Lindsay Associate, Glasgow University Ms Karen McAlpine Lead Midwife Miss Denise Lyden Project Officer Ms Marie-Elaine McClair Interim Clinical Service Manager Dr Louisa McIlwaine Consultant Haematologist Mrs Michelle McLauchlan General Manager, Obstetrics Ms Barbara McMenemy Acute Addiction Manager Dr Gillian Penrice Consultant in Public Health Medicine Mrs Uzma Rehman Public Health Programme Manager Mrs Elizabeth Rennie Screening Programmes Manager Dr Jim Robins Consultant Obstetrician, Clyde Ms Margaretha Van Mourik Consultant Genetic Counsellor Dr Nicola Williams Head of Molecular Genetics
32
Appendix 1.12 Members of Communicable Diseases Steering Sub Group (As at March 2017) Dr Gillian Penrice Public Health Protection Unit (Chair) Dr Tamer Abdelrahman Honorary Virology Registrar Ms Hilary Alba Charge Midwife SNIPS team Ms Donna Athanasopoulos Information & Publications Manager Ms Catrina Bain Clinical Director Obstetrics and Gynaecology Ms Elizabeth Boyd Clinical Effectiveness Co-ordinator Mr Paul Burton Information Manager Mrs Lin Calderwood National Portfolio Programme Manager Mrs Louise Carroll Programme Manager HIV/STIs Mrs Diana Clark Lead Community Midwife Ms Helen Devlin Senior Charge Midwife Ms Flora Dick Special Needs (SNIPS) Midwife Ms Rose Dougan Special Needs (SNIPS) Midwife Ms Elizabeth Ellis Staff Grade Ms Dorothy Finlay Lead Midwife Ms Catherine Frew Data Analyst, Specialist Virology Centre Mrs Fiona Gilchrist Assistant Programme Manager Ms Claire Glover Clinical Nurse Specialist Ms Louise Jack Midwife Mrs Jaki Lambert Lead Midwife Mr Sam King Sexual Health Advisor Miss Denise Lyden Project Officer Ms Victoria Mazzoni Senior Community Midwife Ms Karen McAlpine Lead Midwife Ms Valerie McAlpine Senior Charge Midwife Ms Marie-Elaine McClair Interim Clinical Service Manager Mrs Katie McEwan Clinical Service Manager Ms Michelle McLaughlan General Manager, Obstetrics Ms Jane McOwan Technical Manager, Specialist Virology Centre Ms Elizabeth Rennie Programme Manager Dr Jane Richmond Obstetrician and Gynaecologist Ms Linda Rhodick Medical Secretary/Data Co-ordinator Dr James Robins Consultant Obstetrician & Gynaecologist Ms Samantha Shepherd Clinical Scientist Ms Claire Stewart Clinical Service Manager Dr Andrew Thomson Consultant Obstetrician & Gynaecologist
33
Chapter 2 - Newborn Bloodspot Screening
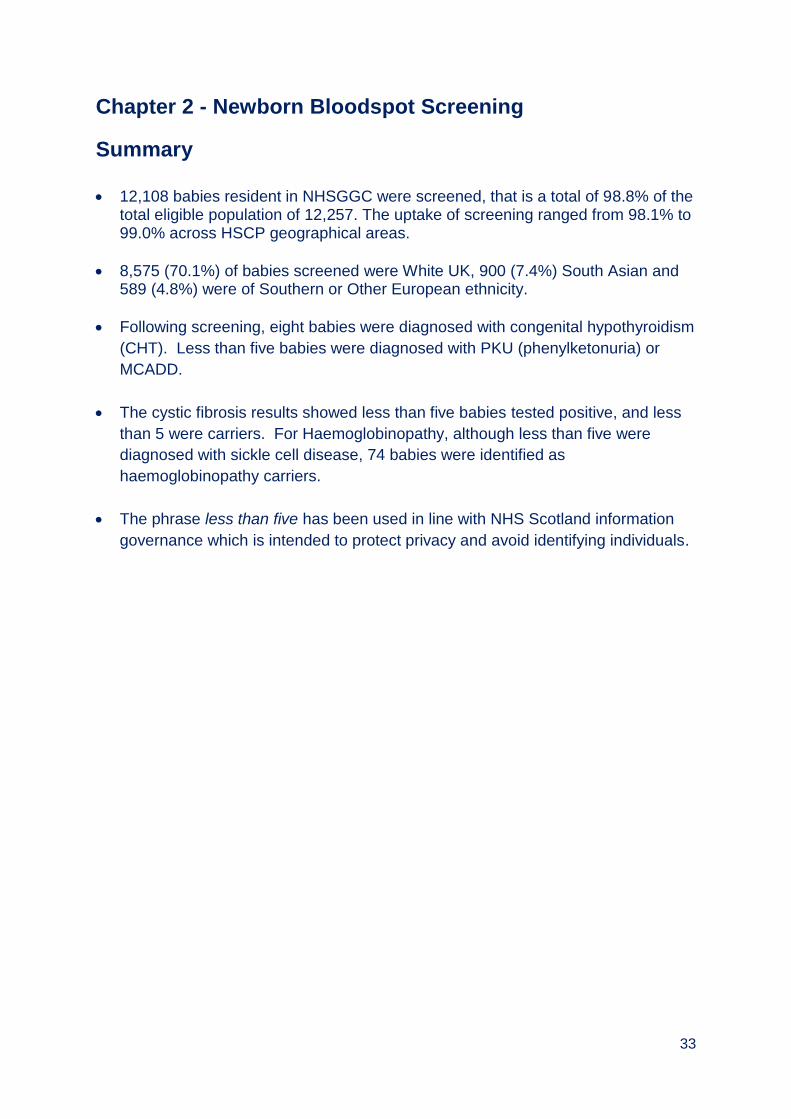
Summary 12,108 babies resident in NHSGGC were screened, that is a total of 98.8% of the
total eligible population of 12,257. The uptake of screening ranged from 98.1% to 99.0% across HSCP geographical areas.
8,575 (70.1%) of babies screened were White UK, 900 (7.4%) South Asian and 589 (4.8%) were of Southern or Other European ethnicity.
Following screening, eight babies were diagnosed with congenital hypothyroidism
(CHT). Less than five babies were diagnosed with PKU (phenylketonuria) or
MCADD.
The cystic fibrosis results showed less than five babies tested positive, and less
than 5 were carriers. For Haemoglobinopathy, although less than five were
diagnosed with sickle cell disease, 74 babies were identified as
haemoglobinopathy carriers.
The phrase less than five has been used in line with NHS Scotland information
governance which is intended to protect privacy and avoid identifying individuals.
34
Table of Contents
2.1. Newborn Bloodspot Screening ...................................................................... 35
2.2. Eligible Population .......................................................................................... 35
2.3. The Screening Test ......................................................................................... 35
2.4. Delivery of NHSGGC Newborn Bloodspot Screening Programmes ........... 36
2.5. Ethnicity of Babies Born in 2016/17 .............................................................. 39
2.6. Ethnicity of Babies 2011/12 to 2016/17 .......................................................... 39
2.7. Information Systems ....................................................................................... 43
2.8. Challenges and Service Improvements ........................................................ 43
35
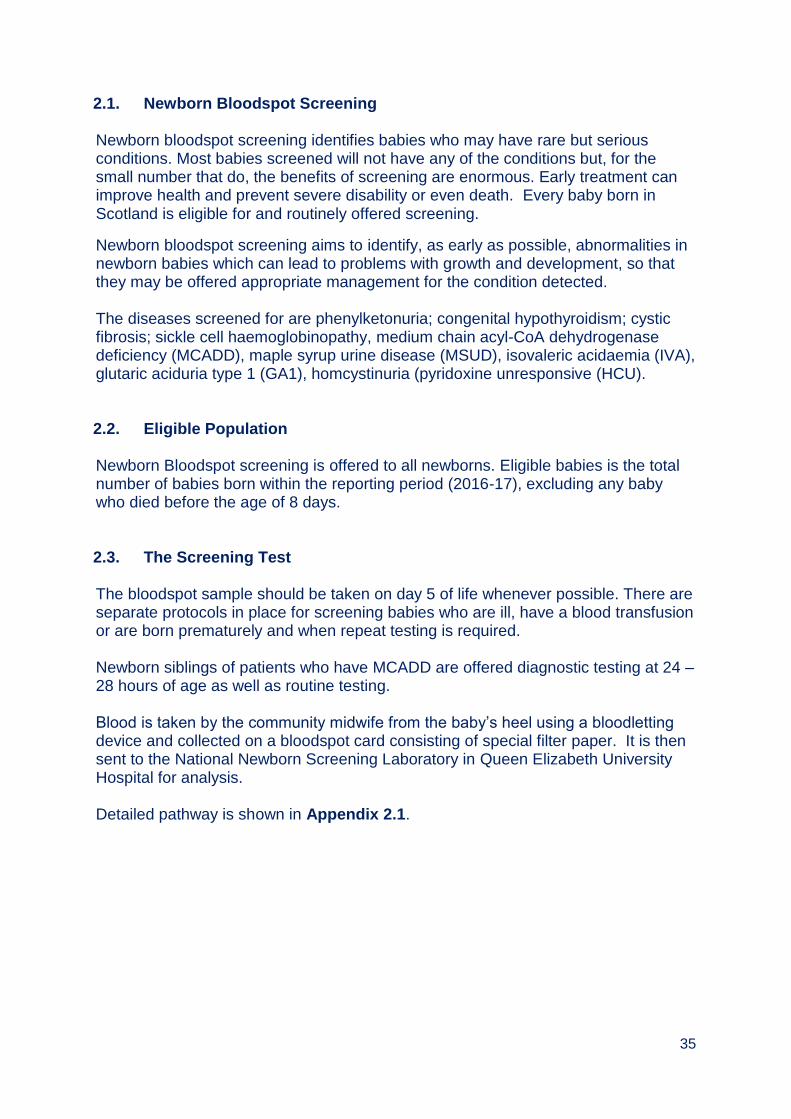
2.1. Newborn Bloodspot Screening Newborn bloodspot screening identifies babies who may have rare but serious conditions. Most babies screened will not have any of the conditions but, for the small number that do, the benefits of screening are enormous. Early treatment can improve health and prevent severe disability or even death. Every baby born in Scotland is eligible for and routinely offered screening.
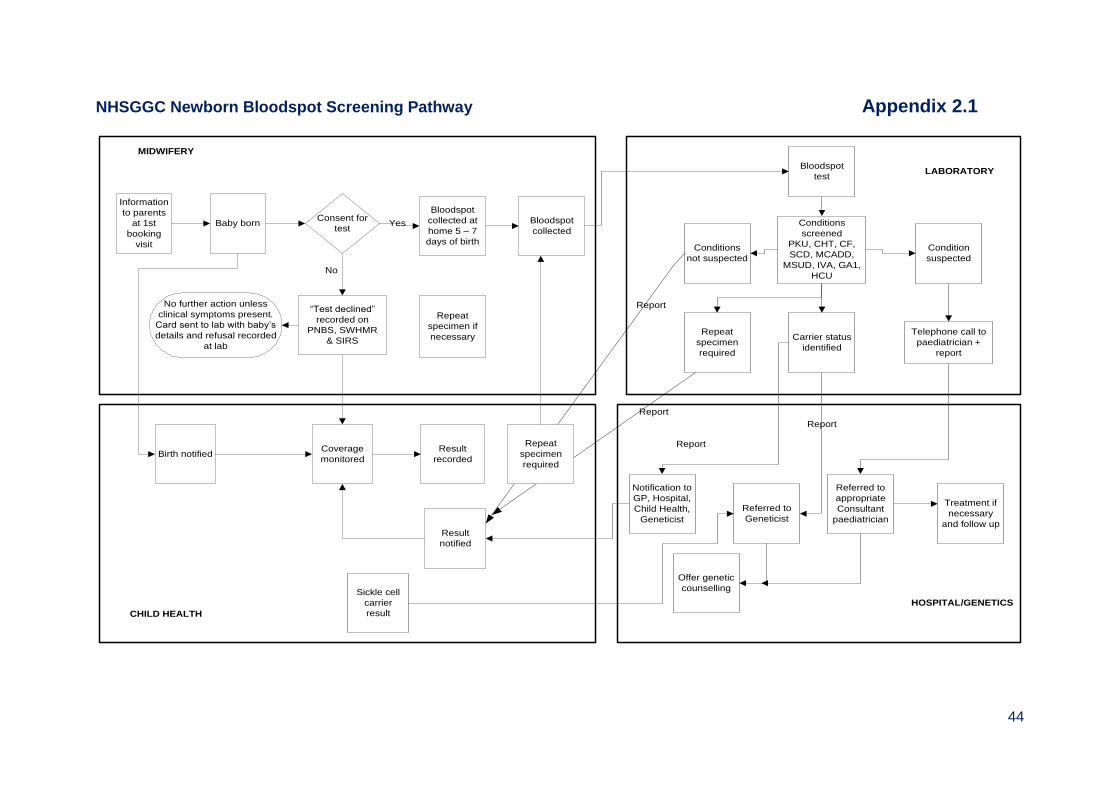
Newborn bloodspot screening aims to identify, as early as possible, abnormalities in newborn babies which can lead to problems with growth and development, so that they may be offered appropriate management for the condition detected. The diseases screened for are phenylketonuria; congenital hypothyroidism; cystic fibrosis; sickle cell haemoglobinopathy, medium chain acyl-CoA dehydrogenase deficiency (MCADD), maple syrup urine disease (MSUD), isovaleric acidaemia (IVA), glutaric aciduria type 1 (GA1), homcystinuria (pyridoxine unresponsive (HCU). 2.2. Eligible Population Newborn Bloodspot screening is offered to all newborns. Eligible babies is the total number of babies born within the reporting period (2016-17), excluding any baby who died before the age of 8 days. 2.3. The Screening Test The bloodspot sample should be taken on day 5 of life whenever possible. There are separate protocols in place for screening babies who are ill, have a blood transfusion or are born prematurely and when repeat testing is required. Newborn siblings of patients who have MCADD are offered diagnostic testing at 24 – 28 hours of age as well as routine testing. Blood is taken by the community midwife from the baby’s heel using a bloodletting device and collected on a bloodspot card consisting of special filter paper. It is then sent to the National Newborn Screening Laboratory in Queen Elizabeth University Hospital for analysis. Detailed pathway is shown in Appendix 2.1.
36
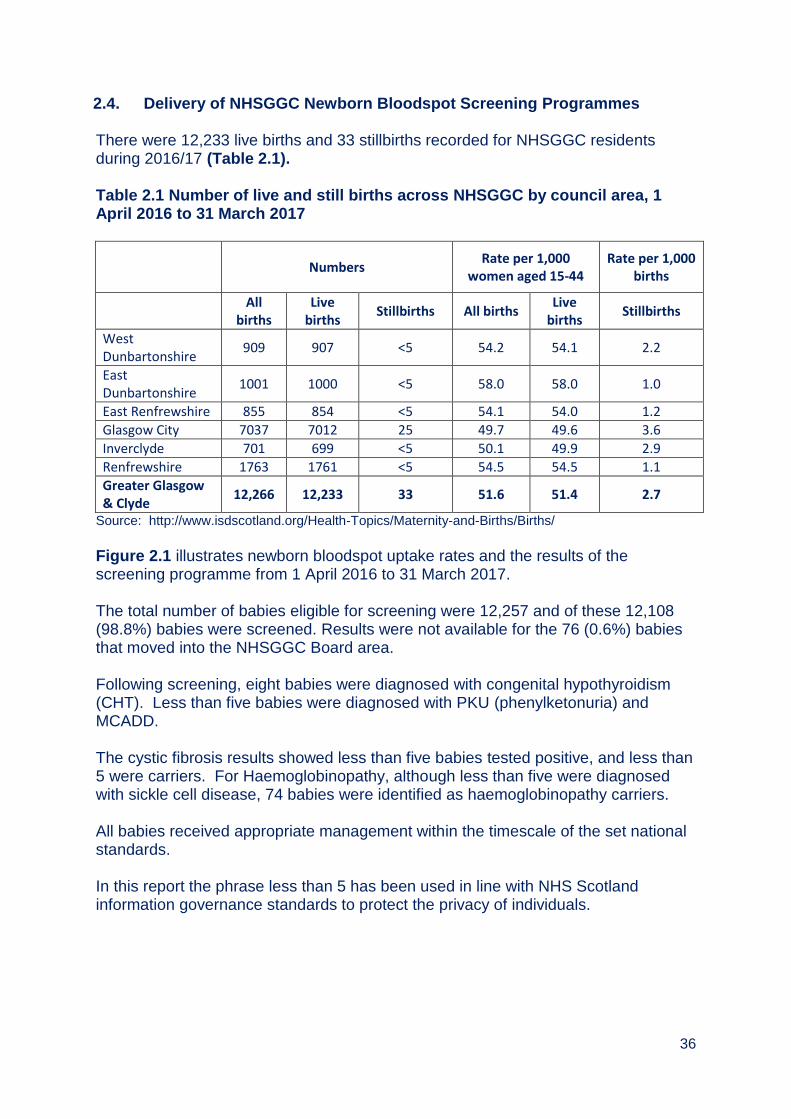
2.4. Delivery of NHSGGC Newborn Bloodspot Screening Programmes There were 12,233 live births and 33 stillbirths recorded for NHSGGC residents during 2016/17 (Table 2.1). Table 2.1 Number of live and still births across NHSGGC by council area, 1 April 2016 to 31 March 2017
Numbers
Rate per 1,000 women aged 15-44
Rate per 1,000 births
All
births Live
births Stillbirths All births
Live births
Stillbirths
West Dunbartonshire
909 907 <5 54.2 54.1 2.2
East Dunbartonshire
1001 1000 <5 58.0 58.0 1.0
East Renfrewshire 855 854 <5 54.1 54.0 1.2 Glasgow City 7037 7012 25 49.7 49.6 3.6 Inverclyde 701 699 <5 50.1 49.9 2.9 Renfrewshire 1763 1761 <5 54.5 54.5 1.1 Greater Glasgow & Clyde
12,266 12,233 33 51.6 51.4 2.7
Source: http://www.isdscotland.org/Health-Topics/Maternity-and-Births/Births/
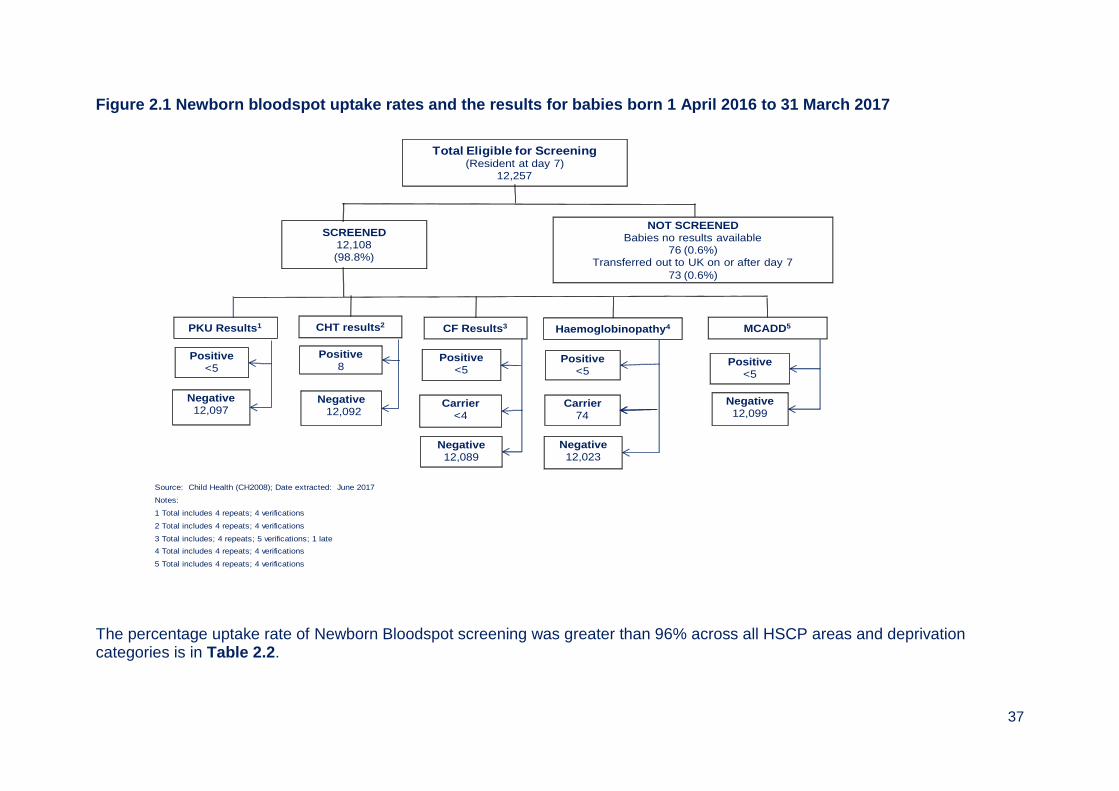
Figure 2.1 illustrates newborn bloodspot uptake rates and the results of the screening programme from 1 April 2016 to 31 March 2017. The total number of babies eligible for screening were 12,257 and of these 12,108 (98.8%) babies were screened. Results were not available for the 76 (0.6%) babies that moved into the NHSGGC Board area. Following screening, eight babies were diagnosed with congenital hypothyroidism (CHT). Less than five babies were diagnosed with PKU (phenylketonuria) and MCADD. The cystic fibrosis results showed less than five babies tested positive, and less than 5 were carriers. For Haemoglobinopathy, although less than five were diagnosed with sickle cell disease, 74 babies were identified as haemoglobinopathy carriers. All babies received appropriate management within the timescale of the set national standards. In this report the phrase less than 5 has been used in line with NHS Scotland information governance standards to protect the privacy of individuals.
37
Figure 2.1 Newborn bloodspot uptake rates and the results for babies born 1 April 2016 to 31 March 2017
Source: Child Health (CH2008); Date extracted: June 2017
Notes:
1 Total includes 4 repeats; 4 verifications
2 Total includes 4 repeats; 4 verifications
3 Total includes; 4 repeats; 5 verifications; 1 late
4 Total includes 4 repeats; 4 verifications
5 Total includes 4 repeats; 4 verifications
Total Eligible for Screening(Resident at day 7)
12,257
PKU Results1 CHT results2 CF Results3
Positive<5
Negative12,097
Positive8
Negative12,092
Positive<5
Negative12,089
SCREENED12,108(98.8%)
NOT SCREENEDBabies no results available
76 (0.6%)Transferred out to UK on or after day 7
73 (0.6%)
Haemoglobinopathy4
Negative12,023
MCADD5
Positive<5
Negative12,099
Carrier <4
Carrier74
Positive<5
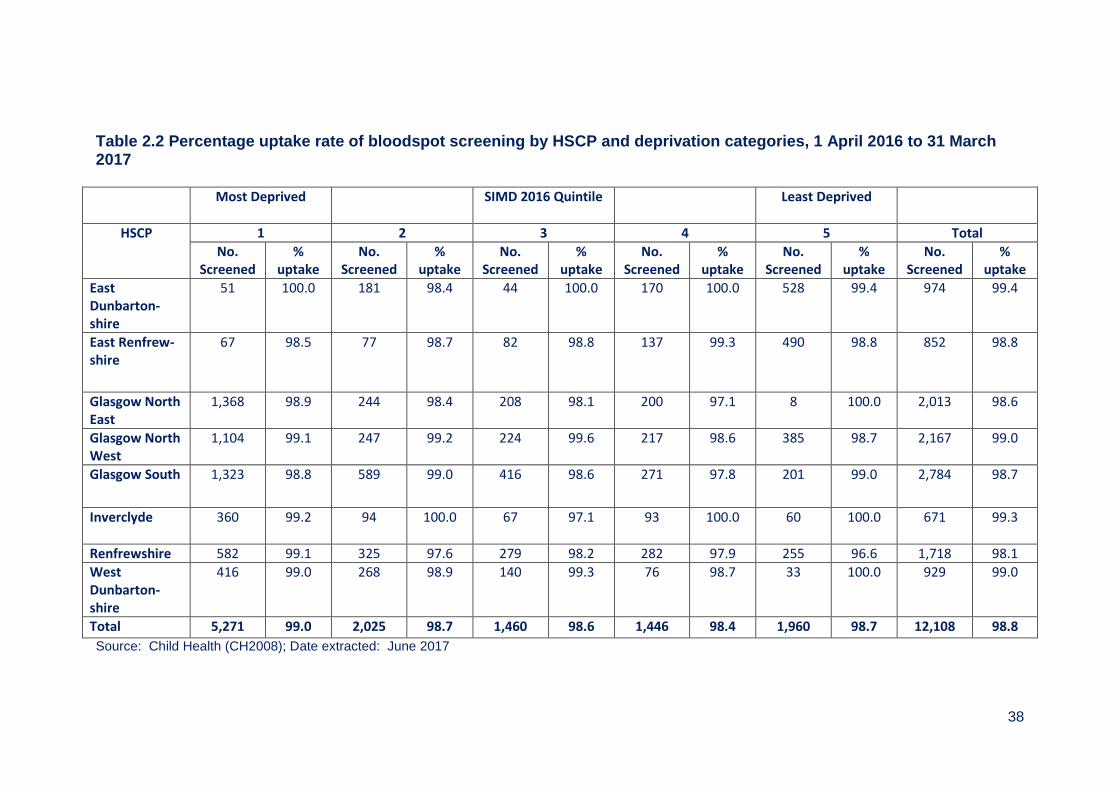
The percentage uptake rate of Newborn Bloodspot screening was greater than 96% across all HSCP areas and deprivation categories is in Table 2.2.
38
Table 2.2 Percentage uptake rate of bloodspot screening by HSCP and deprivation categories, 1 April 2016 to 31 March 2017
Most Deprived SIMD 2016 Quintile Least Deprived
HSCP 1 2 3 4 5 Total
No. Screened
% uptake
No. Screened
% uptake
No. Screened
% uptake
No. Screened
% uptake
No. Screened
% uptake
No. Screened
% uptake
East Dunbarton-shire
51 100.0 181 98.4 44 100.0 170 100.0 528 99.4 974 99.4
East Renfrew-shire
67 98.5 77 98.7 82 98.8 137 99.3 490 98.8 852 98.8
Glasgow North East
1,368 98.9 244 98.4 208 98.1 200 97.1 8 100.0 2,013 98.6
Glasgow North West
1,104 99.1 247 99.2 224 99.6 217 98.6 385 98.7 2,167 99.0
Glasgow South 1,323 98.8 589 99.0 416 98.6 271 97.8 201 99.0 2,784 98.7
Inverclyde
360 99.2 94 100.0 67 97.1 93 100.0 60 100.0 671 99.3
Renfrewshire 582 99.1 325 97.6 279 98.2 282 97.9 255 96.6 1,718 98.1
West Dunbarton-shire
416 99.0 268 98.9 140 99.3 76 98.7 33 100.0 929 99.0
Total 5,271 99.0 2,025 98.7 1,460 98.6 1,446 98.4 1,960 98.7 12,108 98.8
Source: Child Health (CH2008); Date extracted: June 2017

39
2.5. Ethnicity of babies born in 2016/17 The breakdown of the ethnicity groups for babies tested within NHSGGC shows that 8,575 (70.1%) of babies screened were White UK, 900 (7.4%) South Asian and 589 (4.8%) had Southern and Other European ethnic group (Table 2.3). Table 2.3 NHSGGC Newborn Bloodspot screening – ethnicity of the babies tested 1 April 2016 – 31 March 2017
Clyde Glasgow Total
Ethnicity Group N % N % N %
African or African Caribbean (Black)
26 0.8 319 3.5 345 2.8
South Asian (Asian) 76 2.4 824 9.1 900 7.4
South East Asian (Asian) 14 0.4 207 2.3 221 1.8
Other non-European (Other)
6 0.2 206 2.3 212 1.7
Southern & Other European (White)
106 3.4 483 5.3 589 4.8
United Kingdom (White) 2,605 82.6 5,970 65.8 8,575 70.1
North Europe (White) 34 1.1 79 0.9 113 0.9
Don’t Know 4 0.1 16 0.2 20 0.2
Decline to Answer 2 0.1 1 0.0 3 0.0
Any Mixed Background 124 3.9 523 5.8 647 5.3
Not Stated 157 5.0 444 4.9 601 4.9
Total 3,154 9,072 12,226 Source: Scottish Newborn Screening Laboratory - Newborn Bloodspot Screening Report 2016/17 Note: Scottish Newborn Screening Laboratory figures cannot be mapped to NHS GGC new boundary and may include Lanarkshire, Highland patients, etc
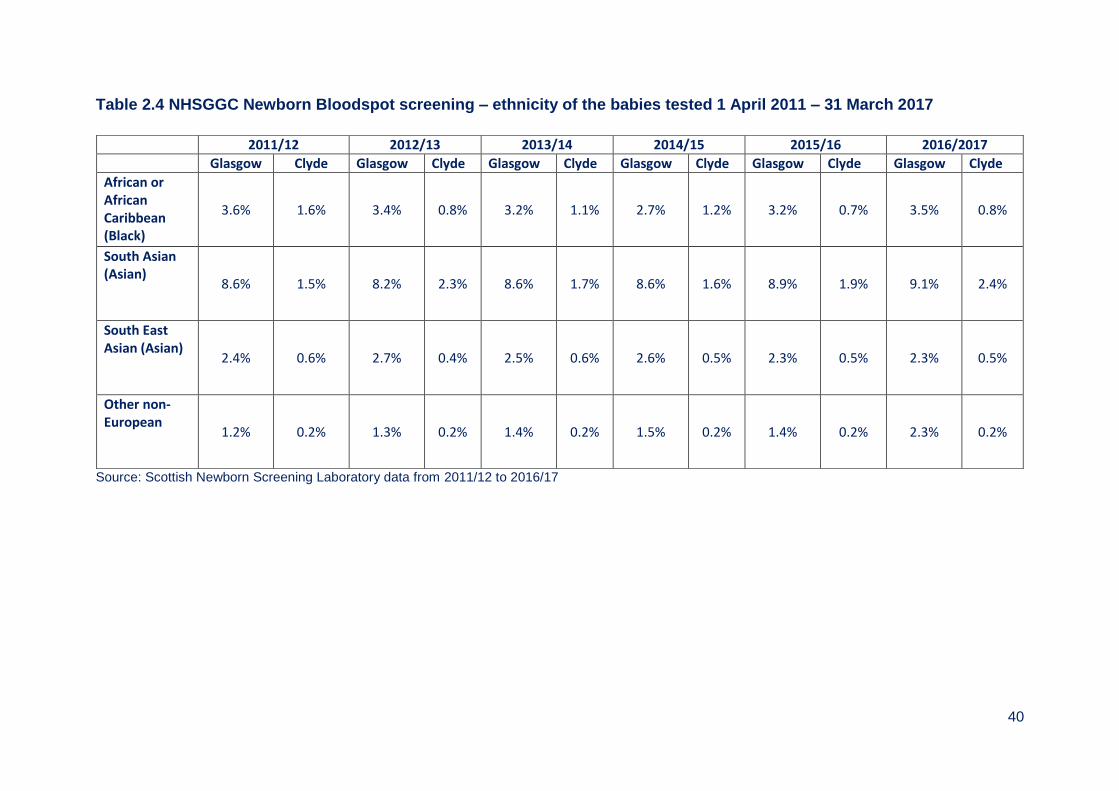
2.6. Ethnicity of Babies 2011/12 to 2016/17 Across NHSGGC the changes in population and migration from other countries is illustrated when data is compared for ethnicity using the Bloodspot card. For African and African Caribbean residents the percentage has decreased from 1.6% in Clyde to 0.8% but has remained steady for Glasgow areas. For the South Asian community there is an increase of 0.9% for Clyde and of 0.5% for Glasgow areas. The South East Asian community remained steady for the last six years. There was an increase of 1.2% to 2.3% for other non-Europeans in the Glasgow areas for 2016/17 (Table 2.4).
40
Table 2.4 NHSGGC Newborn Bloodspot screening – ethnicity of the babies tested 1 April 2011 – 31 March 2017
Source: Scottish Newborn Screening Laboratory data from 2011/12 to 2016/17
2011/12 2012/13 2013/14 2014/15 2015/16 2016/2017
Glasgow Clyde Glasgow Clyde Glasgow Clyde Glasgow Clyde Glasgow Clyde Glasgow Clyde
African or African Caribbean (Black)
3.6% 1.6% 3.4% 0.8% 3.2% 1.1% 2.7% 1.2% 3.2% 0.7% 3.5% 0.8%
South Asian (Asian)
8.6% 1.5% 8.2% 2.3% 8.6% 1.7% 8.6% 1.6% 8.9% 1.9% 9.1% 2.4%
South East Asian (Asian)
2.4% 0.6% 2.7% 0.4% 2.5% 0.6% 2.6% 0.5% 2.3% 0.5% 2.3% 0.5%
Other non-European
1.2% 0.2% 1.3% 0.2% 1.4% 0.2% 1.5% 0.2% 1.4% 0.2% 2.3% 0.2%

41
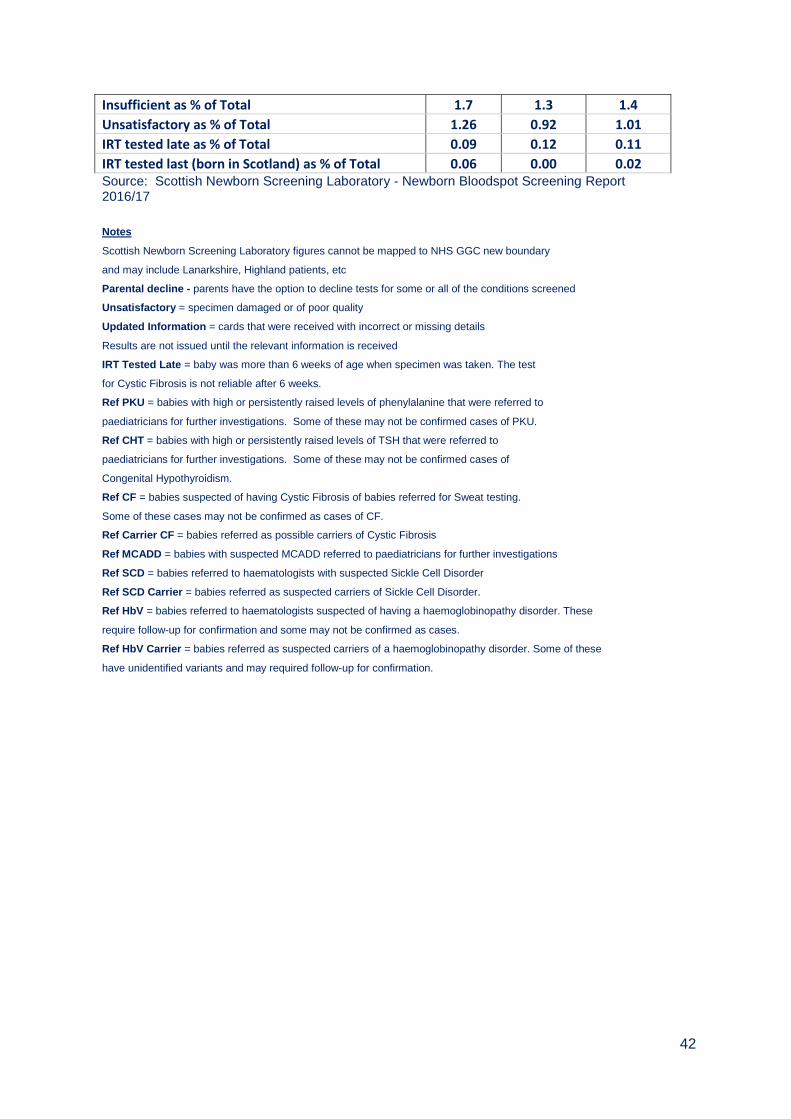
The laboratory outcomes of Newborn Bloodspot tests shows that in 2016/17, of the 12,791 bloodspot samples received, 12,890 test results were normal. There are several tests carried out on each specimen (Table 2.5). 185 (1.4%) specimens could not be analysed due to insufficient amounts of blood on the bloodspot card and required a repeat test. Avoidable repeat samples can cause anxiety for parents, distress to babies and delays in the screening process. Five samples received had taken more than 14 days to arrive at the laboratory. National standards require that 95% of positive cases of congenital hypothyroidism and phenylketonuria start treatment by 14 days of age and for cystic fibrosis by 35 days of age. Therefore, the time from when a test is taken to the time of arrival at the laboratory is important. Table 2.5 Specimen test outcomes for NHSGGC for period 1 April 2016 and 31 March 2017
Specimen Test - Outcomes Clyde Glasgow Total
Refused all tests 1 4 5
Partial refused 0 0 0
Insufficient blood to perform all tests 58 127 185
Unsatisfactory >14 days in transit 5 0 5
Unsatisfactory No CHI 13 61 74
Unsatisfactory Other 24 26 50
<3 days post T/F 1 7 8
Updated info 76 222 298
IRT tested late (total) 3 11 14
IRT tested late (Born in Scotland) 2 0 2
Ref PKU <5 <5 <5
Ref CHT <5 <5 5
Ref CF 0 <10 <10
Ref CF Carrier <5 <5 <5
Ref MCADD <5 0 <5
Ref MSUD* 0 0 0
Ref HCU* 0 0 0
Ref IVA* 0 0 0
Ref GA1* 0 0 0
Ref SCD 0 <5 <5
Ref SCD Carrier 7 45 52
Ref HbV 0 <5 <5
Ref HbV Carrier <5 <25 23
Number of normal results 3,346 9,544 12,890
Pre-TF 22 59 81
Sent for SCD DNA 3 10 13
Total Specimens received 3,332 9,459 12,791 *screening for these conditions started 20th March 2017
42
Insufficient as % of Total 1.7 1.3 1.4 Unsatisfactory as % of Total 1.26 0.92 1.01 IRT tested late as % of Total 0.09 0.12 0.11 IRT tested last (born in Scotland) as % of Total 0.06 0.00 0.02 Source: Scottish Newborn Screening Laboratory - Newborn Bloodspot Screening Report
2016/17
Notes
Scottish Newborn Screening Laboratory figures cannot be mapped to NHS GGC new boundary
and may include Lanarkshire, Highland patients, etc
Parental decline - parents have the option to decline tests for some or all of the conditions screened
Unsatisfactory = specimen damaged or of poor quality
Updated Information = cards that were received with incorrect or missing details
Results are not issued until the relevant information is received
IRT Tested Late = baby was more than 6 weeks of age when specimen was taken. The test
for Cystic Fibrosis is not reliable after 6 weeks.
Ref PKU = babies with high or persistently raised levels of phenylalanine that were referred to
paediatricians for further investigations. Some of these may not be confirmed cases of PKU.
Ref CHT = babies with high or persistently raised levels of TSH that were referred to
paediatricians for further investigations. Some of these may not be confirmed cases of
Congenital Hypothyroidism.
Ref CF = babies suspected of having Cystic Fibrosis of babies referred for Sweat testing.
Some of these cases may not be confirmed as cases of CF.
Ref Carrier CF = babies referred as possible carriers of Cystic Fibrosis
Ref MCADD = babies with suspected MCADD referred to paediatricians for further investigations
Ref SCD = babies referred to haematologists with suspected Sickle Cell Disorder
Ref SCD Carrier = babies referred as suspected carriers of Sickle Cell Disorder.
Ref HbV = babies referred to haematologists suspected of having a haemoglobinopathy disorder. These
require follow-up for confirmation and some may not be confirmed as cases.
Ref HbV Carrier = babies referred as suspected carriers of a haemoglobinopathy disorder. Some of these
have unidentified variants and may required follow-up for confirmation.
43
2.7. Information systems Pregnancy and Newborn Bloodspot screening tests results are provided by the National Laboratory’s Information Management System and data are reported on the old former NHS Greater Glasgow and NHS Argyll and Clyde basis. The results of the Bloodspot test are recorded against the individual child’s record held within the Scottish Immunisation and Recall System (SIRS) and also in PNBS IT application that supports the failsafe processes for newborn bloodspot screening. 2.8. Challenges and Service Improvements 1. Support parents whose children are identified as carriers of Sickle Cell Disease to access genetic counselling. 2. Develop a website with information about haemoglobinopathies for staff and parents in accessible formats.
44
NHSGGC Newborn Bloodspot Screening Pathway Appendix 2.1
Baby born
Information
to parents
at 1st
booking
visit
Consent for
test
No
Yes
Bloodspot
collected at
home 5 – 7
days of birth
No further action unless
clinical symptoms present.
Card sent to lab with baby’s
details and refusal recorded
at lab
Birth notifiedCoverage
monitored
Result
recorded
Result
notified
CHILD HEALTH
MIDWIFERY
Bloodspot
test
Bloodspot
collectedConditions
screened
PKU, CHT, CF,
SCD, MCADD,
MSUD, IVA, GA1,
HCU
Conditions
not suspected
Repeat
specimen
required
Repeat
specimen if
necessary
“Test declined”
recorded on
PNBS, SWHMR
& SIRS Carrier status
identified
Condition
suspected
Telephone call to
paediatrician +
report
Notification to
GP, Hospital,
Child Health,
Geneticist
Referred to
Geneticist
Referred to
appropriate
Consultant
paediatrician
Treatment if
necessary
and follow up
Offer genetic
counselling
Report
Report
Report
Report
LABORATORY
HOSPITAL/GENETICS
Sickle cell
carrier
result
Repeat
specimen
required
45
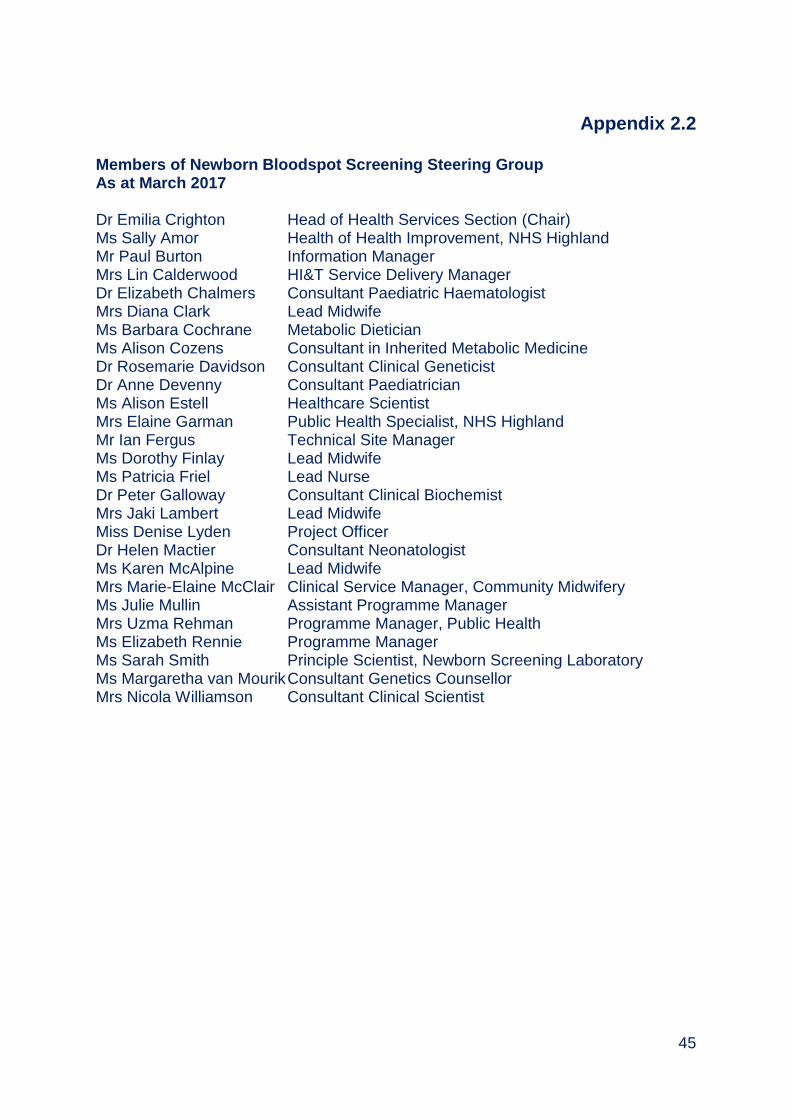
Appendix 2.2 Members of Newborn Bloodspot Screening Steering Group As at March 2017 Dr Emilia Crighton Head of Health Services Section (Chair) Ms Sally Amor Health of Health Improvement, NHS Highland Mr Paul Burton Information Manager Mrs Lin Calderwood HI&T Service Delivery Manager Dr Elizabeth Chalmers Consultant Paediatric Haematologist Mrs Diana Clark Lead Midwife Ms Barbara Cochrane Metabolic Dietician Ms Alison Cozens Consultant in Inherited Metabolic Medicine Dr Rosemarie Davidson Consultant Clinical Geneticist Dr Anne Devenny Consultant Paediatrician Ms Alison Estell Healthcare Scientist Mrs Elaine Garman Public Health Specialist, NHS Highland Mr Ian Fergus Technical Site Manager Ms Dorothy Finlay Lead Midwife Ms Patricia Friel Lead Nurse Dr Peter Galloway Consultant Clinical Biochemist Mrs Jaki Lambert Lead Midwife Miss Denise Lyden Project Officer Dr Helen Mactier Consultant Neonatologist Ms Karen McAlpine Lead Midwife Mrs Marie-Elaine McClair Clinical Service Manager, Community Midwifery Ms Julie Mullin Assistant Programme Manager Mrs Uzma Rehman Programme Manager, Public Health Ms Elizabeth Rennie Programme Manager Ms Sarah Smith Principle Scientist, Newborn Screening Laboratory Ms Margaretha van Mourik Consultant Genetics Counsellor Mrs Nicola Williamson Consultant Clinical Scientist
46
Chapter 3 - Universal Newborn Hearing Screening Summary
Universal Newborn Hearing screening can detect early permanent congenital hearing impairment as well as babies with mild and unilateral losses who receive ongoing review.
Of the 12,206 eligible babies, 12,042 were screened for hearing loss giving an uptake of 98.7%. A second stage follow up was required for 1,385 (11.5%) babies and, of these, 195 (1.6%) were referred to audiology.
Forty-eight babies were confirmed with a hearing loss (0.3% of the screened population). Twenty-seven babies had confirmed bilateral hearing loss and 21 babies had confirmed unilateral hearing loss.
164 (1.3%) babies did not complete the screening programme. These included babies who did not attend for screening, are deceased or have moved away from their current home address or transferred to another Board area.
47
Table of Contents
3.1. Universal Newborn Hearing Screening ......................................................... 48
3.2. Eligible Population .......................................................................................... 48
3.3. Screening Tests .............................................................................................. 48
3.4. Repeat Screens ............................................................................................... 48
3.5. NHSGGC Universal Newborn Hearing Screening Programme Across HSCPs ..................................................................................................................... 48
3.6. Information Systems ....................................................................................... 51
3.7. Challenges and Future Priorities ................................................................... 51

48
3.1. Universal Newborn Hearing Screening
Universal Newborn Hearing screening aims to detect early permanent congenital hearing impairment. In addition, babies with mild and unilateral losses are also being identified and receive ongoing review.
3.2. Eligible Population
Universal Newborn Hearing screening programmes is offered to all newborns by 4 weeks of corrected age (NICU) babies or by 5 weeks corrected age (community programmes). The eligible babies are those whose mothers were registered with a GP practice within the Health Board or resident within the area. The babies excluded are those who died before screening was complete or have not reached the corrected age for screening.
3.3. Screening Tests
Hearing tests are carried out on all babies born in NHS Greater Glasgow and Clyde using the Automated Auditory Brainstem Response (AABR). The screening is completed prior to discharge from hospital if this is not possible then an appointment is made at an outpatient clinic.
3.4. Repeat Screens
These may be required if the baby was unsettled during the original screen, or if there was fluid or temporary blockage in the ear and for confirmation if the baby has a hearing loss. Detailed screening pathway is shown in Appendix 3.1 3.5. NHSGGC Universal Newborn Hearing Screening Programme across
HSCPs The uptake of Newborn Hearing Screening is high across all areas and ranged from 97.9% in Glasgow South to 99.0% in Inverclyde (Table 3.1).
49
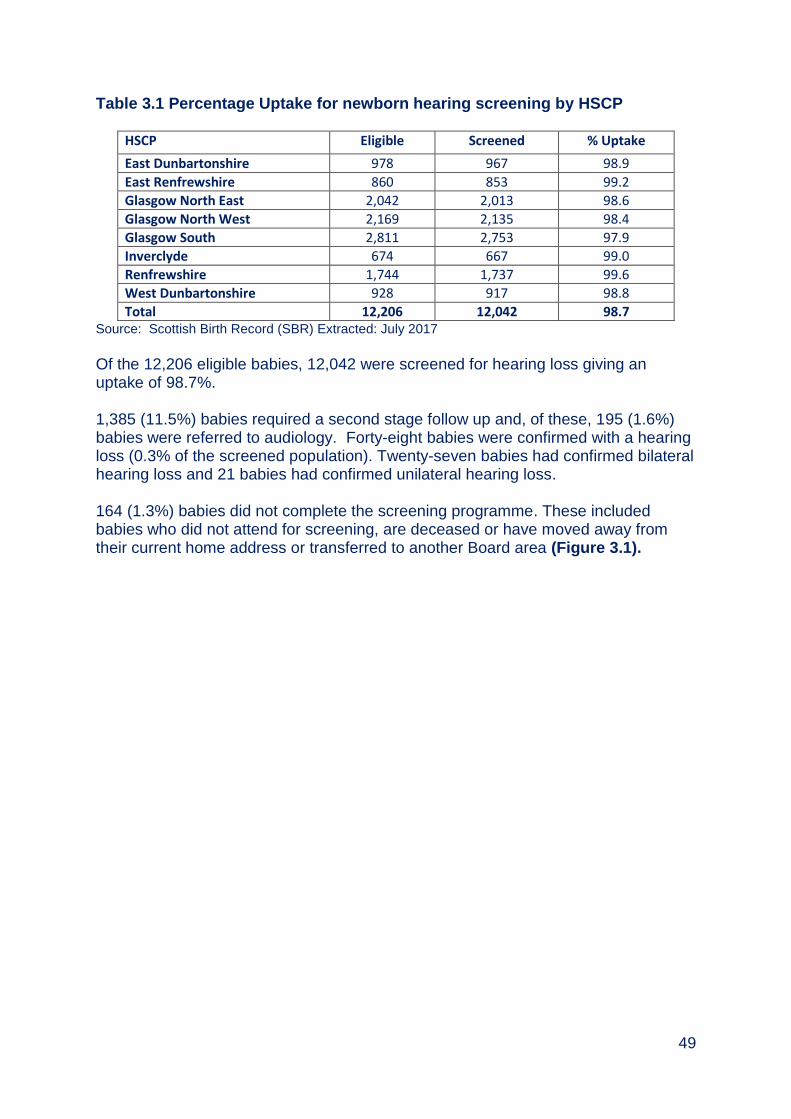
Table 3.1 Percentage Uptake for newborn hearing screening by HSCP
HSCP Eligible Screened % Uptake
East Dunbartonshire 978 967 98.9
East Renfrewshire 860 853 99.2
Glasgow North East 2,042 2,013 98.6
Glasgow North West 2,169 2,135 98.4
Glasgow South 2,811 2,753 97.9
Inverclyde 674 667 99.0
Renfrewshire 1,744 1,737 99.6
West Dunbartonshire 928 917 98.8
Total 12,206 12,042 98.7 Source: Scottish Birth Record (SBR) Extracted: July 2017
Of the 12,206 eligible babies, 12,042 were screened for hearing loss giving an uptake of 98.7%. 1,385 (11.5%) babies required a second stage follow up and, of these, 195 (1.6%) babies were referred to audiology. Forty-eight babies were confirmed with a hearing loss (0.3% of the screened population). Twenty-seven babies had confirmed bilateral hearing loss and 21 babies had confirmed unilateral hearing loss. 164 (1.3%) babies did not complete the screening programme. These included babies who did not attend for screening, are deceased or have moved away from their current home address or transferred to another Board area (Figure 3.1).
50
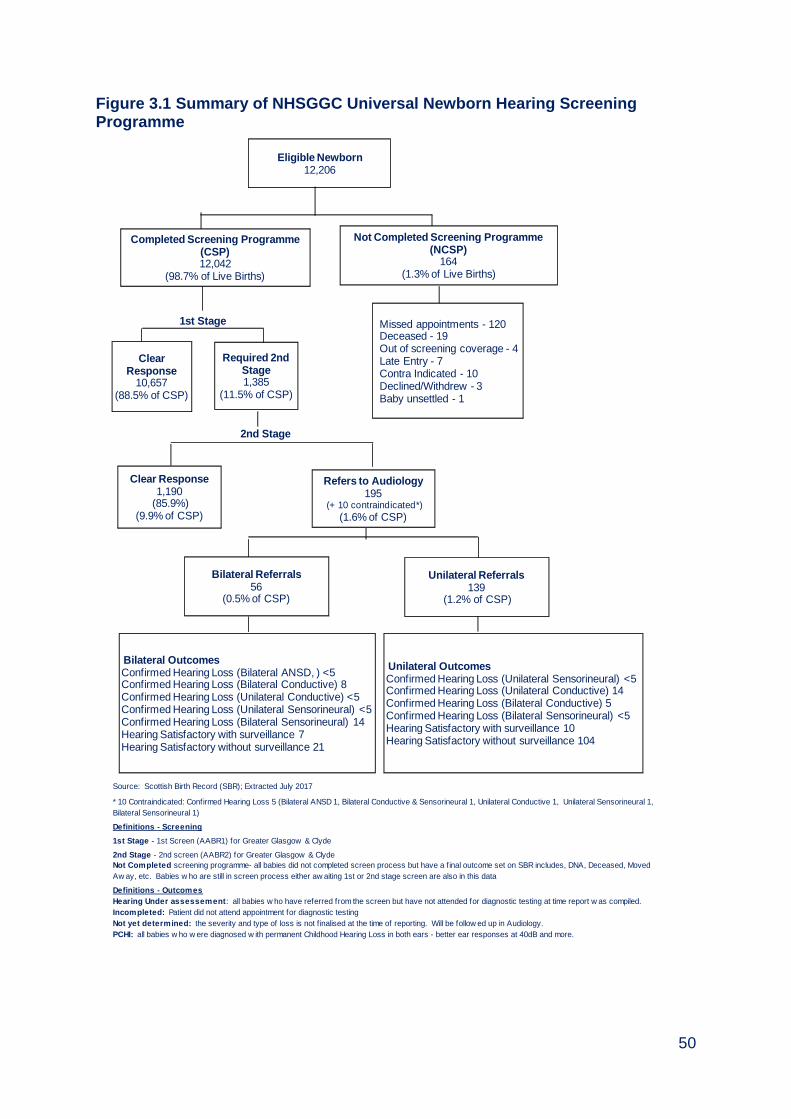
Figure 3.1 Summary of NHSGGC Universal Newborn Hearing Screening Programme
Source: Scottish Birth Record (SBR); Extracted July 2017
Definitions - Screening
1st Stage - 1st Screen (AABR1) for Greater Glasgow & Clyde
2nd Stage - 2nd screen (AABR2) for Greater Glasgow & Clyde
Definitions - Outcomes
Hearing Under assessement: all babies w ho have referred from the screen but have not attended for diagnostic testing at time report w as compiled.
Incompleted: Patient did not attend appointment for diagnostic testing
Not yet determined: the severity and type of loss is not f inalised at the time of reporting. Will be follow ed up in Audiology.
PCHI: all babies w ho w ere diagnosed w ith permanent Childhood Hearing Loss in both ears - better ear responses at 40dB and more.
1st Stage
2nd Stage
Not Completed screening programme- all babies did not completed screen process but have a f inal outcome set on SBR includes, DNA, Deceased, Moved
Aw ay, etc. Babies w ho are still in screen process either aw aiting 1st or 2nd stage screen are also in this data
* 10 Contraindicated: Confirmed Hearing Loss 5 (Bilateral ANSD 1, Bilateral Conductive & Sensorineural 1, Unilateral Conductive 1, Unilateral Sensorineural 1,
Bilateral Sensorineural 1)
Eligible Newborn12,206
Completed Screening Programme (CSP)12,042
(98.7% of Live Births)
Not Completed Screening Programme (NCSP)
164(1.3% of Live Births)
Clear Response
10,657(88.5% of CSP)
Required 2nd Stage1,385
(11.5% of CSP)
Clear Response1,190
(85.9%)(9.9% of CSP)
Refers to Audiology195
(+ 10 contraindicated*)
(1.6% of CSP)
Bilateral Referrals56
(0.5% of CSP)
Unilateral Referrals139
(1.2% of CSP)
Bilateral OutcomesConfirmed Hearing Loss (Bilateral ANSD, ) <5Confirmed Hearing Loss (Bilateral Conductive) 8Confirmed Hearing Loss (Unilateral Conductive) <5Confirmed Hearing Loss (Unilateral Sensorineural) <5Confirmed Hearing Loss (Bilateral Sensorineural) 14Hearing Satisfactory with surveillance 7 Hearing Satisfactory without surveillance 21
Unilateral OutcomesConfirmed Hearing Loss (Unilateral Sensorineural) <5Confirmed Hearing Loss (Unilateral Conductive) 14 Confirmed Hearing Loss (Bilateral Conductive) 5Confirmed Hearing Loss (Bilateral Sensorineural) <5 Hearing Satisfactory with surveillance 10Hearing Satisfactory without surveillance 104
Missed appointments - 120Deceased - 19Out of screening coverage - 4 Late Entry - 7Contra Indicated - 10Declined/Withdrew - 3Baby unsettled - 1
51
3.6. Information Systems
The Universal Newborn Hearing Screening programme is supported the Scottish Birth Record (SBR) to deliver hearing screening. The Child Health Surveillance Programme Pre-School system (CHSP-PS) holds screening outcomes and is used as a failsafe to ensure all babies are offered hearing screening.
3.7. Challenges and Future Priorities
Maintain service performance and ensure that all babies are offered Universal Newborn Hearing Screening to meet national standards and targets. Replace old testing equipment across all sites.
52
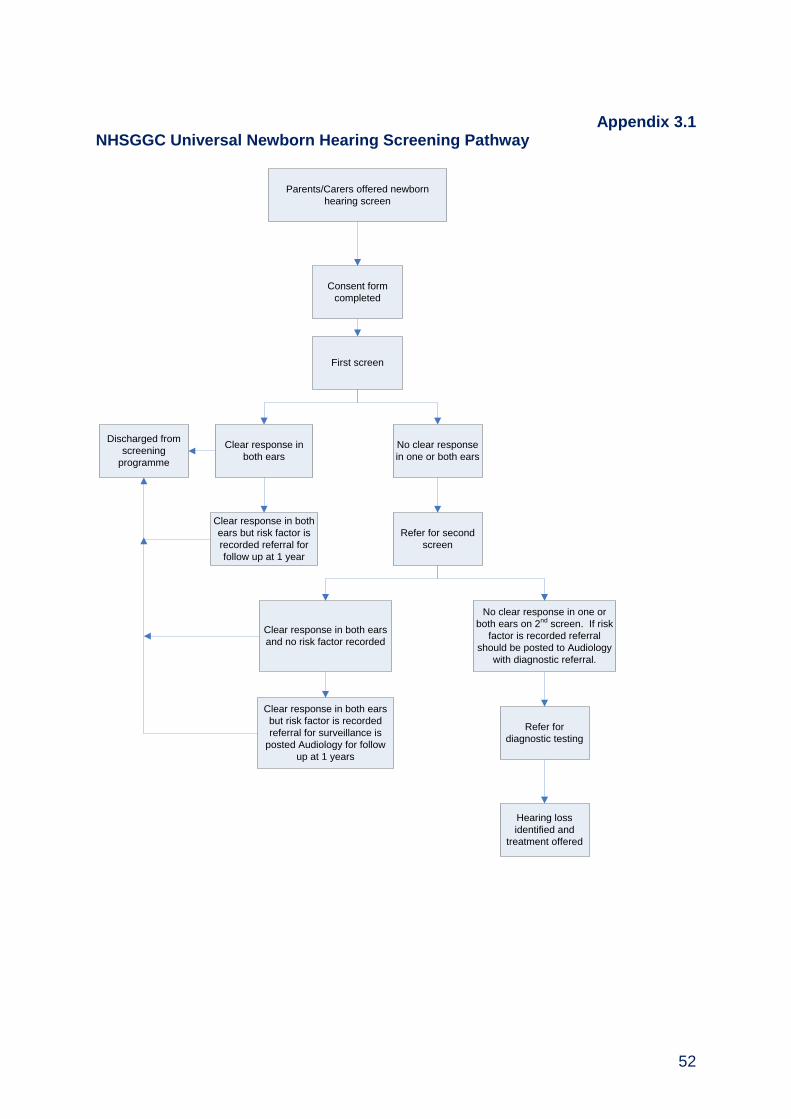
Appendix 3.1
NHSGGC Universal Newborn Hearing Screening Pathway
Parents/Carers offered newborn
hearing screen
First screen
Clear response in
both ears
No clear response
in one or both ears
Refer for second
screen
Discharged from
screening
programme
Refer for
diagnostic testing
Hearing loss
identified and
treatment offered
Consent form
completed
Clear response in both
ears but risk factor is
recorded referral for
follow up at 1 year
Clear response in both ears
and no risk factor recorded
No clear response in one or
both ears on 2nd screen. If risk
factor is recorded referral
should be posted to Audiology
with diagnostic referral.
Clear response in both ears
but risk factor is recorded
referral for surveillance is
posted Audiology for follow
up at 1 years
53
Appendix 3.2 Universal Newborn Hearing Screening Programme Steering Group (As at March 2017) Dr Emilia Crighton Head of Health Services Section (Chair) Mrs Karen Boyle Newborn Hearing Screening Manager Mr Paul Burton Information Manager Mrs Lin Calderwood H&IT Service Delivery Manager Ms Isobel Cook Midwife/Screener, Argyll and Bute Ms Mary Fingland LMC Representative Mrs Dorothy Finlay Lead Midwife Mr Dougie Fraser Service Manager Mrs Fiona Gilchrist Assistant Programme Manager, Screening Dept Dr Ruth Hamilton Clinical Scientist Ms Cathy Harkins Lead Midwife Mr James Harrigan Head of Audiology Ms Fiona Jarvis Specialist Speech and Language Therapist Miss Denise Lyden Project Officer Ms Karen McAlpine Lead Midwife Dr Juan Mora Consultant Audiological Physician Mrs Julie Mullin Assistant Programme Manager, Screening Dept Dr Andrew Powls Consultant Neonatologist Mrs Uzma Rehman Public Health Programme Manager Ms Patricia Renfrew Consultant Practitioner, Argyll and Bute Ms Vivien Thorpe Clinical Scientist Ms Heather Young Team Leader, Women and Children’s services
54
Chapter 4 - Child Vision Screening
Summary
Pre-school Vision Screening Programme
In 2016/17, 13,112 children aged between four to five years old were identified using the Community Health Index System as being eligible for pre-school vision screening.
5,408 (41.2%) children lived in the most deprived areas, with the largest proportion living in Glasgow City 3,812 (70.4%).
Overall uptake was 87.2%. Lowest uptake was in Glasgow City HSCP sectors and West Dunbartonshire where uptake was below 90% compared to highest uptake in Inverclyde at 93.3%.
Highest uptake was among children of Chinese ethnicity 90.7%, followed by White British children 89.2%. Lowest uptake was among Black children 79.5%.
Of the 11,434 children screened, 7,963 (69.6%) had a normal result. Of the
2,650 (23.2%) children referred for further assessment, 1,260 (27.7%) were from
the most deprived area.
The highest proportion of children screened that were referred for further
investigation was in Glasgow North East 29.6% (516) and Glasgow South 27.9%
(631). The lowest was 15.9% (177) in East Renfrewshire.
711 (6.2%) children are currently under follow up by ophthalmology service across NHSGGC.
55
Primary 7 School Vision Screening Programme
In 2016/17, 12,166 Primary 7 school children were eligible for a vision test and 10,439 (85.8%) were tested. Highest uptake was in Inverclyde 95.1% and the lowest uptake in East Dunbartonshire 80.7%.
Highest uptake was among children of white ethnicity 87% and the lowest uptake 68.5% among Black children.
Of the 12,116 children eligible for vision testing, 1,720 (16.5%) were already wearing prescription spectacles; ranging from 6.9% in Glasgow North West sector to 19.5% in Inverclyde HSCP.
1872 (21.5%) were identified with poor visual acuity. The highest proportion of children identified with poor acuity lived in Glasgow North West sector 31.4% (464) and the lowest in Renfrewshire HSCP 9.2% (118).
56
Table of Contents
4.1. Background ..................................................................................................... 57
4.2. Aim Of Vision Screening Programmes ......................................................... 57
4.3. Pre-School Vision Test ................................................................................... 58
4.4. Eligible Population .......................................................................................... 58
4.5. Pre-School Vision Screening Pathway .......................................................... 58
4.6. Delivery of Pre-School Vision Screening Programme 2016/17 ................... 58
4.7. P7 Vision Test.................................................................................................. 65
4.8. P7 Eligible Population .................................................................................... 65
4.9. P7 Vision Screening Pathway ........................................................................ 65
4.10. Delivery of Primary 7 School Vision Screening Programme 2016/17 ....... 65
4.11. P7 Child Health Screening Information Systems ....................................... 69
4.12. P7 Challenges and Future Priorities ............................................................ 69
57
Pre-school Vision Screening Programme
4.1. Background Vision Screening is routinely offered to all pre-school age children and Primary 7 school children resident in NHS Greater Glasgow and Clyde area. Poor vision can be caused by either a squint (strabismus) or differences in the focusing power of each eye (refractive error) which results in the brain receiving different images from each eye. If these problems are not treated early in childhood, this can lead to reduced vision in one or, in some cases, both eyes. The screening programme can also detect reduced vision due to other more uncommon causes. Vision problems affect 3-6% of children and although obvious squints are easily detected, refractive error and subtle squints often go undetected and long-term vision loss in adulthood can develop. Most problems can be treated using spectacle lenses to correct any refractive error and occlusion therapy to treat strabismus (squint) – mainly using eye patches. These treatments can be used alone or in combination. Treatment is most effective when the brain is still developing (in young children) and when the child co-operates in wearing the patch and/or glasses.
4.2. Aim of Vision Screening Programmes The aim of the screening programme is to detect reduced visual acuity, the commonest causes of which are amblyopia and refractive error. There is emerging evidence that good screening and treatment result in lower incidence of significant permanent vision loss.

58
4.3. Pre-school Vision Test The basic screen is a visual acuity test where children are asked to match a line of letters or pictures to a key card or to describe a line of pictures.
4.4. Eligible Population All children resident in NHS Greater Glasgow and Clyde aged between four and five years are invited to attend screening for reduced vision.
4.5. Pre-school Vision Screening Pathway The list of eligible children (the school intake cohort for the following year), with dates of birth between 1 March 2012 and 28 February 2013 were downloaded from CHI and matched against the lists received from nurseries. Pre-school vision screening clinics take place in the nursery setting. Children that do not attend nursery or school or whose nursery is unknown or miss their appointment within the nursery are invited to a hospital orthoptic clinic to have their vision screened. A proportion of children require further testing in secondary care following the initial screen. These children are referred for further assessment to a paediatric clinic in an ophthalmology department, though a small number may be referred to a community optometrist. The assessment appointment involves a full eye examination and allows operators to identify whether the screen test was a false positive and no further action is required or if the screen test was a true positive to enable the specific disorder to be identified and treated.
4.6. Delivery of Pre-school Vision Screening Programme 2016/17 In 2016/17, 13,112 children aged between four to five years old were identified using the Community Health Index System as being eligible for pre-school vision screening. 5,408 (41.2%) of all pre-school children within NHSGGC live in the most deprived quintile. The majority of these are resident within the Glasgow City sectors 3,812 (70.4%) (Table 4.1).
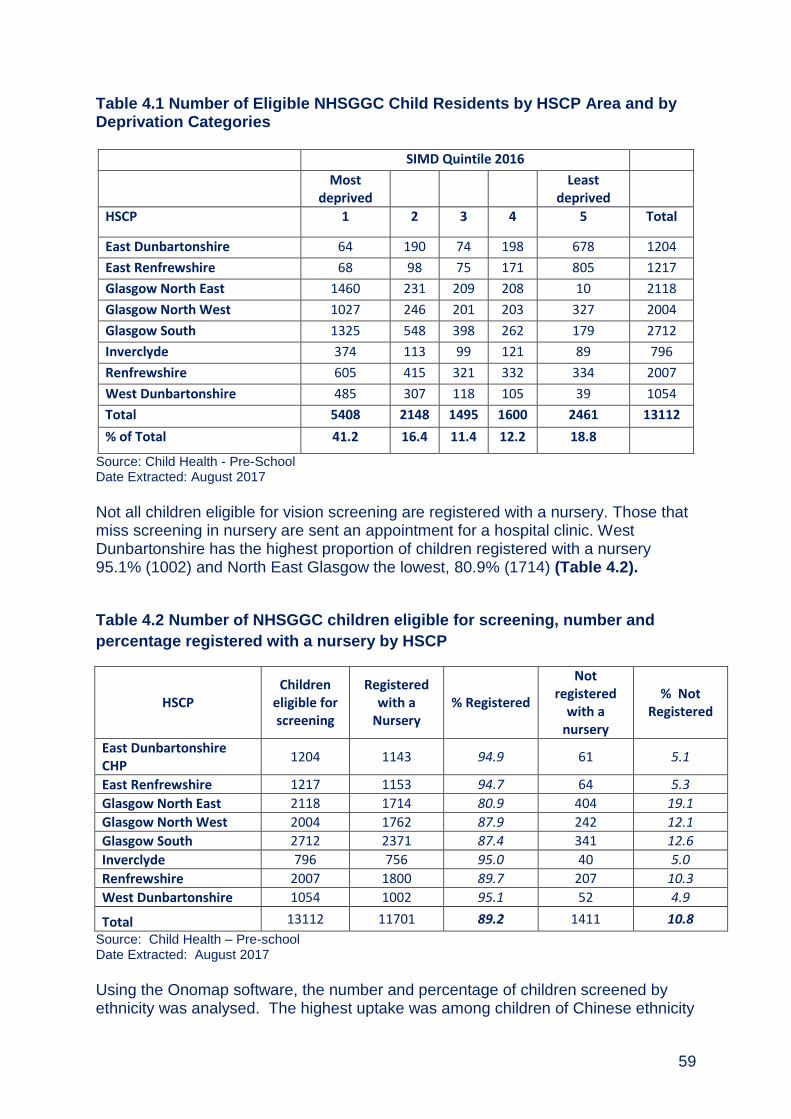
59
Table 4.1 Number of Eligible NHSGGC Child Residents by HSCP Area and by Deprivation Categories
SIMD Quintile 2016
Most deprived
Least deprived
HSCP 1 2 3 4 5 Total
East Dunbartonshire 64 190 74 198 678 1204
East Renfrewshire 68 98 75 171 805 1217
Glasgow North East 1460 231 209 208 10 2118
Glasgow North West 1027 246 201 203 327 2004
Glasgow South 1325 548 398 262 179 2712
Inverclyde 374 113 99 121 89 796
Renfrewshire 605 415 321 332 334 2007
West Dunbartonshire 485 307 118 105 39 1054
Total 5408 2148 1495 1600 2461 13112
% of Total 41.2 16.4 11.4 12.2 18.8
Source: Child Health - Pre-School Date Extracted: August 2017
Not all children eligible for vision screening are registered with a nursery. Those that miss screening in nursery are sent an appointment for a hospital clinic. West Dunbartonshire has the highest proportion of children registered with a nursery 95.1% (1002) and North East Glasgow the lowest, 80.9% (1714) (Table 4.2).
Table 4.2 Number of NHSGGC children eligible for screening, number and
percentage registered with a nursery by HSCP
HSCP Children
eligible for screening
Registered with a
Nursery % Registered
Not registered
with a nursery
% Not Registered
East Dunbartonshire CHP
1204 1143 94.9 61 5.1
East Renfrewshire 1217 1153 94.7 64 5.3 Glasgow North East 2118 1714 80.9 404 19.1 Glasgow North West 2004 1762 87.9 242 12.1 Glasgow South 2712 2371 87.4 341 12.6 Inverclyde 796 756 95.0 40 5.0 Renfrewshire 2007 1800 89.7 207 10.3 West Dunbartonshire 1054 1002 95.1 52 4.9
Total 13112 11701 89.2 1411 10.8
Source: Child Health – Pre-school Date Extracted: August 2017
Using the Onomap software, the number and percentage of children screened by ethnicity was analysed. The highest uptake was among children of Chinese ethnicity

60
at 90.7% (233), followed by White British ethnicity where uptake was 89.2% (7610). The lowest uptake was among the unclassified group at 69.5% (164) (Table 4.3). Table 4.3 Pre-school Vision Screening Uptake by Ethnicity
2001 census ethnic group Not
screened Screened Total
% screened
White - British 926 7610 8536 89.2
White – Irish 185 1421 1606 88.5
White - any other white background 171 684 855 80.0
Asian or Asian British 174 746 920 81.1
Black or Black British 45 175 220 79.5
Other ethnic groups - Chinese 24 233 257 90.7
Other ethnic groups - any other ethnic group 81 401 482 83.2
Unclassified 72 164 236 69.5
Total 1678 11434 13112 87.2 Source: Child Health - Pre-School, Onomap software, August 2017
11434 (87.2%) children were screened representing an increase of 0.4% from previous year. The highest uptake was in Inverclyde HSCP 93.3% (743) and the lowest in Glasgow North East 82.4% (1745). 69.6% of children screened had a normal result, this ranged from 78.2% in East Renfrewshire to 62.1% in Glasgow North East. Overall 23.2% of children screened were referred for further investigations. The referral rates varied from 15.9% in East Renfrewshire to 29.6% in Glasgow North East (Table 4.4).

61
Table 4.4 Pre-school Vision Screening Uptake and Outcomes by HSCP Area 1 April 2016 to 31 March 2017
HSCP Total Population
Total number of children screened
Total number of
children not screened
Uptake % No Abnormality
Detected (NAD) of those
screened
% Referred of those screened
% Recalled of those screened
% Ongoing Follow-up of
those screened
East Dunbartonshire 1204 1102 102 91.5 70.2 23.7 1.2 4.9
East Renfrewshire 1217 1117 100 91.8 78.2 15.9 0.1 5.7
Glasgow North East 2118 1745 373 82.4 62.1 29.6 1.8 6.5
Glasgow North West 2004 1693 311 84.5 66.7 24.7 1.2 7.4
Glasgow South 2712 2264 448 83.5 65.6 27.9 0.6 5.9
Inverclyde 796 743 53 93.3 74.6 18.4 1.2 5.8
Renfrewshire 2007 1826 181 91.0 75.8 16.6 0.9 6.7
West Dunbartonshire
1054 944 110 89.6 71.9 21.7 0.5 5.8
Total 13112 11434 1678 87.2 69.6 23.2 1.0 6.2
Source: Child Health - Pre-School Date Extracted: August 20
62
A significantly larger proportion of children living in the most deprived areas were referred for further assessment, recalled or required ongoing follow up. Of the 2,650 children referred for further assessment, 1,260 were from the most deprived areas. 110 (1%) children were recalled back to be screened due to difficulties screening their vision during the first screen. The proportion of children with a normal result ranged from 63.3% (2884) among children living in the most deprived area to 76.9% (1730) in the least deprived area. Referrals were also higher for children from the most deprived areas 27.7% compared to 17.3% in the least deprived areas. Of the 711 (6.2%) children currently under on-going follow up by ophthalmology service, 348 are from the most deprived areas (Table 4.5). The Pre- school vision screening summary of activity for the service in NHS Greater Glasgow and Clyde for the school year 2016-2017 is in Figure 4.1. 10,002 children were screened in Nurseries and 6,971 (69.7%) had a normal result,
2,304 (23%) were referred and 623 (6.2%) had ongoing follow up by Ophthalmology
services. Those not screened in nursery were invited to attend the hospital based
service. 1385 children were screened within a hospital setting, 958 (69.2%) had a
normal result, 336 referred and 85 had on-going follow up by Ophthalmology
services.

63
Table 4.5 Pre-school Vision Screening Uptake and Outcomes by Deprivation
SIMD
Number of Children Screened
No Abnormality
Detected (NAD) % NAD Referred
% Referred Recall
% Recall
Ongoing Follow up
%Ongoing Follow up
1 (Most Deprived) 4555 2884 63.3 1260 27.7 63 1.4 348 7.6
2 1883 1320 70.1 448 23.8 12 0.6 103 5.5
3 1310 948 72.4 283 21.6 9 0.7 70 5.3
4 1437 1081 75.2 270 18.8 12 0.8 74 5.1
5 (Least Deprived) 2249 1730 76.9 389 17.3 14 0.6 116 5.2
Total 11434 7963 69.6 2650 23.2 110 1.0 711 6.2 Source: Child Health - Pre-School Date Extracted: August 2017

64
Figure 4.1: Summary of NHSGGC Pre-school Vision Screening Activity
Source: Child Health - Pre-School Date Extracted: November 2017

65
Primary 7 School Vision Screening Programme
4.7. P7 Vision Test A visual acuity test is carried out where children are asked to identify a line of letters using a Snellen chart or Logmar if a child is unable to manage a Snellen chart. Testing is carried out on children who already have glasses.
4.8. P7 Eligible Population All school children in Primary 7 resident in NHSGGC are offered a vision test prior to transfer to secondary education.
4.9. P7 Vision Screening Pathway P7 vision screening takes place in school and is carried out by a School Support Worker. Children that do not attend school or miss their appointment within the school are advised to attend their local community optometrist. Parents/carers are issued with result letter. Abnormal results have three referral pathways:
Parent/carer is given a referral letter to take to their local community optometrist for further examination if a child’s visual acuity without glasses is 6/9 or poorer in one or both eyes or with glasses is 6/12 or poorer in the better eye;
If a child has some specific visual abnormalities e.g. nystagmus (difficulty fixing their gaze on an object) or a visual field problem (problems with central or peripheral vision), they will be referred to a community paediatrician;
If a child has a sudden onset squint, the School Nurse, GP and parent will be informed on the same day as this can be associated with more serious illness which need urgent assessment and management.
4.10. Delivery of Primary 7 School Vision Screening Programme 2016/17 In 2016/17, 12,166 Primary 7 school children were eligible for a vision test of which 10,439 (85.8%) were tested. The highest uptake was in Inverclyde 95.1% and East Renfrewshire 94.3% and the lowest was in East Dunbartonshire at 80.7% (Table 4.6).

66
Table 4.6 NHSGGC mainstream schools primary 7 vision screening uptake by
HSCP, 1 April 2016 to 31 March 2017
HSCP (School) Not Screened Screened Total % Uptake
East Dunbartonshire HSCP 239 997 1236 80.7
East Renfrewshire HSCP 74 1225 1299 94.3
Glasgow North East Sector 299 1411 1710 82.5
Glasgow North West Sector 360 1589 1949 81.5
Glasgow South Sector 210 2081 2291 90.8
Inverclyde HSCP 43 826 869 95.1
Renfrewshire HSCP 349 1485 1834 81.0
West Dunbartonshire HSCP 153 825 978 84.4
Total 1727 10439 12166 85.8 Source: CHSP_PS, October 2017
Analysis of the number and percentage of children screened by ethnicity shows that the highest uptake was among children of White British ethnicity at 87.0% and the lowest uptake was among Black or Black British children at 68.5% (Table 4.7). Table 4.7 NHSGGC Primary 7 Screening Uptake by ethnicity, 1 April 2016 to 31 March 2017
2001 Census Ethnic Group Not Screened Screened Total % Screened
White – British 1103 7351 8454 87.0
White – Irish 220 1418 1638 86.6
White - any other white background 111 455 566 80.4
Asian or Asian British 103 597 700 85.3
Black or Black British 51 111 162 68.5
Other ethnic groups - Chinese 16 83 99 83.8
Other ethnic groups - any other ethnic group
80 303 383 79.1
Unclassified 43 121 164 73.8
Total 1727 10439 12166 85.8 Source: ONO Map
Of the 10,439 children eligible for vision testing, 16.5% were already wearing prescription spectacles (Table 4.8).

67
Table 4.8 NHSGGC mainstream schools primary 7 vision screened pupils 2016-
2017: wearing spectacles
HSCP (School) No Spectacles Spectacles Total % Spectacles East Dunbartonshire HSCP 816 181 997 18.2 East Renfrewshire HSCP 1004 221 1225 18.0 Glasgow North East Sector 1124 287 1411 20.3 Glasgow North West Sector 1479 110 1589 6.9 Glasgow South Sector 1677 404 2081 19.4 Inverclyde HSCP 665 161 826 19.5 Renfrewshire HSCP 1283 202 1485 13.6 West Dunbartonshire HSCP 671 154 825 18.7 Total 8719 1720 10439 16.5
Source: CHSP_PS, October 2017
Of the 10,439 children, 83.6% (8,722) were screened using a Snellen test and 6,850 recorded with Acuity of 6/6 which is normal. A follow up with an Optometrist is recommended for children with an Acuity worse than 6/9 (if not wearing spectacles) and Acuity of 6/12 or worse (for those with spectacles). The highest proportion of children identified with poor acuity lived in Glasgow North West sector 31.4% and the lowest in Renfrewshire HSCP 9.2% (Table 4.9).
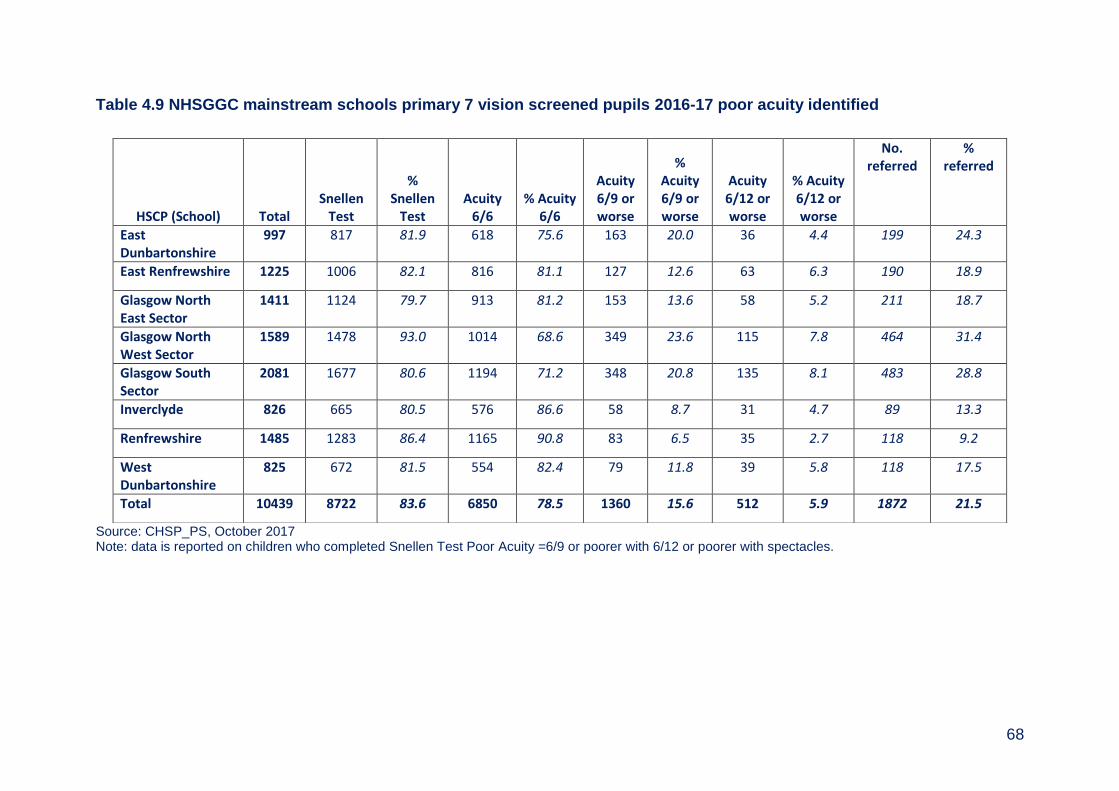
68
Table 4.9 NHSGGC mainstream schools primary 7 vision screened pupils 2016-17 poor acuity identified
Source: CHSP_PS, October 2017 Note: data is reported on children who completed Snellen Test Poor Acuity =6/9 or poorer with 6/12 or poorer with spectacles.
HSCP (School) Total Snellen
Test
% Snellen
Test Acuity
6/6 % Acuity
6/6
Acuity 6/9 or worse
% Acuity 6/9 or worse
Acuity 6/12 or worse
% Acuity 6/12 or worse
No. referred
% referred
East Dunbartonshire
997 817 81.9 618 75.6 163 20.0 36 4.4 199 24.3
East Renfrewshire 1225 1006 82.1 816 81.1 127 12.6 63 6.3 190 18.9
Glasgow North East Sector
1411 1124 79.7 913 81.2 153 13.6 58 5.2 211 18.7
Glasgow North West Sector
1589 1478 93.0 1014 68.6 349 23.6 115 7.8 464 31.4
Glasgow South Sector
2081 1677 80.6 1194 71.2 348 20.8 135 8.1 483 28.8
Inverclyde 826 665 80.5 576 86.6 58 8.7 31 4.7 89 13.3
Renfrewshire 1485 1283 86.4 1165 90.8 83 6.5 35 2.7 118 9.2
West Dunbartonshire
825 672 81.5 554 82.4 79 11.8 39 5.8 118 17.5
Total 10439 8722 83.6 6850 78.5 1360 15.6 512 5.9 1872 21.5

69
4.11. P7 Child Health Screening Information Systems Child Health Surveillance System–Preschool (CHS-PS) currently supports the delivery of the pre-school vision screening programme across NHS Greater Glasgow and Clyde. School vision testing is supported by the Child Health Surveillance System- School (CHS-S). Both CHS-PS and CHS-S are being reprocured by NHS Scotland.
4.12. P7 Challenges and Future Priorities
Ensure the co-operation of all nurseries to allow screening to take place.
Increase the number of children who attend pre-vision screening both in nursery or within a hospital setting.
Improve the recording of children who attend an Optometrist as a result of pre-vision or Primary 7 vision screening.
Ensure that changes in School Nursing provision for NHSGGC does not affect the Primary 7 vision screening programme, which is unique to the Board area.
Work with NHS Scotland and other boards to ensure the safe and effective continuity of vision screening activities during a change of IT systems.

70
Appendix 4.1 Members of Child Vision Screening Steering Group (As at March 2017) Dr Emilia Crighton Head of Health Services Section (Chair) Mrs Denise Bratten Optometrist Mr Paul Burton Information Manager Mrs Lin Calderwood Screening Service Delivery Manager Mrs Fiona Gilchrist Assistant Screening Programme Manager Ms Samara Hodi Head of Optometry Mrs Patricia Mackay Team Lead Children & Families, South Glasgow Mrs Carolyn MacLellan Lead Orthoptist Mr Eddie McVey Optometric Adviser Ms Morven Campbell Vice chair, AOC Ms Arlene Polet Children’s & Families Team Lead, Inverclyde Mrs Uzma Rehman Programme Manager, Public Health Mrs Diane Russell Lead Orthoptist Ms Elaine Salina Principal Optometrist Ms Anita Simmers Head of Vision, Science Dept, GCU Dr Kathy Spowart Paediatrician, Community Child Health Mrs Claudine Wallace Lecturer in Orthoptics, GCU

71
Appendix 4.2 Reporting Structure Child Vision Screening Steering Group
Key: _______ Direct Reports - - - - - - - Network Link
Public Health Screening Unit
Child Vision Screening Steering Group Chair: Dr E Crighton, CPHM
Pre-school Vision Screening Operational Group Chair: Mrs Fiona Gilchrist,
Assistant Programmes Manager
Child Health Surveillance Programme
Director of Public Health

72
Section 2
Adult Screening
73
Chapter 5 - Abdominal Aortic Aneurysm Screening
Summary
An abdominal aortic aneurysm (AAA) is a dilatation of the aorta within the abdomen where the aortic diameter is 3.0 cm or more. Aneurysms are strongly linked to increasing age, hypertension, smoking, other vascular disease and a positive family history of AAA.
Studies have found that approximately 7% of men aged 65 were found to have an AAA and it is less common in men and women under aged 65 years.
The aim of AAA screening is the early detection and elective repair of
symptomatic AAA in order to prevent spontaneous rupture. AAA screening is
associated with a 40% reduction in aneurysm related mortality.
All men aged 65 years in the Board area are invited to attend AAA screening by
a single ultrasound examination. Men aged over 65 years of age are able to
self-refer to the programme.
5,827 men aged 65 were invited to participate in the AAA Screening programme in 2016-2017.
4,680 (80.3%) took up screening, exceeding the minimum standard of 70%.
Uptake is poorest in the most socio-economically deprived areas and in ethnic minorities. There are also lower uptake rates in some HSCPs that are not wholly explained by socio-economic deprivation.
52 men (1.1%) were found to have an aneurysm measuring between 3.00 and 5.49 cm and are currently on surveillance.
6 men (0.1%) had an aneurysm measuring 5.5 cm or more that required surgical assessment and intervention.
All essential KPI’s for AAA screening were met.

74
Table of Contents
5.1. Background ..................................................................................................... 75
5.2. Aim of the Screening Programme and Eligible Population ......................... 75
5.3. Screening Test and Screening Pathway ....................................................... 75
5.4. Programme Performance and Delivery ......................................................... 76
5.5. Abdominal Aneurysm Screening Results and Mortality .............................. 81
5.6. Challenges and Future Priorities ................................................................... 82
75
5.1. Background An abdominal aortic aneurysm (AAA) is a dilatation of the aorta within the abdomen where the aortic diameter is 3.0 cm or more. Aneurysms are strongly linked to increasing age, hypertension, smoking, other vascular disease and a positive family history of AAA1.
Studies2 have found that approximately 7% of men aged 65 were found to have an AAA and it is less common in men and women under aged 65 years. When an AAA ruptures less than half of patients will reach hospital alive and when an operation is possible mortality is as high as 85%.
5.2. Aim of the Screening Programme and Eligible Population The aim of AAA screening is the early detection and elective repair of symptomatic AAA in order to prevent spontaneous rupture. AAA screening is associated with a 40% reduction in aneurysm related mortality. AAA screening was implemented across NHS Greater Glasgow and Clyde in February 2013. The national AAA screening programme performance and quality is monitored via defined National AAA Screening Standards3 and Key Performance Indicators (KPIs)4. All men aged 65 years who are resident in the NHSGGC area are invited to participate in the AAA screening programme. Men aged over 65 years of age are able to self-refer to the programme.
5.3. Screening Test and Screening Pathway The screening test involves a single abdominal scan using a portable ultrasound machine. The AAA IT application is used to appoint and manage the patient through their screening pathway. The application obtains the demographic details of the participants by linking with the Community Health Index (CHI). Screening takes
1 Campbell, H (2012) Vardulaki KA, Walker NM, Day NE, Duffy SW, Ashton HA, Scott, RAP (2000)
Quantifying the risks of hypertension, age, sex and smoking in patients with abdominal aortic aneurysm. British Journal of Surgery 87: 195-200. 2 Ashton HA, Buxton MJ, Day NE, Kim LG, Marteau TM, Scott RAP et al (2000). Multicentre Aneurysm Screening Study Group. The Multicentre Aneurysm Screening Study (MASS) into the effect of abdominal aortic aneurysm screening on mortality in men: a randomised controlled trial. Lancet 360 (9345): 1531-9. 3http://www.healthcareimprovementscotland.org/our_work/cardiovascular_disease/screening_for_aaa
/aaa_screening_standards.aspx (accessed January 2018) 4 http://www.isdscotland.org/Health-Topics/Public-Health/AAA-Screening/2017-03-07-AAA-KPI-
Definitions.pdf (accessed January 2018)
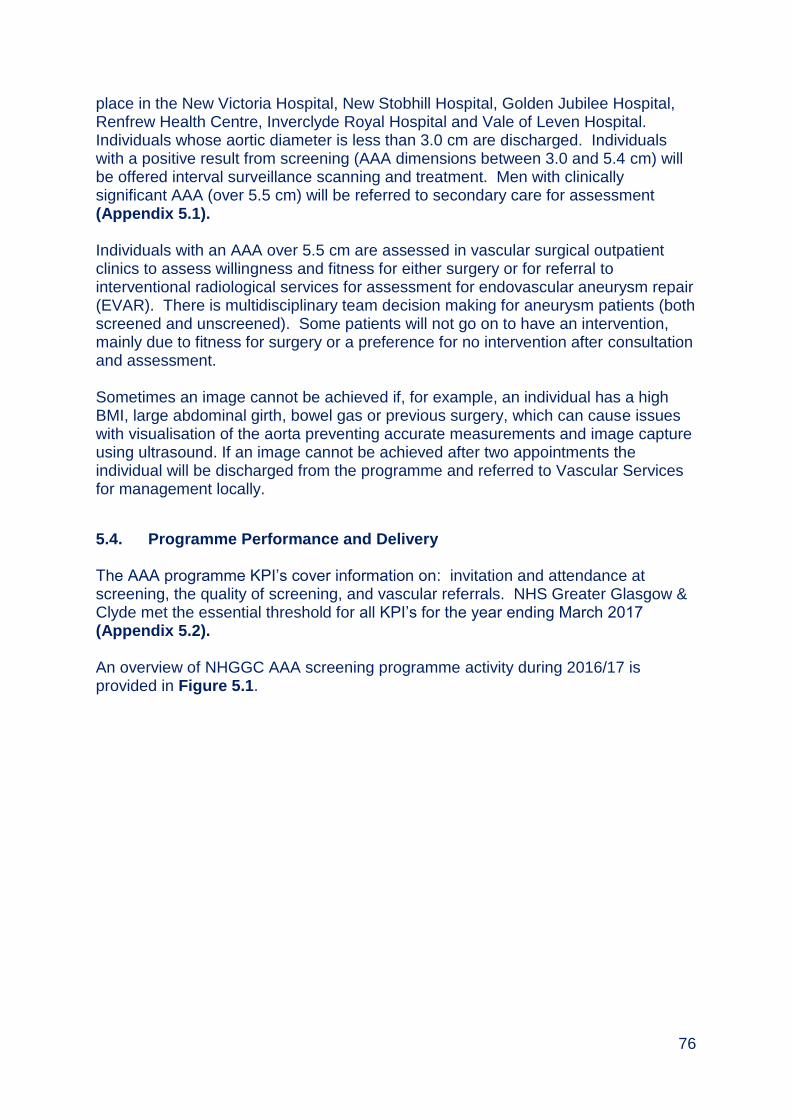
76
place in the New Victoria Hospital, New Stobhill Hospital, Golden Jubilee Hospital, Renfrew Health Centre, Inverclyde Royal Hospital and Vale of Leven Hospital. Individuals whose aortic diameter is less than 3.0 cm are discharged. Individuals with a positive result from screening (AAA dimensions between 3.0 and 5.4 cm) will be offered interval surveillance scanning and treatment. Men with clinically significant AAA (over 5.5 cm) will be referred to secondary care for assessment (Appendix 5.1). Individuals with an AAA over 5.5 cm are assessed in vascular surgical outpatient clinics to assess willingness and fitness for either surgery or for referral to interventional radiological services for assessment for endovascular aneurysm repair (EVAR). There is multidisciplinary team decision making for aneurysm patients (both screened and unscreened). Some patients will not go on to have an intervention, mainly due to fitness for surgery or a preference for no intervention after consultation and assessment. Sometimes an image cannot be achieved if, for example, an individual has a high BMI, large abdominal girth, bowel gas or previous surgery, which can cause issues with visualisation of the aorta preventing accurate measurements and image capture using ultrasound. If an image cannot be achieved after two appointments the individual will be discharged from the programme and referred to Vascular Services for management locally.
5.4. Programme Performance and Delivery The AAA programme KPI’s cover information on: invitation and attendance at screening, the quality of screening, and vascular referrals. NHS Greater Glasgow & Clyde met the essential threshold for all KPI’s for the year ending March 2017 (Appendix 5.2). An overview of NHGGC AAA screening programme activity during 2016/17 is provided in Figure 5.1.
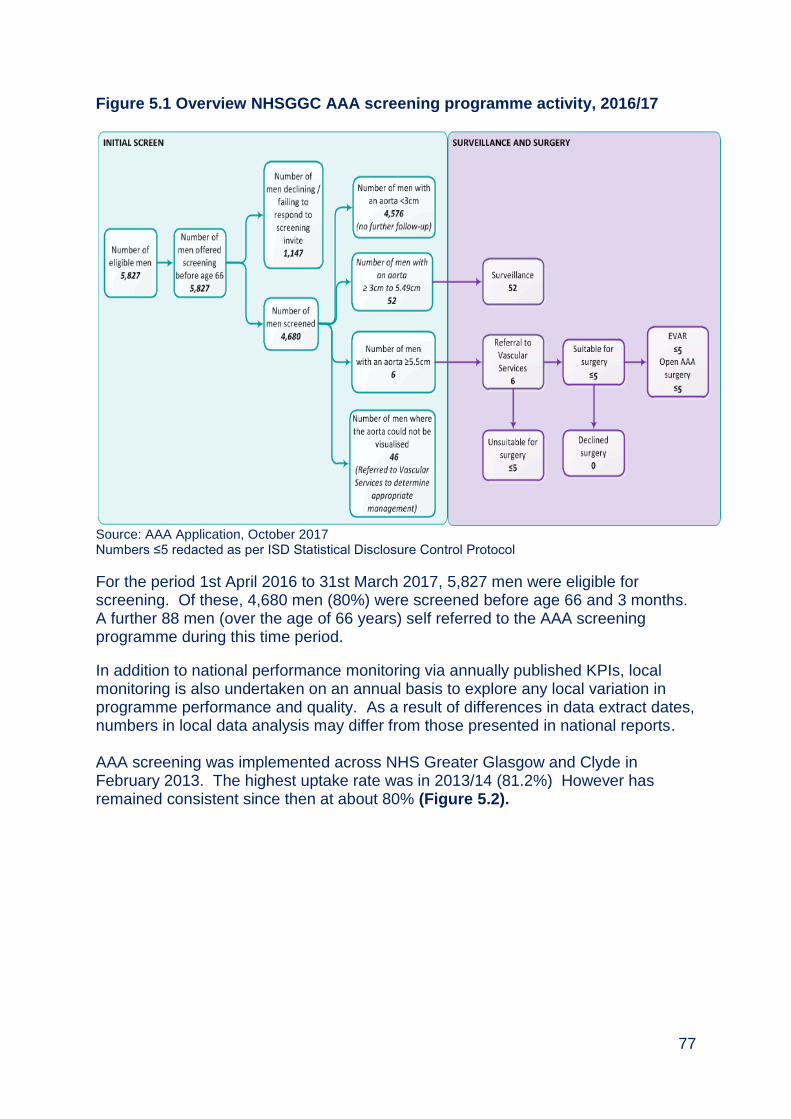
77
Figure 5.1 Overview NHSGGC AAA screening programme activity, 2016/17
Source: AAA Application, October 2017 Numbers ≤5 redacted as per ISD Statistical Disclosure Control Protocol
For the period 1st April 2016 to 31st March 2017, 5,827 men were eligible for screening. Of these, 4,680 men (80%) were screened before age 66 and 3 months. A further 88 men (over the age of 66 years) self referred to the AAA screening programme during this time period.
In addition to national performance monitoring via annually published KPIs, local monitoring is also undertaken on an annual basis to explore any local variation in programme performance and quality. As a result of differences in data extract dates, numbers in local data analysis may differ from those presented in national reports. AAA screening was implemented across NHS Greater Glasgow and Clyde in February 2013. The highest uptake rate was in 2013/14 (81.2%) However has remained consistent since then at about 80% (Figure 5.2).
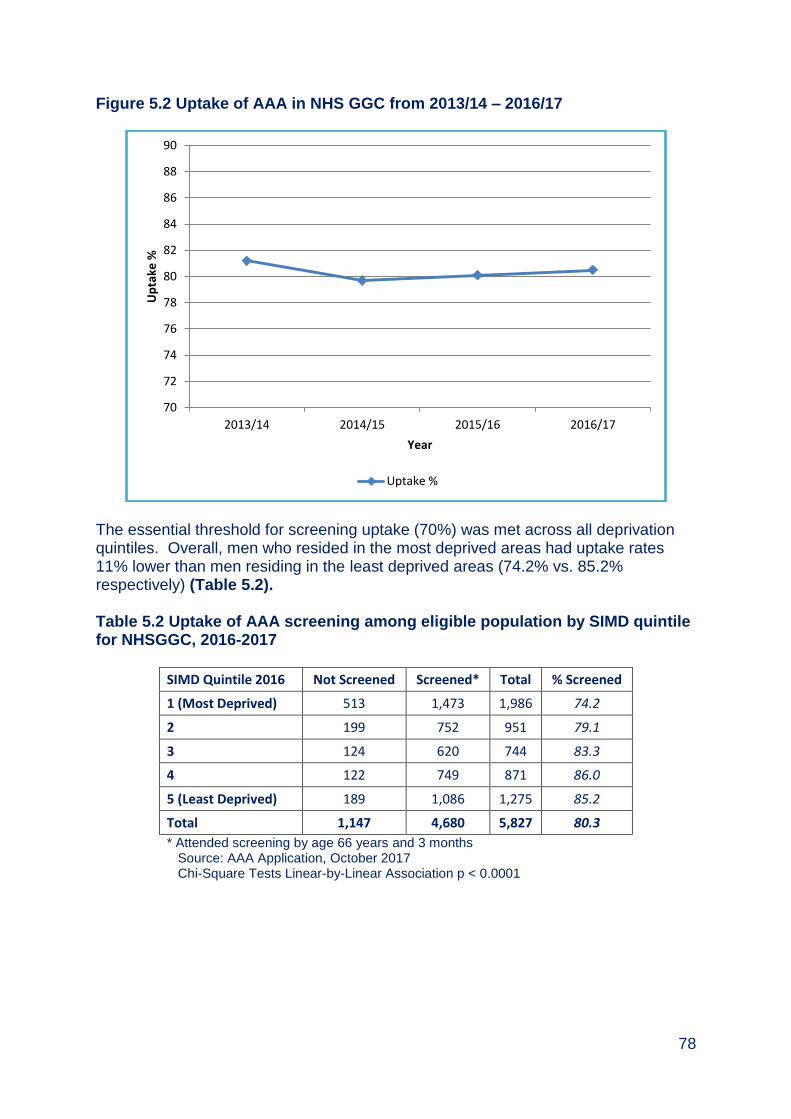
78
Figure 5.2 Uptake of AAA in NHS GGC from 2013/14 – 2016/17
The essential threshold for screening uptake (70%) was met across all deprivation quintiles. Overall, men who resided in the most deprived areas had uptake rates 11% lower than men residing in the least deprived areas (74.2% vs. 85.2% respectively) (Table 5.2). Table 5.2 Uptake of AAA screening among eligible population by SIMD quintile for NHSGGC, 2016-2017
SIMD Quintile 2016 Not Screened Screened* Total % Screened
1 (Most Deprived) 513 1,473 1,986 74.2
2 199 752 951 79.1
3 124 620 744 83.3
4 122 749 871 86.0
5 (Least Deprived) 189 1,086 1,275 85.2
Total 1,147 4,680 5,827 80.3
* Attended screening by age 66 years and 3 months Source: AAA Application, October 2017 Chi-Square Tests Linear-by-Linear Association p < 0.0001
70
72
74
76
78
80
82
84
86
88
90
2013/14 2014/15 2015/16 2016/17
Up
take
%
Year
Uptake %
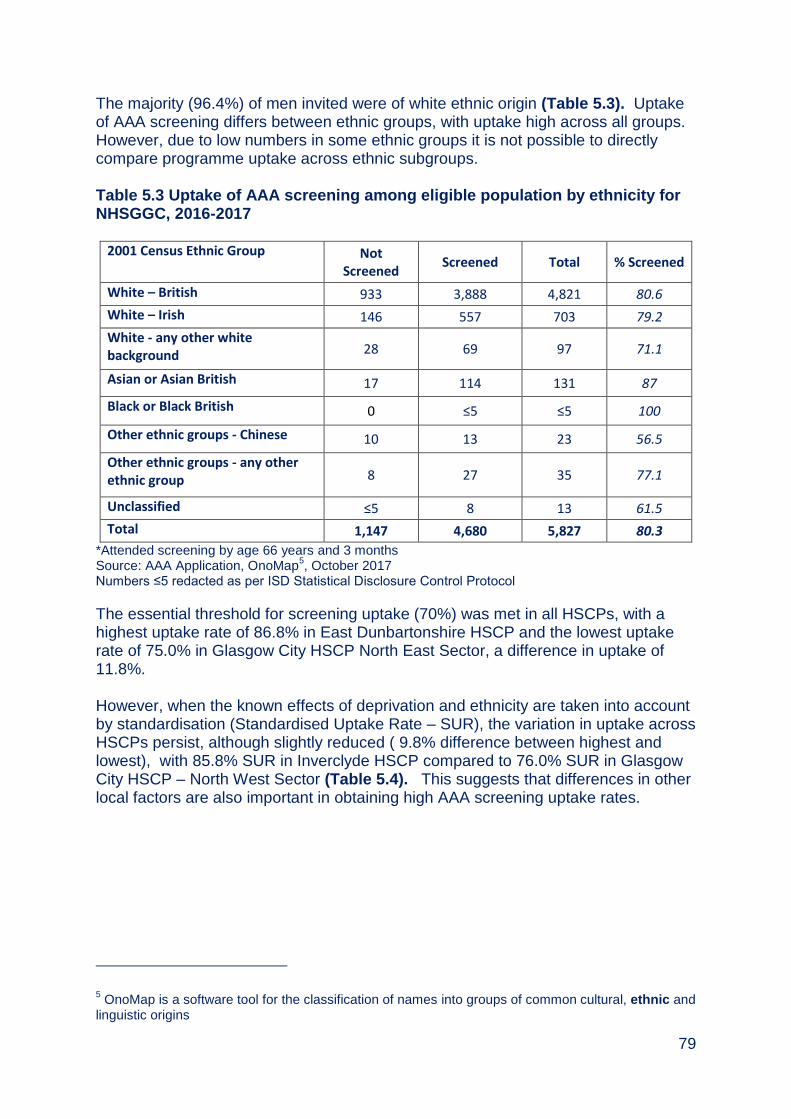
79
The majority (96.4%) of men invited were of white ethnic origin (Table 5.3). Uptake of AAA screening differs between ethnic groups, with uptake high across all groups. However, due to low numbers in some ethnic groups it is not possible to directly compare programme uptake across ethnic subgroups. Table 5.3 Uptake of AAA screening among eligible population by ethnicity for NHSGGC, 2016-2017
2001 Census Ethnic Group Not Screened
Screened Total % Screened
White – British 933 3,888 4,821 80.6
White – Irish 146 557 703 79.2
White - any other white background 28 69 97 71.1
Asian or Asian British 17 114 131 87
Black or Black British 0 ≤5 ≤5 100
Other ethnic groups - Chinese 10 13 23 56.5
Other ethnic groups - any other ethnic group 8 27 35 77.1
Unclassified ≤5 8 13 61.5
Total 1,147 4,680 5,827 80.3
*Attended screening by age 66 years and 3 months Source: AAA Application, OnoMap
5, October 2017
Numbers ≤5 redacted as per ISD Statistical Disclosure Control Protocol
The essential threshold for screening uptake (70%) was met in all HSCPs, with a highest uptake rate of 86.8% in East Dunbartonshire HSCP and the lowest uptake rate of 75.0% in Glasgow City HSCP North East Sector, a difference in uptake of 11.8%. However, when the known effects of deprivation and ethnicity are taken into account by standardisation (Standardised Uptake Rate – SUR), the variation in uptake across HSCPs persist, although slightly reduced ( 9.8% difference between highest and lowest), with 85.8% SUR in Inverclyde HSCP compared to 76.0% SUR in Glasgow City HSCP – North West Sector (Table 5.4). This suggests that differences in other local factors are also important in obtaining high AAA screening uptake rates.
5 OnoMap is a software tool for the classification of names into groups of common cultural, ethnic and
linguistic origins
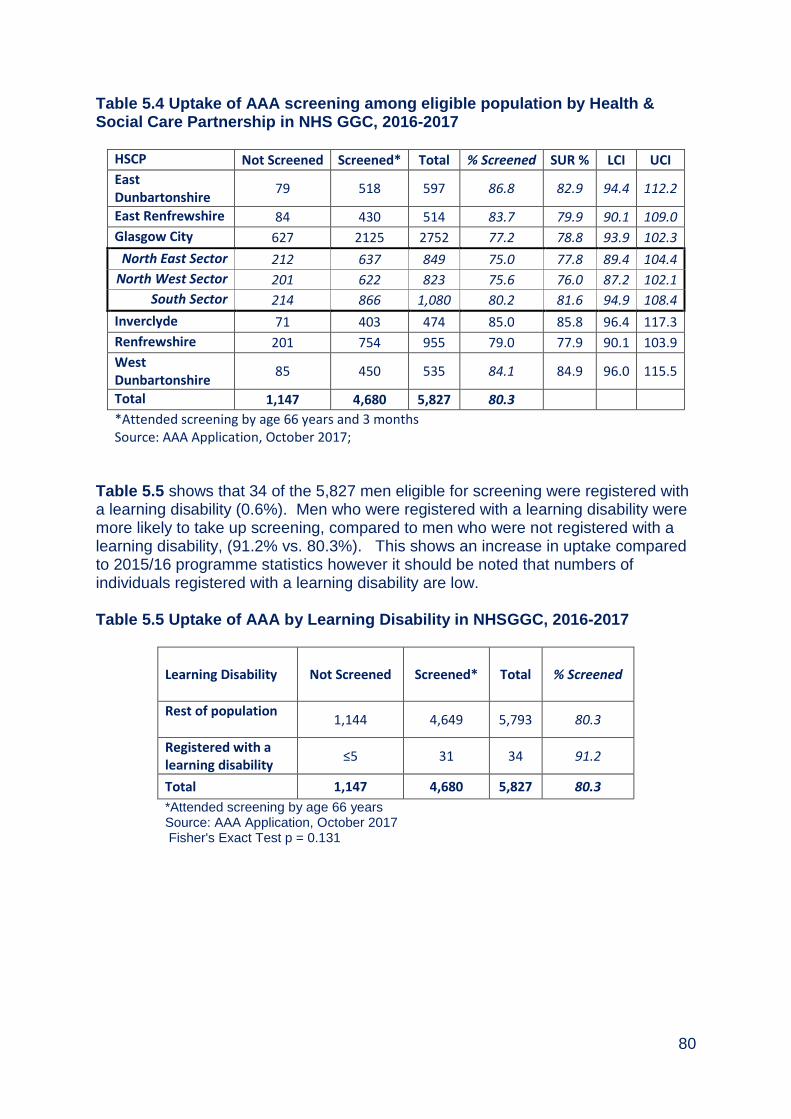
80
Table 5.4 Uptake of AAA screening among eligible population by Health & Social Care Partnership in NHS GGC, 2016-2017
HSCP Not Screened Screened* Total % Screened SUR % LCI UCI
East Dunbartonshire
79 518 597 86.8 82.9 94.4 112.2
East Renfrewshire 84 430 514 83.7 79.9 90.1 109.0
Glasgow City 627 2125 2752 77.2 78.8 93.9 102.3
North East Sector 212 637 849 75.0 77.8 89.4 104.4
North West Sector 201 622 823 75.6 76.0 87.2 102.1
South Sector 214 866 1,080 80.2 81.6 94.9 108.4
Inverclyde 71 403 474 85.0 85.8 96.4 117.3
Renfrewshire 201 754 955 79.0 77.9 90.1 103.9
West Dunbartonshire
85 450 535 84.1 84.9 96.0 115.5
Total 1,147 4,680 5,827 80.3
*Attended screening by age 66 years and 3 months Source: AAA Application, October 2017;
Table 5.5 shows that 34 of the 5,827 men eligible for screening were registered with a learning disability (0.6%). Men who were registered with a learning disability were more likely to take up screening, compared to men who were not registered with a learning disability, (91.2% vs. 80.3%). This shows an increase in uptake compared to 2015/16 programme statistics however it should be noted that numbers of individuals registered with a learning disability are low. Table 5.5 Uptake of AAA by Learning Disability in NHSGGC, 2016-2017
Learning Disability Not Screened Screened* Total
% Screened
Rest of population
1,144 4,649 5,793 80.3
Registered with a learning disability
≤5 31 34 91.2
Total 1,147 4,680 5,827 80.3
*Attended screening by age 66 years Source: AAA Application, October 2017 Fisher's Exact Test p = 0.131

81
5.5. Abdominal Aneurysm Screening Results and Mortality Table 5.6 shows that 58 men (1.2%) had an enlarged aorta (≥3cm). Fifty two (1.1%) men had an aorta measuring between 3cm to 5.49cm, requiring surveillance scans. Six men (0.1%) had a large aneurysm measuring 5.5 cm or more, requiring surgical assessment and intervention. Of the 88 men who self referred to the programme, less than 5 had an enlarged aorta (≥3cm). Table 5.6 Abdominal Aneurysm screening results for NHSGGC, 2016-2017
Result Type
Largest Measure (cm)
<3 ≥3 - 5.49 ≥5.5 Not
Known Total
Negative 4,576 0 0 0 4,576
Non Visualisation
0 0 0 45 45
Positive 0 52 6 0 58
Technical Fail 0 0 0 ≤5 ≤5
Total 4,576 52 6 46 4,680
Source: AAA Application, NRS, October 2017 Numbers ≤5 redacted Redact numbers ≤5 as per ISD Statistical Disclosure Control Protocol
Table 5.7 shows that there were no deaths reported in those patients with an aneurysm measuring 5.5 cm or more. Table 5.7 Abdominal Aneurysm screening mortality for NHSGGC, 2016-2017
Largest Measure (cm)
Mortality <3 ≥3 - 5.49
≥5.5 (No Surgery)*
≥5.5 (Surgery)
Not Known
Total
Total Deceased 33 ≤5 0 ≤5 ≤5 35
Total Not Deceased 4,543 51 ≤5 ≤5 45 4,645
Total 4,576 52 ≤5 ≤5 46 4,680
% Mortality 0.7 1.9 0.0 0.0 2.2 4.8
Source: AAA Application, NRS, October 2017 Numbers ≤5 redacted Redact numbers ≤5 as per ISD Statistical Disclosure Control Protocol
82
5.6. Challenges and Future Priorities
To maintain the screening staffing level and screening locations to ensure stability in the delivery of AAA Screening Programme.
To continue to monitor vascular waiting times.
Implementation of national External Quality Assurance.
To continue to review uptake for men registered with a learning disability and for men registered with a severe and enduring mental illness, and work with specialist learning disability and mental health staff to develop approaches to support participation in AAA screening.

83
Appendix 5.1 Positive Abdominal Aortic Aneurysm Screening Pathway
Small AAA
(3.0 – 4.4 cm)
Medium AAA
(4.5 – 5.4cm)
3 monthly rescan
Repeat ultrasound
scanNo growth
Large AAA
(>5.4 cm)
Referral to
Vascular Service
AAA rupture
Assessment by
Vascular service
AAA grows larger
Rescanned until
clinical decision to
discharge
Patient discharged
from programme
Surgery by
Vascular Service
Risks outweight
benefits of surgery
Surgery
Patient discharged
1 year scan
No growth AAA rupture AAA grows larger
Rescanned for 15
years
Patient discharged
from programme
Surgery
Patient discharged
Abdominal
Ultrasound
Aorta
Less than 3.0 cm
Patient discharged
from programme

84
Appendix 5.2
Abdominal Aortic Aneurysm Key Performance Indicators, NHS Greater Glasgow & Clyde (2015 – 2017)
6 KPI 3.1 Cumulative total to 31 March 2017 95.1% (39/41 seen by vascular specialist within
2 weeks) 7 KPI 3.2 Cumulative total to 31 March 2017 65.7% (23/35 operated on within 8 weeks
appropriate for surgery)
KPI
Description Essential
Threshold Desirable Threshold
Year ending
31st
March 2015
Year ending
31st
March 2016
Year ending
31st
March 2017
Invitation and attendance
1.1 Percentage of eligible population who are sent an initial offer to screening before age 66
≥ 90% 100% 69.0% 99.9% 100.0%
1.2 Percentage of men offered screening who are tested before age 66 and 3 months
≥ 70% ≥ 85% 79.7% 80.1% 80.5%
1.3 Percentage of men residing in SIMD 1 areas (most deprived) offered screening who are tested before age 66 and 3 months;
≥ 70% ≥ 85% 72.8% 72.7% 73.1%
1.4a Percentage of annual surveillance appointments due where men are tested within 6 weeks of due date
≥ 90% 100% 93.3% 93.0% 94.0%
1.4b Percentage of quarterly surveillance appointments due where men are tested within 4 weeks of due date
≥ 90% 100% 96.7% 98.6% 92.1%
Quality of screening
2.1a Percentage of screening encounters where aorta could not be visualised
< 3% < 1% 1.6% 2.4% 2.8%
2.1b Percentage of men screened where aorta could not be visualised
< 3% < 1% 1.4% 2.1% 2.3%
2.2 Percentage of screened images that failed the quality assurance audit and required immediate recall
< 4% < 1% 0.4% 1.4% 1.0%
Referral, clinical intervention and outcomes
3.1 Percentage of men with AAA≥5.5cm seen by vascular specialist within two weeks of screening
≥ 75% ≥ 95% 81.8% 100.0% 100.0%6
3.2 Percentage of men with AAA≥5.5cm deemed appropriate for intervention/operated on by vascular specialist within eight weeks of screening
≥ 60% ≥ 80% 77.8% 53.8% 62.5%7

85
Appendix 5.3 Members of Abdominal Aortic Aneurysm Screening Steering Group (as at March 2017) Dr David Morrison Consultant in Public Health Medicine (Chair) Mr Paul Burton Information Manager Mrs Lin Calderwood HI&T Service Delivery Manager Mrs Mairi Devine Radiographer Ms Mary Fingland LMC Representative Mrs Irene Fyfe Health Records Services Manager Mrs Antonella Grimon AAA Data Administrator Dr Oliver Harding Consultant in Public Health Medicine, NHS Forth
Valley Ms Heather Jarvie Public Health Programme Manager Dr Ram Kasthuri Consultant Interventional Radiologist Ms Karen Loudon Clinical Service Manager (Vascular) Miss Denise Lyden Project Officer, Public Health Mrs Elizabeth Rennie Programme Manager, Screening Department Ms Sandra Robertson Radiology Department Manager, Forth Valley Mrs Lynn Ross General Manager, Diagnostics Mr Wesley Stuart Lead Clinician
86
Chapter 6 – Bowel Screening Programme Summary
Colorectal (Bowel) Cancer is the third most common cancer in Scotland for both men and women in 2015. Ninety five percent of bowel cancers detected are among people aged over 50 years of age.
In the time period between 2005 and 2015, the age-standardised incidence rate of bowel cancer in Scotland decreased in both men and women (by 14.4% and 3.1% respectively). Age-standardised mortality rates also decreased in men by 9.4% and in women by 2.1%.
In 2015, 691 people (354 men and 337 women) residing in the NHS
Greater Glasgow & Clyde area were diagnosed with bowel cancer. In the
same year, 322 people (168 men and 154 women) with a diagnosis of
bowel cancer died.
The aim of bowel screening is to detect bowel cancer at an early stage where treatment is more effective. In some cases, pre-cancerous polyps can be removed and cancer prevented. The programme invites all men and women between the ages of 50 – 74.
In 2015-17, 355,285 NHSGGC residents were invited to participate in the bowel screening programme.
The overall uptake of screening was 172,643, 48.6%, against a target of 60%.
Uptake is poorest in men, younger people (aged 50-54 years), the most socio-economically deprived residents with learning disabilities and in ethnic minorities. There are also lower uptake rates in some HSCPs that are not wholly explained by socio-economic deprivation.
Results are most likely to be positive among men, older people and the most socio-economically deprived.
In residents of NHS Greater Glasgow and Clyde area, 426 people were diagnosed with bowel cancer in 2016, of which 120 (28.2%) were detected through screening.
A new screening test, qFIT (quantitative faecal immunochemical test) was introduced in November 2017, accompanied by public information campaigns. We anticipate that this will increase uptake by about 5% and NHSGGC have added an information letter prior to screening, to further help encourage participation.
87
Table of Contents
6.1. Background ..................................................................................................... 88
6.2. Aim of the Screening Programme ................................................................. 89
6.3. Eligible Population ......................................................................................... 90
6.4. The Screening Test and Pathway .................................................................. 90
6.5. Programme Performance and Delivery ......................................................... 91
6.6. Screening Test Positivity ............................................................................... 95
6.7. Adenoma and Polyp Detection ...................................................................... 97
6.8. Quality Improvement in Colonoscopy .......................................................... 98
6.9. Challenges and Future Priorities ................................................................... 99

88
6.1. Background Colorectal (Bowel) Cancer is the third most common cancer in Scotland for both men and women8. Every year in Scotland approximately 4,000 people are diagnosed with the disease. Ninety five percent of bowel cancers detected are among people aged over 50 years of age9. In 2015, the most recent year for which completed data is available, 691 people (354 men and 337 women) residing in the NHSGGC area were diagnosed with bowel cancer10. This gives an age-standardised incidence rate of 82.9per 100,000 population for men, lower than the Scotland rate. For women this gives an age-standardised incidence rate of 58.4per 100,000 population for men, comparable with the Scotland rate. In the same year, 322 people (168 men and 154 women) with a diagnosis of bowel cancer died, giving a standardised mortality rate of 42.7 per 100,000 population for men 26.2 per 100,000 population for women. In the time period between 2005 and 2015, the age-standardised incidence rate of bowel cancer in Scotland decreased in both men and women (by 14.4% and 3.1% respectively). Age-standardised mortality rates also decreased in men by 9.4% and in women by 2.1%. Standardised incidence and mortality rates over rolling 3 year periods for cervical cancer for NHSGGC and Scotland are illustrated in Figure 6.1. The main preventable risk factors for bowel cancer are lack of physical activity; consumption of red and processed meats and other typical elements of the “Western diet”; alcohol; and long term smoking11.
8 http://www.isdscotland.org/Health-Topics/Cancer/Publications/2017-10-
31/Cancer_in_Scotland_summary_m.pdf (accessed January 2018) 9 http://www.isdscotland.org/Health-topics/Cancer/Bowel-Screening/ (accessed January 2018)
10 http://www.isdscotland.scot.nhs.uk/Health-Topics/Cancer/Publications/2017-04-
25/i_cancer_colorectal.xls (accessed January 2018) 11
https://www.isdscotland.org/Health-Topics/Cancer/Publications/2017-04-25/2017-04-25-Cancer-Incidence-Report.pdf(accessed January 2018)

89
Figure 6.1: Colorectal Cancer Registration & Mortality 1997-2015 (Rolling 3 Years) European Age Standardised Rate (EASR) Per 100,000 Population. (Source: ISD March 2017)
6.2. Aim of the Screening Programme The Scottish Bowel Screening Programme was fully implemented across Scotland in 2009. The purpose of bowel screening is to detect colorectal cancers at the earliest possible time so that treatment may be offered promptly. It is believed that very early detection of colorectal cancers in this way can result in more effective treatment which may be more likely to reduce deaths from colorectal cancer. In addition, the removal of precancerous lesions could lead to a reduction in the incidence of colorectal cancer. The national bowel screening programme performance and quality is monitored via defined Key Performance Indicators (KPI’s)12 and National Bowel Screening Standards13.
12
http://isdscotland.org/Health-Topics/Cancer/Bowel-Screening/ (accessed January 2018) 13
http://www.healthcareimprovementscotland.org/our_work/cancer_care_improvement/programme_resources/bowel_screening_standards.aspx(accessed January 2018)
0 5
10 15 20 25 30 35 40 45 50 55 60 65 70 75 80 85 90 95
100 105 110 115 120
EASR
Pe
r 1
00
,00
0 P
op
ula
tio
n
Years Males Scotland Registration EASR Males Scotland Mortality EASR
Males NHSGGC Registration EASR Males NHSGGC Mortality EASR
Females Scotland Registration EASR Females Scotland Mortality EASR
Females NHSGGC Registration EASR Females NHSGGC Mortality EASR
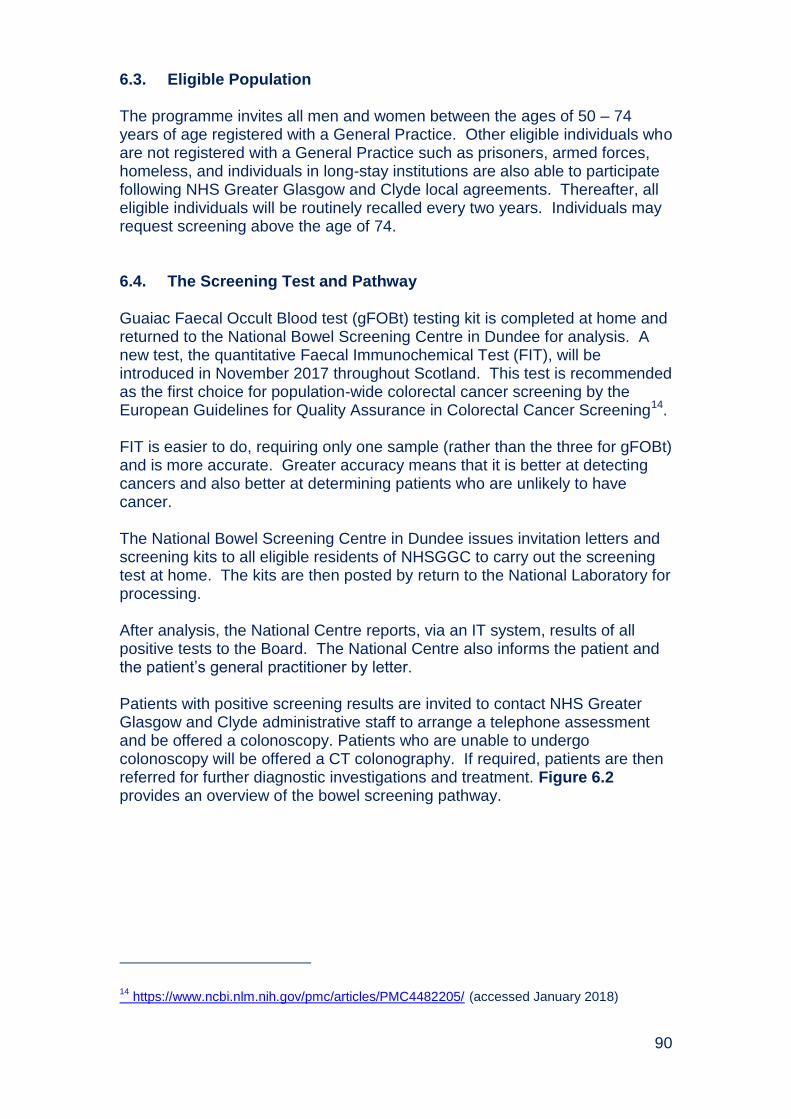
90
6.3. Eligible Population
The programme invites all men and women between the ages of 50 – 74 years of age registered with a General Practice. Other eligible individuals who are not registered with a General Practice such as prisoners, armed forces, homeless, and individuals in long-stay institutions are also able to participate following NHS Greater Glasgow and Clyde local agreements. Thereafter, all eligible individuals will be routinely recalled every two years. Individuals may request screening above the age of 74. 6.4. The Screening Test and Pathway
Guaiac Faecal Occult Blood test (gFOBt) testing kit is completed at home and returned to the National Bowel Screening Centre in Dundee for analysis. A new test, the quantitative Faecal Immunochemical Test (FIT), will be introduced in November 2017 throughout Scotland. This test is recommended as the first choice for population-wide colorectal cancer screening by the European Guidelines for Quality Assurance in Colorectal Cancer Screening14. FIT is easier to do, requiring only one sample (rather than the three for gFOBt) and is more accurate. Greater accuracy means that it is better at detecting cancers and also better at determining patients who are unlikely to have cancer. The National Bowel Screening Centre in Dundee issues invitation letters and screening kits to all eligible residents of NHSGGC to carry out the screening test at home. The kits are then posted by return to the National Laboratory for processing. After analysis, the National Centre reports, via an IT system, results of all positive tests to the Board. The National Centre also informs the patient and the patient’s general practitioner by letter. Patients with positive screening results are invited to contact NHS Greater Glasgow and Clyde administrative staff to arrange a telephone assessment and be offered a colonoscopy. Patients who are unable to undergo colonoscopy will be offered a CT colonography. If required, patients are then referred for further diagnostic investigations and treatment. Figure 6.2 provides an overview of the bowel screening pathway.
14
https://www.ncbi.nlm.nih.gov/pmc/articles/PMC4482205/ (accessed January 2018)
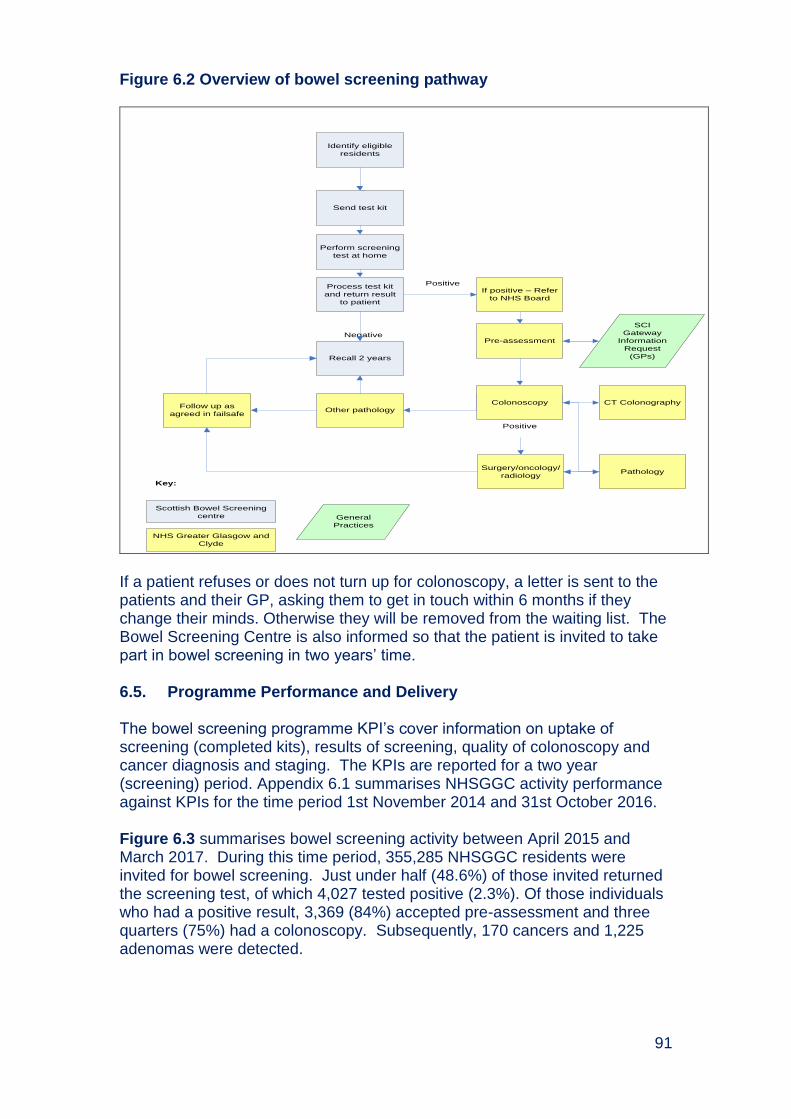
91
Figure 6.2 Overview of bowel screening pathway
Identify eligible
residents
Send test kit
Process test kit
and return result
to patient
If positive – Refer
to NHS Board
Pre-assessment
Colonoscopy
Surgery/oncology/
radiology
SCI
Gateway
Information
Request
(GPs)
CT Colonography
Pathology
Other pathologyFollow up as
agreed in failsafe
Negative
Positive
Scottish Bowel Screening
centre
NHS Greater Glasgow and
Clyde
General
Practices
Key:
Recall 2 years
Positive
Perform screening
test at home
If a patient refuses or does not turn up for colonoscopy, a letter is sent to the patients and their GP, asking them to get in touch within 6 months if they change their minds. Otherwise they will be removed from the waiting list. The Bowel Screening Centre is also informed so that the patient is invited to take part in bowel screening in two years’ time. 6.5. Programme Performance and Delivery The bowel screening programme KPI’s cover information on uptake of screening (completed kits), results of screening, quality of colonoscopy and cancer diagnosis and staging. The KPIs are reported for a two year (screening) period. Appendix 6.1 summarises NHSGGC activity performance against KPIs for the time period 1st November 2014 and 31st October 2016. Figure 6.3 summarises bowel screening activity between April 2015 and March 2017. During this time period, 355,285 NHSGGC residents were invited for bowel screening. Just under half (48.6%) of those invited returned the screening test, of which 4,027 tested positive (2.3%). Of those individuals who had a positive result, 3,369 (84%) accepted pre-assessment and three quarters (75%) had a colonoscopy. Subsequently, 170 cancers and 1,225 adenomas were detected.
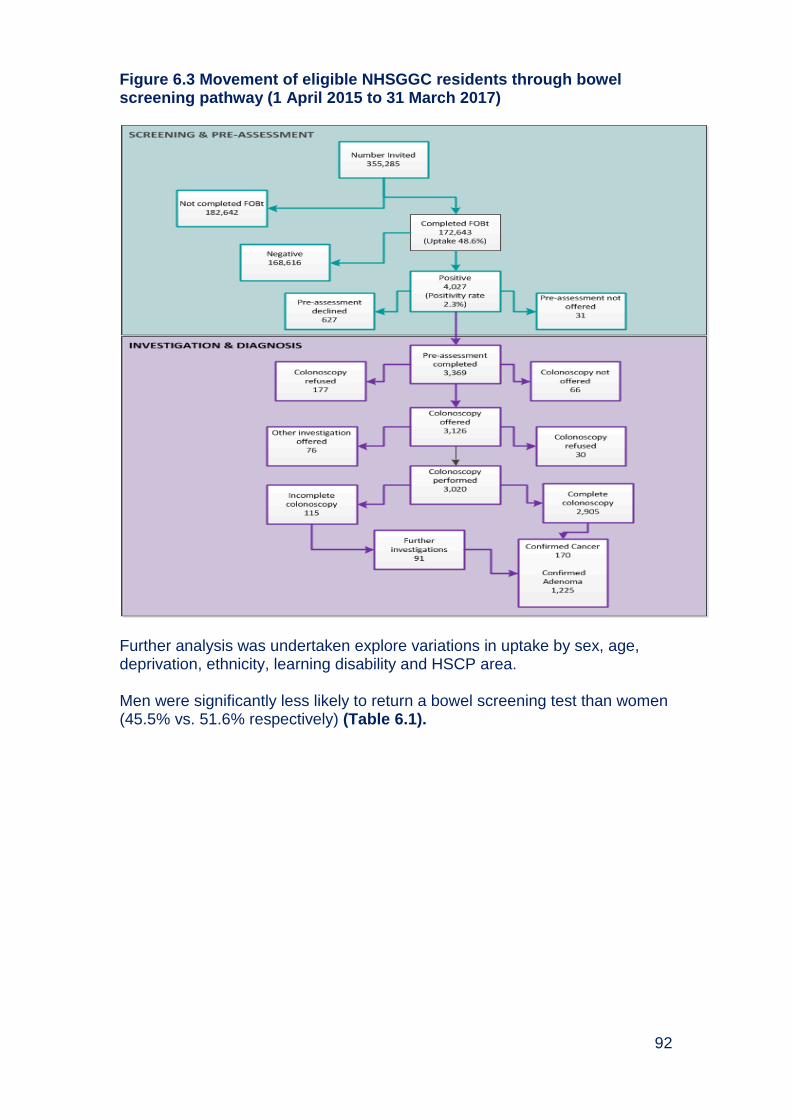
92
Figure 6.3 Movement of eligible NHSGGC residents through bowel screening pathway (1 April 2015 to 31 March 2017)
Further analysis was undertaken explore variations in uptake by sex, age, deprivation, ethnicity, learning disability and HSCP area. Men were significantly less likely to return a bowel screening test than women (45.5% vs. 51.6% respectively) (Table 6.1).

93
Table 6.1 Uptake of bowel screening by sex in NHSGGC, 2015-17
Sex Not Screened Screened Total % Screened
Male 95,585 79,956 175,541 45.5
Female 87,057 92,687 179,744 51.6
Total 182,642 172,643 355,285 48.6
Chi-Square Tests p < 0.0001 Source: Bowel Screening IT system (May 2017)
There was progressively greater uptake of bowel screening with increasing age (Table 6.2). Uptake was lowest among those who were first invited for screening (aged 50-52 years), at 38.9% and increased to 58.2% between 65 and 74 years. However, no age group achieved the minimum uptake target of 60%.
Table 6.2 Uptake of bowel screening by age in NHGGC, 2015-17
Age Group Not Screened Screened Total % Screened
50-54 67,651 4,4846 112,497 39.9
(50-52) (46,355) (29,512) (7,586) (38.9)
55-59 43,802 3,8815 82,617 47.0
60-64 26,251 27,015 53,266 50.7
65-69 29,392 40,855 70,247 58.2
70-74 15,546 21,112 36,658 57.6
Total 182,642 172,643 355,285 48.6
Chi-Square Tests Linear-by-Linear Association p < 0.0001 Source: Bowel Screening IT system (May 2017)
The difference in uptake between men and women was greatest at younger ages and much smaller at older ages (Table 6.7). There was a consistent pattern that uptake of bowel screening programme increased with decreasing levels of deprivation (Table 6.3). It was lowest in people living in the most deprived Board areas (39.5%) and highest in the least deprived areas (59.5%).
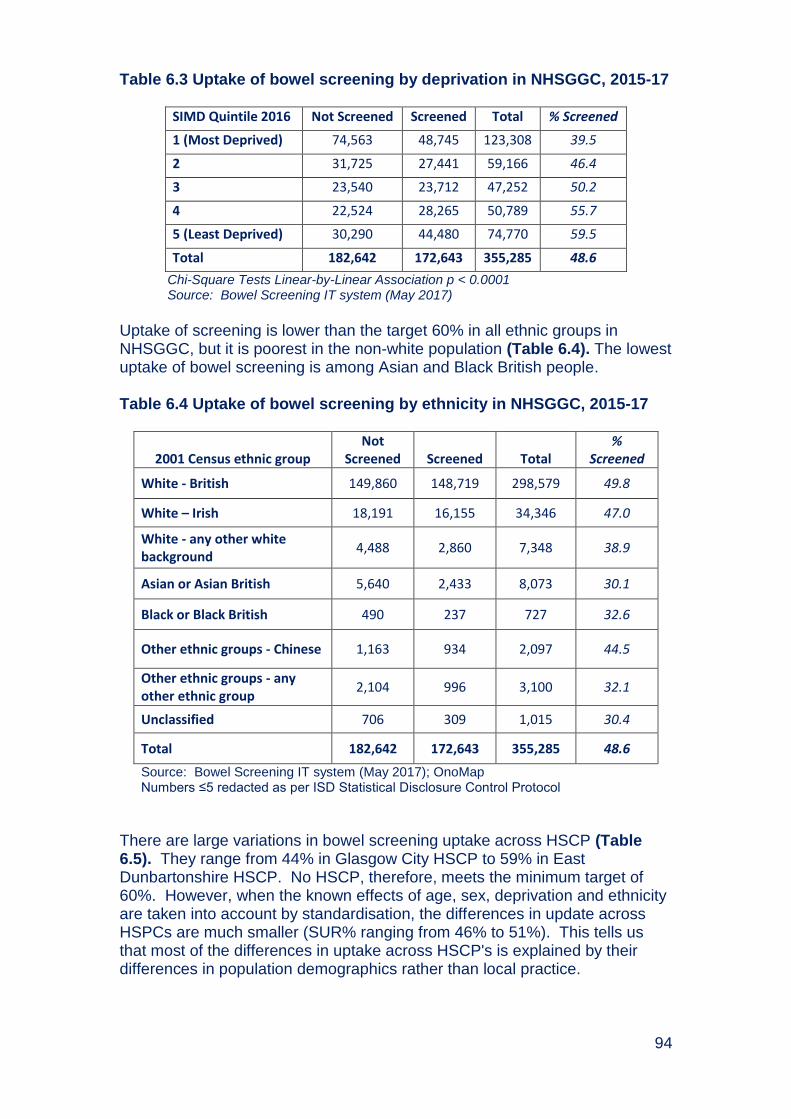
94
Table 6.3 Uptake of bowel screening by deprivation in NHSGGC, 2015-17
SIMD Quintile 2016 Not Screened Screened Total % Screened
1 (Most Deprived) 74,563 48,745 123,308 39.5
2 31,725 27,441 59,166 46.4
3 23,540 23,712 47,252 50.2
4 22,524 28,265 50,789 55.7
5 (Least Deprived) 30,290 44,480 74,770 59.5
Total 182,642 172,643 355,285 48.6
Chi-Square Tests Linear-by-Linear Association p < 0.0001 Source: Bowel Screening IT system (May 2017)
Uptake of screening is lower than the target 60% in all ethnic groups in NHSGGC, but it is poorest in the non-white population (Table 6.4). The lowest uptake of bowel screening is among Asian and Black British people. Table 6.4 Uptake of bowel screening by ethnicity in NHSGGC, 2015-17
2001 Census ethnic group Not
Screened Screened Total %
Screened
White - British 149,860 148,719 298,579 49.8
White – Irish 18,191 16,155 34,346 47.0
White - any other white background
4,488 2,860 7,348 38.9
Asian or Asian British 5,640 2,433 8,073 30.1
Black or Black British 490 237 727 32.6
Other ethnic groups - Chinese 1,163 934 2,097 44.5
Other ethnic groups - any other ethnic group
2,104 996 3,100 32.1
Unclassified 706 309 1,015 30.4
Total 182,642 172,643 355,285 48.6
Source: Bowel Screening IT system (May 2017); OnoMap Numbers ≤5 redacted as per ISD Statistical Disclosure Control Protocol
There are large variations in bowel screening uptake across HSCP (Table 6.5). They range from 44% in Glasgow City HSCP to 59% in East Dunbartonshire HSCP. No HSCP, therefore, meets the minimum target of 60%. However, when the known effects of age, sex, deprivation and ethnicity are taken into account by standardisation, the differences in update across HSPCs are much smaller (SUR% ranging from 46% to 51%). This tells us that most of the differences in uptake across HSCP's is explained by their differences in population demographics rather than local practice.
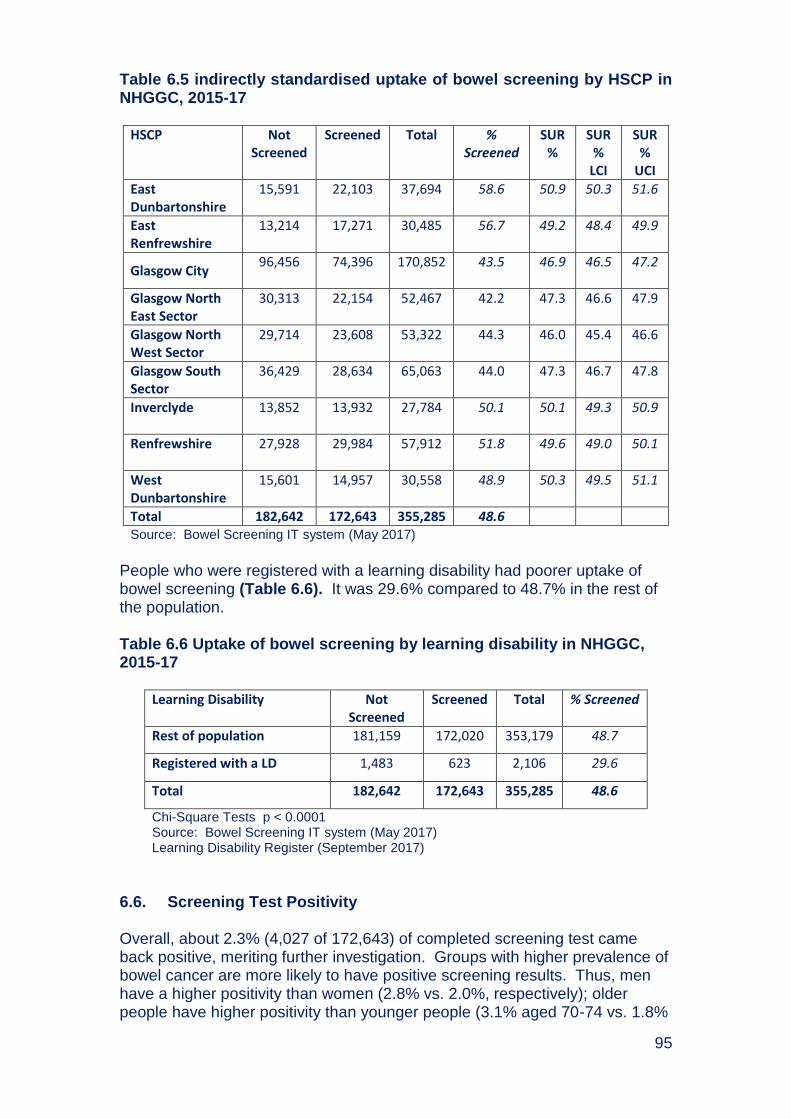
95
Table 6.5 indirectly standardised uptake of bowel screening by HSCP in NHGGC, 2015-17
HSCP Not
Screened Screened Total %
Screened SUR
% SUR
% LCI
SUR %
UCI
East Dunbartonshire
15,591 22,103 37,694 58.6 50.9 50.3 51.6
East Renfrewshire
13,214 17,271 30,485 56.7 49.2 48.4 49.9
Glasgow City 96,456 74,396 170,852 43.5
46.9 46.5 47.2
Glasgow North East Sector
30,313 22,154 52,467 42.2 47.3 46.6 47.9
Glasgow North West Sector
29,714 23,608 53,322 44.3 46.0 45.4 46.6
Glasgow South Sector
36,429 28,634 65,063 44.0 47.3 46.7 47.8
Inverclyde
13,852 13,932 27,784 50.1 50.1 49.3 50.9
Renfrewshire
27,928 29,984 57,912 51.8 49.6 49.0 50.1
West Dunbartonshire
15,601 14,957 30,558 48.9 50.3 49.5 51.1
Total 182,642 172,643 355,285 48.6 Source: Bowel Screening IT system (May 2017)
People who were registered with a learning disability had poorer uptake of bowel screening (Table 6.6). It was 29.6% compared to 48.7% in the rest of the population. Table 6.6 Uptake of bowel screening by learning disability in NHGGC, 2015-17
Learning Disability Not
Screened Screened Total % Screened
Rest of population 181,159 172,020 353,179 48.7
Registered with a LD 1,483 623 2,106 29.6
Total 182,642 172,643 355,285 48.6
Chi-Square Tests p < 0.0001 Source: Bowel Screening IT system (May 2017) Learning Disability Register (September 2017)
6.6. Screening Test Positivity Overall, about 2.3% (4,027 of 172,643) of completed screening test came back positive, meriting further investigation. Groups with higher prevalence of bowel cancer are more likely to have positive screening results. Thus, men have a higher positivity than women (2.8% vs. 2.0%, respectively); older people have higher positivity than younger people (3.1% aged 70-74 vs. 1.8%
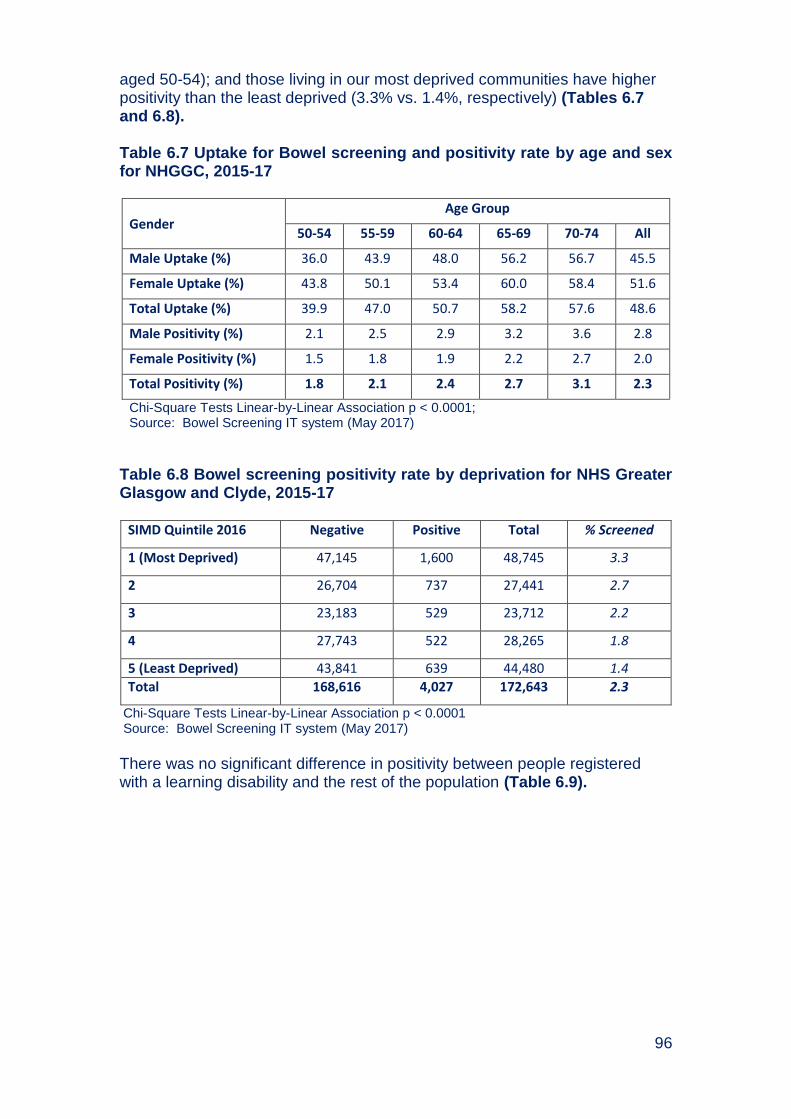
96
aged 50-54); and those living in our most deprived communities have higher positivity than the least deprived (3.3% vs. 1.4%, respectively) (Tables 6.7 and 6.8). Table 6.7 Uptake for Bowel screening and positivity rate by age and sex for NHGGC, 2015-17
Gender Age Group
50-54 55-59 60-64 65-69 70-74 All
Male Uptake (%) 36.0 43.9 48.0 56.2 56.7 45.5
Female Uptake (%) 43.8 50.1 53.4 60.0 58.4 51.6
Total Uptake (%) 39.9 47.0 50.7 58.2 57.6 48.6
Male Positivity (%) 2.1 2.5 2.9 3.2 3.6 2.8
Female Positivity (%) 1.5 1.8 1.9 2.2 2.7 2.0
Total Positivity (%) 1.8 2.1 2.4 2.7 3.1 2.3
Chi-Square Tests Linear-by-Linear Association p < 0.0001; Source: Bowel Screening IT system (May 2017)
Table 6.8 Bowel screening positivity rate by deprivation for NHS Greater Glasgow and Clyde, 2015-17
SIMD Quintile 2016 Negative Positive Total % Screened
1 (Most Deprived) 47,145 1,600 48,745 3.3
2 26,704 737 27,441 2.7
3 23,183 529 23,712 2.2
4 27,743 522 28,265 1.8
5 (Least Deprived) 43,841 639 44,480 1.4
Total 168,616 4,027 172,643 2.3
Chi-Square Tests Linear-by-Linear Association p < 0.0001 Source: Bowel Screening IT system (May 2017)
There was no significant difference in positivity between people registered with a learning disability and the rest of the population (Table 6.9).
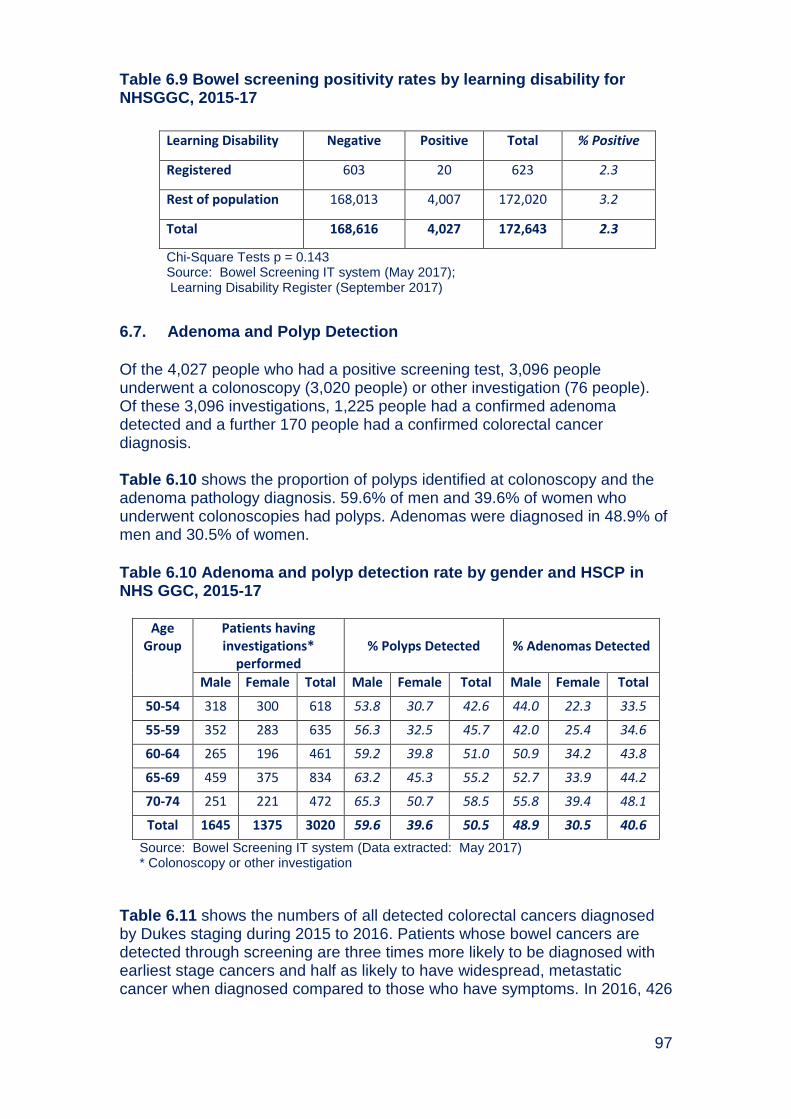
97
Table 6.9 Bowel screening positivity rates by learning disability for NHSGGC, 2015-17
6.7. Adenoma and Polyp Detection
Of the 4,027 people who had a positive screening test, 3,096 people underwent a colonoscopy (3,020 people) or other investigation (76 people). Of these 3,096 investigations, 1,225 people had a confirmed adenoma detected and a further 170 people had a confirmed colorectal cancer diagnosis. Table 6.10 shows the proportion of polyps identified at colonoscopy and the adenoma pathology diagnosis. 59.6% of men and 39.6% of women who underwent colonoscopies had polyps. Adenomas were diagnosed in 48.9% of men and 30.5% of women.
Table 6.10 Adenoma and polyp detection rate by gender and HSCP in NHS GGC, 2015-17
Age Group
Patients having investigations*
performed % Polyps Detected % Adenomas Detected
Male Female Total Male Female Total Male Female Total
50-54 318 300 618 53.8 30.7 42.6 44.0 22.3 33.5
55-59 352 283 635 56.3 32.5 45.7 42.0 25.4 34.6
60-64 265 196 461 59.2 39.8 51.0 50.9 34.2 43.8
65-69 459 375 834 63.2 45.3 55.2 52.7 33.9 44.2
70-74 251 221 472 65.3 50.7 58.5 55.8 39.4 48.1
Total 1645 1375 3020 59.6 39.6 50.5 48.9 30.5 40.6
Source: Bowel Screening IT system (Data extracted: May 2017) * Colonoscopy or other investigation
Table 6.11 shows the numbers of all detected colorectal cancers diagnosed by Dukes staging during 2015 to 2016. Patients whose bowel cancers are detected through screening are three times more likely to be diagnosed with earliest stage cancers and half as likely to have widespread, metastatic cancer when diagnosed compared to those who have symptoms. In 2016, 426
Learning Disability Negative Positive Total % Positive
Registered 603 20 623 2.3
Rest of population 168,013 4,007 172,020 3.2
Total 168,616 4,027 172,643 2.3
Chi-Square Tests p = 0.143 Source: Bowel Screening IT system (May 2017); Learning Disability Register (September 2017)
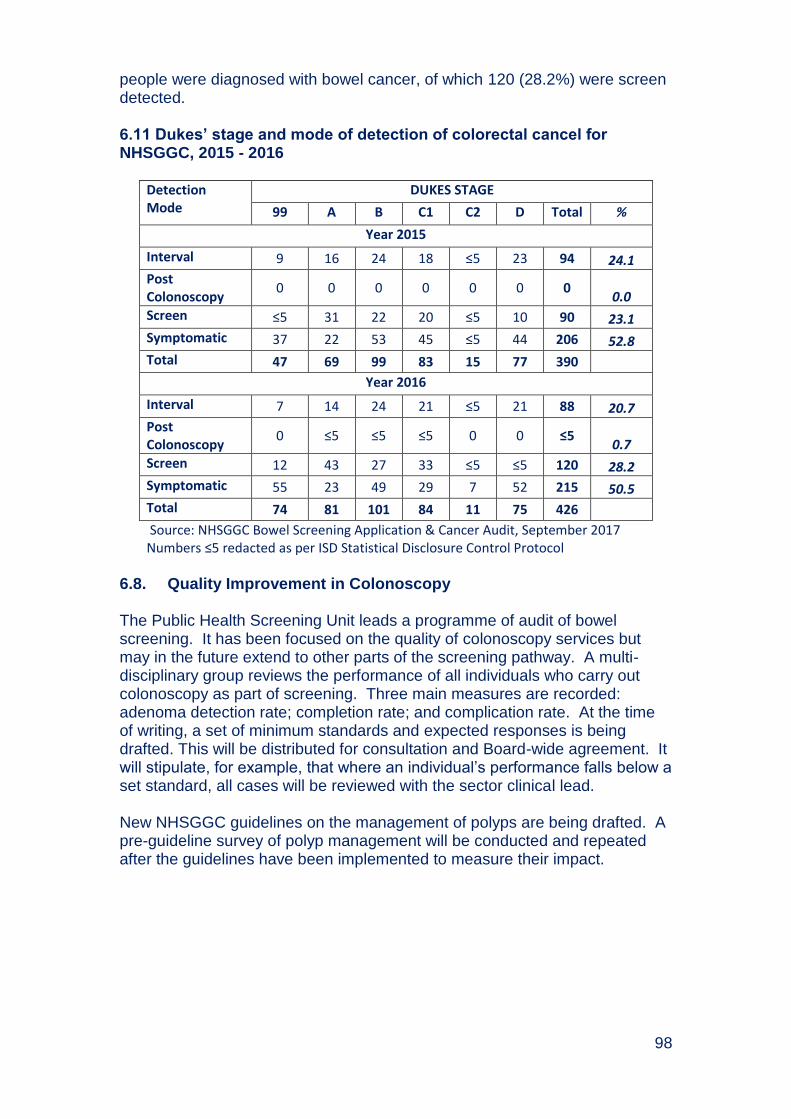
98
people were diagnosed with bowel cancer, of which 120 (28.2%) were screen detected. 6.11 Dukes’ stage and mode of detection of colorectal cancel for NHSGGC, 2015 - 2016
Detection Mode
DUKES STAGE
99 A B C1 C2 D Total %
Year 2015
Interval 9 16 24 18 ≤5 23 94 24.1
Post Colonoscopy
0 0 0 0 0 0 0 0.0
Screen ≤5 31 22 20 ≤5 10 90 23.1
Symptomatic 37 22 53 45 ≤5 44 206 52.8
Total 47 69 99 83 15 77 390
Year 2016
Interval 7 14 24 21 ≤5 21 88 20.7
Post Colonoscopy
0 ≤5 ≤5 ≤5 0 0 ≤5 0.7
Screen 12 43 27 33 ≤5 ≤5 120 28.2
Symptomatic 55 23 49 29 7 52 215 50.5
Total 74 81 101 84 11 75 426
Source: NHSGGC Bowel Screening Application & Cancer Audit, September 2017 Numbers ≤5 redacted as per ISD Statistical Disclosure Control Protocol
6.8. Quality Improvement in Colonoscopy The Public Health Screening Unit leads a programme of audit of bowel screening. It has been focused on the quality of colonoscopy services but may in the future extend to other parts of the screening pathway. A multi-disciplinary group reviews the performance of all individuals who carry out colonoscopy as part of screening. Three main measures are recorded: adenoma detection rate; completion rate; and complication rate. At the time of writing, a set of minimum standards and expected responses is being drafted. This will be distributed for consultation and Board-wide agreement. It will stipulate, for example, that where an individual’s performance falls below a set standard, all cases will be reviewed with the sector clinical lead. New NHSGGC guidelines on the management of polyps are being drafted. A pre-guideline survey of polyp management will be conducted and repeated after the guidelines have been implemented to measure their impact.

99
6.9. Challenges and Future Priorities
To implement new “teaser” letter in NHSGGC (although not nationally).
We expect that both of these changes will increase uptake by about 5%
and that a similar benefit will be found in groups who have historically
had lower uptake, such as men and those from more deprived areas.
To continue to review uptake for men registered with a learning
disability and for men registered with a severe and enduring mental
illness, and work with specialist learning disability and mental health
staff to develop approaches to support participation in bowel screening.
To continue to work in partnership with CRUK to support GP practices to sustain good practice to support eligible patients to participate in bowl screening programme.
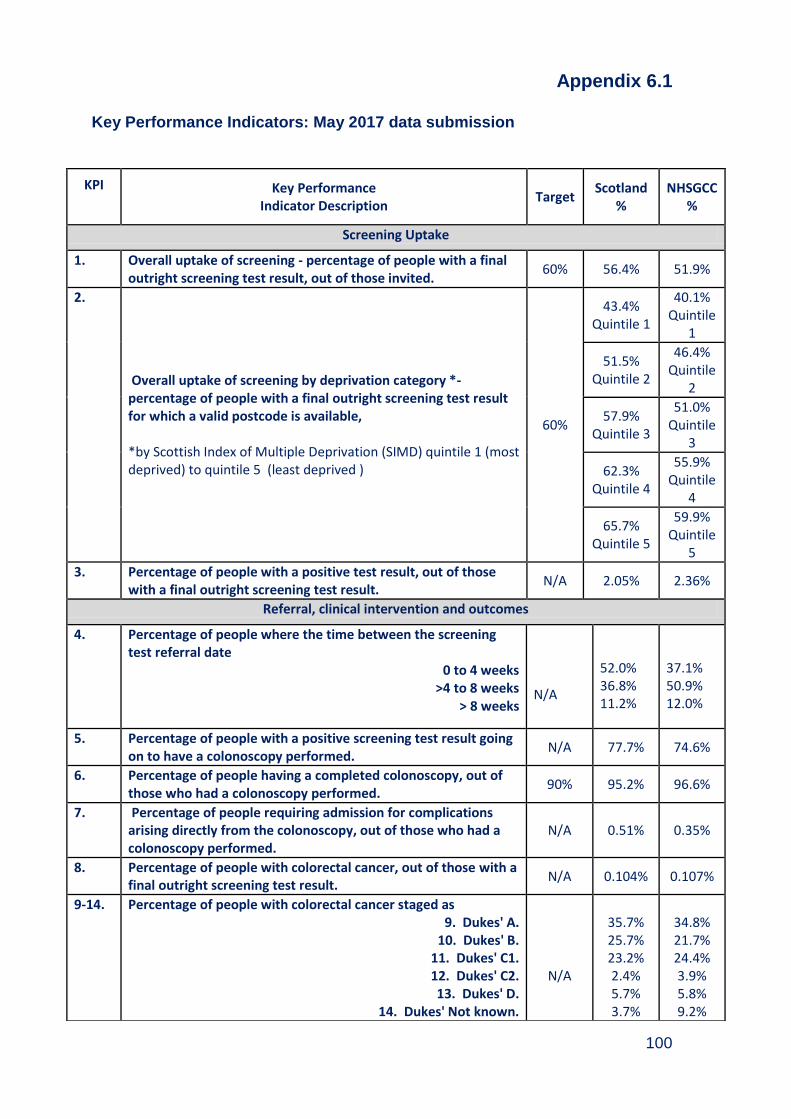
100
Appendix 6.1
Key Performance Indicators: May 2017 data submission
KPI Key Performance
Indicator Description Target
Scotland %
NHSGCC %
Screening Uptake
1. Overall uptake of screening - percentage of people with a final outright screening test result, out of those invited.
60% 56.4% 51.9%
2.
Overall uptake of screening by deprivation category *- percentage of people with a final outright screening test result for which a valid postcode is available, *by Scottish Index of Multiple Deprivation (SIMD) quintile 1 (most deprived) to quintile 5 (least deprived )
60%
43.4% Quintile 1
40.1% Quintile
1
51.5%
Quintile 2
46.4% Quintile
2
57.9%
Quintile 3
51.0% Quintile
3
62.3%
Quintile 4
55.9% Quintile
4
65.7%
Quintile 5
59.9% Quintile
5
3. Percentage of people with a positive test result, out of those with a final outright screening test result.
N/A 2.05% 2.36%
Referral, clinical intervention and outcomes
4. Percentage of people where the time between the screening test referral date
0 to 4 weeks >4 to 8 weeks
> 8 weeks
N/A
52.0% 36.8% 11.2%
37.1% 50.9% 12.0%
5. Percentage of people with a positive screening test result going on to have a colonoscopy performed.
N/A 77.7% 74.6%
6. Percentage of people having a completed colonoscopy, out of those who had a colonoscopy performed.
90% 95.2% 96.6%
7. Percentage of people requiring admission for complications arising directly from the colonoscopy, out of those who had a colonoscopy performed.
N/A 0.51% 0.35%
8. Percentage of people with colorectal cancer, out of those with a final outright screening test result.
N/A 0.104% 0.107%
9-14. Percentage of people with colorectal cancer staged as 9. Dukes' A.
10. Dukes' B. 11. Dukes' C1. 12. Dukes' C2. 13. Dukes' D.
14. Dukes' Not known.
N/A
35.7% 25.7% 23.2% 2.4% 5.7% 3.7%
34.8% 21.7% 24.4% 3.9% 5.8% 9.2%
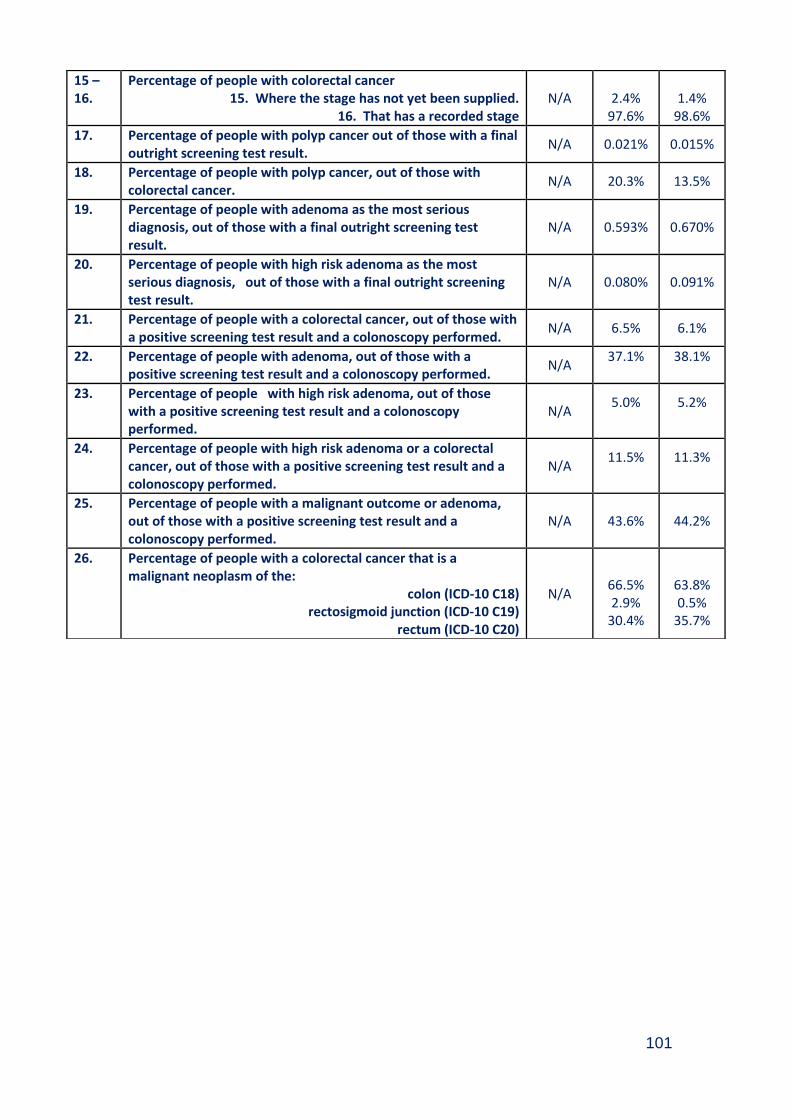
101
15 – 16.
Percentage of people with colorectal cancer 15. Where the stage has not yet been supplied.
16. That has a recorded stage N/A
2.4%
97.6%
1.4%
98.6%
17. Percentage of people with polyp cancer out of those with a final outright screening test result.
N/A 0.021% 0.015%
18. Percentage of people with polyp cancer, out of those with colorectal cancer.
N/A 20.3% 13.5%
19. Percentage of people with adenoma as the most serious diagnosis, out of those with a final outright screening test result.
N/A 0.593% 0.670%
20. Percentage of people with high risk adenoma as the most serious diagnosis, out of those with a final outright screening test result.
N/A 0.080% 0.091%
21. Percentage of people with a colorectal cancer, out of those with a positive screening test result and a colonoscopy performed.
N/A 6.5% 6.1%
22. Percentage of people with adenoma, out of those with a positive screening test result and a colonoscopy performed.
N/A 37.1%
38.1%
23. Percentage of people with high risk adenoma, out of those with a positive screening test result and a colonoscopy performed.
N/A 5.0%
5.2%
24. Percentage of people with high risk adenoma or a colorectal cancer, out of those with a positive screening test result and a colonoscopy performed.
N/A 11.5%
11.3%
25. Percentage of people with a malignant outcome or adenoma, out of those with a positive screening test result and a colonoscopy performed.
N/A 43.6% 44.2%
26. Percentage of people with a colorectal cancer that is a malignant neoplasm of the:
colon (ICD-10 C18) rectosigmoid junction (ICD-10 C19)
rectum (ICD-10 C20)
N/A
66.5% 2.9%
30.4%
63.8% 0.5%
35.7%
102
Appendix 6.2
Members of Bowel Screening Steering Group (as at March 2017) Dr David Morrison Consultant in Public Health Medicine, Chair Ms Fiona Aitken Endoscopy W/L Coordinator Mrs Margaret Anderson Lead Nurse - Endoscopy Dr Stuart Ballantyne Lead Clinician for Radiology Mr Paul Burton Information Manager Mrs Lin Calderwood H&IT Service Delivery Manager Mrs Lisa Cohen CRUK Project Facilitator Ms Ailsa Connelly Lead Nurse, New VIC Dr Fraser Duthie Lead Clinician for Pathology Dr Patrick Finn Consultant Surgeon, RAH Ms Ailsa Forsyth Lead Nurse, GGH Ms Irene Fyfe Health Records Manager Mrs Elaine Garman Public Health Specialist, NHS Highland Ms Alyson Goodwin Lead Nurse, QEUH Ms Alana Laing CRUK Project Facilitator Miss Denise Lyden Project Officer Ms Natalie Marshall Clinical Services Manager, North Sector Dr David Mansouri Clinical Lecturer, Glasgow University Mrs Susan McFadyen Interim General Manager Mrs Tricia McKenna Colorectal Nurse Endoscopist Ms Gill Mitan Administration Manager, North Sector Dr Jude Morris Consultant Physician and Gastroenterologist Ms Eileen Murray Staff Nurse, New VIC Dr Kenneth O'Neill Clinical Director, South Sector CHP Ms Lorna Reid Lead Nurse, RAH Mrs Rebecca Reid Clinical Services Manager, RAH Mrs Elizabeth Rennie Programme Manager, Screening Dept Dr Andrew Renwick Consultant, RAH Ms Ann Traquair-Smith Clinical Services Manager, QEUH Dr Jack Winter Lead Clinician for Endoscopy (North)

103
Chapter 7 - Breast Screening Programme
Summary
During 2015/16, the Scottish Breast Screening Programme implemented a new Scottish Breast Screening System (SBSS) IT system. At the time of this report, data reporting was not possible from the SBSS system; therefore it was not possible to access any nationally validated annual statistics relating to breast screening uptake and outcomes. It is envisaged that reporting functionality will be in place in early 2018.
Breast cancer is the most common cancer in women in Scotland, accounting for 29.1% of all new cancers diagnosed in women.
In 2015, 1,059 new breast cancers were registered among women residing in NHSGGC. In the same year, 200 women with a diagnosis of breast cancer died.
In the time period between 2005 and 2015, the age-standardised incidence rate of breast cancer in Scotland increased by 9.5%, however age-standardised mortality rate decreased by 10.2%.
The purpose of breast screening by mammography is to detect breast cancers at the earliest possible time so that treatment may be offered promptly. It is believed that very early detection of breast cancers in this way can result in more effective treatment, which may be more likely to reduce deaths from breast cancer.
Women aged 50-70 years are invited for a routine screen once every three years. Women aged over 70 years are screened on request.

104
Table of Contents
7.1. Background ................................................................................................... 105
7.2. Aim of Screening Programme ..................................................................... 106
7.3. Eligible Population ....................................................................................... 106
7.4. The Screening Test and Pathway ................................................................ 106
7.5. Delivery of Breast Screening Programme .................................................. 108
7.6. Challenges and Future Priorities ................................................................. 108

105
7.1. Background Breast cancer is the most common cancer in women in Scotland, accounting for 29.1% of all new cancers diagnosed in women15. In 2015, the most recent year for which completed data are available, 1,059 new breast cancers were registered among women residing in NHSGGC. This gives a standardised incidence rate of 184.5 per 100,000 per population, greater than the Scotland rate of 168.8 per 100,000. In the same year, 200 women with a diagnosis of breast cancer died, giving a standardised mortality rate of 34.5 per 100,000 population, comparable with the Scotland rate of 34.7 per 100,000. In the time period between 2005 and 2015, the age-standardised incidence rate of breast cancer in Scotland increased by 9.5%, however age-standardised mortality rate decreased by 10.2%. The increase in incidence of breast cancer is partly due to increased detection by the Scottish Breast Screening Programme and to changes in the prevalence of known risk factors, such as mother’s age at birth of first child, increases in obesity and alcohol consumption. Standardised incidence and mortality rates over rolling 3 year periods for breast cancer for NHSGGC and Scotland are illustrated in Figure 7.1. Figure 7.1 Breast Cancer Registration (Incidence) & Mortality 1997-2015 (Rolling 3 Years) European Age Standardised Rate (EASR) Per 100,000 Population (Source: ISD March 2017)
15
http://www.isdscotland.org/Health-Topics/Cancer/Publications/2017-10-31/Cancer_in_Scotland_summary_m.pdf (accessed January 2018)
0
20
40
60
80
100
120
140
160
180
200
EASR
Pe
r 1
00
,00
0 P
op
ula
tio
n
Years
Scotland Registration EASR Scotland Mortality EASR
NHSGGC Registration EASR NHSGGC Mortality EASR

106
7.2. Aim of Screening Programme The Scottish Breast Screening Programme was introduced in February 1987 following the publication of the Forrest Report (1986). Breast screening was implemented in 1988 in North Glasgow, 1991 in South Glasgow and in October 1990 in Argyll & Clyde. The purpose of breast screening by mammography is to detect breast cancers at the earliest possible time so that treatment may be offered promptly. It is believed that very early detection of breast cancers in this way can result in more effective treatment, which may be more likely to reduce deaths from breast cancer. 7.3. Eligible Population Women aged 50-70 years are invited for a routine screen once every three years. Women aged over 70 years are screened on request. 7.4. The Screening Test and Pathway The screening method used consists of two mammographic views. The test is a straightforward procedure involving two images being taken of each breast using an X-ray machine (also known as a mammogram). The West of Scotland Breast Screening Centre screens NHSGGC residents either in the static centre in Glasgow or in mobile units that visit pre-established sites across the NHSGGC area. Every woman registered with a GP receives her first invitation to attend for a mammogram at her local breast screening location sometime between her 50th and 53rd birthdays and then three yearly thereafter until her 70th birthday. A woman can request a screening appointment when she turns 50 providing her practice is not being screened in the next six months. The West of Scotland Breast Screening Centre also contacts all long-stay institutions (care homes, prisons, and mental health hospitals) to offer screening to eligible residents. The mammograms taken during the screening visit are examined and the results sent to the woman and her GP. A proportion of women attending for screening will be recalled if the mammogram was technically inadequate or will be asked to go to an assessment clinic for further tests if a potential abnormality has been detected. Tests may include further imaging, clinical examination and possibly ultrasound and biopsy if required. If a woman is found to have cancer, she is referred to a consultant surgeon to discuss the options available to her. This usually involves surgery: a lumpectomy where just the lump and a small amount of surrounding tissue is removed or a mastectomy where the whole breast is removed. Surgery is
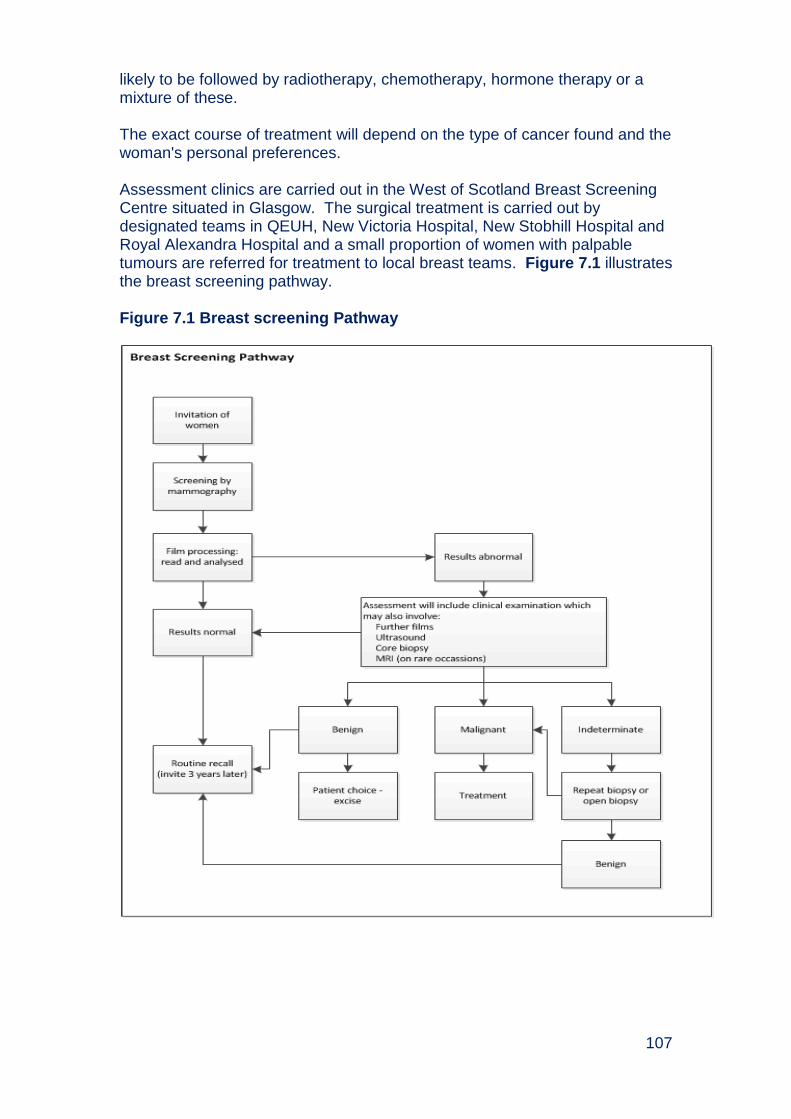
107
likely to be followed by radiotherapy, chemotherapy, hormone therapy or a mixture of these. The exact course of treatment will depend on the type of cancer found and the woman's personal preferences. Assessment clinics are carried out in the West of Scotland Breast Screening Centre situated in Glasgow. The surgical treatment is carried out by designated teams in QEUH, New Victoria Hospital, New Stobhill Hospital and Royal Alexandra Hospital and a small proportion of women with palpable tumours are referred for treatment to local breast teams. Figure 7.1 illustrates the breast screening pathway. Figure 7.1 Breast screening Pathway

108
7.5. Delivery of Breast Screening Programme During 2015/16, the Scottish Breast Screening Programme implemented a new Scottish Breast Screening System (SBSS) IT system. At the time of this report, data reporting was not possible from the SBSS system; therefore it was possible to access any nationally validated annual statistics relating to breast screening uptake and outcomes. It is envisaged that reporting functionality will be in place in early 2018. 7.6. Challenges and Future Priorities
To implement recommendations made from Health Improvement Scotland review of breast screening.
More effective ways of organising screening will be explored in 2018. In particular, we will explore screening clusters of congruent GP practices at a time rather than each practice on its own.
Location of mobile units will be explored to optimise accessibility and uptake.

109
Appendix 7.1 Members of Breast Screening Steering Group (As at March 2017) Dr David Morrison Consultant in Public Health Medicine (Chair) Mr Paul Burton Information Manager Mrs Lin Calderwood H&IT Service Delivery Manager – Screening Dr Emilia Crighton Health of Health Services Section Dr Marie-Louise Davies Consultant Radiologist Mrs Elaine Garman Public Health Specialist, NHS Highland Dr Aileen Holliday Health Effectiveness Coordinator, Forth Valley Ms Marion Inglis Administration Manager Ms Alana Laing CRUK Project Facilitator Miss Denise Lyden Project Officer, Public Health - Health Services Ms Aileen McLennan Director, Diagnostics Dr Rosemary Millar Acting Consultant in Public Health, NHS
Lanarkshire Ms Ann Mumby Superintendent Radiographer Ms Elaine Murray Community Liaison Officer Dr Tasmin Sommerfield Consultant in Public Health, NHS Lanarkshire
110
Chapter 8 - Cervical Screening Summary Cervical cancer was the tenth most common cancer in females in 2015 in
Scotland and most common cancer in women under the age of 35 years. In 2015, 79 new cervical cancers were registered among NHSGGC residents. In the same year, 22 women with a diagnosis of cervical cancer died.
In the time period between 2005 and 2015, the age-standardised incidence rate of cervical cancer in Scotland increased by 2.7%, however age-standardised mortality rate decreased by 0.8%.
The aim of the Scottish Cervical Screening Programme (SCSP) is to
reduce the number of women who develop invasive cancer and the number of women who die from it by detecting precancerous changes.
Women aged 25-49 are offered screening every three years and women
aged 50-64 are offered screening every five years. Women who were
already enrolled in the screening programme aged less than 25 will
continue to be screened every three years until they are 50.
The percentage of eligible women (aged 25 to 64) who were recorded as screened adequately within the specified period was 72.6% against a target of 80%.
Uptake was higher in areas of lower deprivation. Uptake for women aged 25 to 64 in the least deprived areas was 77.7% compared with 69.9% in the most deprived areas, however there is not a clear trend across socio-economic groups.
Cervical screening uptake is highest in HPV vaccinated women across ages 21-25 when compared to non-vaccinated women.
Uptake is poorest women aged between 25-29, residents with learning disabilities and in ethnic minorities. There are also lower uptake rates in some HSCPs that are not wholly explained by socio-economic deprivation.
Due to changes in GMS contract from 2016, there may potential impact
on uptake of cervical screening
The Queen Elizabeth University Hospital processes all smear test specimens for NHSGGC and in 2016-17 processed 103,788 cervical screening tests. Of all tests processed, 97.0% were of satisfactory quality i.e. there were enough cells in the sample.
Of the satisfactory quality tests 89.9% had a negative (normal) result, 7.5% had a low grade cell change and the remaining 1.0% had high grade cell
111
changes.
The business case for an alternative approach to cervical screening – high risk HPV has been approved by the Scottish Government and the new approach introduced later in 2017. High risk HPV screening involves the same clinical examination (a cervical smear) but only women whose virology results are positive for specific types of Human Papilloma Virus will have cervical cytology results tested.
NHSGGC has carried out a multi-disciplinary review of all invasive cervical cancer cases since 2006 to audit the screening and management of every case.
In 2016, 48% of all invasive cervical cancers in NHSGGC were detected through screening.
112
Table of Contents
8.1. Background ................................................................................................... 113
8.2. Risk Factors .................................................................................................. 114
8.3. Aim of Screening Programme and Eligible Population ............................. 114
8.4. Programme Monitoring ................................................................................ 114
8.5. The Screening Test and Pathway ................................................................ 115
8.6. HPV Vaccination ........................................................................................... 116
8.7. General Medical Services (GMS) Delivery of Cervical Screening ............. 117
8.8. Programme Performance and Delivery ....................................................... 120
8.9. NHSGGC Cytopathology Laboratories ....................................................... 124
8.10. Colposcopy ................................................................................................. 126
8.11. Invasive Cervical Cancer Audit .................................................................. 127
8.12. Challenges and Future Priorities ............................................................... 130
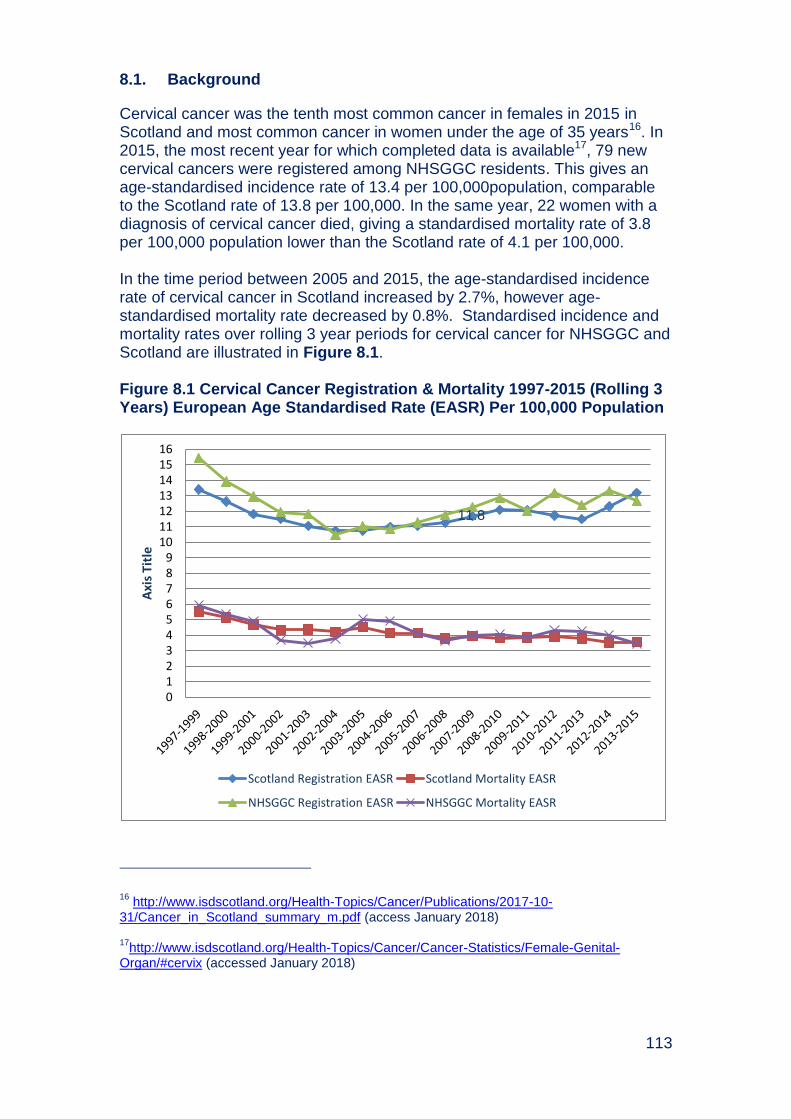
113
8.1. Background
Cervical cancer was the tenth most common cancer in females in 2015 in Scotland and most common cancer in women under the age of 35 years16. In 2015, the most recent year for which completed data is available17, 79 new cervical cancers were registered among NHSGGC residents. This gives an age-standardised incidence rate of 13.4 per 100,000population, comparable to the Scotland rate of 13.8 per 100,000. In the same year, 22 women with a diagnosis of cervical cancer died, giving a standardised mortality rate of 3.8 per 100,000 population lower than the Scotland rate of 4.1 per 100,000. In the time period between 2005 and 2015, the age-standardised incidence rate of cervical cancer in Scotland increased by 2.7%, however age-standardised mortality rate decreased by 0.8%. Standardised incidence and mortality rates over rolling 3 year periods for cervical cancer for NHSGGC and Scotland are illustrated in Figure 8.1. Figure 8.1 Cervical Cancer Registration & Mortality 1997-2015 (Rolling 3 Years) European Age Standardised Rate (EASR) Per 100,000 Population
16
http://www.isdscotland.org/Health-Topics/Cancer/Publications/2017-10-31/Cancer_in_Scotland_summary_m.pdf (access January 2018) 17
http://www.isdscotland.org/Health-Topics/Cancer/Cancer-Statistics/Female-Genital-Organ/#cervix (accessed January 2018)
11.8
0 1 2 3 4 5 6 7 8 9
10 11 12 13 14 15 16
Axi
s T
itle
Scotland Registration EASR Scotland Mortality EASR
NHSGGC Registration EASR NHSGGC Mortality EASR
114
8.2. Risk Factors
Most cervical cancers are caused by oncogenic types of human papilloma virus (HPV), mainly types 16 and 18. While the majority of women clear the HPV virus, a minority have persistent HPV infection which can transform normal cervical cells into abnormal ones. These changes can occur over a period of 10 to 20 years through precancerous lesions to invasive cancer and death. Other risk factors for cervical cancer include factors which increase exposure to the virus (such as having a high number of sexual partners), factors that factors that make your body more vulnerable to infection or affect immune response (including HIV) and smoking. 8.3. Aim of Screening Programme and Eligible Population
The aim of the Scottish Cervical Screening Programme (SCSP) is to reduce the number of women who develop invasive cancer and the number of women who die from it by detecting precancerous changes. By taking a cytological smear from the cervix, followed where necessary by a diagnostic test, it is possible to identify changes in individual cells which may mean that the woman is at risk of developing invasive cancer at a later date. Prompt treatment can result in permanent removal of affected areas of the cervix and prevent the development of cancer. Women who live in the Greater Glasgow and Clyde area and who have a cervix are invited for screening. Until June 2016, women aged 20 to 60 were invited every three years. From June 6th 2016, a Change in Age Range and Frequency (CARAF) was made to reflect new evidence about the effectiveness of screening. The CARAF means that women aged 25-49 are offered screening every three years and women aged 50-64 are offered screening every five years. Women who were already enrolled in the screening programme aged less than 25 will continue to be screened every three years until they are 50. 8.4. Programme Monitoring
The national cervical screening programme delivery and quality is monitored against key programme statistics18 and National Cervical Screening Standards19. Information Services Division plan to carry out a consultation during 2017 on the Scottish Cervical Screening Programme statistics.
18
https://www.isdscotland.org/Health-Topics/Cancer/Publications/2017-09-05/2017-09-05-Cervical-Screening-Report.pdf (accessed January 2018) 19
http://www.healthcareimprovementscotland.org/previous_resources/standards/cervical_screening.aspx (accessed January 2018)
115
The uptake of cervical screening is monitored using two different methods to define the eligible population:
i) National and Health Board level uptake: this method identifies all women in the Health Board area in the eligible age groups minus those who have no cervix (for example, following a total or radical hysterectomy).
ii) General Medical Services (GMS) uptake: this method is used to calculate payments to GP Practices, and includes several other exclusions such as repeated non-attendance (“patients who have been recorded as refusing to attend review who have been invited on at least three occasions during the preceding 12 months”).
8.5. The Screening Test and Pathway
A “smear test” involves collecting cells from the surface of the cervix or ‘neck of the womb’. Liquid based cytology (LBC) is a way of preparing cervical samples for examination in the laboratory. The sample is collected using a special device which brushes cells from the neck of the womb. The head of the brush, where the cells are lodged, is broken off into a small glass vial containing preservative fluid, or rinsed directly into the preservative fluid. The sample is sent to the laboratory where it is spun and treated to remove obscuring material, for example mucus or pus and a random sample of the remaining cells is taken. A thin layer of the cells is deposited onto a slide. The slide is then screened automatically and if there is evidence of any abnormality, examined under a microscope by a cytologist. Figure 8.2 illustrates the pathway for the cervical screening programme. Following the invitation being issued, a woman will make an appointment to attend for a test. Women can also have opportunistic smears at the time of attending medical care for another reason. Depending on the result of the test she will be recalled to attend, if eligible, in three years (normal result, aged 25-49) or five years (normal results, aged 50-64), six months (for a borderline result); will have a repeat smear (if result not satisfactory) or will be referred to colposcopy for diagnostic tests and treatment (Appendix 8.1). Treatment of invasive cervical cancers follows agreed cancer treatment pathways.

116
Figure 8.2 Cervical screening pathway
The Scottish Cervical Call Recall System (SCCRS) provides women with a complete e-health record detailing their whole smear history which professionals involved with the screening programme access. Results are automatically available for the smear takers to view in SCCRS and patients are sent notification directly from Scottish Cervical Call Recall System. The system also produces individual, and practice performance automated reports. The National Colposcopy Clinical Information Audit System (NCCIAS) is used by Colposcopy staff for the clinical management and audit of all colposcopy referrals. 8.6. HPV Vaccination
Since 2008, all girls aged 11 to 13 years in their second year of secondary school are routinely offered vaccinations to protect them against the Human Papilloma Virus (HPV). There are two types of HPV that cause 70% of cases of cervical cancers. The HPV vaccine does not protect against all cervical cancers so regular cervical screening is still important.

117
The purpose of the HPV immunisation programme is to protect girls from the two types of HPV that cause around 75% of cases of cervical cancer. The HPV vaccine does not protect against all cervical cancers, so regular cervical screening is still important. In 2016/17, vaccination uptake amongst S1 girls in NHSGGC was 91.7% (1st dose) and 93.7% in S2 girls (1st dose). The uptake for girls in S3 is shown below in Table 8.1. Table 8.1 HPV immunisation uptake rates by the end of the school year 2016/17 by NHS Board of school girls in S3
NHS Board of school
Number eligible
Dose 1 Dose 2
Number immunised
% Uptake
Number immunised
% Uptake
Ayrshire & Arran 1,802 1,658 92.0 1,594 88.5
Borders 538 512 95.2 490 91.1
Dumfries & Galloway 698 659 94.4 646 92.6
Fife 1,729 1,560 90.2 1,435 83.0
Forth Valley 1,475 1,418 96.1 1,297 87.9
Grampian 2,736 2,550 93.2 2,446 89.4
Greater Glasgow & Clyde 5,542 5,300 95.6 5,124 92.5
Highland 1,539 1,372 89.1 1,298 84.3
Lanarkshire 3,515 3,329 94.7 3,151 89.6
Lothian 3,969 3,671 92.5 3,475 87.6
Orkney 108 87 80.6 84 77.8
Shetland 114 105 92.1 105 92.1
Tayside 2,015 1,869 92.8 1,764 87.5
Western Isles 152 138 90.8 131 86.2
Scotland 25,932 24,228 93.4 23,040 88.8 Source: CHSP School/SIRS
The business case for an alternative approach to cervical screening – high risk HPV has been approved by the Scottish Government and the new approach introduced later in 2017. High risk HPV screening involves the same clinical examination (a cervical smear) but only women whose virology results are positive for specific types of HPV will have cervical cytology results tested. 8.7. General Medical Services (GMS) Delivery of Cervical Screening
The GMS contract introduced in 2004 included cervical screening in the additional services domain and awarded practices for providing the service under the Quality and Outcomes Framework (QOF). Payment based on the QOF ceased at the end of March 2016
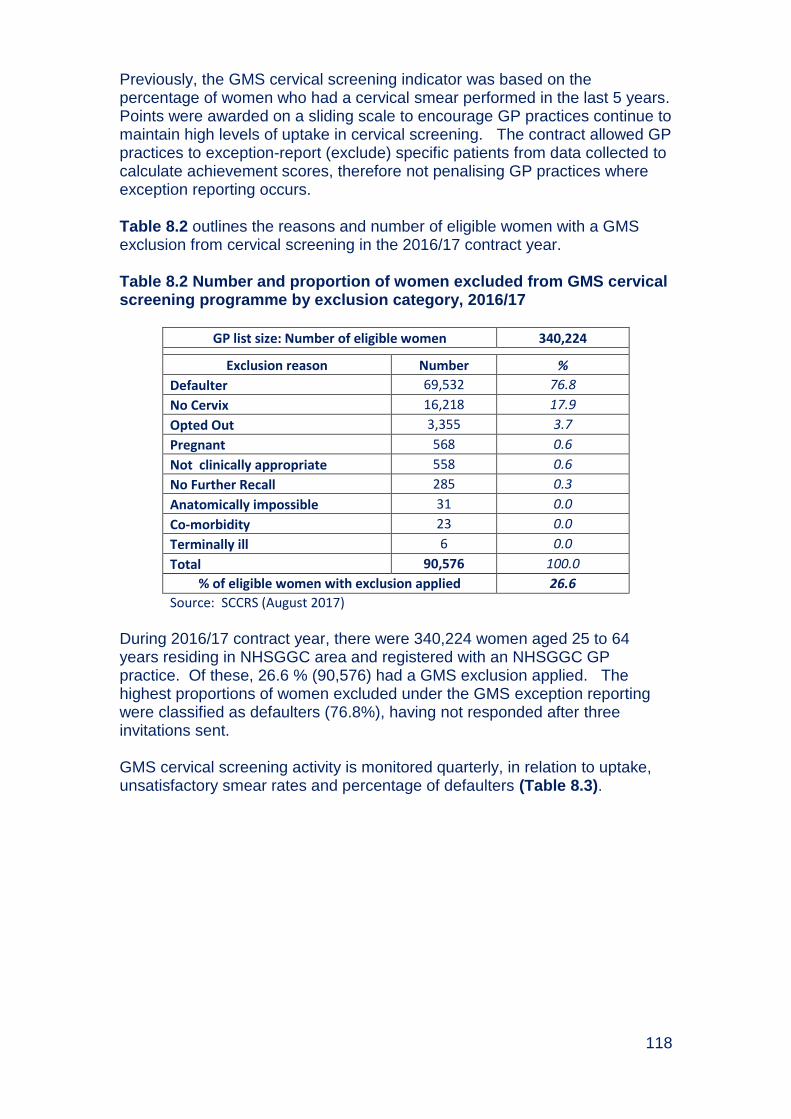
118
Previously, the GMS cervical screening indicator was based on the percentage of women who had a cervical smear performed in the last 5 years. Points were awarded on a sliding scale to encourage GP practices continue to maintain high levels of uptake in cervical screening. The contract allowed GP practices to exception-report (exclude) specific patients from data collected to calculate achievement scores, therefore not penalising GP practices where exception reporting occurs.
Table 8.2 outlines the reasons and number of eligible women with a GMS exclusion from cervical screening in the 2016/17 contract year. Table 8.2 Number and proportion of women excluded from GMS cervical screening programme by exclusion category, 2016/17
GP list size: Number of eligible women 340,224
Exclusion reason Number %
Defaulter 69,532 76.8
No Cervix 16,218 17.9
Opted Out 3,355 3.7
Pregnant 568 0.6
Not clinically appropriate 558 0.6
No Further Recall 285 0.3
Anatomically impossible 31 0.0
Co-morbidity 23 0.0
Terminally ill 6 0.0
Total 90,576 100.0
% of eligible women with exclusion applied 26.6
Source: SCCRS (August 2017)
During 2016/17 contract year, there were 340,224 women aged 25 to 64 years residing in NHSGGC area and registered with an NHSGGC GP practice. Of these, 26.6 % (90,576) had a GMS exclusion applied. The highest proportions of women excluded under the GMS exception reporting were classified as defaulters (76.8%), having not responded after three invitations sent. GMS cervical screening activity is monitored quarterly, in relation to uptake, unsatisfactory smear rates and percentage of defaulters (Table 8.3).

119
Table 8.3 GMS uptake rates, unsatisfactory smear rates and percentage of defaulters 2016/17
CHP
No Cervix Uptake GMS Contract Uptake % Unsatisfactory % Defaulters (of List Size)
Jun-16
Sep-16
Dec-16
Mar-17
Jun-17
Jun-16
Sep-16
Dec-16
Mar-17
Jun-17
Jun-16
Sep-16
Dec-16
Mar-17
Jun-17
Jun-16
Sep-16
Dec-16
Mar-17
Jun-17
East Dunbarton- shire 82.1 80.7 82.2 82.1 82.1 94.0 93.8 93.1 91.0 91.5
3.6 2.0 1.7 2.7 2.5 17.1 16.9 16.2 14.2 14.7
East Renfrew- shire 81.8 80.0 81.6 81.3 81.1 93.7 93.6 91.9 90.5 90.9
3.7 2.7 1.8 3.7 2.8 17.3 17.4 15.8 14.5 15.2
Glasgow North East 74.0 71.8 73.4 73.2 73.1 90.4 90.1 88.2 86.5 86.8
2.6 2.5 2.9 2.9 2.8 24.0 24.2 23.0 21.6 22.2
Glasgow North West 67.8 65.2 66.5 66.2 66.4 86.5 86.2 85.2 82.4 82.6
2.8 2.6 2.3 2.9 3.1 27.3 27.9 27.4 25.2 25.3
Glasgow South 74.3 72.1 74.0 73.7 73.6 90.5 90.4 88.6 86.7 86.7
3.1 2.0 2.6 2.4 2.3 23.1 23.2 21.6 20.2 20.5
Inverclyde 75.4 73.9 75.3 75.2 75.3 91.0 90.2 88.3 86.8 88.0 3.5 2.3 2.3 3.5 2.9 22.5 21.9 20.7 19.7 20.7
Other1 61.5 55.8 59.0 64.7 55.6 87.5 77.8 72.0 69.2 68.4 0.0 0.0 0.0 0.0 0 38.5 37.2 35.9 23.5 29.6
Renfrew- shire 78.5 76.7 78.2 78.3 78.4 92.2 91.7 90.4 89.2 90.1
3.1 2.5 2.6 2.5 2.8 19.4 19.0 18.0 16.9 17.8
West Dunbarton- shire 76.8 75.0 76.9 77.0 77.0 92.2 91.4 60.2 91.0 89.3
3.3 2.0 1.6 3.0 2.7 21.6 21.4 20.2 19.2 19.5
GGC 74.9 72.9 74.4 74.2 74.3 90.7 90.3 88.9 87.2 87.4 3.1 2.4 2.3 2.8 2.7 22.5 22.6 21.5 20.0 20.5
1 Other = Challenging Behaviour, Nursing Homes Practice, Homelessness Unit; High percentages are due to small numbers

120
8.8. Programme Performance and Delivery
The cervical screening programme statistics cover information on uptake of screening, results of screening, quality of laboratory and colposcopy, and cancer diagnosis. The statistics are reported for a one year period. Appendix 8.2 provides a summary of NHSGGC activity against these statistics for the time period 1st April 2016 and 31st March 2017. National and Health Board level uptake is based on all women in the Health Board area in the eligible age groups minus those who have no cervix (for example, following a total or radical hysterectomy). Uptake is age-appropriate, based on being screened within the specified period (within last 3.5 or 5.5 years). Please note that these figures have been produced from local data extract from the SCCRS system in August 2017, therefore figures may differ from those quoted in national statistics (Appendix 8.2). There has been a decline over time in uptake of cervical screening in Scotland and NHS Greater Glasgow and Clyde, and since 2012 the overall uptake target of 80% has not been reached nationally (Figure 8.4). Figure 8.4 Uptake rate of cervical screening in NHSGGC and Scotland by year (2007-2017)
Source: SCCRs population denominator (excluding medically ineligible women) * 2007-16 data are based on the pre-2006 Health Board configuration (former Argyll & Clyde); Greater Glasgow figures do not include the Clyde area. 2016-17 figures NHS Greater Glasgow now include the Clyde area.
64.0
66.0
68.0
70.0
72.0
74.0
76.0
78.0
80.0
82.0
20
07
-08
20
08
-09
20
09
-10
20
10
-11
20
11
-12
20
12
-13
20
13
-14
20
14
-15
20
15
-16
20
16
-17
Up
take
%
Year
(Former) Argyll & Clyde* Greater Glasgow* Scotland
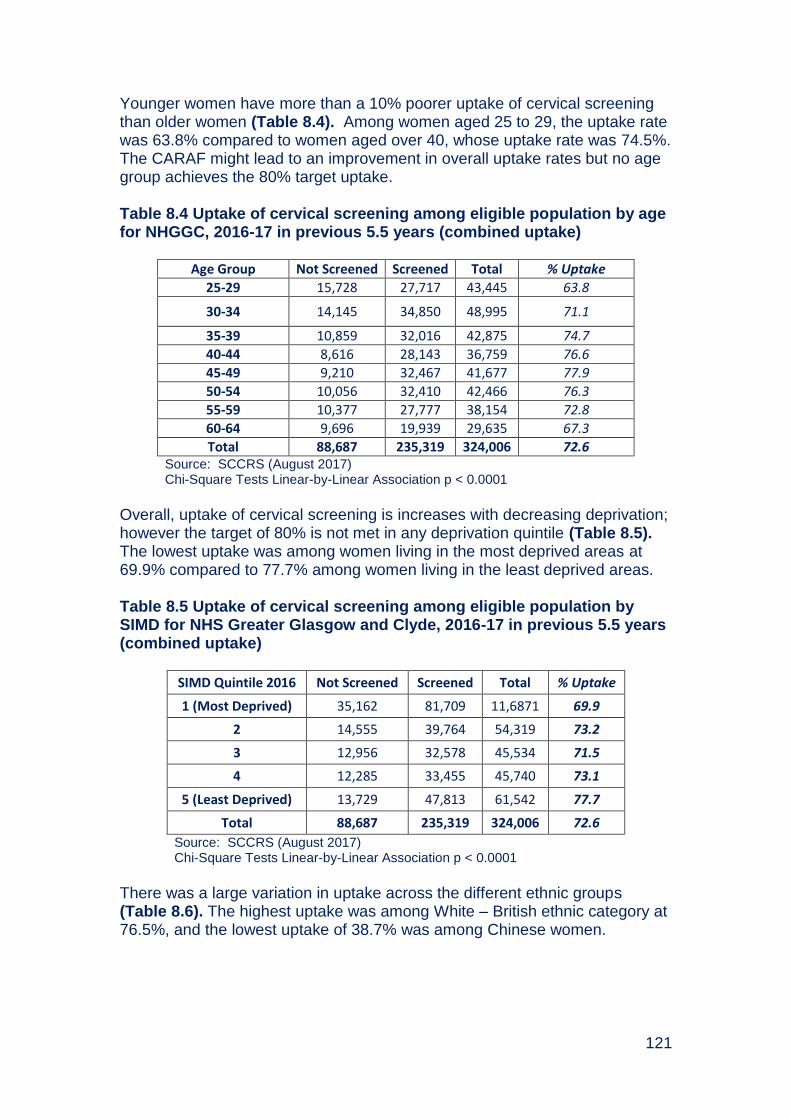
121
Younger women have more than a 10% poorer uptake of cervical screening than older women (Table 8.4). Among women aged 25 to 29, the uptake rate was 63.8% compared to women aged over 40, whose uptake rate was 74.5%. The CARAF might lead to an improvement in overall uptake rates but no age group achieves the 80% target uptake. Table 8.4 Uptake of cervical screening among eligible population by age for NHGGC, 2016-17 in previous 5.5 years (combined uptake)
Age Group Not Screened Screened Total % Uptake
25-29 15,728 27,717 43,445 63.8
30-34 14,145 34,850 48,995 71.1
35-39 10,859 32,016 42,875 74.7
40-44 8,616 28,143 36,759 76.6
45-49 9,210 32,467 41,677 77.9
50-54 10,056 32,410 42,466 76.3
55-59 10,377 27,777 38,154 72.8
60-64 9,696 19,939 29,635 67.3
Total 88,687 235,319 324,006 72.6 Source: SCCRS (August 2017) Chi-Square Tests Linear-by-Linear Association p < 0.0001
Overall, uptake of cervical screening is increases with decreasing deprivation; however the target of 80% is not met in any deprivation quintile (Table 8.5). The lowest uptake was among women living in the most deprived areas at 69.9% compared to 77.7% among women living in the least deprived areas. Table 8.5 Uptake of cervical screening among eligible population by SIMD for NHS Greater Glasgow and Clyde, 2016-17 in previous 5.5 years (combined uptake)
SIMD Quintile 2016 Not Screened Screened Total % Uptake
1 (Most Deprived) 35,162 81,709 11,6871 69.9
2 14,555 39,764 54,319 73.2
3 12,956 32,578 45,534 71.5
4 12,285 33,455 45,740 73.1
5 (Least Deprived) 13,729 47,813 61,542 77.7
Total 88,687 235,319 324,006 72.6
Source: SCCRS (August 2017) Chi-Square Tests Linear-by-Linear Association p < 0.0001
There was a large variation in uptake across the different ethnic groups (Table 8.6). The highest uptake was among White – British ethnic category at 76.5%, and the lowest uptake of 38.7% was among Chinese women.

122
Table 8.6 Uptake of cervical screening among eligible population by ethnicity for NHS Greater Glasgow and Clyde, 2016-17 in previous 5.5 years (combined uptake)
2001 Census Ethnic Group
Not Screened Screened Total % Screened
White – British 59,080 192,757 251,837 76.5
White – Irish 5,519 15,368 20,887 73.6
White - any other white background 8,190 9,596 17,786 54.0
Asian or Asian British 5,671 8,429 14,100 59.8
Black or Black British 1010 1359 2369 57.4
Other ethnic groups - Chinese 4,373 2,760 7,133 38.7
Other ethnic groups - any other ethnic group 2,884 3,515 6,399 54.9
Unclassified 1,960 1,535 3,495 43.9
Total 88,687 235,319 324,006 72.6
Source: SCCRS (August 2017); OnoMap20
The target for cervical screening uptake (80%) was met only in East Dunbartonshire and East Renfrewshire HSCPs. The lowest uptake rate of 63.8% was in Glasgow City HSCP North West Sector, a difference in uptake of 17.2% (Table 8.7). However, when the known effects of deprivation and ethnicity are taken into account by standardisation (Standardised Uptake Rate – SUR), the variation in uptake across HSCPs is reduced, however a significant difference remains (9.9% difference between highest and lowest), with 76.5.% SUR in East Dunbartonshire HSCP compared to 66.8% SUR in Glasgow City HSCP – North West Sector. This tells us that there are local practices that explain the variation in addition to the population demographics.
20
OnoMap is a software tool for the classification of names into groups of common cultural, ethnic and linguistic origins
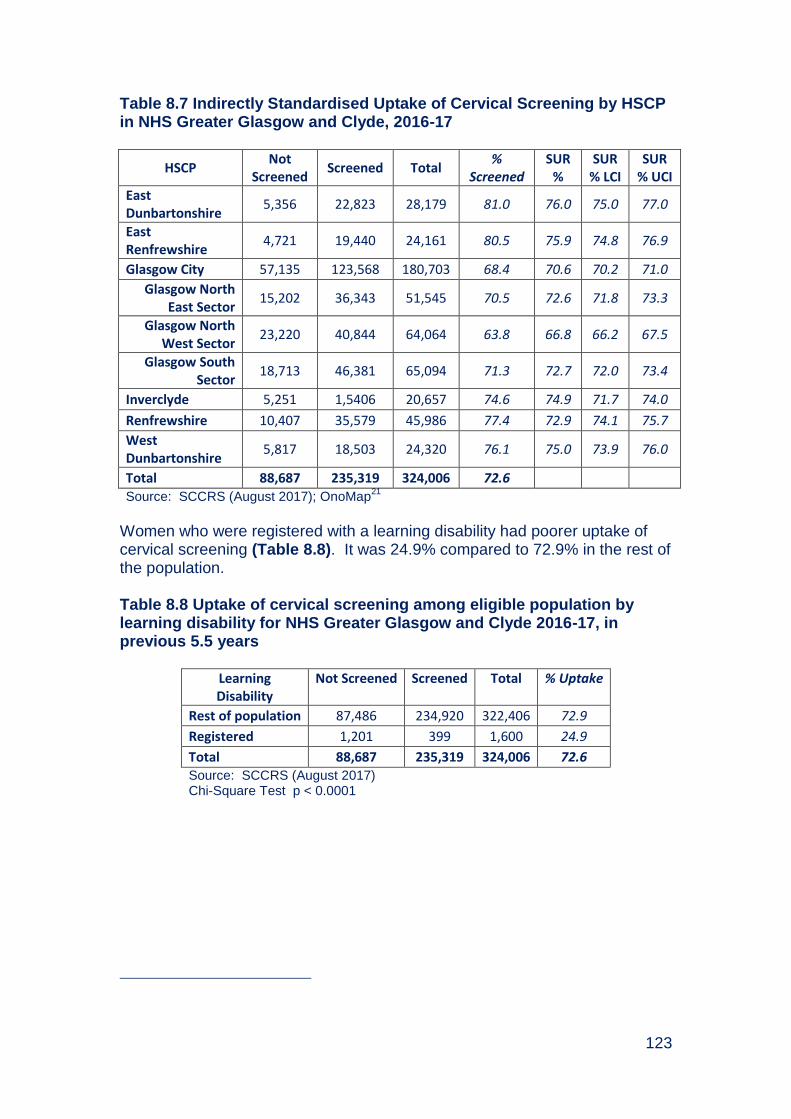
123
Table 8.7 Indirectly Standardised Uptake of Cervical Screening by HSCP in NHS Greater Glasgow and Clyde, 2016-17
HSCP Not
Screened Screened Total
% Screened
SUR %
SUR % LCI
SUR % UCI
East Dunbartonshire
5,356 22,823 28,179 81.0 76.0 75.0 77.0
East Renfrewshire
4,721 19,440 24,161 80.5 75.9 74.8 76.9
Glasgow City 57,135 123,568 180,703 68.4 70.6 70.2 71.0
Glasgow North East Sector
15,202 36,343 51,545 70.5 72.6 71.8 73.3
Glasgow North West Sector
23,220 40,844 64,064 63.8 66.8 66.2 67.5
Glasgow South Sector
18,713 46,381 65,094 71.3 72.7 72.0 73.4
Inverclyde 5,251 1,5406 20,657 74.6 74.9 71.7 74.0
Renfrewshire 10,407 35,579 45,986 77.4 72.9 74.1 75.7
West Dunbartonshire
5,817 18,503 24,320 76.1 75.0 73.9 76.0
Total 88,687 235,319 324,006 72.6
Source: SCCRS (August 2017); OnoMap21
Women who were registered with a learning disability had poorer uptake of cervical screening (Table 8.8). It was 24.9% compared to 72.9% in the rest of the population. Table 8.8 Uptake of cervical screening among eligible population by learning disability for NHS Greater Glasgow and Clyde 2016-17, in previous 5.5 years
Learning Disability
Not Screened Screened Total % Uptake
Rest of population 87,486 234,920 322,406 72.9
Registered 1,201 399 1,600 24.9
Total 88,687 235,319 324,006 72.6 Source: SCCRS (August 2017) Chi-Square Test p < 0.0001

124
8.9. NHSGGC Cytopathology Laboratories
Table 8.9 provides an overview of the number of cervical screening tests processed and the results of cervical screening tests carried out at NHSGGC laboratory and across Scotland for the period 1st April 2016 to 31st March 2017. This data is sourced from nationally produced annual reports from SCCRS Laboratory Report. The total number of smear tests processed in NHSGGC laboratory in 2016/17 was 103,788. An essential criterion of the NHS HIS standards requires the laboratories to process a minimum of 15,000 smears annually and this has been achieved. These included repeat smears and smears taken at colposcopy as one woman can have more than one smear test. Of the 103,788 cervical samples processed, 3,142 (3%) were reported as unsatisfactory smears. Quarterly comparative performance is fed-back to individual smear takers based on the proportion of unsatisfactory smears reported. The unsatisfactory smear rate in 2016/17 (3.0%) was similar to other years in the past decade.
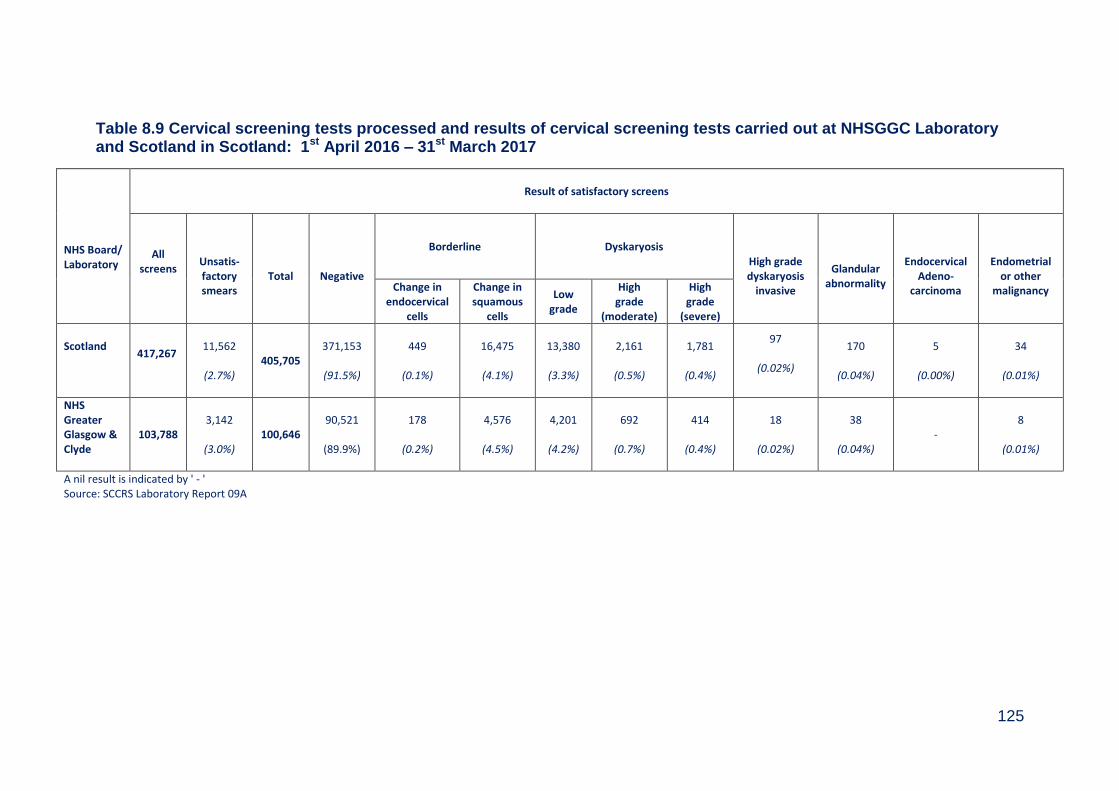
125
Table 8.9 Cervical screening tests processed and results of cervical screening tests carried out at NHSGGC Laboratory and Scotland in Scotland: 1st April 2016 – 31st March 2017
NHS Board/ Laboratory
Result of satisfactory screens
All screens
Unsatis- factory smears
Total
Negative
Borderline Dyskaryosis High grade dyskaryosis
invasive
Glandular
abnormality
Endocervical
Adeno- carcinoma
Endometrial
or other malignancy Change in
endocervical cells
Change in squamous
cells
Low grade
High grade
(moderate)
High grade
(severe)
Scotland
417,267
11,562
(2.7%)
405,705 371,153
(91.5%)
449
(0.1%)
16,475
(4.1%)
13,380
(3.3%)
2,161
(0.5%)
1,781
(0.4%)
97
(0.02%)
170
(0.04%)
5
(0.00%)
34
(0.01%)
NHS Greater Glasgow & Clyde
103,788 3,142
(3.0%)
100,646 90,521
(89.9%)
178
(0.2%)
4,576
(4.5%)
4,201
(4.2%)
692
(0.7%)
414
(0.4%)
18
(0.02%)
38
(0.04%) -
8
(0.01%)
A nil result is indicated by ' - ' Source: SCCRS Laboratory Report 09A
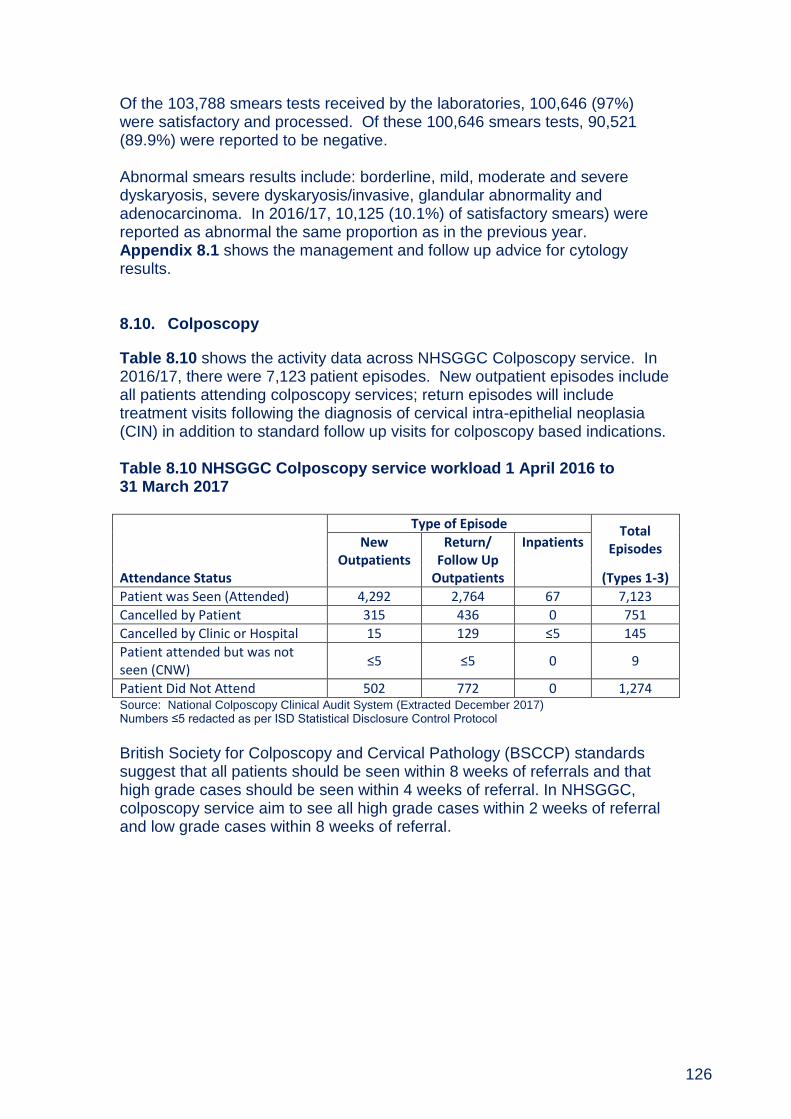
126
Of the 103,788 smears tests received by the laboratories, 100,646 (97%) were satisfactory and processed. Of these 100,646 smears tests, 90,521 (89.9%) were reported to be negative. Abnormal smears results include: borderline, mild, moderate and severe dyskaryosis, severe dyskaryosis/invasive, glandular abnormality and adenocarcinoma. In 2016/17, 10,125 (10.1%) of satisfactory smears) were reported as abnormal the same proportion as in the previous year. Appendix 8.1 shows the management and follow up advice for cytology results. 8.10. Colposcopy
Table 8.10 shows the activity data across NHSGGC Colposcopy service. In 2016/17, there were 7,123 patient episodes. New outpatient episodes include all patients attending colposcopy services; return episodes will include treatment visits following the diagnosis of cervical intra-epithelial neoplasia (CIN) in addition to standard follow up visits for colposcopy based indications. Table 8.10 NHSGGC Colposcopy service workload 1 April 2016 to 31 March 2017
Attendance Status
Type of Episode Total Episodes New
Outpatients Return/
Follow Up Outpatients
Inpatients
(Types 1-3)
Patient was Seen (Attended) 4,292 2,764 67 7,123
Cancelled by Patient 315 436 0 751
Cancelled by Clinic or Hospital 15 129 ≤5 145
Patient attended but was not seen (CNW)
≤5 ≤5 0 9
Patient Did Not Attend 502 772 0 1,274 Source: National Colposcopy Clinical Audit System (Extracted December 2017) Numbers ≤5 redacted as per ISD Statistical Disclosure Control Protocol
British Society for Colposcopy and Cervical Pathology (BSCCP) standards suggest that all patients should be seen within 8 weeks of referrals and that high grade cases should be seen within 4 weeks of referral. In NHSGGC, colposcopy service aim to see all high grade cases within 2 weeks of referral and low grade cases within 8 weeks of referral.

127
8.11. Invasive Cervical Cancer Audit
The aim of the cervical screening programme is to reduce the incidence of and mortality from invasive cervical cancer. It is recognised that in order to assess the effectiveness of the cervical screening programme, the audit of the screening histories of women with invasive cervical cancer is fundamental. This audit is an important process that helps to identify variations in practice, encourages examinations of the reasons for these variations, and helps to identify the changes required to improve the quality of the service. In 2016, we reviewed the notes of 56 women who developed invasive cervical cancer and had a pathology diagnosis made in NHS Greater Glasgow and Clyde laboratories. Table 8.11 shows numbers and the distribution of women’s age at diagnosis for years 2010 to 2016. The largest number of cervical cancers occurred in women aged between 30 and 39 years. Table 8.11 Number of NHSGGC residents with invasive cervical cancers by age at diagnosis and year of diagnosis
Year (Diagnosis)
Age Group 2010 2011 2012 2013 2014 2015 2016 Total
20-29 10 7 12 6 9 8 16 68
30-39 23 16 27 23 21 18 7 135
40-49 22 10 17 17 14 16 10 106
50-59 7 10 9 10 11 9 10 66
60-69 ≤5 7 11 ≤5 6 10 8 50
70-79 10 8 7 7 ≤5 ≤5 ≤5 44
80+ ≤5 ≤5 ≤5 ≤5 ≤5 ≤5 ≤5 19
Total 80 61 86 70 69 66 56 488
Source: NHSGGC Invasive Cancer Audit (January 2018) Numbers ≤5 redacted as per ISD Statistical Disclosure Control Protocol
Figure 8.5 shows the distribution of cervical cancers by deprivation for the period 2010 to 2016. The highest proportion of cervical cancers occurred in women living in the most deprived (SIMD1) areas.
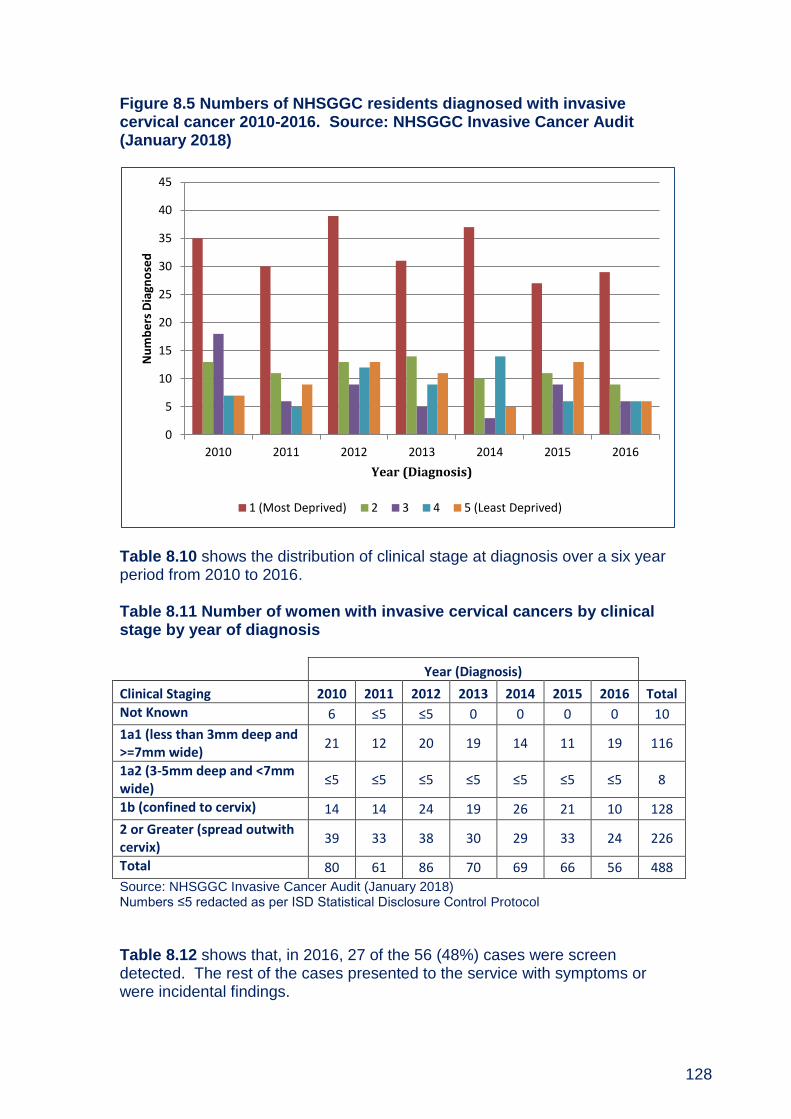
128
Figure 8.5 Numbers of NHSGGC residents diagnosed with invasive cervical cancer 2010-2016. Source: NHSGGC Invasive Cancer Audit (January 2018)
Table 8.10 shows the distribution of clinical stage at diagnosis over a six year period from 2010 to 2016. Table 8.11 Number of women with invasive cervical cancers by clinical stage by year of diagnosis
Year (Diagnosis)
Clinical Staging 2010 2011 2012 2013 2014 2015 2016 Total
Not Known 6 ≤5 ≤5 0 0 0 0 10
1a1 (less than 3mm deep and >=7mm wide)
21 12 20 19 14 11 19 116
1a2 (3-5mm deep and <7mm wide)
≤5 ≤5 ≤5 ≤5 ≤5 ≤5 ≤5 8
1b (confined to cervix) 14 14 24 19 26 21 10 128
2 or Greater (spread outwith cervix)
39 33 38 30 29 33 24 226
Total 80 61 86 70 69 66 56 488
Source: NHSGGC Invasive Cancer Audit (January 2018) Numbers ≤5 redacted as per ISD Statistical Disclosure Control Protocol
Table 8.12 shows that, in 2016, 27 of the 56 (48%) cases were screen detected. The rest of the cases presented to the service with symptoms or were incidental findings.
0
5
10
15
20
25
30
35
40
45
2010 2011 2012 2013 2014 2015 2016
Nu
mb
ers
Dia
gno
sed
Year (Diagnosis)
1 (Most Deprived) 2 3 4 5 (Least Deprived)
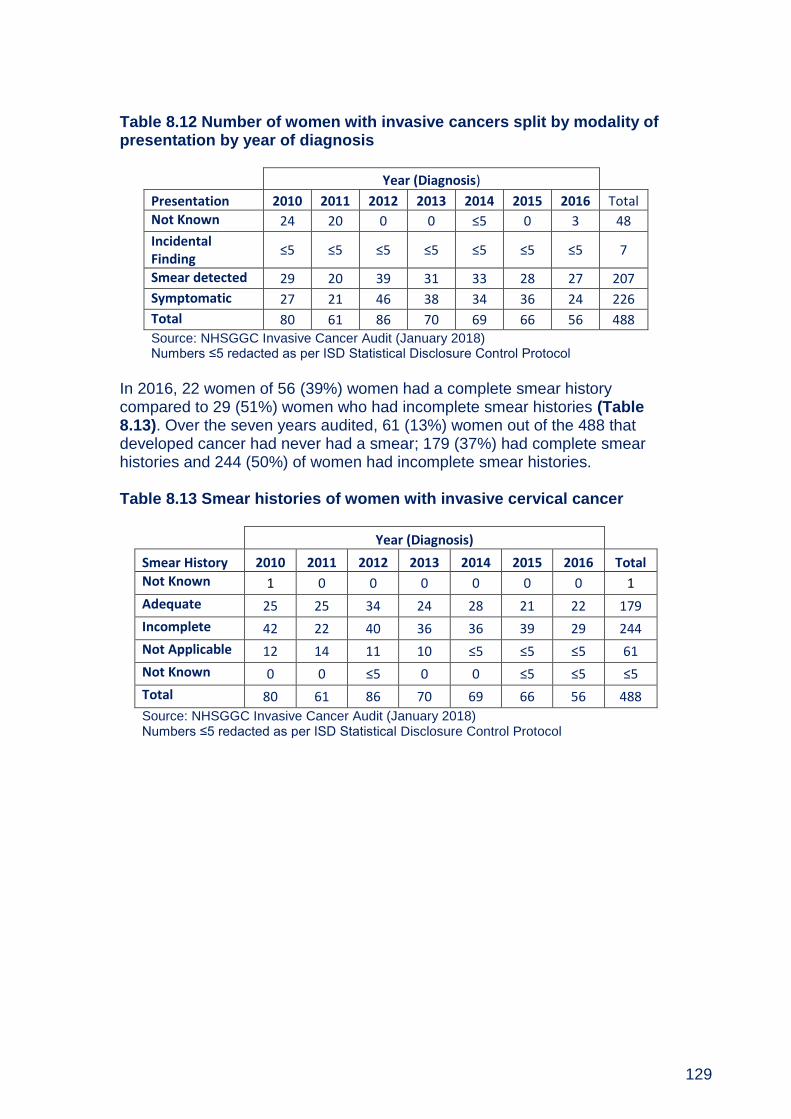
129
Table 8.12 Number of women with invasive cancers split by modality of presentation by year of diagnosis
Year (Diagnosis)
Presentation 2010 2011 2012 2013 2014 2015 2016 Total
Not Known 24 20 0 0 ≤5 0 3 48
Incidental Finding
≤5 ≤5 ≤5 ≤5 ≤5 ≤5 ≤5 7
Smear detected 29 20 39 31 33 28 27 207
Symptomatic 27 21 46 38 34 36 24 226
Total 80 61 86 70 69 66 56 488 Source: NHSGGC Invasive Cancer Audit (January 2018) Numbers ≤5 redacted as per ISD Statistical Disclosure Control Protocol
In 2016, 22 women of 56 (39%) women had a complete smear history compared to 29 (51%) women who had incomplete smear histories (Table 8.13). Over the seven years audited, 61 (13%) women out of the 488 that developed cancer had never had a smear; 179 (37%) had complete smear histories and 244 (50%) of women had incomplete smear histories. Table 8.13 Smear histories of women with invasive cervical cancer
Year (Diagnosis)
Smear History 2010 2011 2012 2013 2014 2015 2016 Total
Not Known 1 0 0 0 0 0 0 1
Adequate 25 25 34 24 28 21 22 179
Incomplete 42 22 40 36 36 39 29 244
Not Applicable 12 14 11 10 ≤5 ≤5 ≤5 61
Not Known 0 0 ≤5 0 0 ≤5 ≤5 ≤5
Total 80 61 86 70 69 66 56 488
Source: NHSGGC Invasive Cancer Audit (January 2018) Numbers ≤5 redacted as per ISD Statistical Disclosure Control Protocol
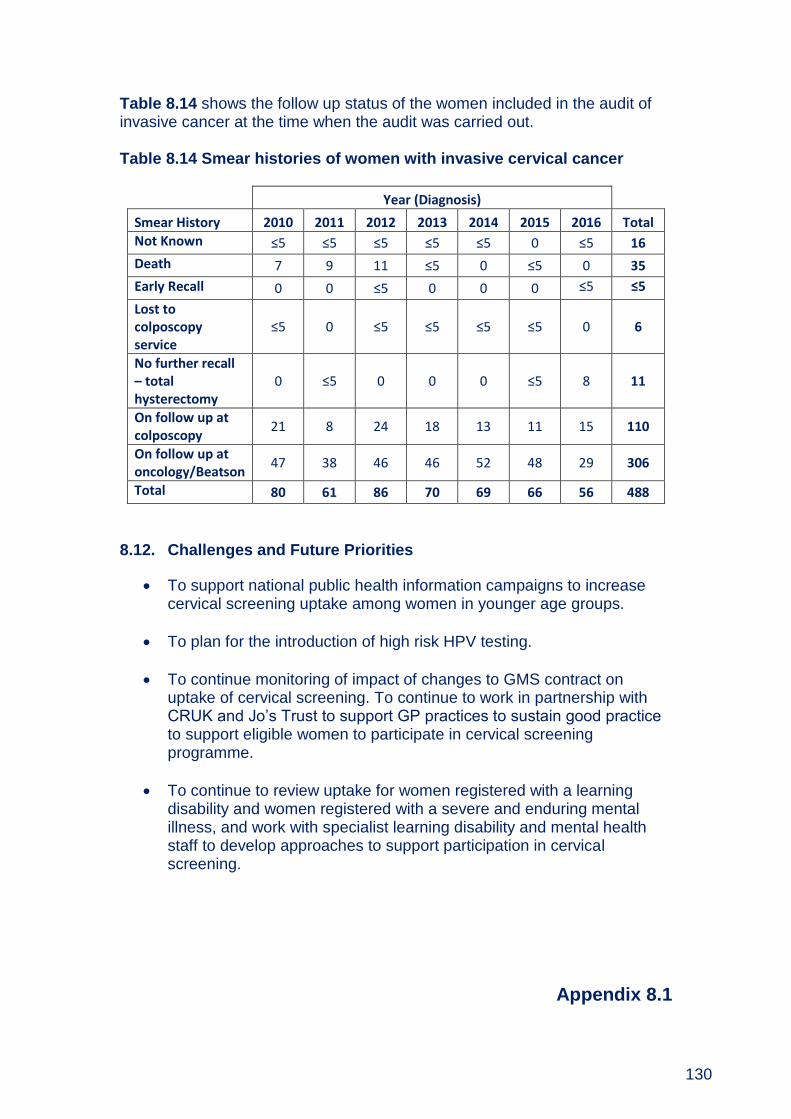
130
Table 8.14 shows the follow up status of the women included in the audit of invasive cancer at the time when the audit was carried out. Table 8.14 Smear histories of women with invasive cervical cancer
Year (Diagnosis)
Smear History 2010 2011 2012 2013 2014 2015 2016 Total
Not Known ≤5 ≤5 ≤5 ≤5 ≤5 0 ≤5 16
Death 7 9 11 ≤5 0 ≤5 0 35
Early Recall 0 0 ≤5 0 0 0 ≤5 ≤5
Lost to colposcopy service
≤5 0 ≤5 ≤5 ≤5 ≤5 0 6
No further recall – total hysterectomy
0 ≤5 0 0 0 ≤5 8 11
On follow up at colposcopy
21 8 24 18 13 11 15 110
On follow up at oncology/Beatson
47 38 46 46 52 48 29 306
Total 80 61 86 70 69 66 56 488
8.12. Challenges and Future Priorities
To support national public health information campaigns to increase cervical screening uptake among women in younger age groups.
To plan for the introduction of high risk HPV testing.
To continue monitoring of impact of changes to GMS contract on uptake of cervical screening. To continue to work in partnership with CRUK and Jo’s Trust to support GP practices to sustain good practice to support eligible women to participate in cervical screening programme.
To continue to review uptake for women registered with a learning disability and women registered with a severe and enduring mental illness, and work with specialist learning disability and mental health staff to develop approaches to support participation in cervical screening.
Appendix 8.1
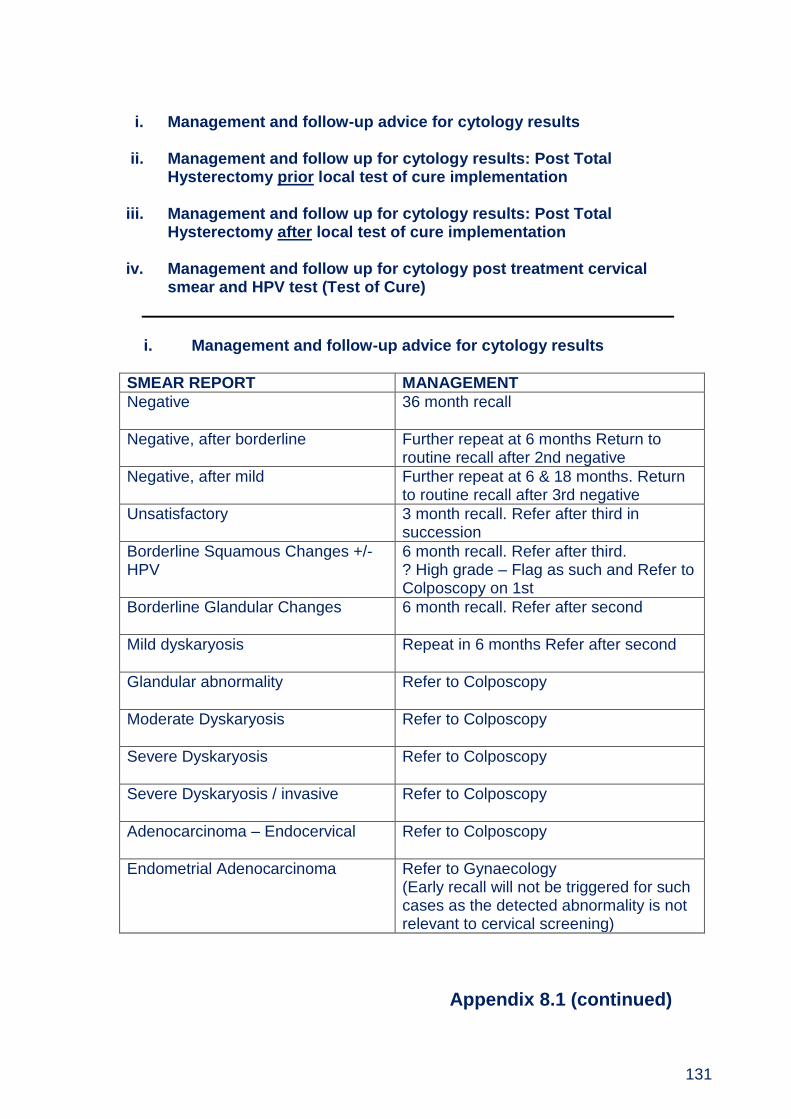
131
i. Management and follow-up advice for cytology results
ii. Management and follow up for cytology results: Post Total
Hysterectomy prior local test of cure implementation iii. Management and follow up for cytology results: Post Total
Hysterectomy after local test of cure implementation
iv. Management and follow up for cytology post treatment cervical smear and HPV test (Test of Cure)
i. Management and follow-up advice for cytology results
SMEAR REPORT MANAGEMENT
Negative
36 month recall
Negative, after borderline Further repeat at 6 months Return to routine recall after 2nd negative
Negative, after mild Further repeat at 6 & 18 months. Return to routine recall after 3rd negative
Unsatisfactory
3 month recall. Refer after third in succession
Borderline Squamous Changes +/-HPV
6 month recall. Refer after third. ? High grade – Flag as such and Refer to Colposcopy on 1st
Borderline Glandular Changes
6 month recall. Refer after second
Mild dyskaryosis Repeat in 6 months Refer after second
Glandular abnormality
Refer to Colposcopy
Moderate Dyskaryosis
Refer to Colposcopy
Severe Dyskaryosis
Refer to Colposcopy
Severe Dyskaryosis / invasive
Refer to Colposcopy
Adenocarcinoma – Endocervical
Refer to Colposcopy
Endometrial Adenocarcinoma
Refer to Gynaecology (Early recall will not be triggered for such cases as the detected abnormality is not relevant to cervical screening)
Appendix 8.1 (continued)
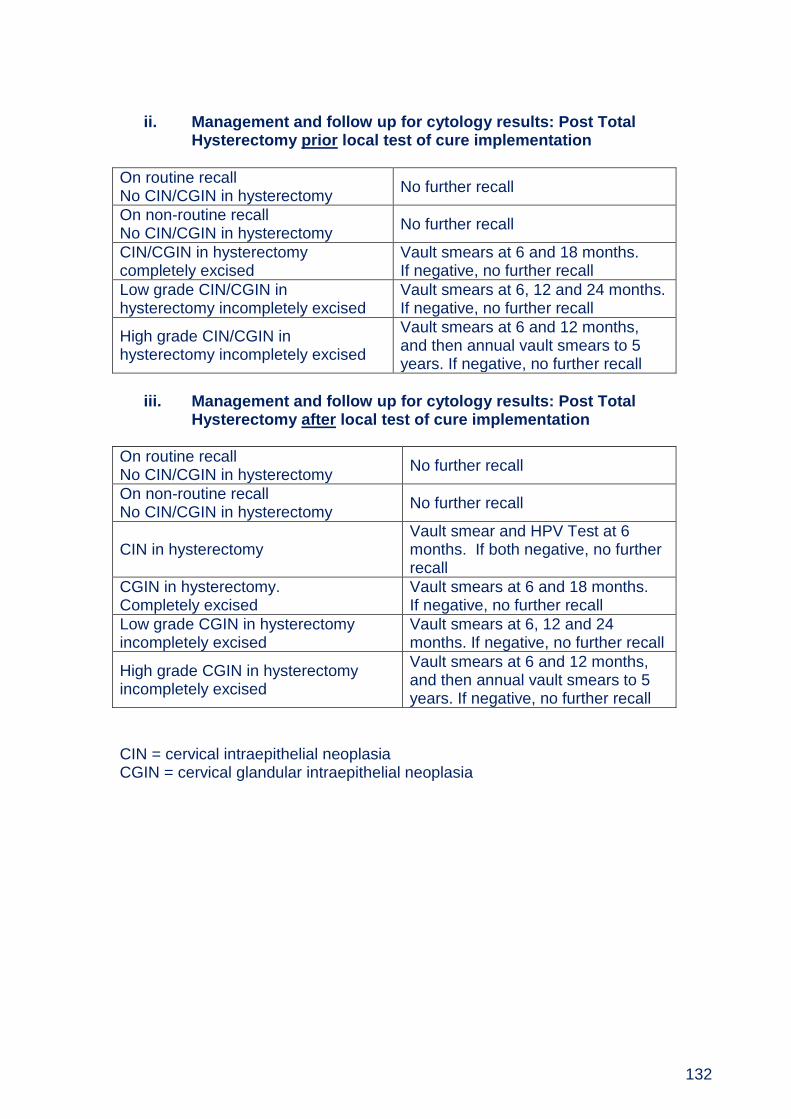
132
ii. Management and follow up for cytology results: Post Total
Hysterectomy prior local test of cure implementation
On routine recall No CIN/CGIN in hysterectomy
No further recall
On non-routine recall No CIN/CGIN in hysterectomy
No further recall
CIN/CGIN in hysterectomy completely excised
Vault smears at 6 and 18 months. If negative, no further recall
Low grade CIN/CGIN in hysterectomy incompletely excised
Vault smears at 6, 12 and 24 months. If negative, no further recall
High grade CIN/CGIN in hysterectomy incompletely excised
Vault smears at 6 and 12 months, and then annual vault smears to 5 years. If negative, no further recall
iii. Management and follow up for cytology results: Post Total
Hysterectomy after local test of cure implementation
On routine recall No CIN/CGIN in hysterectomy
No further recall
On non-routine recall No CIN/CGIN in hysterectomy
No further recall
CIN in hysterectomy Vault smear and HPV Test at 6 months. If both negative, no further recall
CGIN in hysterectomy. Completely excised
Vault smears at 6 and 18 months. If negative, no further recall
Low grade CGIN in hysterectomy incompletely excised
Vault smears at 6, 12 and 24 months. If negative, no further recall
High grade CGIN in hysterectomy incompletely excised
Vault smears at 6 and 12 months, and then annual vault smears to 5 years. If negative, no further recall
CIN = cervical intraepithelial neoplasia CGIN = cervical glandular intraepithelial neoplasia
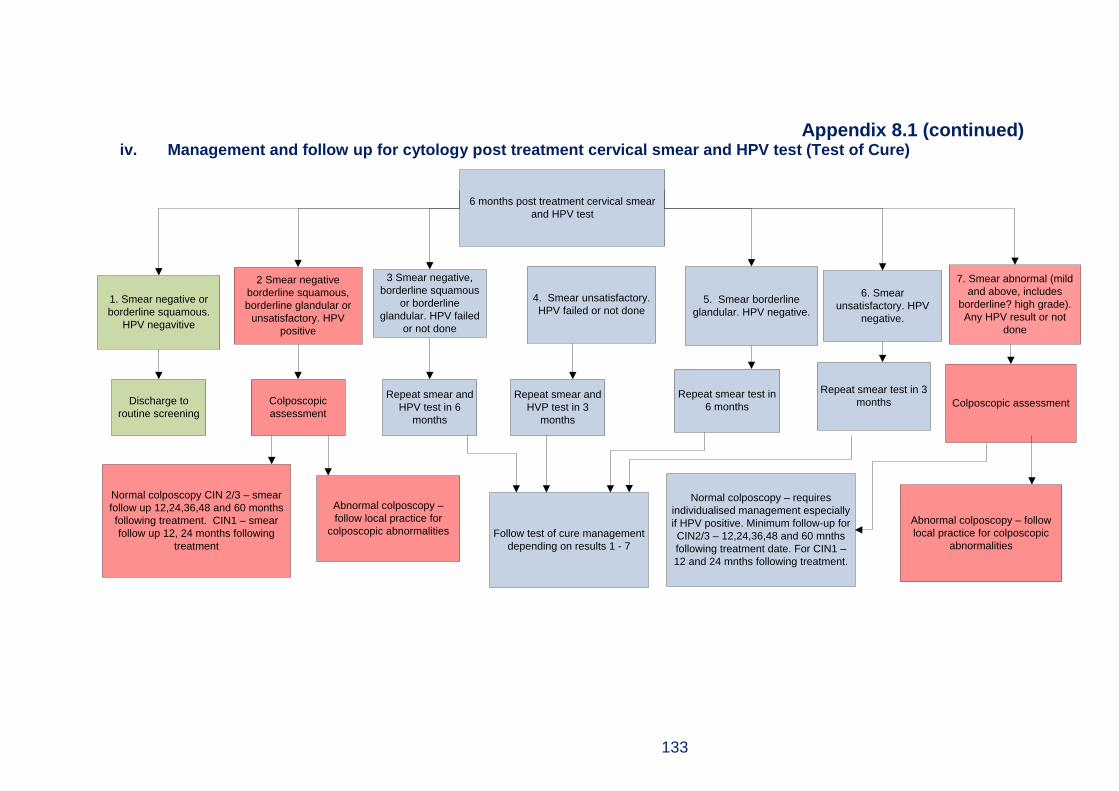
133
Appendix 8.1 (continued) iv. Management and follow up for cytology post treatment cervical smear and HPV test (Test of Cure)
6 months post treatment cervical smear
and HPV test
2 Smear negative
borderline squamous,
borderline glandular or
unsatisfactory. HPV
positive
4. Smear unsatisfactory.
HPV failed or not done
3 Smear negative,
borderline squamous
or borderline
glandular. HPV failed
or not done
5. Smear borderline
glandular. HPV negative.
6. Smear
unsatisfactory. HPV
negative.
1. Smear negative or
borderline squamous.
HPV negavitive
7. Smear abnormal (mild
and above, includes
borderline? high grade).
Any HPV result or not
done
Discharge to
routine screening
Colposcopic
assessment
Repeat smear and
HPV test in 6
months
Repeat smear and
HVP test in 3
months
Repeat smear test in
6 months
Repeat smear test in 3
months Colposcopic assessment
Normal colposcopy CIN 2/3 – smear
follow up 12,24,36,48 and 60 months
following treatment. CIN1 – smear
follow up 12, 24 months following
treatment
Abnormal colposcopy –
follow local practice for
colposcopic abnormalities Follow test of cure management
depending on results 1 - 7
Normal colposcopy – requires
individualised management especially
if HPV positive. Minimum follow-up for
CIN2/3 – 12,24,36,48 and 60 mnths
following treatment date. For CIN1 –
12 and 24 mnths following treatment.
Abnormal colposcopy – follow
local practice for colposcopic
abnormalities

134
Appendix 8.2 National Performance Standards 2016-2017 Source: ISD Scotland http://isdscotland.org/Health-Topics/Cancer/Cervical-Screening/ Uptake for Cervical Screening; Scotland & NHSGGC 1st April 2016 to 31st March 2017 Percentage uptake of females aged 25-64. Uptake based on being screened within the specified period (within last 3.5 or 5.5 years).
Screening uptake Standard
% Scotland
%
Greater Glasgow &
Clyde %
The percentage of eligible women (aged 25 to 64) who were recorded as screened adequately
80 73.4 70.0
Percentage uptake by deprivation quintile
SIMD 1 (most deprived)
80
67.4 67.0
SIMD 2 71.2 69.8
SIMD 3 73.8 69.9
SIMD 4 76.5 71.0
SIMD 5 (least deprived) 78.3 75.4
Uptake for Cervical Screening by HPV vaccinated: Scotland & NHSGGC Percentage uptake of females who had a record of a previous screening test taken within last 3.5 years by 5-year age groups
HPV vaccination status
AGE
21 22 23 24 25
Immunised (full)1
NHSGGC 48.5 57.7 68.7 69.3 72.2
Scotland 50.9 61.5 70.9 70.7 72.7
Immunised (incomplete)2
NHSGGC 29.1 52.3 60.3 69.1 68.0
Scotland 35.4 54.0 68.2 66.4 70.0
Non-Immunised
NHSGGC 17.9 24.9 33.9 31.7 34.8
Scotland 22.8 29.6 40.8 37.9 40.3 1The Immunisation Status of FULL is where the individual has been Fully
Immunised i.e. had all HPV doses. 2Incomplete is where the individual has had at least one of the Immunisations but
not all of them.

135
Appendix 8.2 (continued) Cervical screening tests processed1: Scotland & NHSGGC laboratories, 1st April 2016 to 31st March 2017
Year/ quarter Scotland Greater Glasgow &
Clyde
Q4 107,520 27,752
Q3 95,256 23,400
Q2 116,414 28,719
Q1 98,077 23,917
TOTAL 417,267 103,788 1.
Data includes unsatisfactory screening tests.
Laboratory Turnaround times1 for 95% of all cervical screening tests processed at NHS laboratories: Scotland & NHSGGC laboratories, 1st April 2016 to 31st March 2017
Year/ quarter Scotland Greater
Glasgow & Clyde
Q4 22 16
Q3 29 25
Q2 27 21
Q1 25 28 1.
The turnaround time is defined as the number of days from the date the sample was received by the laboratory to the date the report was issued by the laboratory.
Average reporting times1 for cervical screening tests: Scotland & NHSGGC laboratories, 1st April 2016 to 31st March 2017 (Mean number of days by quarter)
Year/ quarter Scotland Greater
Glasgow & Clyde
Q4 22 19
Q3 30 25
Q2 28 21
Q1 25 22

136
Appendix 8.3
Members of Cervical Screening Steering Group (As at March 2017) Dr David Morrison Consultant in Public Health Medicine (Chair) Ms Christine Black Consultant in Sexual and Reproductive Health Dr Kevin Burton Consultant Gynaecologist Mr Paul Burton Information Manager Mrs Lin Calderwood HI&T Service Delivery Manager Mrs Pam Campbell Records Manager Ms Mary Fingland LMC Representative Mrs Elaine Garman Public Health Specialist, NHS Highland Mrs Fiona Gilchrist Assistant Programme Manager, Screening Dept Dr Robert Henderson Consultant in Public Health Medicine, Highland Mrs Kathy Kenmuir Practice Nurse Support and Development Team Manager Ms Alana Laing CRUK Facilitator, West of Scotland Dr Margaret Laing Staff Grade in Cytology/Colposcopy Ms Linda McAllister Head of Health Records Miss Denise Lyden Project Officer Mrs Michelle McLachlan General Manager, Obstetrics Dr Abigail Oakley Consultant Pathologist Dr Ken O’Neill Clinical Director, Glasgow City HSCP Mrs Christine Paterson General Practice Support and Development Nurse Mr Graham Reid Specialty Manager, Cytology Mrs Elizabeth Rennie Programme Manager, Screening Dept Mrs Alison Street General Practice Support and Development Nurse Ms Stella Williamson Referral Management and Clinic Build Lead

137
Chapter 9 - Diabetic Retinopathy Screening
Summary Due to the implementation of a new national IT system, VECTOR, routine data
reporting was not available at the time of this report. Therefore it has not been possible to undertake additional local analysis for DRS screening uptake and outcomes.
National performance statistics for screening participation for the quarter 3 period (1st April 2016 and 1st January 2017) and national supplementary uptake data (1st April 2016 to 31st March 2-17) are provided in this report to provide insight to 2016/17 programme performance and delivery.
Diabetes mellitus is a long-term condition in which the level of glucose in the blood is raised leading to abnormal fat metabolism and other complications. There are two main types of diabetes: type 1 and type 2.
In Scotland, there were 291,981 people with known diabetes recorded on local diabetes registers in 2016, representing 5.4% of the population.
In Greater Glasgow and Clyde, there were 62,874 people with known diabetes in 2016 compared to 48,602 people in 2007, an increase of 29.3%.
Prevalence of diabetes among NHS Greater Glasgow and Clyde adult residents has gradually increased from 4.1% in 2007 to 5.5% in 2016.
Based on nationally reported supplementary programme statistics for the period 1st April 2016 to 31st March 2017: There were 66,755 people with known diabetes in NHS Greater Glasgow and
Clyde. Of these, 58,097 (87.0%) were eligible for DRS screening.
10,171 (15.2%) people were not eligible for screening because they were either permanently or temporarily suspended from the programme.
Of the 58,097 people with diabetes eligible for DRS screening, 39,138 (67.4%) were attended screening.

138
Table of Contents
9.1. Background ................................................................................................... 139
9.2. Aim of the Screening Programme and Eligible Population ....................... 140
9.3. The Screening Test ....................................................................................... 140
9.4. Clinic Setting ................................................................................................. 141
9.5. Screening Pathway ....................................................................................... 141
9.6. Delivery of NHSGGC Diabetic Retinopathy Screening Programme ......... 141
9.7. Challenges and Future Priorities ................................................................. 144

139
9.1. Background Diabetes mellitus is a long-term condition in which the level of glucose in the blood is raised leading to abnormal fat metabolism and other complications. There are two main types of diabetes: type 1 and type 2. Type 1 often develops before the age of 40 and usually during the teenage years. Type 2 is far more common than type 1, and typically affects people over the age of 40 (although increasingly younger people are affected as well). It is often associated with being overweight or obese and people of South Asian, African-Caribbean or Middle Eastern origin are more frequently affected. In Scotland, there were 291,981 people with known diabetes recorded on local diabetes registers in 2016, representing 5.4% of the population22. In Greater Glasgow and Clyde, there were there were 62,874 people with known diabetes in 2016, (5.5% of the population) compared to 48,602 people in 2007(4.1% of the population) 23 an increase of 29.3%. Over the last decade, the crude prevalence of diabetes (all types) has increased by 1.3% (Figure 9.1). Figure 9.1 Number of people with diabetes, crude prevalence of diabetes and changes in numbers/proportions by year. (Source: Scottish Diabetes Survey 2016)
22 http://www.diabetesinscotland.org.uk/Publications/Scottish%20Diabetes%20Survey%202016.pdf 23
http://www.diabetesinscotland.org.uk/Publications/Scottish%20Diabetes%20Survey%202007.pdf
0
1
2
3
4
5
6
0
50,000
100,000
150,000
200,000
250,000
300,000
350,000
2007 2008 2009 2010 2011 2012 2013 2014 2015 2016
Rat
e (
%)
Nu
mb
er
Year
Diabetes register (n) Crude prevalence (%)

140
Diabetic Retinopathy is a complication of diabetes affecting blood vessels of the retina and is the biggest single cause of blindness and visual impairment amongst working age people in Scotland. Retinopathy is symptom-free until its late stages, and programmes of retinal screening can reduce the risk of blindness in a diabetic population by detecting retinopathy at a stage at which it may be effectively treated. If it is detected early enough, treatment can prevent the progression of the disease and save sight for many years in most patients.
9.2. Aim of the Screening Programme and Eligible Population The national Diabetic Retinopathy Screening Programme (DRSP) is an integral part of patients’ diabetes care. The primary aim of the programme is the detection of referable (sight-threatening) retinopathy. A secondary aim is the detection of lesser degrees of diabetic retinopathy. This can have implications for the medical management of people with diabetes. All people with diabetes aged 12 and over who are resident in the NHSGGC area are eligible for Diabetic Retinopathy Screening. DRS screening was implemented across NHSGGC between 2004/05. The national DRS screening programme performance and quality is monitored via defined National DRS Screening Standards24 and Key Performance Indicators (KPIs)25.
9.3. The Screening Test In the first instance a digital photograph is taken of the individual’s retina. If the photograph cannot be graded then a further slit lamp examination will be performed. There are two main information systems used in the provision of Diabetic Retinopathy Screening.
i) SOARIAN provided the call/recall, image capture, grading, quality
assurance and result delivery. The SORIAN system was replaced by the
VECTOR system, requiring 3 weeks service down-time during March
2017, with a go live date on 1st April 2017.
ii) SCI-Diabetes is an essential component for effective Diabetic Retinopathy
Screening. It provides the diabetes population register for diabetic
retinopathy screening call/recall and the screening results where they can
be viewed by clinical staff involved in the care of patients with diabetes.
24
http://www.healthcareimprovementscotland.org/our_work/long_term_conditions/programme_resour
ces/diabetic_retinopathy_screening.aspx 25
http://www.ndrs-wp.scot.nhs.uk/?page_id=147
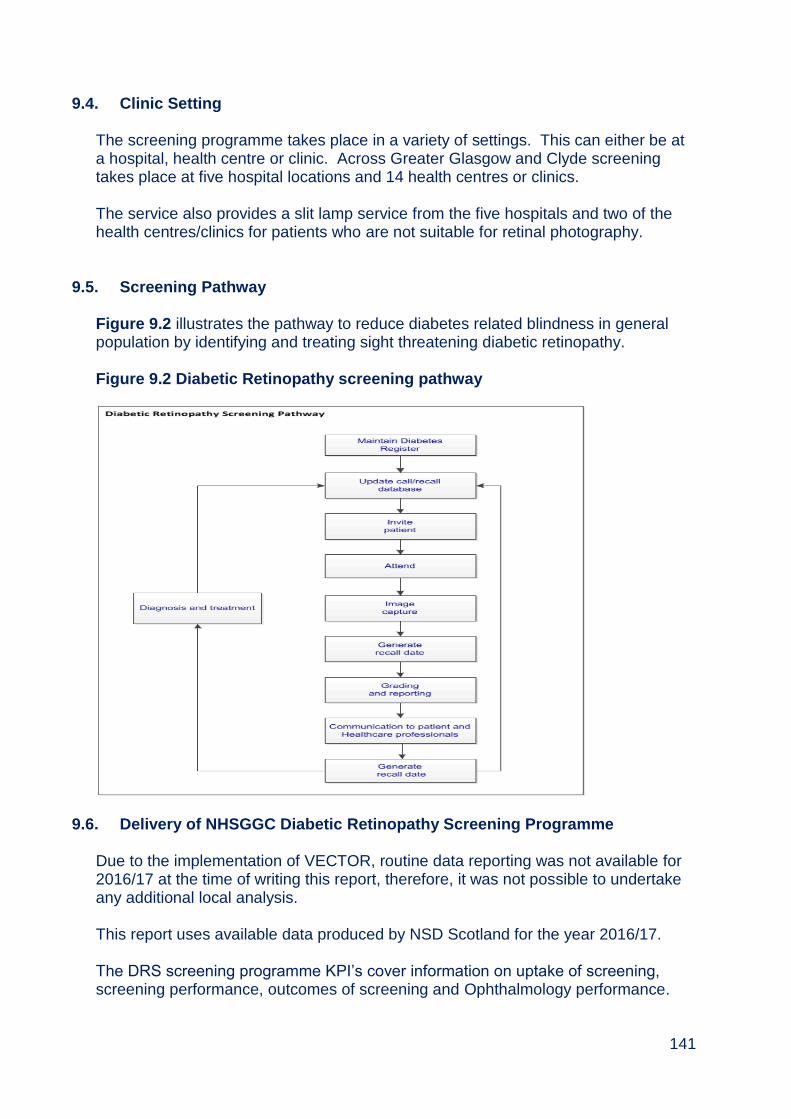
141
9.4. Clinic Setting The screening programme takes place in a variety of settings. This can either be at a hospital, health centre or clinic. Across Greater Glasgow and Clyde screening takes place at five hospital locations and 14 health centres or clinics. The service also provides a slit lamp service from the five hospitals and two of the health centres/clinics for patients who are not suitable for retinal photography.
9.5. Screening Pathway Figure 9.2 illustrates the pathway to reduce diabetes related blindness in general population by identifying and treating sight threatening diabetic retinopathy. Figure 9.2 Diabetic Retinopathy screening pathway
9.6. Delivery of NHSGGC Diabetic Retinopathy Screening Programme Due to the implementation of VECTOR, routine data reporting was not available for 2016/17 at the time of writing this report, therefore, it was not possible to undertake any additional local analysis. This report uses available data produced by NSD Scotland for the year 2016/17. The DRS screening programme KPI’s cover information on uptake of screening, screening performance, outcomes of screening and Ophthalmology performance.
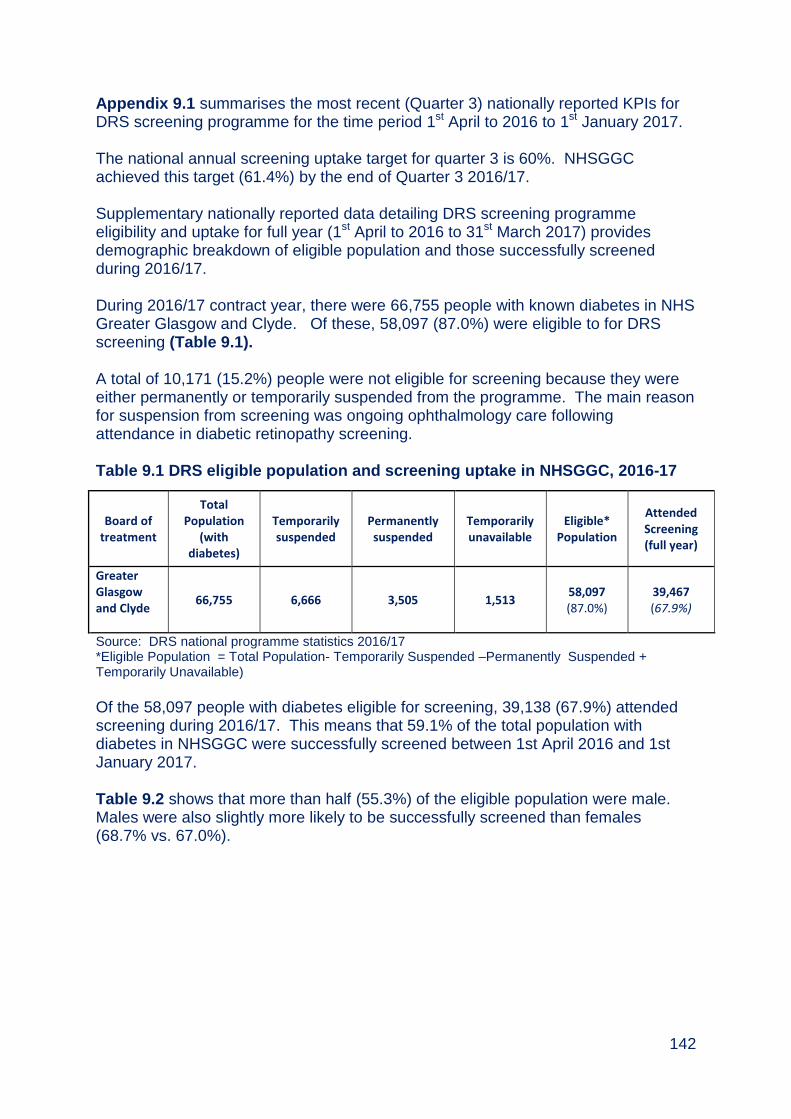
142
Appendix 9.1 summarises the most recent (Quarter 3) nationally reported KPIs for DRS screening programme for the time period 1st April to 2016 to 1st January 2017. The national annual screening uptake target for quarter 3 is 60%. NHSGGC achieved this target (61.4%) by the end of Quarter 3 2016/17. Supplementary nationally reported data detailing DRS screening programme eligibility and uptake for full year (1st April to 2016 to 31st March 2017) provides demographic breakdown of eligible population and those successfully screened during 2016/17. During 2016/17 contract year, there were 66,755 people with known diabetes in NHS Greater Glasgow and Clyde. Of these, 58,097 (87.0%) were eligible to for DRS screening (Table 9.1). A total of 10,171 (15.2%) people were not eligible for screening because they were either permanently or temporarily suspended from the programme. The main reason for suspension from screening was ongoing ophthalmology care following attendance in diabetic retinopathy screening. Table 9.1 DRS eligible population and screening uptake in NHSGGC, 2016-17
Of the 58,097 people with diabetes eligible for screening, 39,138 (67.9%) attended screening during 2016/17. This means that 59.1% of the total population with diabetes in NHSGGC were successfully screened between 1st April 2016 and 1st January 2017. Table 9.2 shows that more than half (55.3%) of the eligible population were male. Males were also slightly more likely to be successfully screened than females (68.7% vs. 67.0%).
Board of treatment
Total Population
(with diabetes)
Temporarily suspended
Permanently suspended
Temporarily unavailable
Eligible* Population
Attended Screening (full year)
Greater Glasgow and Clyde
66,755 6,666 3,505 1,513 58,097 (87.0%)
39,467 (67.9%)
Source: DRS national programme statistics 2016/17 *Eligible Population = Total Population- Temporarily Suspended –Permanently Suspended + Temporarily Unavailable)

143
Table 9.2 Uptake of DRS screening by sex in NHSGGC, 2016-17
Sex Eligible
Population % of eligible population
Attended Screening (full year)
% Attended Screening (full year)
Female 25,981 44.7 17,395 67.0
Male 32,110 55.3 22,072 68.7
Unknown 6 0.0 0 0.0
TOTAL 58,097 100.0 39,467 67.9
Source: DRS national programme statistics 2016/17
Table 9.3 shows that half of the eligible population are aged between 55 to 74 years of age. Eligible individuals aged 65 to 74 years were most likely to attend DRS screening (73.8%) compared to other age groups.
Table 9.3 Uptake of DRS screening by age in NHSGGC, 2016-17
Age
Eligible Population
% of eligible population
Attended Screening (full year)
% Attended Screening (full year)
12 to 14 147 0.3 95 64.6
15 to 24 983 1.7 527 53.6
25 to 34 1,694 2.9 829 48.9
35 to 44 3,466 6.0 1,938 55.9
45 to 54 8,801 15.1 5,539 62.9
55 to 64 14,449 24.9 10,007 69.3
65 to 74 14,727 25.3 10,875 73.8
75 to 84 10,509 18.1 7,536 71.7
85+ 3,320 5.7 2,121 63.9
TOTAL 58,096 100.0 39,467 67.9
Source: DRS national programme statistics 2016/17
Forty percent of the eligible population resided in the most deprived Board areas. There was a consistent pattern that DRS screening uptake increased with decreasing levels of deprivation (Table 9.4). Uptake was lowest among people residing in the most deprived areas (65.3%) and highest among those residing in the least deprived areas (72.4%). Table 9.4 shows that the majority of the eligible population are White British (79.9%). DRS screening uptake was also highest among this group (69.2%).
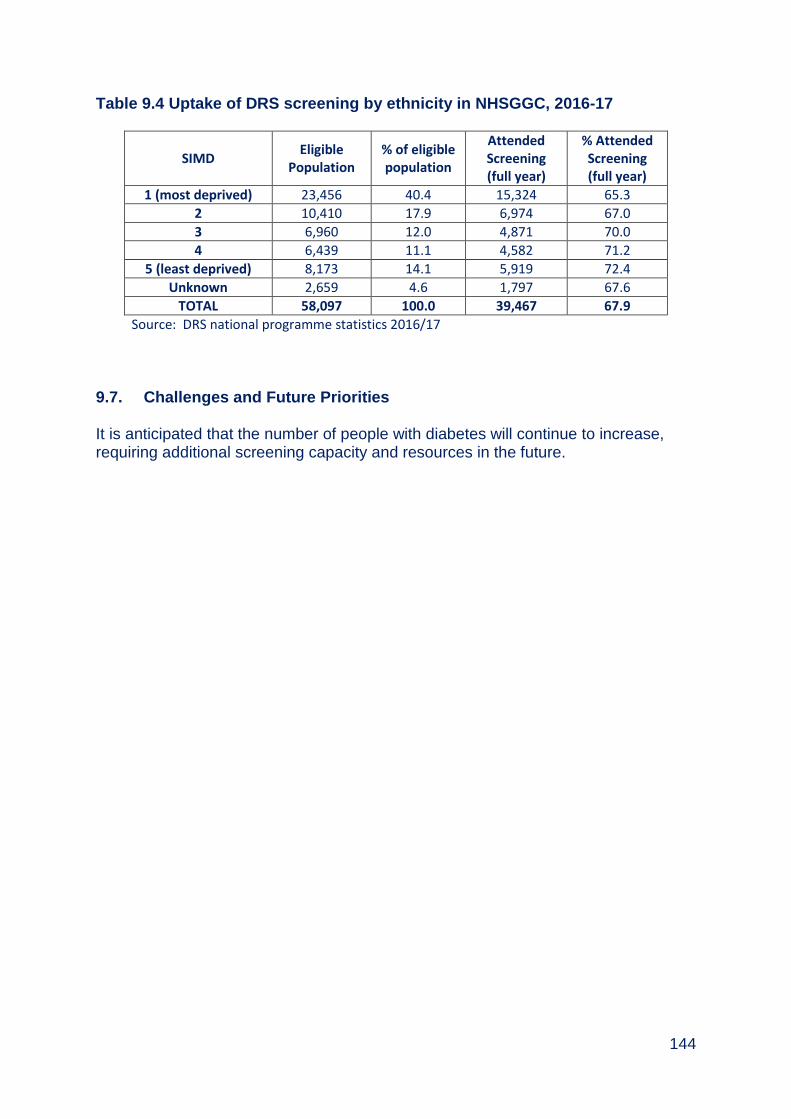
144
Table 9.4 Uptake of DRS screening by ethnicity in NHSGGC, 2016-17
SIMD Eligible
Population % of eligible population
Attended Screening (full year)
% Attended Screening (full year)
1 (most deprived) 23,456 40.4 15,324 65.3
2 10,410 17.9 6,974 67.0
3 6,960 12.0 4,871 70.0
4 6,439 11.1 4,582 71.2
5 (least deprived) 8,173 14.1 5,919 72.4
Unknown 2,659 4.6 1,797 67.6
TOTAL 58,097 100.0 39,467 67.9
Source: DRS national programme statistics 2016/17
9.7. Challenges and Future Priorities It is anticipated that the number of people with diabetes will continue to increase, requiring additional screening capacity and resources in the future.
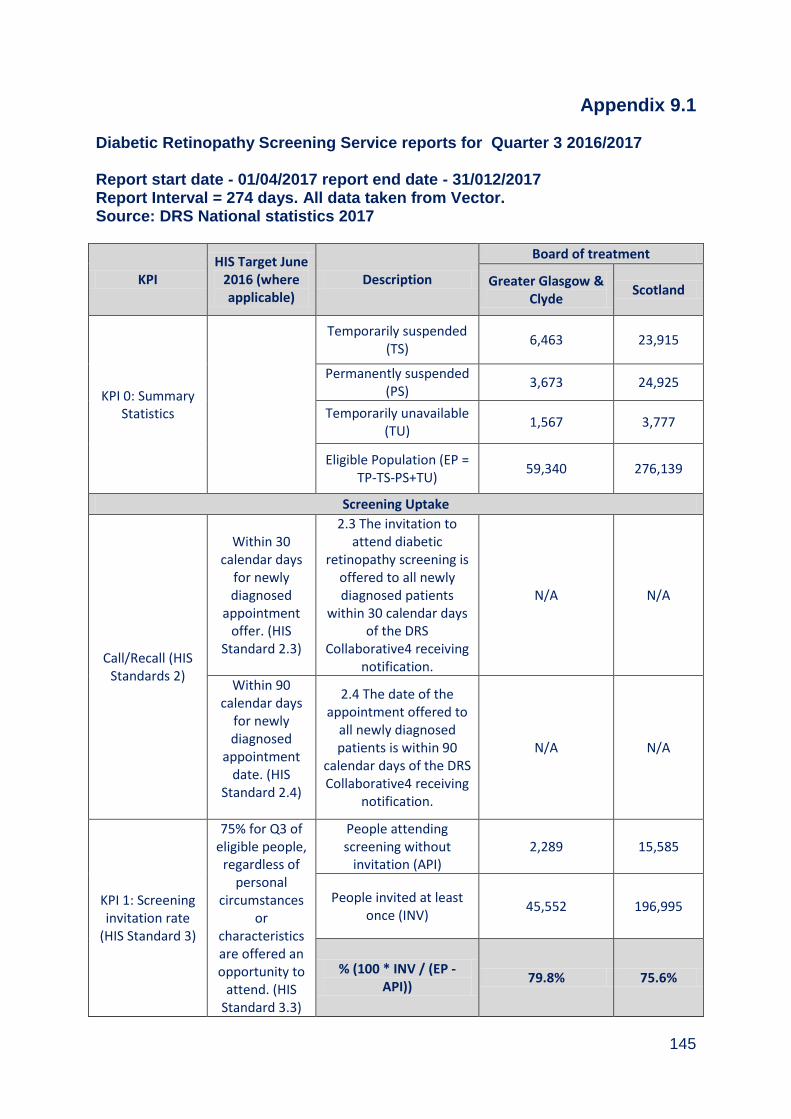
145
Appendix 9.1
Diabetic Retinopathy Screening Service reports for Quarter 3 2016/2017 Report start date - 01/04/2017 report end date - 31/012/2017 Report Interval = 274 days. All data taken from Vector. Source: DRS National statistics 2017
KPI HIS Target June
2016 (where applicable)
Description
Board of treatment
Greater Glasgow & Clyde
Scotland
KPI 0: Summary Statistics
Temporarily suspended (TS)
6,463 23,915
Permanently suspended (PS)
3,673 24,925
Temporarily unavailable (TU)
1,567 3,777
Eligible Population (EP = TP-TS-PS+TU)
59,340 276,139
Screening Uptake
Call/Recall (HIS Standards 2)
Within 30 calendar days
for newly diagnosed
appointment offer. (HIS
Standard 2.3)
2.3 The invitation to attend diabetic
retinopathy screening is offered to all newly diagnosed patients
within 30 calendar days of the DRS
Collaborative4 receiving notification.
N/A N/A
Within 90 calendar days
for newly diagnosed
appointment date. (HIS
Standard 2.4)
2.4 The date of the appointment offered to
all newly diagnosed patients is within 90
calendar days of the DRS Collaborative4 receiving
notification.
N/A N/A
KPI 1: Screening invitation rate
(HIS Standard 3)
75% for Q3 of eligible people,
regardless of personal
circumstances or
characteristics are offered an opportunity to
attend. (HIS Standard 3.3)
People attending screening without
invitation (API) 2,289 15,585
People invited at least once (INV)
45,552 196,995
% (100 * INV / (EP - API))
79.8% 75.6%

146
KPI 2: Screening uptake rate
(HIS Standard 3)
NHS boards achieve an
attendance of 60% for Q3.
(HIS Standard 3.1)
People attending at least once (ATT)
36,449 157,942
% (100 * ATT / EP) 61.4% 57.2%
DNA rate Indicative DNA
rate by % % (100 * INV - ATT) 18.4% 18.4%
KPI 3: Annual successful
screening rate (HIS Standard 3)
NHS boards achieve an
uptake of 80% pa. (HIS
Standard 3.2)
People successfully screened in the previous
year (ANN) 37,161 172,201
% (100 * SUC1 /EP) 62.6% 62.4%
KPI 4: Successful screening rate
(HIS Standard 3)
NHS boards achieve an
uptake of 60% for Q3
(HIS Standard 3.2)
People successfully screened in reporting
period (SUC) 33,978 152,515
% (100 * SUC2 /EP) 57.3% 55.2%
KPI 5: Biennial successful
screening rate (HIS Standard 3)
NHS boards achieve an
uptake of 80% pa. (HIS
Standard 3.2)
People successfully screened (biennial) (BIE)
38,602 177,582
% (100 * BIE / EP) 65.1% 64.3%
KPI 6: Annual patient technical
recall rate
As low as possible
People unsuccessfully screened (UNSUC)
953 5,580
% (100 * UNSUC / EP) 1.6% 2.0%
KPI 7A: Annual photographic
technical failure rate
(HIS Standard 4)
NHS boards achieve a
maximum rate of ungradeable images of 2.5%
for digital imaging. (HIS Standard 4.3)
Photographic screenings (PS)
38,147 172,075
Unsuccessful photographic screening
episodes (UPS) 981 5,740
% (100 * UPS/ PS) 2.6% 3.3%
KPI 7B: Annual slit lamp
technical failure rate
NHS boards achieve a
maximum rate of ungradeable images of 2.0%
for slit lamp examinations. (HIS Standard
4.3)
Slit lamp screenings (SL) 2,589 14,712
Unsuccessful slit lamp screening episodes (USL)
12 375
% (100 * USL / SL) 0.5% 2.5%

147
KPI 7: Annual overall technical
failure rate
As low as possible
Slit lamp screenings + photographic screenings
(SLPS) 40,736 186,787
Unsuccessful slit lamp screenings &
photographic screenings (USLUPS)
993 6,115
% (100 * USLUPS / SLPS) 2.4% 3.3%
Screening performance
KPI 8: Duration to written report
A minimum of 95% of people screened are
sent the result within 20
working days of being screened.
Longest recorded number of days to
written report (LRD) 157 215
Average of the number of days to written report
(AD) 35 14.5
Median of the number of days to written report
(MD) 41 12
KPI 9: Written report success
rate
Episodes with <= 20 working days to written
report (E20D) 13,179 106,324
% (100 * E20D / NE) 35.3% 64.3%
Screening outcomes
KPI 10: Twelve Month Recall
result rate
Successful screening episodes (excl. ophthalmology
examinations) (SSE)
34,718 158,095
% (100* SSE/EP) 58.5% 57.3%
Screening episodes (excl. ophthalmology examinations) with
negative result (SEN)
340 1,827
% (100 * SEN / SSE) 1.0% 1.2%
KPI 11: Six Month Recall
result rate
Screening episodes (excl. ophthalmology examinations) with
observable result (SEO)
459 2,271
% (100 * SEO / SSE) 1.3% 1.4%
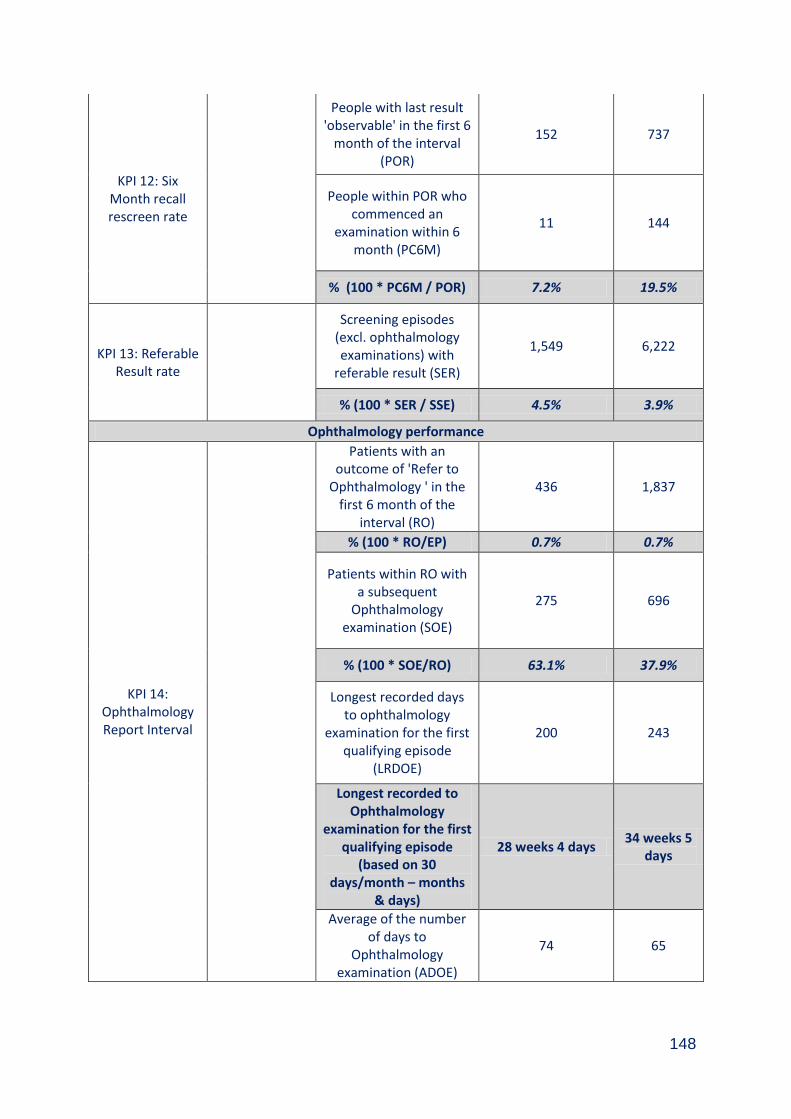
148
KPI 12: Six Month recall rescreen rate
People with last result 'observable' in the first 6
month of the interval (POR)
152 737
People within POR who commenced an
examination within 6 month (PC6M)
11 144
% (100 * PC6M / POR) 7.2% 19.5%
KPI 13: Referable Result rate
Screening episodes (excl. ophthalmology examinations) with
referable result (SER)
1,549 6,222
% (100 * SER / SSE) 4.5% 3.9%
Ophthalmology performance
KPI 14: Ophthalmology Report Interval
Patients with an outcome of 'Refer to
Ophthalmology ' in the first 6 month of the
interval (RO)
436 1,837
% (100 * RO/EP) 0.7% 0.7%
Patients within RO with a subsequent
Ophthalmology examination (SOE)
275 696
% (100 * SOE/RO) 63.1% 37.9%
Longest recorded days to ophthalmology
examination for the first qualifying episode
(LRDOE)
200 243
Longest recorded to Ophthalmology
examination for the first qualifying episode
(based on 30 days/month – months
& days)
28 weeks 4 days 34 weeks 5
days
Average of the number of days to
Ophthalmology examination (ADOE)
74 65
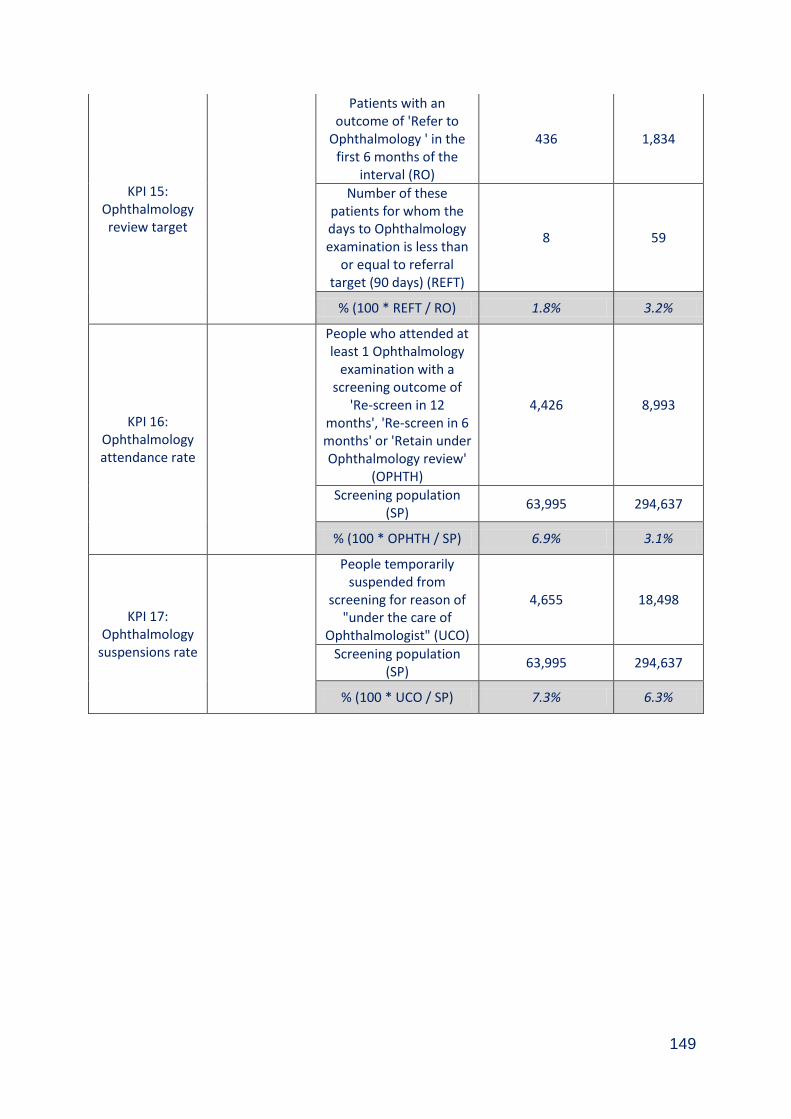
149
KPI 15: Ophthalmology review target
Patients with an outcome of 'Refer to
Ophthalmology ' in the first 6 months of the
interval (RO)
436 1,834
Number of these patients for whom the days to Ophthalmology examination is less than
or equal to referral target (90 days) (REFT)
8 59
% (100 * REFT / RO) 1.8% 3.2%
KPI 16: Ophthalmology attendance rate
People who attended at least 1 Ophthalmology
examination with a screening outcome of
'Re-screen in 12 months', 'Re-screen in 6 months' or 'Retain under Ophthalmology review'
(OPHTH)
4,426 8,993
Screening population (SP)
63,995 294,637
% (100 * OPHTH / SP) 6.9% 3.1%
KPI 17: Ophthalmology
suspensions rate
People temporarily suspended from
screening for reason of "under the care of
Ophthalmologist" (UCO)
4,655 18,498
Screening population (SP)
63,995 294,637
% (100 * UCO / SP) 7.3% 6.3%
150
Appendix 9.2 Members of Diabetic Retinopathy Screening Steering Group (As at 31st March 2017) Dr David Morrison Consultant in Public Health Medicine (chair) Mr Jim Bretherton Clinical Service Manager Mr Paul Burton Information Manager Mrs Lin Calderwood HI&T Screening Service Delivery Manager Mrs Fiona Gilchrist Assistant Programme Manager, Screening Dept Mrs Fiona Heggie Clinical Nurse Co-ordinator, Retinal Screening Ms Heather Jarvie Public Health Programme Manager Miss Denise Lyden Project Officer Ms Gillian Kinstrie Co-ordinator for MCN for Diabetes Mrs Chris McNeill Head of Community Health & Care, Partnerships Mr Eddie McVey Optometric Advisor Mrs Elizabeth Rennie Programme Manager, Screening Dept Mr David Sawers DRS Service Manager Dr William Wykes Consultant Ophthalmologist Dr Sonia Zachariah Specialty Doctor, Diabetic Retinal Screening


