102
Public Health Surveillance Diane Woolard, Ph.D., M.P.H. Division of Surveillance & Investigation Virginia Department of Health
| Date post: | 22-Dec-2015 |
| Category: |
Documents |
| View: | 242 times |
| Download: | 1 times |

Public Health Surveillance
Diane Woolard, Ph.D., M.P.H.Division of Surveillance & Investigation
Virginia Department of Health

Objectives of Lecture
• Key concepts of surveillance– Definition– Uses– Methods
• Public health surveillance systems• Use and evaluation of surveillance systems• Influenza surveillance

What comes to mind when you hear ‘surveillance’?
• Law enforcement agencies• CIA
• Routine data collection
• Statistics
• Trends

Definition of Surveillance
• The ongoing systematic collection, analysis, and interpretation of outcome-specific data for use in the planning, implementation, and evaluation of public health practice.
• Includes data collection, analysis, and dissemination to those responsible for prevention and control.
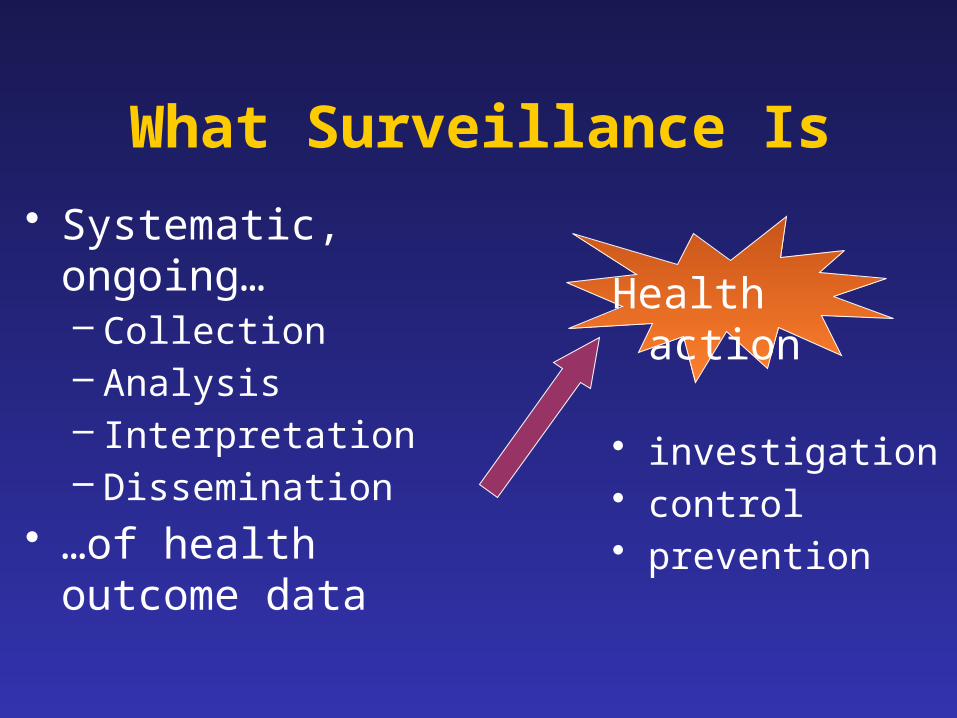
What Surveillance Is
• Systematic, ongoing…– Collection– Analysis– Interpretation– Dissemination
• …of health outcome data
Health action
• investigation• control• prevention

Surveillance History in U.S.• 1741 – Rhode Island passed an act requiring
tavern keepers to report contagious disease• 1850 – Mortality statistics first published by
the federal government for the U.S.• 1874 – Massachusetts instituted weekly
reporting of diseases by physicians• 1878 – Public Health Service (PHS)-type
organization created to collect morbidity data for use in quarantine for cholera, smallpox, plague, yellow fever.

Surveillance History in U.S.• 1901 – All states required disease reporting.• 1925 – All states began participating in
national morbidity reporting• 1935 – First national health survey• 1951 – Council of State and Territorial
Epidemiologists (CSTE) authorized to determine diseases to be reported to PHS
• 1961 – Morbidity and Mortality Weekly Report (MMWR) published
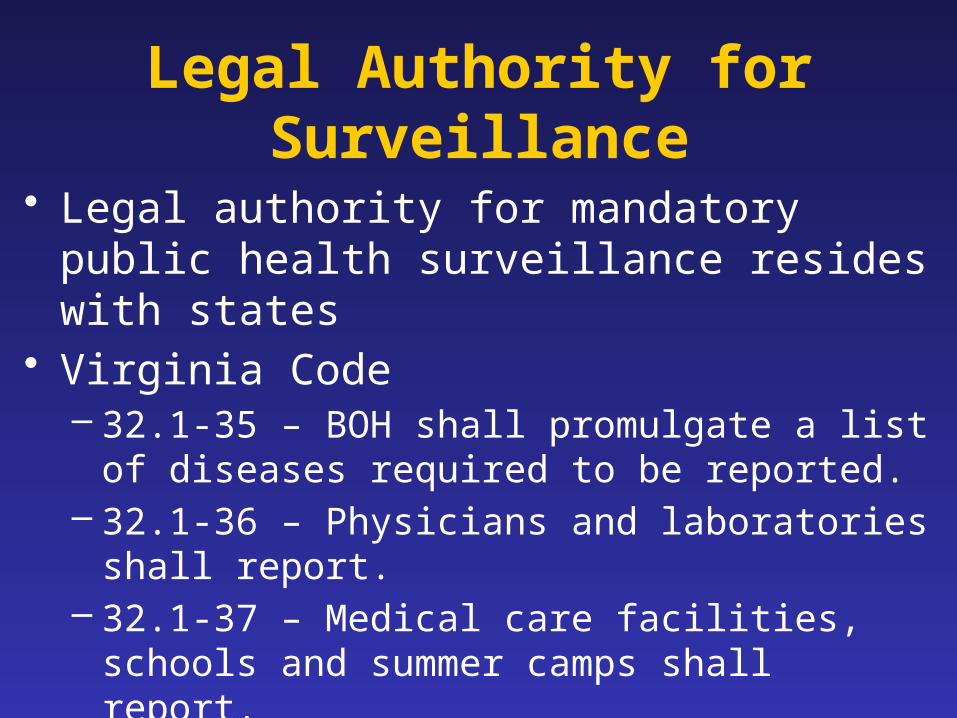
Legal Authority for Surveillance
• Legal authority for mandatory public health surveillance resides with states
• Virginia Code– 32.1-35 – BOH shall promulgate a list of diseases
required to be reported.– 32.1-36 – Physicians and laboratories shall report.– 32.1-37 – Medical care facilities, schools and summer
camps shall report.

Virginia Code, continued
– 32.1-38 – Anyone making a report is immune from liability
– 32.1-39 – BOH shall provide for surveillance & investigation.
– 32.1-40 – Commissioner or designee can examine medical records
– 32.1-41 – Anyone examining records must preserve anonymity of the patient and the practitioner

Purpose of Surveillance
• To assess public health status, to define public health priorities, to evaluate programs, and to stimulate research.– Tells us where the problems are, who is
affected, and where the programmatic and prevention activities should be directed.

How can surveillance data be used?
• Estimates of a health problem• Natural history of disease• Detection of epidemics• Distribution and spread of a health event
• Hypothesis testing• Evaluating control and prevention measures• Monitoring change• Detecting changes in health practice• Facilitate planning

Uses of Surveillance DataEstimates of a Health Problem
• Quantitative estimates of the magnitude of a health problem– including sudden or
long-term changes in trends, patterns

Uses of Surveillance DataNatural History of Disease
• Portrayal of the natural history of disease (clinical spectrum, epidemiology)
0
100
200
300
400
500
600
1 7 1 7 1 7 1 7 1 7 1 7 1 7 1 7 1 7 1 7
Ca
se
s
Varicella Cases by Month – Antelope Valley, CA, 1995–2004

Uses of Surveillance DataDetection of Epidemics
SALMONELLOSISIncidence,* by year
United States, 1973-2003
*Per 100,000 populationSlide from CDC 2003 Annual Summary

Uses of Surveillance Data Distribution & Spread of a Health Event
• West Nile Virus in the US, 2000-20032000 2001
2002 2003

Use of Surveillance DataHypothesis Testing
• Facilitation of epidemiologic and laboratory research– Hypothesis testing
PERTUSSISNumber of reported cases*, by age group
United States, 2003
*Of 11,647 cases, age was reported unknown for 46 (0.4%) cases.Slide from CDC – 2003 Annual Summary

Uses of Surveillance Data Evaluating control & prevention
measuresEffectiveness of vaccine introduction

Uses of Surveillance DataMonitoring changes
• Monitoring changes in infectious agents and host factors
National Nosocomial Infections Surveillance System

Uses of Surveillance DataDetecting Changes in Health Practice

Uses of Surveillance DataFacilitate Planning
• Identify target populations in need of health services– Refugee populations– Morbidity surveillance in emergency shelters
• Identify health topics to be addressed by educational programs and media

Outcomes• Surveillance is outcome oriented• Can measure frequency of an illness or
injury, severity of the condition, and impact of the condition.
• Number of cases, incidence, prevalence; case fatality, hospitalization rate, mortality, disability; cost.
• Orient data by person, place, and time.

Planning a Surveillance System
• Establish objectives • Develop case definitions• Determine data source or data collection
mechanism• Field test methods• Develop and test analytic approach• Develop dissemination mechanism• Assure use of analysis and interpretation

What Should be Under Surveillance?
• Establish priorities based on:– Frequency (incid., prev., mortality, YPLL)– Severity (case-fatality, hospitalization rate,
disability rate)– Cost (direct and indirect)– Preventability– Communicability– Public interest– Will the data be useful for public health action?
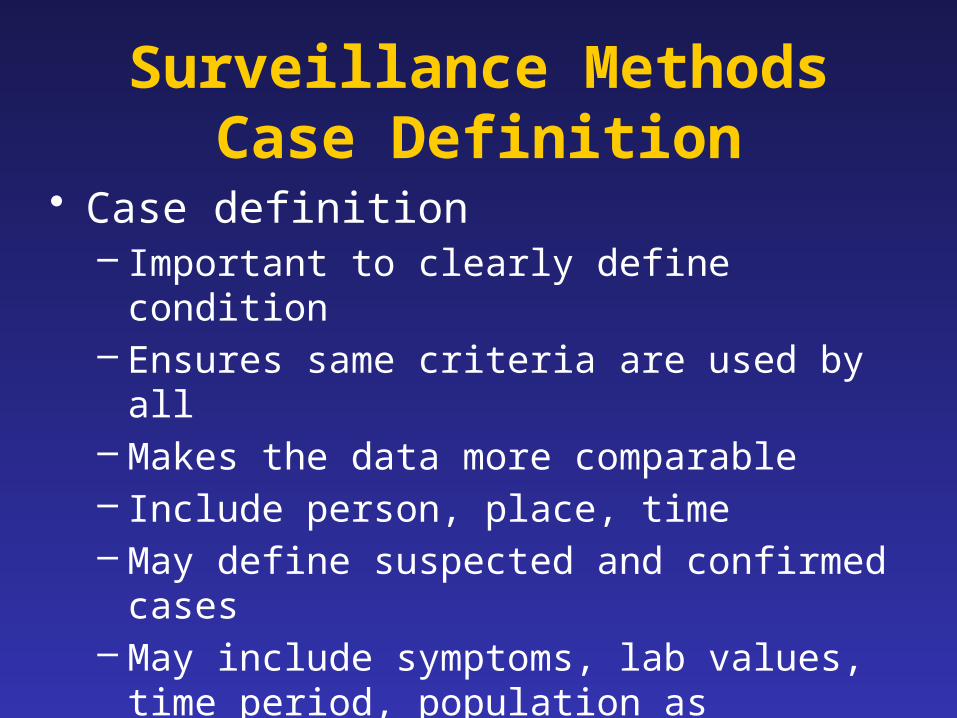
Surveillance MethodsCase Definition
• Case definition – Important to clearly define condition– Ensures same criteria are used by all– Makes the data more comparable– Include person, place, time– May define suspected and confirmed cases– May include symptoms, lab values, time period,
population as appropriate
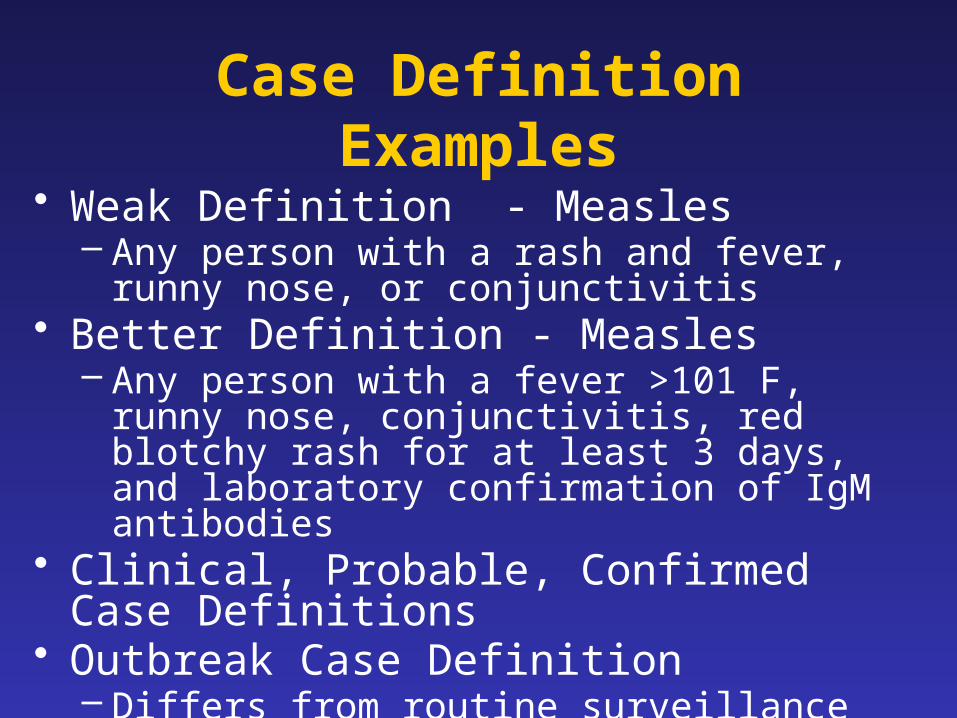
Case Definition Examples
• Weak Definition - Measles– Any person with a rash and fever, runny nose, or
conjunctivitis • Better Definition - Measles
– Any person with a fever >101 F, runny nose, conjunctivitis, red blotchy rash for at least 3 days, and laboratory confirmation of IgM antibodies
• Clinical, Probable, Confirmed Case Definitions• Outbreak Case Definition
– Differs from routine surveillance– Epidemiologically linked

Surveillance MethodsData Collection
• Data collection– Standardized instruments, field tested
• Passive Surveillance– Providers are responsible for reporting.– Health dept. waits to receive reports.– Problem with underreporting
• Active Surveillance– Providers contacted on regular basis to collect information– More resource intensive– Used for outbreaks or pilots (e.g., HUS)

Surveillance MethodsData Analysis
• Ongoing review• Descriptive statistics, Multivariate analyses• Automated analyses
Disease Number of cases
Tuberculosis 20
Gonorrhea 320

Surveillance MethodsInterpretation and Dissemination• Presentation of data in the form of tables,
graphs, maps, etc.• Disseminate data via reports, presentations,
internet, etc.

Surveillance Methods Evaluation
• Did the system generate needed answers to problems?
• Was the information timely?• Was it useful for planners, researchers, etc?• How was the information used?• Was it worth the effort?• What can be done to make it better?• (More on evaluation later).

Cycle of Surveillance• Data Collection
– Pertinent, regular, frequent, timely• Consolidation and Interpretation
– Orderly, descriptive, evaluative, timely• Dissemination
– Prompt, to all who need to know (data providers and action takers)
• Action to Control and Prevent• Evaluation

Data Sources• Vital Statistics• Notifiable Diseases• Registries• Sentinel Surveillance• Syndromic Surveillance• Surveys• Administrative Data

Data Sources: Vital Statistics
• Live Births• Deaths• Fetal Deaths• Marriages• Divorces• Induced Terminations of Pregnancy• Infant Mortality (link birth and death data)

Virginia Birth Certificate

Virginia Birth Certificate

Virginia Death Certificate
SAMPLE

Uses of Vital Statistics Data• Monitoring long-term trends• Identifying differences in health status
within racial or other population subgroups• Assessing differences by geographic area• Monitoring deaths that are preventable• Generating hypotheses about causation• Monitoring progress toward improved
health of the population; health-planning

Vital Records: Coding and Calculating
• ICD-9 historically, now ICD-10• Infant mortality - need number of live births
for denominator in calculating rates• Other death rates - use total population in
rate calculations.• Crude and adjusted (standardized) rates
used.

Vital Statistics Data

Quality of Vital Stats Depends on• Care taken by health care providers in
ascertaining cause of death and other factors
• Accuracy of coding (difficult for injuries)• Relevance of existing codes for the
condition being recorded• Accuracy of population estimates• Problems - don’t know onset, can’t see
effect of diseases that don’t lead to death

Data Sources: Notifiable Diseases• States decide what is notifiable/reportable
– Based on disease occurrence, potential for outbreaks, public perception of risk, etc.
– CSTE recommendations– Different processes for generating N.D. list
• Weekly (or sometimes rapid) reporting to health departments by physicians, medical care facilities, laboratories. – States report to CDC

Reportable Disease List
Over 70 reportable diseases/conditions

Epi-1 Form

Chain of Communication
Providers
Patients
Public
Local H.D.
Regional
Epis
Central Office
CDC
Other States
Other Health
Districts
State
Add this in 2009


363
348
250
90 84 89
38 3928 29
4026 7 4 1
0
50
100
150
200
250
300
350
400
Nu
mb
er o
f C
ases
10 - 14 15 - 19 20 - 24 25 - 44 45 & above
Ranges of Blood Lead Levels (µg/dL)
Number of Virginia Children Reported with Blood Lead Levels> 10 µg/dL, by Range of Elevation and Year, from 2005 to 2007
2005 Cases
2006 Cases
2007 Cases

Geographic Distribution of Human Arbovirus Cases Recorded in Virginia since 1975
Human ArbovirusInfections Since 1975
SLE (8 cases)*
LAC (29 cases)*
WNV (67 cases)*
EEE (5 cases)*
*Number of cases through 9/08
WNV = West Nile virusSLE = St. Louis encephalitis virus
LAC = La Crosse encephalitis virusEEE = Eastern equine encephalitis virus

STD and HIV Trends

Limitations of Disease Reporting
• Underreporting– Reporting better for more serious diseases and
those for which there is laboratory confirmation– Need to seek medical consultation to be
diagnosed and then reported
• Lack of representativeness of reported cases• Inconsistent case definitions

Reasons for Not Reporting• Assume someone else reported.• Did not know reporting was required; don’t
have a copy of the reportable disease list.• Do not know how to report; don’t have
form or telephone number.• Concern about confidentiality and doctor-
patient relationship.• No incentive to report. Time-consuming.
Unaware of value.

How to Improve Reporting• Contact physicians in the community
– Tell them the health department is very interested in morbidity reporting
• Maintain a reasonable list of reportable diseases
• Maximize contact through presentations, mailings, newsletters, media, etc.
• Use the data

Nonetheless...• The best system we have for communicable
disease morbidity• Information available quickly and from all
jurisdictions• Can detect outbreaks / changes in incidence• Allows disease control measures to be
implemented

Data Source: Registries• Information from multiple sources is linked
for each individual over time.– Diverse sources of information. E.g., hospitals
(sometimes >1), pathology, death certificates.
• Used for cancer, congenital anomalies, trauma, etc.
• Most are passive but resource intensive.• More lag in data availability due to
complexity of data collection process.

Populations Covered by Registries
• Hospital-based• Population-based• Exposure registries
– World Trade Center Health Registry– Three Mile Island

Example: Virginia Cancer Registry
• Methods prescribed by ACOS, NAACCR, Virginia regulations, CDC.
• Hospital registries are main source of data.• Voluntary reporting, 1970-1989• Mandatory reporting, 1990-present• Demographic, geographic, clinical data• Annual merge with vital records for
survival information.
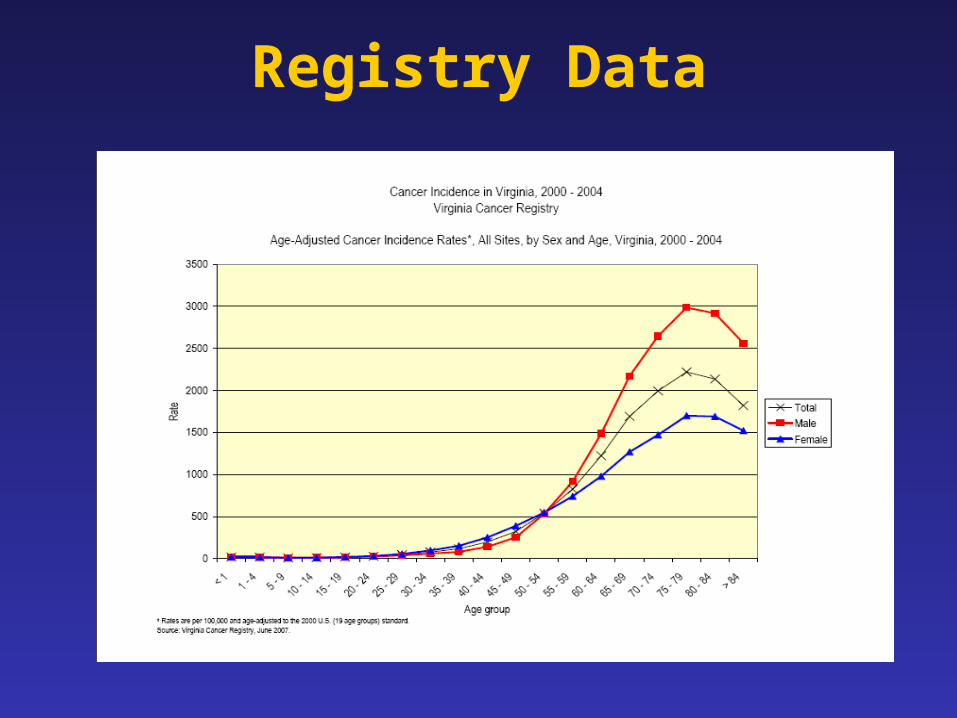
Registry Data

Electronic Surveillance
• National Electronic Disease Surveillance System (NEDSS)– A set of criteria developed by CDC that all public
health surveillance systems must meet– Virginia adopted CDC’s NEDSS Base System– Supported by EP&R funds
NEDSS• Shared secure web-based disease surveillance
database for Virginia– Eliminates delays in reporting– Improves communication about cases– Assists in earlier detection of events– Provides more data in electronic form for analysis
• All Virginia health departments connected by the end of 2006
• Includes electronic reporting from laboratories
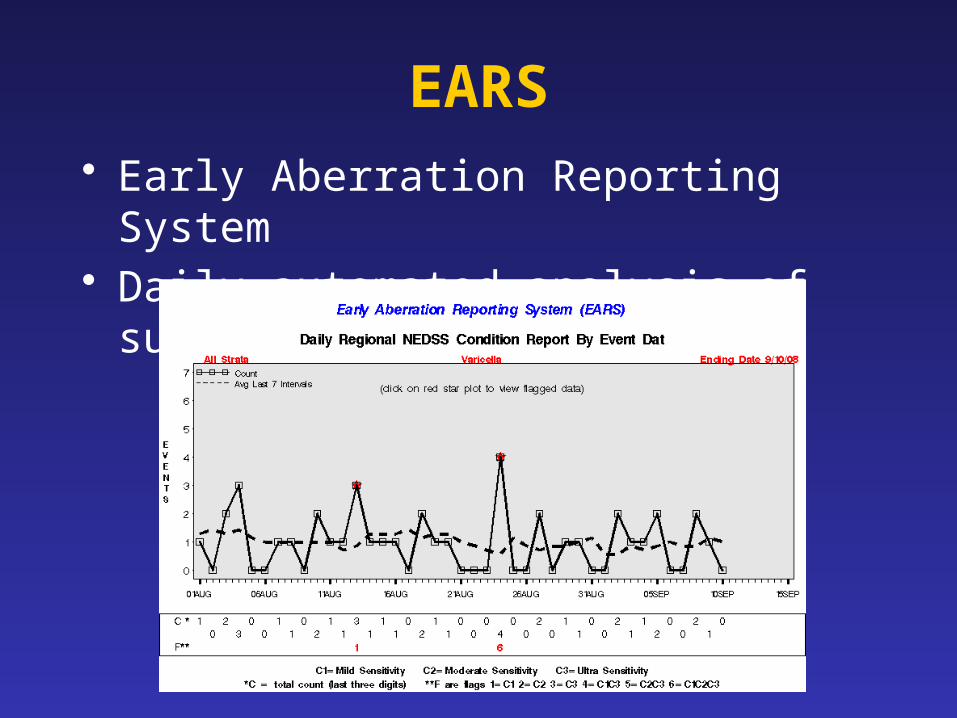
EARS• Early Aberration Reporting System• Daily automated analysis of surveillance data

Data Source: Sentinel Systems• To gather timely public health information
in a relatively inexpensive manner.• Cannot derive precise estimates of
prevalence or incidence in the population.• Sentinel Health Events• Sentinel Sites• Sentinel Providers

Sentinel Health Events• A condition whose occurrence serves as a
warning signal.• Particularly useful for occupational
exposures.• Silicosis, occupational asthma, pesticide
poisoning, lead poisoning, carpal tunnel syndrome.
• Cases trigger intervention activities.
Sentinel Sites or Providers• Surveillance at certain hospitals, clinics, or
physician practices.• Sentinel Sites - monitor conditions in
subgroups that may be more vulnerable– E.g., drug clinic, STD clinic, MCH clinic
• Sentinel Providers - monitor activity in ambulatory care settings.– For diseases that are not reportable– For influenza

Influenza Activity Monitoring with Sentinel Surveillance
• Sentinel site surveillance for influenza– Conducted year-round to detect emerging threats– Used to track flu season - Flu activity level usually
elevated Oct/Nov through April/May– Consider
• chief complaints from EDs
and Urgent Care Centers, • positive lab specimens, • outbreaks.

Syndromic Surveillance
• Uses pre-diagnostic indicators to identify emerging health problems
Onset of symptoms
Self medication
Medical consultation
Medical care
Laboratory testing
Diagnosis
Prescriptionfilled
Insurance billed

Automating Syndromic Surveillance
• Began as manual activity just after 9/11/01• Automated in 2004 with ESSENCE
– Electronic Surveillance System for the Early Notification of Community-Based Epidemics (Johns Hopkins University, Applied Physics Laboratory)
• Access limited to approved VDH staff• Collaborate with District of Columbia and
Maryland to monitor national capital region

ESSENCE
• Hospital emergency departments and urgent care centers electronically transmit chief complaints to secure VDH server every day
• System also includes:– Over the counter drug sales– Military claims– HMO claims– School attendance (being added)

Syndromes
• Complaints tallied into syndrome categories – Death– Sepsis (serious infection)– Rash– Respiratory (e.g., cough)– Gastrointestinal (e.g., diarrhea)– Unspecified Infection (fever)– Neurological (e.g., dizziness)– Other

ESSENCE
• Automated analyses identify unusual patterns and increases are investigated
Henrico Co - Unspecified Infection

Exposure Detection
• U.S. Postal Services’ BioHazard Detection System– Tests for anthrax in mail sorting area every hour– Selected Post Offices in Virginia – Response is collaborative
• Homeland Security/DOD BioWatch System– DC area, including northern Virginia– Central Virginia around Richmond– Eastern Virginia around military bases– Monitors for biologic agents atop buildings

Data Source: Surveys• If done continually or periodically, can
monitor risk factors and changes in prevalence over time
• Can also assess knowledge, attitudes• People usually queried only once and not
monitored on an individual basis after that• From questionnaires, interviews (in person
or telephone), or record review

National Surveys – www.cdc.gov/nchs
• National Health Interview Survey– Random selection of households– In home interview gathering information on all
in the household– Self-reported illnesses, chronic conditions,
injuries, impairments, use of health services– Civilian, non-institutionalized population
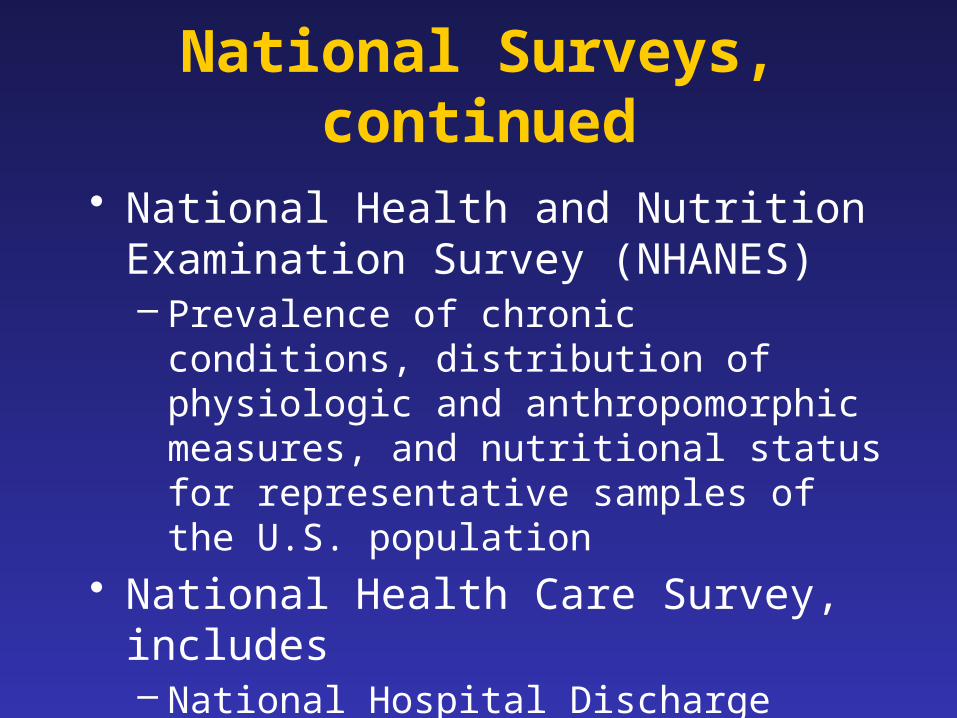
National Surveys, continued
• National Health and Nutrition Examination Survey (NHANES)– Prevalence of chronic conditions, distribution
of physiologic and anthropomorphic measures, and nutritional status for representative samples of the U.S. population
• National Health Care Survey, includes– National Hospital Discharge Survey– National Ambulatory Medical Care Survey

BRFSS• Behavioral Risk Factor Surveillance System
– Random digit telephone surveys on non-institutionalized adults’ health behavior and use of prevention services
– Height, weight, physical activity, smoking, alcohol use, seatbelt use, cholesterol screening, mammography, etc.
– Done in most states – CDC program

BRFSS Charts

Other Survey Examples
• Exit interviews at health facilities• Special studies
– Risk-behavior
• Cluster surveys– Rapid surveillance after emergencies

Data SourceAdministrative Data
• Routinely collected for other reasons.• E.g., hospital discharge data collected for
billing purposes, Medicaid and Medicare data, emergency department data, data collected in managed care organizations.
• Virginia Health Information (VHI) – our hospital discharge database

Cause of Injury DeathFrom Hospital Discharge Data
http://www.vahealth.org/CIVP/VOIRS/
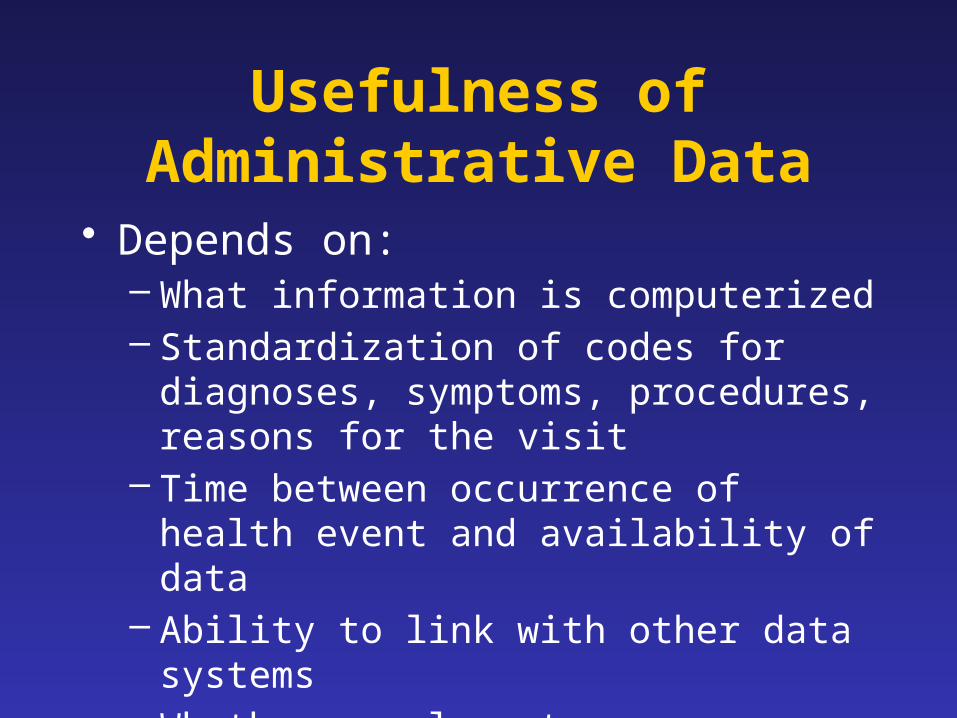
Usefulness of Administrative Data
• Depends on:– What information is computerized– Standardization of codes for diagnoses,
symptoms, procedures, reasons for the visit– Time between occurrence of health event and
availability of data– Ability to link with other data systems– Whether supplementary information can be
obtained.

Data Sources We Covered• Vital Statistics• Notifiable Diseases• Registries• Sentinel Surveillance• Syndromic Surveillance• Surveys• Administrative Data

Other Important Surveillance Systems
• Injury• Diabetes• Child/Adolescent Hospitalizations• Special temporary systems• Drug safety• Food Safety• Etc. – Public health collects a lot of
information on the health of our communities!

Analysis of Surveillance Data
• Descriptive epidemiology– Person, place, time
• Incidence and Prevalence– Rates -- crude, specific, standardized
• Trends and seasonality• Geographic clustering (maps)

Graphics used to describe data

Interpretation of Surveillance Data
• Limitations– Under-reporting– Biased reporting– Inconsistent case definitions
• Consider context– Seasonality– Recent policy changes

Interpretative Uses of Surveillance Data
• Identifying epidemics• Identifying new syndromes or risk groups• Monitoring trends• Evaluating public policy• Projecting future needs

Data Dissemination• What should be said? To whom? Through
what communication medium? How should the message be stated? What effect did the message create?
• Determine answers based on the purpose of the system.
• SOCO - single overriding communication objective. [What is new? Who is affected? What works best?]

Data Dissemination
MESSAGE
AUDIENCE
CHANNEL

Evaluating Surveillance Systems
• System objectives and usefulness– Actions taken as a result of the data.– Does the system do what it’s supposed to do?
• Operation of the system– who is reporting? to whom? what information
is collected? how is information stored? who analyzes the data? what are the findings? how often are reports disseminated? to whom? etc.
• Cost

Evaluation - System Attributes• Simplicity
– Should be as simple as possible and as easy to operate as possible.
• Flexibility– Should be able to adapt to changing needs.
• Acceptability– Willingness of individuals or organizations to
participate in the surveillance system. (Judge based on completeness, timeliness, reporting)

Evaluation - System Attributes• Sensitivity
– Proportion of cases detected by the system. Completeness of reporting. Detect epidemics?
– Increased awareness, new diagnostic test, change in surveillance method may impact.
• Predictive Value Positive– Proportion of persons identified as having the
disease who actually have it.

Sensitivity/Specificity and Predictive Value +/-
Condition Present Yes No Detected by Surveill
Yes True positive (A)
False positive (B)
A+B
No False negative (C)
True negative (D)
C+D
A+C B+D
Sensit.= Specif.=
A/A+C D/B+D
PVP= PVN=
A/A+B D/C+D
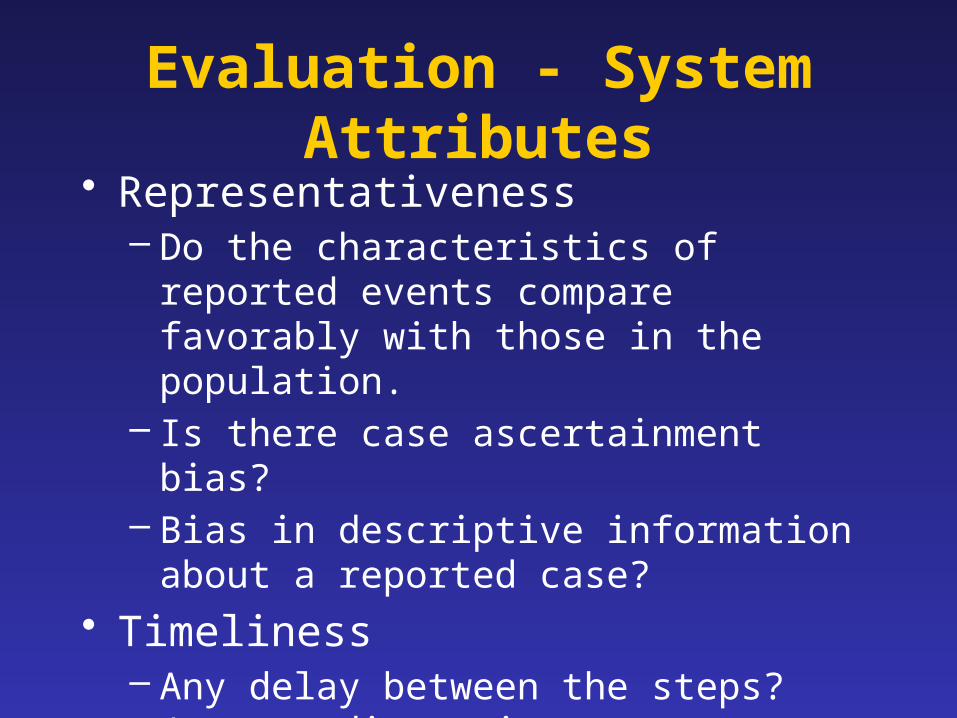
Evaluation - System Attributes• Representativeness
– Do the characteristics of reported events compare favorably with those in the population.
– Is there case ascertainment bias?– Bias in descriptive information about a reported
case?
• Timeliness– Any delay between the steps? (onset, diagnosis,
report to public health, disease control actions)

Ethical and Legal Issues Relating to Surveillance
• Professional obligations• Protecting confidentiality and privacy• Informed consent
– Mandated activity vs. Research
• Maintaining public trust• Right of Access

ILI Surveillance
• 57 emergency departments and 24 urgent care facilities currently provide chief complaint data that are used to identify visits for influenza-like illness.
Percent of Visits for ILI out of All Visits by Age Group in Virginia 2008-2009 Influenza Season
0.0
1.0
2.0
3.0
4.0
5.0
6.0
7.0
8.0
9.0
10/4
/200
8
10/1
8/20
08
11/1
/200
8
11/1
5/20
08
11/2
9/20
08
12/1
3/20
08
12/2
7/20
08
1/10
/200
9
1/24
/200
9
2/7/
2009
2/21
/200
9
3/7/
2009
3/21
/200
9
4/4/
2009
4/18
/200
9
5/2/
2009
5/16
/200
9
5/30
/200
9
6/13
/200
9
6/27
/200
9
7/11
/200
9
7/25
/200
9
8/8/
2009
8/22
/200
9
week ending date
perc
ent
of v
isits
for
ILI
0-4 5-24 25-49 50-64 65+ All Ages

Hospitalizations
• Of the EDs providing chief complaint data, 40 provide data that identify hospital admissions from the ED.
Admissions from Emergency Department Visits, Virginia, 2008-2009*
0.0
2.0
4.0
6.0
8.0
10.0
12.0
14.0
16.0
MMWR Week
Per
cent
ILI
2008
2009

Deaths
• Death certificates that mention flu or pneumonia are tracked by week, locality, age group
• Pediatric flu-associated deaths – each case reported and information collected
• Insufficient data available to graph
• Usually have 2-3 per flu season in Virginia

Outbreaks
• Report to public health– More illness than expected in a group setting
• Investigation includes assessment of the situation, recommendations to limit disease spread, and/or laboratory confirmation
• Track by area, type of setting, etc.

Passive Reporting
• Based on regulatory requirement• Physicians report number of cases of flu
diagnosed each week, by type (A or B), if available
• Labs report cases confirmed by PCR, culture, or DFA– Not rapid tests

School Absenteeism
• Schools working with health department to send data
• Daily enrollment and absences in students and teachers/staff
Average Daily Absenteeism by Public School Type and Region,
Week Ending August 22, 2009
0
1
2
3
4
5
6
7
8
9
10
Northern Northwest Central Eastern Southwest
Region
Perc
ent A
bsen
t Elementary
Middle
High
Other

School Closures
• Decisions to close are made in consultation with the health department
• Schools have been instructed to enter closures into CDC web site
• CDC web site sends message to CDC and VDH

Sentinel Lab Surveillance
• Sentinel physicians – one per district (35), test one patient per month
• Sentinel EDs – one per district, test one patient per month
• Sentinel hospitals – one per region (5), test five inpatients per month
• Purpose is surveillance for circulating strains

Positive Laboratory Isolates and ILI Reports by Week in Virginia,2008-2009 Influenza Season
0
20
40
60
80
100
120
week
# po
sitiv
e la
bs
0.0
0.5
1.0
1.5
2.0
2.5
3.0
3.5
4.0
4.5
5.0
per
cen
t IL
I
2009 H1N1
A/H3
A/H1, Seasonal
A/Unknown
B
ILI Activity

Weekly Flu Activity Level
• None• Sporadic• Local• Regional• Widespread

Contact Information
Diane Woolard, PhD MPH
Director, Division of Surveillance & Investigation
(804) 864-8141
Lesliann Helmus, MS
Surveillance Chief
(804) 864-8141
Lesliann.helmus@
vdh.virginia.gov


