PUBLIC HEALTH management corporation TEMPLE UNIVERSITY HEALTH SYSTEM COMMUNITY HEALTH NEEDS ASSESSMENT PREPARED FOR: TEMPLE UNIVERSITY HOSPITAL PREPARED BY: PUBLIC HEALTH MANAGEMENT CORPORATION 260 SOUTH BROAD STREET, 18 TH FLOOR PHILADELPHIA, PA 19102 APRIL 2013
Transcript
PUBLIC HEALTH management corporation
TEMPLE UNIVERSITY HEALTH SYSTEM
COMMUNITY HEALTH NEEDS ASSESSMENT
PREPARED FOR:
TEMPLE UNIVERSITY HOSPITAL
PREPARED BY:
PUBLIC HEALTH MANAGEMENT CORPORATION 260 SOUTH BROAD STREET, 18TH
FLOOR PHILADELPHIA, PA 19102
APRIL 2013
The Research and Evaluation Group
PUBLIC HEALTH management corporation
TABLE OF CONTENTS
I. INTRODUCTION ................................................................................................................................. 1 ABOUT TEMPLE UNIVERSITY HOSPITAL…………………………………………………………………………………………………1 PURPOSE AND METHODOLOGY ................................................................................................................ 2 COMMUNITY DEFINITION ....................................................................................................................... 6 COMMUNITY DEMOGRAPHICS ................................................................................................................ 8 EXISTING HEALTH CARE RESOURCES ...................................................................................................... 12 II. NEEDS ASSESSMENT PROCESS AND METHODS ................................................................................... 13 DATA ACQUISITION AND ANALYSIS ........................................................................................................ 13 COMMUNITY REPRESENTATIVES ............................................................................................................ 15 INFORMATION GAPS ........................................................................................................................... 15 III. FINDINGS ..................................................................................................................................... 16 HEALTH NEEDS OF THE COMMUNITY ..................................................................................................... 16 HEALTH NEEDS OF SPECIAL POPULATIONS .............................................................................................. 37 EXAMINATION OF SPECIAL DATA SETS .................................................................................................... 38 IV. UNMET COMMUNITY HEALTH NEEDS .............................................................................................. 40 UNMET NEEDS AND IDENTIFICATION PROCESS......................................................................................... 40 APPENDICES APPENDIX A: COMMUNITY MEETING ATTENDEES APPENDIX B: CENSUS TABLES APPENDIX C: VITAL STATISTICS TABLES APPENDIX D: HOUSEHOLD HEALTH SURVEY TABLES APPENDIX E: ASSET MAPS APPENDIX F: ADDITIONAL DATA SETS
The Research and Evaluation Group
PUBLIC HEALTH management corporation
1
I. INTRODUCTION
ABOUT TEMPLE UNIVERSITY HOSPITAL
Temple University Hospital was founded in 1892 as “Samaritan Hospital,” with the mission of caring for patients with limited incomes and ensuring access to medical care in its surrounding neighborhoods. Today, Temple University Hospital is a 714-bed non-profit acute care hospital that provides a comprehensive range of medical services to its North Philadelphia neighborhoods, as well as a broad spectrum of secondary, tertiary, and quaternary care to patients throughout Southeastern Pennsylvania. As the chief clinical training site for the Temple University School of Medicine, Temple University Hospital plays a critical role serving the healthcare needs of some of the Commonwealth’s most vulnerable communities. Last year, Temple University Hospital discharged 28,000 patients, registered 324,000 outpatients, and cared for 125,000 emergency department visitors. Temple University Hospital is the only Level I Trauma Center in Southeast Pennsylvania with an adult burn unit. Its Episcopal Campus, which houses all of our behavioral health services, handles more than 10,000 Crisis Response Center visits annually. Temple University Hospital is an indispensible provider of health care in the largest American city without a public hospital. About 85% of its patients are covered by government programs, including about 31% by Medicare and 53% by Medicaid. Among Pennsylvania’s full-service safety-net providers, Temple University Hospital serves the greatest volume and highest percentage of Medicaid patients. Temple’s obstetrical services delivers about 3,500 infants annually, of which Medicaid covers nearly 90%. Temple University Hospital is located in a federally designated Medically Underserved Area. Its Episcopal Campus is also located in a Federal Empowerment Zone. About 83% of the population in Temple’s service area is African American, Latino or other minorities. While Temple University Hospital serves patients from throughout the region, about 37% of families with children in Temple’s primary service area live below the federal poverty level. Temple University Hospital is a member of the Temple University Health System, which also includes Jeanes Hospital and the Hospital of the Fox Chase Cancer Center. Temple University Hospital is staffed by 400 employed physicians of the Temple University School of Medicine’s practice plan. Temple University Physicians represents 17 academic departments including subspecialties in emergency medicine, family practice and pediatrics, cardiology, gastroenterology, oncology, obstetrics and gynecology, orthopedics, neurosurgery, neurology, general and specialty surgery, and psychiatry. All Temple physicians care for patients covered by Medicaid in both the inpatient and outpatient settings.
The Research and Evaluation Group
PUBLIC HEALTH management corporation
2
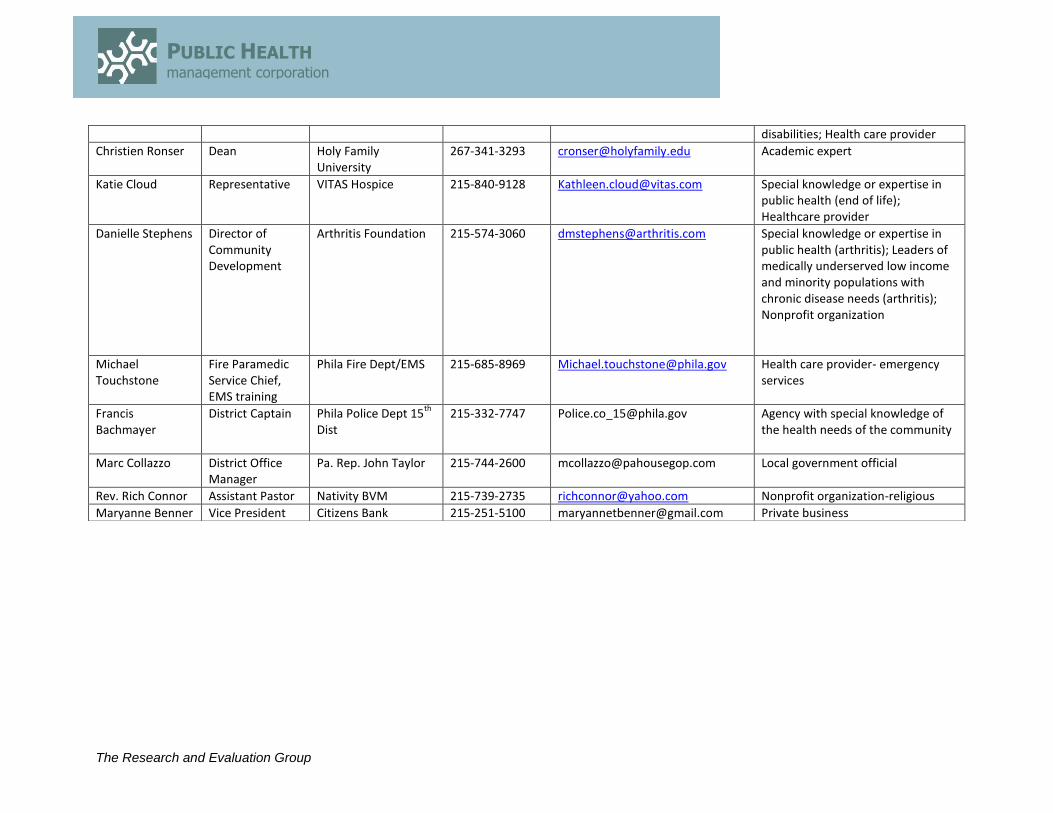
PURPOSE AND METHODOLOGY This report summarizes the results of an assessment of the health status and health care needs of residents of the Temple University Hospital service area. The needs assessment was conducted by Public Health Management Corporation, a private non-profit public health institute. The purpose of the needs assessment is to identify and prioritize community health needs so that the hospital can develop strategies and implementation plans that benefit the public as well as satisfy the requirements of the Affordable Care Act. This introduction includes a definition of the community assessed in the report, the demographic and socioeconomic characteristics of the residents, and the existing health care resources followed by II. Needs Assessment Process and Methods; III. Findings; and IV. Unmet Community Health Needs. Tables, maps, and a list of community members who participated in the needs assessment are included in the Appendices. Quantitative information from the U.S. Census, Pennsylvania Department of Health vital statistics, and the Southeastern Pennsylvania Household Health Survey was analyzed for the hospital’s service area using the Statistical Program for Social Sciences (SPSS). Frequency distributions were produced for variables for multiple years of data so trends over time could be identified and described. The unmet health care needs for this service area were identified and prioritized by comparing the health status, access to care, health behaviors, and utilization of services for residents of the service area to results for the county and state and the Healthy People 2020 goals for the nation. In addition, for Household Health Survey measures, tests of significance were conducted to identify and prioritize unmet needs. PHMC also collaborated with the participating hospitals to identify individuals living and/or working in the communities in the hospitals’ service areas who could provide input to the needs assessment as community members, public health experts, and as leaders or persons with knowledge of underserved racial minorities, low income residents, and/or the chronically ill. (For a list of the names, titles, organizations, and area of expertise of community meeting participants, see Appendix A). The participating hospitals and PHMC worked together to obtain meeting venues, contact potential participants, and encourage attendance. Meeting participants were not compensated. Input from the community meeting participants, including county and local health department officials and public health experts, was used to further identify and prioritize unmet needs, local problems with access to care, and populations with special health care needs. Qualitative information from the community meetings was analyzed by identifying and coding themes common to participants, and also themes that were unique. The resulting analysis was organized into major topic areas related to health status, access to care, special population needs, unmet needs, and health care priorities. PUBLIC HEALTH MANAGEMENT CORPORATION QUALIFICATIONS
Public Health Management Corporation (PHMC) is a 501(c)(3) non-profit corporation that was founded
in 1972 to address problems in the organization and delivery of health and social services. PHMC is a
nonprofit public health institute that creates and sustains healthier communities and envisions a healthy
The Research and Evaluation Group
PUBLIC HEALTH management corporation
3
community for all. PHMC uses best practices to improve community health through direct service,
partnership, innovation, policy, research, technical assistance, and a prepared workforce. PHMC’s Research and Evaluation Group (REG) was uniquely qualified to provide comprehensive CHNA services to DVHC’s not-for-profit member hospitals and facilities. It is the only public health institute in Pennsylvania, has many years’ experience collaborating with health care stakeholders, and can facilitate the participation of these diverse groups as required by the ACA. PHMC staff are public health experts who have conducted many CHNAs over the past twenty years for hospitals, health departments, foundations, and other non-profits. A list of community and population assessments PHMC has completed includes:
o Philadelphia Health Care Trust Needs Assessment, 2011 o School District of Philadelphia Head Start Needs Assessment, 2010 o Jewish Federation of Greater Philadelphia Older Adult Needs Assessment, 2010 o Main Line Area Older Adults Needs Assessment, 2010 o William Penn Foundation Youth Development Initiative Population Studies, 2006, 2008, 2010 o National Nursing Centers Consortium Northeast Philadelphia Needs Assessment, 2009 o Latino Youth Needs Assessment, 2009 o National Children’s Study Montgomery County Vanguard Center Needs Assessment, 2008 o Planned Parenthood of Bucks County LGBTQ Needs Assessment, 2007 o Project HOME North Philadelphia Needs Assessment, 2006 o Children’s Hospital of Philadelphia Early Head Start Needs Assessment, 2003 and 2006 o Philadelphia Corporation for Aging Older Adults Needs Assessment, 2004 o North Penn (Montco) Community Health Special Populations Needs Assessment, 2003 o North Penn (Montco) Community Health Needs Assessment, 2002 o Brandywine Health Foundation Community Needs Assessment, 2002 o Philadelphia Chinatown Health Needs Assessment, 2001 o Philadelphia Latino Community Health Needs Assessment, 2001 o Burlington County, NJ Homeless Veterans Needs Assessment, 2001 o Phoenixville Community Health Foundation Special Populations Needs Assessment, 2000 o American Red Cross (SEPA Chapter) Needs and Impact Assessments, 1999 o Berwick, Pennsylvania Community Health Needs Assessment, 1999 o East Parkside Needs Assessment, 1999 o Phoenixville Community Health Foundation Needs Assessment, 1999 o City of Philadelphia Office of Housing and Community Development Elderly Housing Needs
Assessment, 1997 o Presbyterian Foundation Assisted Living Assessment of West Philadelphia, 1997 o Five County (NJ) Elderly Health Needs Assessment, 1997 o Suburban Camden County Health Needs Assessment, 1997 o Bucks County Community Health Needs Assessment - Quantitative Analysis, 1994; Update, 1997 o Cumberland, Gloucester, and Salem Counties Health Needs Assessments, 1996 o Presbyterian Foundation Assisted Living Assessment of South and North Philadelphia, 1996 o Montgomery County Health Department Maternal and Child Health Needs Assessment -
quantitative data analysis, 1996 o Haddington Area Needs Assessment, 1996
The Research and Evaluation Group
PUBLIC HEALTH management corporation
4
o Partnership for Community Health in the Lehigh Valley - implementation phase, 1996 o Delaware Valley Health Care Council Regional Health Profile, 1996 o City of Camden Needs Assessment, 1996 o Paoli Memorial Hospital Needs Assessment, 1994 o Northeast Philadelphia Partnership for a Healthier Community - qualitative data analysis, 1994 o Misericordia Hospital Community Health Needs Assessment - 1993 o Crozer-Keystone Health System, Delaware County Needs Assessment - quantitative data
analysis, 1993 o Chester County Title V Maternal and Child Health Needs Assessment - 1993 o Chester County Maternal and Child Health Consortium Needs Assessment 1993 o Bucks County Title V Maternal and Child Health Needs Assessment - 1993
PHMC’s CHNA qualifications also include the Southeastern Pennsylvania Community Health Data Base (www.CHDBdata.org), which provides an unmatched set of information on local community health needs that can be used to develop focused findings supported by reliable data. These data can also be used in developing priorities and rationales for strategic plans that are ACA compliant.
The biennial SEPA Household Health Survey collects information on more than 13,000 residents (children, adults, and seniors) living in the five-county SEPA region. The survey is the longest running community health survey in the United States, as well as the largest regional surveys of its kind. REG staff Francine Axler and Lisa R. Kleiner are the co-directors of the community health needs assessment.
Francine Axler, Senior Research Associate. Since 1989, Francine has been actively involved in the field of public health and health promotion, specifically in the collection and dissemination of health status, health behaviors, and utilization of health services data for residents of Southeastern Pennsylvania. Francine is particularly focused on teaching health and human service providers how to utilize community level health data to develop needed, effective and targeted health promotion programs for vulnerable populations. Francine directs PHMC’s Community Health Data Base. She has a degree in sociology and a graduate degree in public health education.
Lisa Kleiner, Senior Research Associate. For the past twenty-five years, Lisa has worked on a broad range of evaluation, research, and technical assistance projects. Lisa has conducted and coordinated over 25 population and community needs assessments focusing on older adults, racial/cultural minorities, persons with behavioral health needs, homeless families, maternal and child health and other at-risk groups and communities. In addition to this expertise, Lisa has provided training and technical assistance to over 200 organizations to enable them to build their capacity to define and measure program outcomes and impact, tailoring the technical assistance to the specific needs of the organization and staff. Lisa has a law degree and a graduate degree in social work. Collaborative Process In February 2011, Delaware Valley Healthcare Council of HAP (DVHC), the membership association for hospitals in the five-county region of southeastern Pennsylvania, established a Community Health Needs Assessment Workgroup to assist hospitals in:
Understanding Affordable Care Act (ACA) requirements and Internal Revenue Service guidance around community health needs assessments.
The Research and Evaluation Group
PUBLIC HEALTH management corporation
5
Identifying the best resources, tools, and services for conducting needs assessments.
The Workgroup consisted of representatives from the following collaborating hospitals, health systems, and organizations:
Collaborating Organizations
Abington Health
Aria Health
Bucks County Health Improvement Partnership
The Children's Hospital of Philadelphia
Crozer-Keystone Health System
Einstein Healthcare Network
Holy Redeemer
Jefferson Health System
Magee Rehabilitation Hospital
Main Line Health
Mercy Health System of SEPA
Penn Medicine (UPHS)
St. Mary Medical Center
Temple University Health System
The 24-member workgroup included representatives from 13 hospitals and health systems representing 35 (70 percent) of 48 DVHC-member not-for-profit hospital facilities in Bucks, Chester, Delaware, Montgomery, and Philadelphia Counties. The group held a series of meetings to review ACA requirements with policy experts from the American Hospital Association and consider the types of resources that might be needed to conduct needs assessments. Under the workgroup’s guidance, DVHC developed a scope of work to define the research services and other resources which hospitals might need to assist them in conducting community health needs assessments. Based on the scope of work, DVHC issued a request for proposal to identify highly qualified research partners who could support hospitals in conducting needs assessments. After a rigorous evaluation process that included extensive input from workgroup members, Public Health Management Corporation (PHMC) was selected as the most appropriate research partner. PHMC’s selection was due in part to their Community Health Data Base’s in-depth, zip-code-level health information for the five-county region. In addition, many hospitals are familiar with this resource and are or have been database subscribers. With direction and guidance from the workgroup, DVHC and PHMC then collaborated to develop the overall approach to conducting needs assessments for hospitals wishing to participate in the program. Twenty-seven DVHC member facilities participated in the program, as listed below.
The Research and Evaluation Group
PUBLIC HEALTH management corporation
6
Abington Memorial Hospital
Lansdale Hospital
The Children's Hospital of Philadelphia
Crozer-Chester Medical Center
Delaware County Memorial Hospital
Springfield Hospital
Taylor Hospital
Doylestown Hospital
Eagleville Hospital
Einstein Medical Center Philadelphia
Einstein Medical Center Elkins Park
Einstein Medical Center Montgomery
MossRehab
Belmont Behavioral Health Center for Comprehensive Treatment
Grand View Hospital
Holy Redeemer Hospital
Mercy Fitzgerald Hospital
Mercy Philadelphia Hospital
Mercy Suburban Hospital
Nazareth Hospital
St. Mary Medical Center
Temple University Hospital
Jeanes Hospital
Fox Chase Cancer Center
Episcopal Hospital
Hospital of the University of Pennsylvania
Pennsylvania Hospital
Penn Presbyterian Medical Center
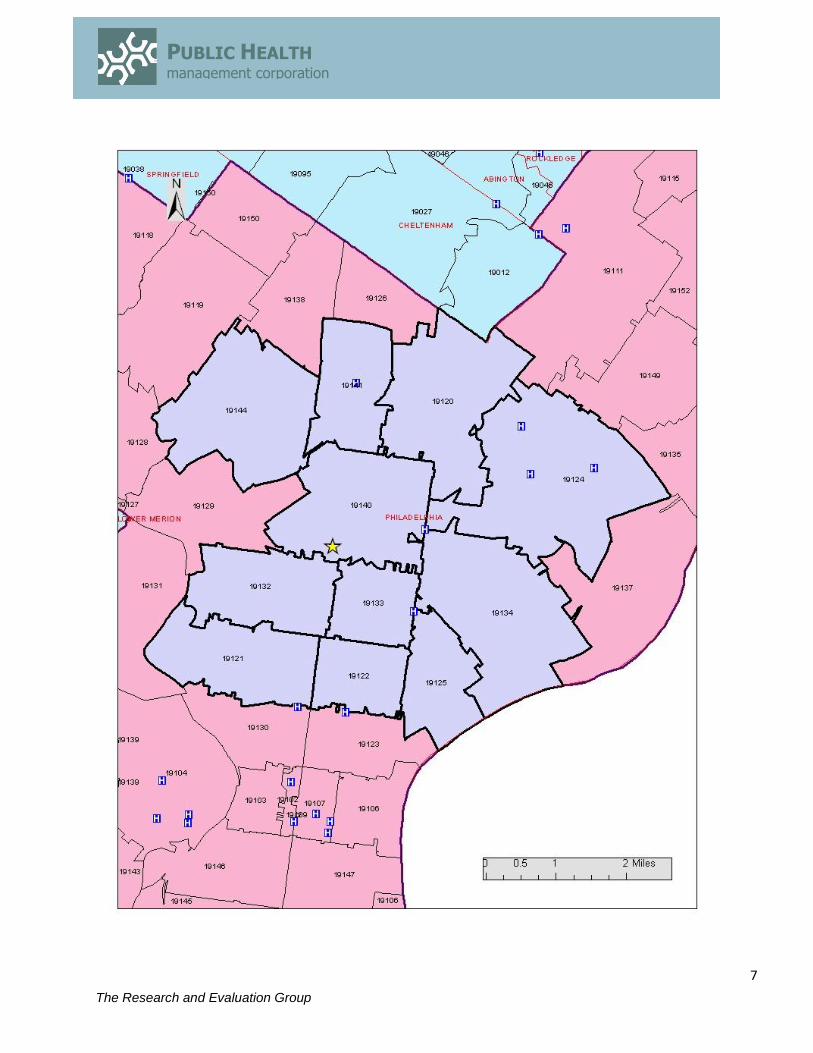
COMMUNITY DEFINITION Temple University Hospital is located in Philadelphia County. The hospital’s primary service area, from which 75% of discharged patients reside, (2010 Pop. 469,000 residents in 2010) was defined as the community for the purposes of this assessment. The Temple University Hospital service area includes the following ZIP codes:
COMMUNITY DEMOGRAPHICS This report includes a description of demographic and socioeconomic characteristics of the residents of Temple University Hospital’s service area, as these characteristics are strong indicators of access to health care and good health. Please see Appendix B for all Census data and tables. Population Size The total population of Temple University Hospital’s service area decreased to approximately 469,000 residents in 2010 from 476,800 residents in 2000.
The population of the service area is estimated to increase, closer to the 2000 population count, in 2013 (to 475,600 residents) and again in 2018 (485,000 residents).
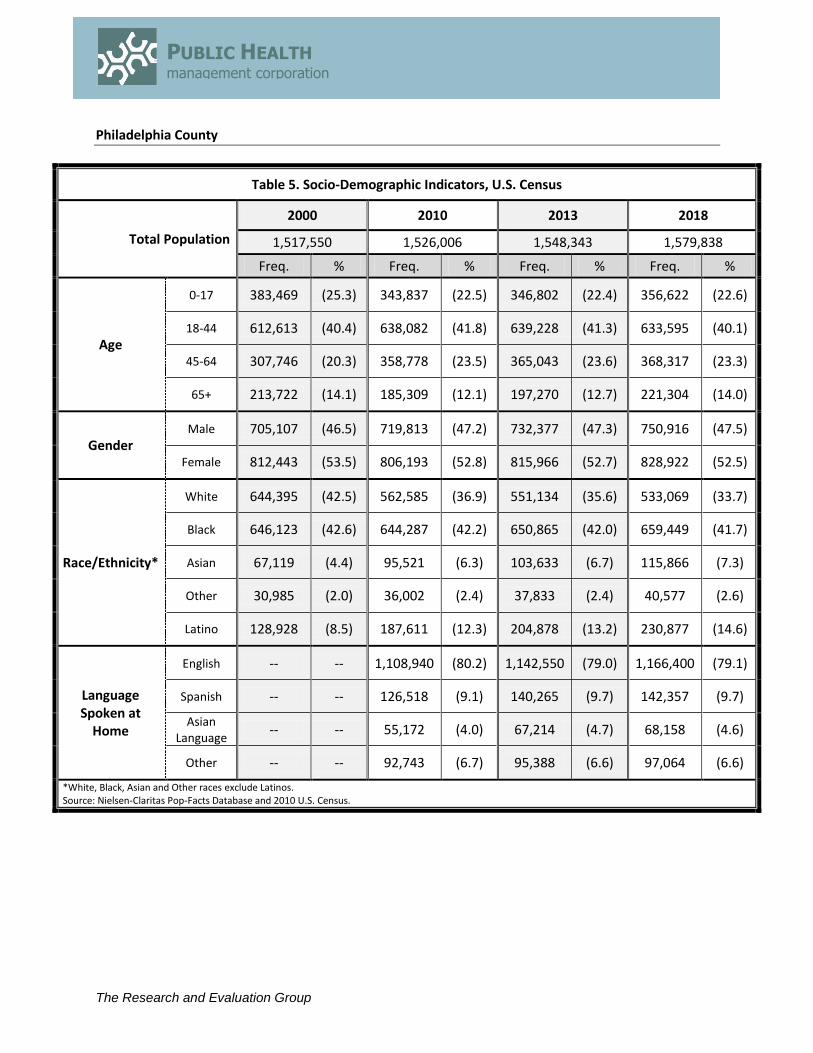
Demographic Characteristics Age In Temple University Hospital’s service area, more than one-quarter of residents are between the ages of 0-17 (28%), more than four in ten are 18-44 (41%), nearly one-quarter are 45-64 (23%), and 9% are 65 or older.
When comparing to 2000, the service area saw a decrease in the percentage of residents ages 0-17 and an increase in the percentage of those ages 45-64.
When comparing to Philadelphia County, the service area has a higher percentage of those ages 0-17 and a lower percentage of those ages 65 or older.
In comparison to the state as a whole, the service area has a higher percentage of younger adults (those ages 0-17 and 18-44).
Gender Approximately 46% of Temple University Hospital’s service area is male and 54% is female; these percentages are projected to remain static through 2018 and are comparable to the gender breakdown of Philadelphia County.
Pennsylvania has a slightly higher percentage of male residents compared to the service area and Philadelphia County.
Race/Ethnicity In Temple University Hospital’s service area, more than half of residents identify as Black (51%), 17% identify as White, one-quarter identify as Latino (25%), 4% identify as Asian, and 2% identify as an “other” race/ethnicity.
The service area saw some changes in the racial/ethnic identity of its population from 2000 with an increasing percentage of Latino residents. (Figure 1)
In comparison to Philadelphia County, the service area has higher percentages of Black residents and Latino residents, and a lower percentage of White residents.
In addition, the service area has substantially higher percentages of Black and Latino residents when compared to the state as a whole.
The Research and Evaluation Group
PUBLIC HEALTH management corporation
9
Latino Origin When looking at Latino origin, service area residents most commonly identify as Puerto Rican (20%), followed by residents of an “other” Latino origin (4%), Mexican and Cuban residents (1% or less).
The percentages of Puerto Rican residents and those who identify as an “other” Latino origin are estimated to continue to increase slightly through 2018.
The service area has a substantially higher percentage of Puerto Rican residents when compared to Philadelphia County and Pennsylvania overall.
Asian Origin In Temple University Hospital’s service area, approximately 4% of residents identify as Asian.
Service area residents most commonly identified as Vietnamese (1%), Chinese (.7%), and Indian and Cambodian (both .5%).
When comparing to the county, there is not much variation; however, looking at the state, the service area has higher percentages of Cambodian and Vietnamese residents.
Language Spoken at Home Nearly three-quarters of residents in Temple University Hospital’s service area speak English at home (73%), one-fifth speak Spanish (20%), 4% speak an Asian language, and 4% speak an “other” language.
More residents in the service area speak Spanish at home when compared to Philadelphia County and to the state as a whole.
23%
51%
4% 2%
20% 17%
52%
4% 2%
25%
0%
20%
40%
60%
80%
100%
White Black Asian Other Latino
Source: Nielsen-Claritas Pop-Facts Database and 2010 U.S. Census.
Figure 1. Race/Ethnicity, 2000 and 2010
2000 2010
The Research and Evaluation Group
PUBLIC HEALTH management corporation
10
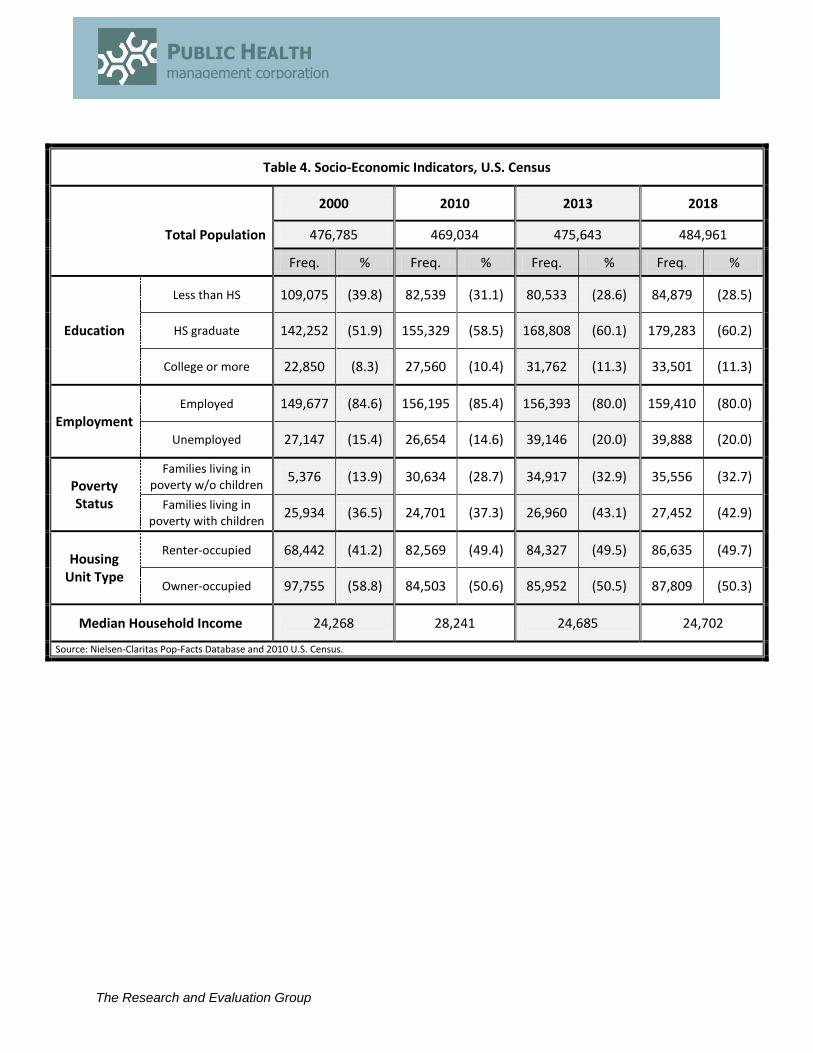
Socioeconomic Indicators Education In Temple University Hospital’s service area, three in ten residents have less than a high school degree (31%), six in ten have graduated from high school (59%), and one-tenth have a college degree or more.
The service area saw some improvement in educational attainment from 2000. (Figure 2)
The service area has a higher percentage of residents with less than a high school degree and a lower percentage of those with a college degree or more compared to Philadelphia County.
Similarly, when compared to the state, the service area has a higher percentage of those with less than a high school degree and lower percentages of those who have a high school degree or a college degree or more.
Employment Approximately 85% of Temple University Hospital’s service area residents are employed and 15% are unemployed.
The percentage of those who are unemployed is estimated to increase to 20% in 2013.
In comparison to Philadelphia County and the state, the service area has a higher percentage of unemployed residents.
Poverty Status When looking at poverty status, nearly three in ten families without children (29%) and more than one-third of families with children (37%) are living in poverty in Temple University Hospital’s service area.
40%
52%
8%
31%
59%
10%
0%
20%
40%
60%
80%
100%
Less than HS Degree HS Graduate College Graduate or More
Source: Nielsen-Claritas Pop-Facts Database and 2010 U.S. Census.
Figure 2. Educational Attainment, 2000 and 2010
2000 2010
The Research and Evaluation Group
PUBLIC HEALTH management corporation
11
The percentage of families without children living in poverty more than doubled from 2000.
Both the percentages of families with children and without children living in poverty are estimated to increase in 2013.
The service area has a higher percentage of families who are living in poverty (both families with and without children) when compared to Philadelphia County and Pennsylvania overall.
Median Household Income The 2000 median household income in Temple University Hospital’s service area was approximately $24,700, which increased to around $28,200 in 2010.
Although 2010 saw an increase in the median household income, this number is estimated to drop again in 2013.
The median household income in the service area is substantially lower than that of Philadelphia County and the state. (Figure 3)
Home Ownership In Temple University Hospital’s service area, nearly half of residents rent their home (49%) and just more than half own their home (51%).
The percentage of residents who rent their home increased from 41% in 2000.
Also, the percentage of residents who rent their home in the service area is slightly higher than that of Philadelphia County and substantially higher than that of the state as a whole.
$24,300 $28,200
$24,700 $24,700 $31,000
$37,500 $34,300 $34,400
$41,400
$49,300 $51,100 $53,600
$-
$20,000
$40,000
$60,000
$80,000
$100,000
2000 2010 2013 Estimate 2018 Estimate
Source: Nielsen-Claritas Pop-Facts Database and 2010 U.S. Census.
Figure 3. Median Household Income, 2000 and 2010 Counts, 2013 and 2018 Estimates
Temple University Hospital Philadelphia County Pennsylvania
The Research and Evaluation Group
PUBLIC HEALTH management corporation
12
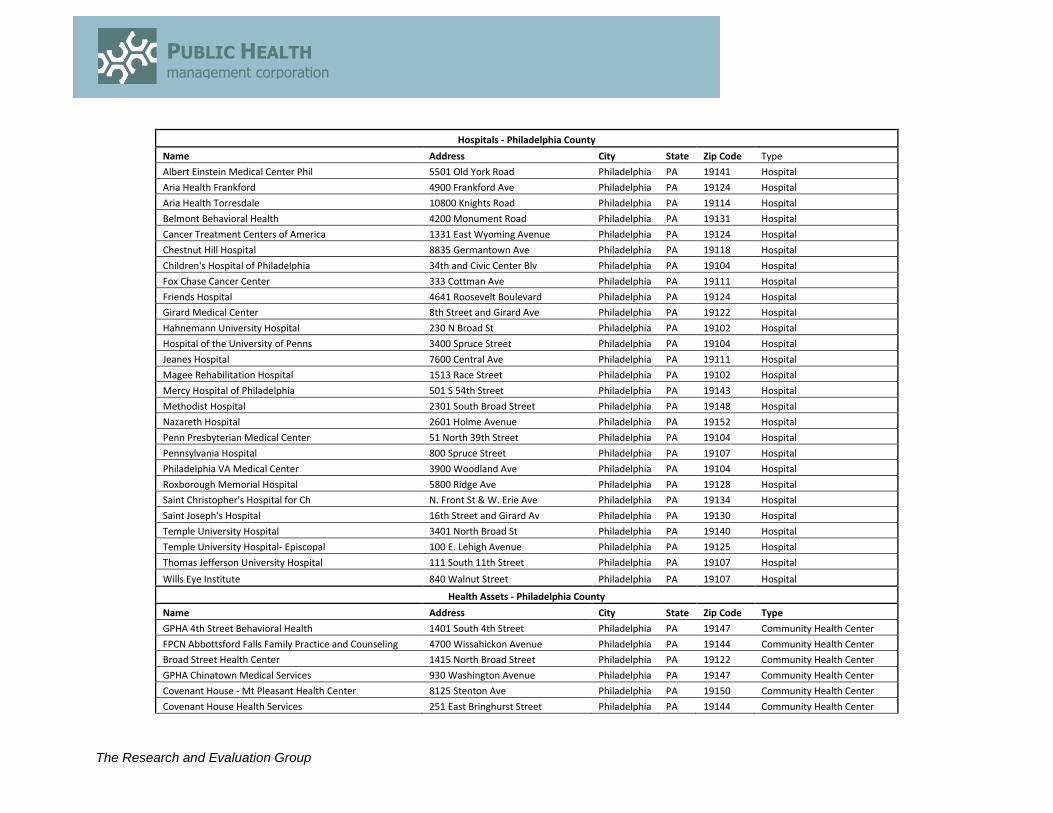
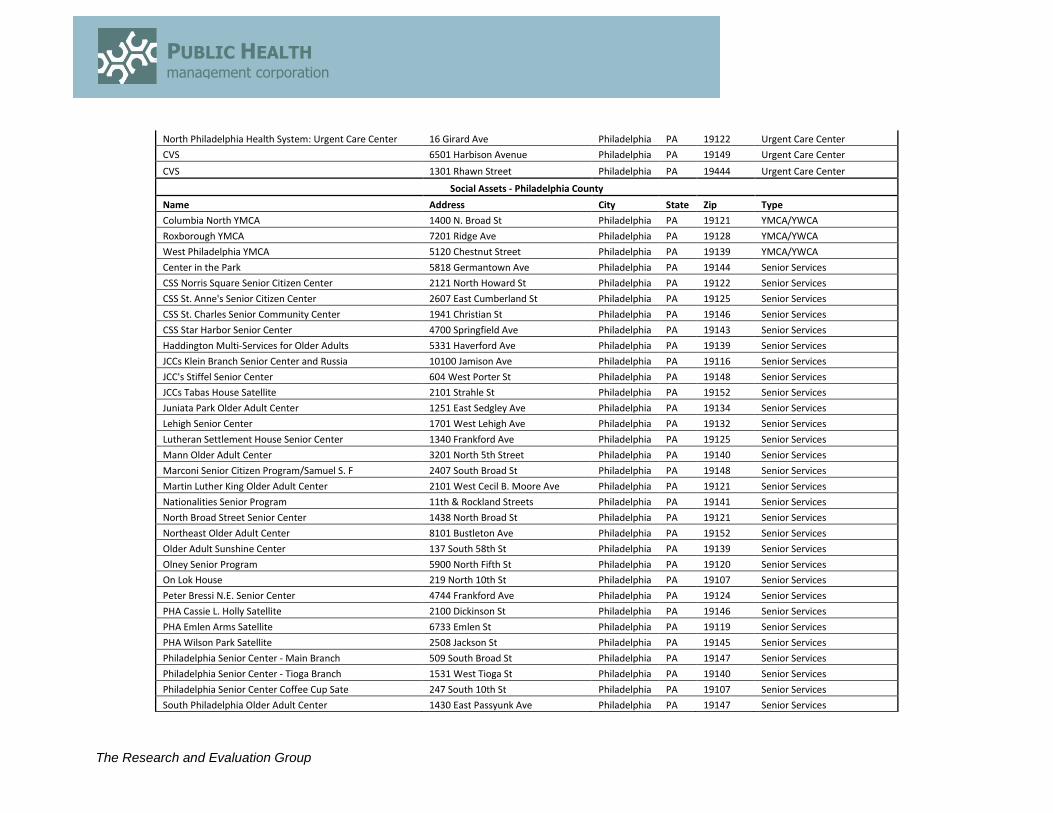
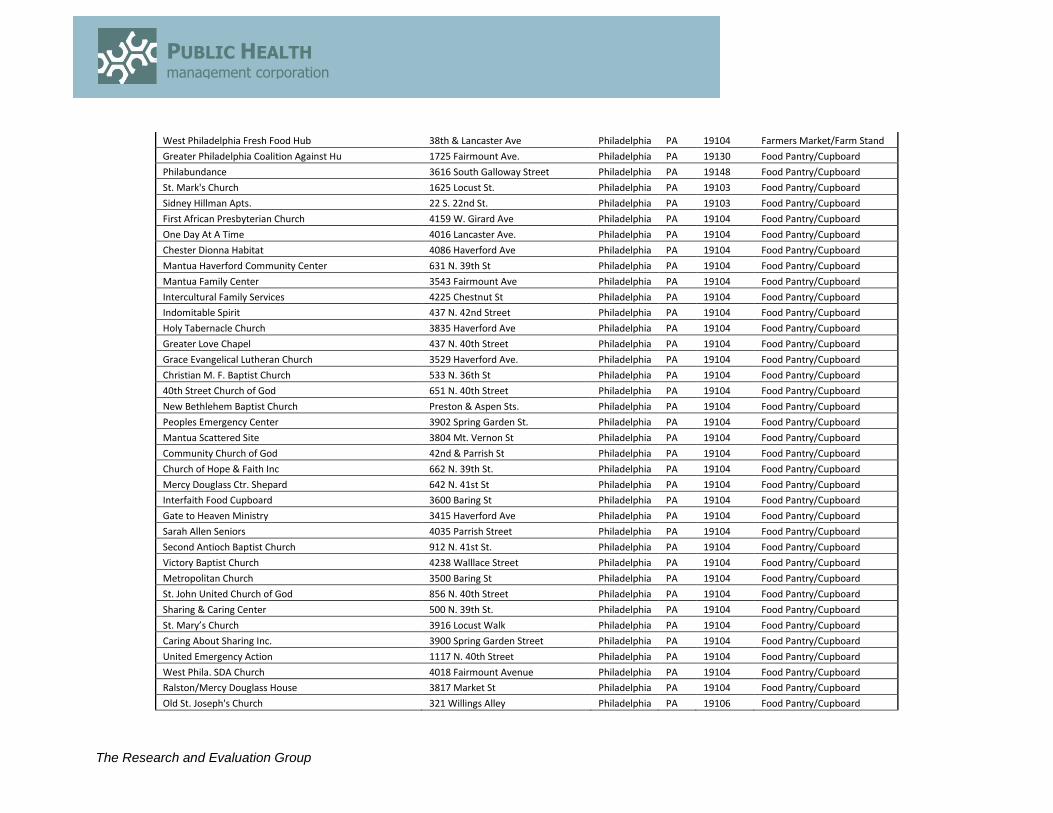
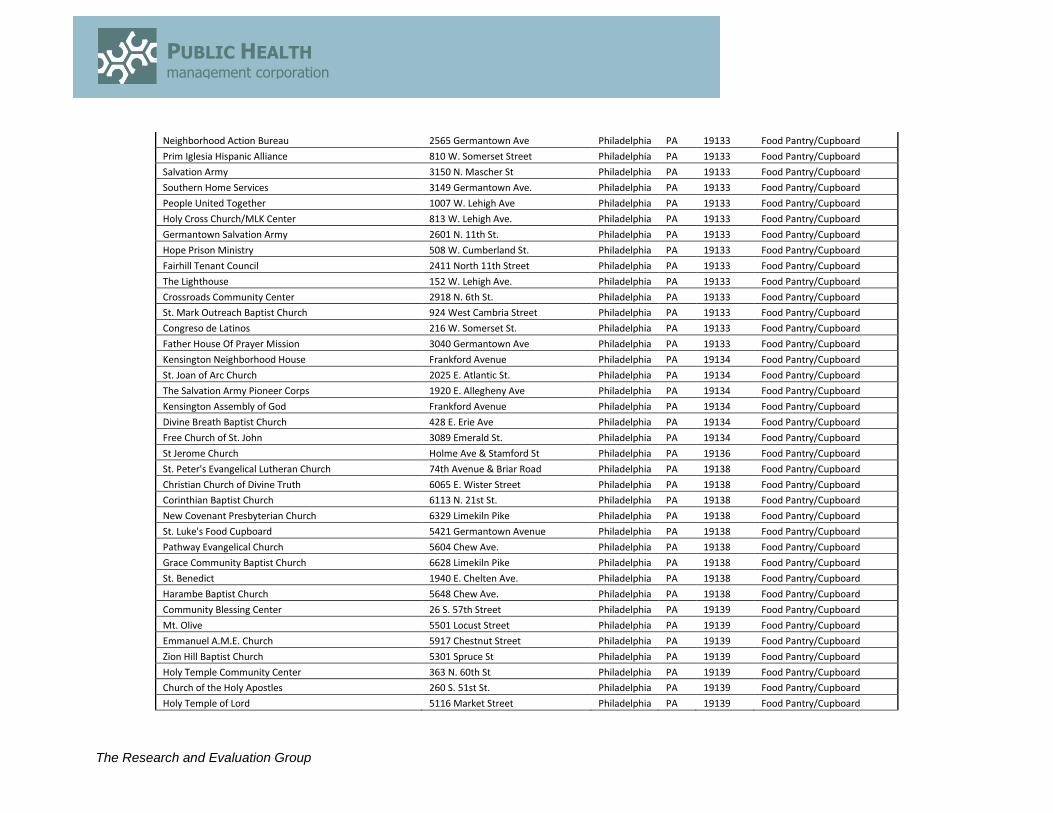
EXISTING HEALTH CARE RESOURCES The existing health and social services in the service area, and for Southeastern Pennsylvania as a whole, were inventoried for this report. Information on health and social services was obtained by internet searches and from the Yellow Pages. Health services included: acute care general hospitals; inpatient psychiatric hospitals and long-term psychiatric facilities; and rehabilitation hospitals. Skilled and intermediate care nursing facilities were not included. Health services also included community health centers and clinics, urgent care centers, and state, city, and county health department service locations. Existing social services which were inventoried included: food pantries, WIC centers, farmer’s markets, and soup kitchens; community outpatient mental health and mental retardation services; senior services; social work services; homeless and domestic violence shelters; and YMCA’s. These existing health care and social service resources are shown on the Temple University Hospital service area maps in Appendix E. Maps of health care and social service resources are also included for Philadelphia County in Appendix E.
The Research and Evaluation Group
PUBLIC HEALTH management corporation
13
II. NEEDS ASSESSMENT PROCESS AND METHODS The steps in the needs assessment process were: defining the community; identifying existing primary and secondary data and data needs; collecting primary and secondary data; analyzing data; and preparing a written narrative report. The data acquisition and analysis are described in more detail below.
DATA ACQUISITION AND ANALYSIS Both primary and secondary and quantitative and qualitative data were obtained and analyzed for this needs assessment. Obtaining information from multiple sources, known as triangulation, helps provide context for information and allows researchers to identify results which are consistent across more than one data source. Data Sources and Dates Quantitative information for this needs assessment was obtained from sources listed below for the most recent years available. Community Health Needs Assessment Data Sources
Data Source Dates
U.S. Census of Population and Housing 2000, 2010
Claritas, Inc. Pop-Facts 2013, 2018
Pennsylvania Department of Health 2005-2008
PHMC Southeastern Pennsylvania Household Health Survey
2010, 2012
PHMC Southeastern Pennsylvania Household Health Survey The 2012 Southeastern Pennsylvania Household Health Survey questionnaire examines health status, utilization of and access to health care among adults and children in the five county area including Bucks, Chester, Delaware, Montgomery and Philadelphia counties. The survey includes many questions which have been administered and tested in national and local health surveys, including items from instruments developed by the following organizations: the National Center for Health Statistics (NCHS) for the National Health Interview Survey (NHIS), The Behavioral Risk Factor Surveillance System (BRFSS), The California Women’s Health Survey, The Social Capital Community Benchmark Survey (Kennedy School of Government, Harvard University) and The Survey on Childhood Obesity (Kaiser Family Foundation/San Jose Mercury News). The 2012 Household Health Survey was conducted through telephone interviews with people 18 years of age and older living in 10,018 households in Southeastern Pennsylvania. All telephone households within Bucks, Chester, Delaware, Montgomery and Philadelphia counties were eligible to be selected for the sample, as were cell phone users. Households in each of the five counties were selected to guarantee representation from all geographic areas and from all population subgroups. When needed, the interviews were conducted in Spanish. A total of 1,338 interviews were conducted with adults
The Research and Evaluation Group
PUBLIC HEALTH management corporation
14
residing in the service area, including 247 adults age 65 and over and 242 households with a selected child under the age of 18. The 2012 Southeastern Pennsylvania Household Health Survey was administered for PHMC by Social Science Research Solutions, Inc. (SSRS), a research firm in Media, Pennsylvania, between May and September 2012. All interviews were administered by telephone. Most households (8,009 total) were contacted on home phones (“landlines”) using a computerized Random Digit Dialing (RDD) methodology so that households with unpublished numbers and residents who had recently moved would be included in the sample. A total of 2,009 cell phone interviews were conducted with adults in the five county area. Cell phone respondents received the same survey questionnaire as landline respondents. The sample for this study was drawn from all telephone households in the five counties. The final sample of interviews is representative of the population in each of the five counties so that the results can be generalized to the populations of these counties. Within each selected household, the Last Birthday Method was used to select the adult respondent for the interview (with the exception of the cell phone sample). In households with more than one eligible adult, the adult who last had a birthday was selected as the adult respondent. In households with children, the person under age 18 who most recently had a birthday was selected for the child interview. The survey incorporates over-samples of people ages 60-74 and 75 and older to provide a sufficient number of interviews for separate analyses of the responses of people in these subgroups. U.S. Census This report includes data on the population of Temple University Hospital’s service area residents, Philadelphia County residents, and residents of the state, along with along with socio-demographic and socioeconomic characteristics for the years 2000, 2010, 2013 and 2018. Data from the 2000 U.S. Census, the 2010 American Community Survey, and the Nielsen-Claritas Pop-Facts Database were also used. The Nielsen-Claritas Pop-Facts Database uses an internal methodology to calculate and project socio-demographic and socioeconomic characteristics for non-census years, relying on the U.S. Census, the Current Population Survey, and the American Community Survey. Vital Statistics
The most recent information on births, birth outcomes, deaths, and reportable diseases and conditions for residents of the hospital service area and Philadelphia County was obtained from the Pennsylvania Department of Health, Bureau of Health Statistics and Research. Four year (2005-2008) annualized average rates for natality and mortality were calculated by PHMC. Mortality rates were age-adjusted using the Direct Method and the 2000 U.S. standard million population. The most recent (2010) morbidity information was also obtained from the state Department of Health, and rates were calculated by PHMC. Morbidity information, including information on HIV and AIDS cases, is not available at the ZIP code level and, therefore, rates are presented for the county only. The denominators for all 2005-2008 vital statistics rates for the county and state were interpolated from the 2000 and 2010 U.S. Census. The number of women ages 15-44 and the number of adolescents ages 10-17 were also interpolated from the 2000 and 2010 US Census.
The Research and Evaluation Group
PUBLIC HEALTH management corporation
15
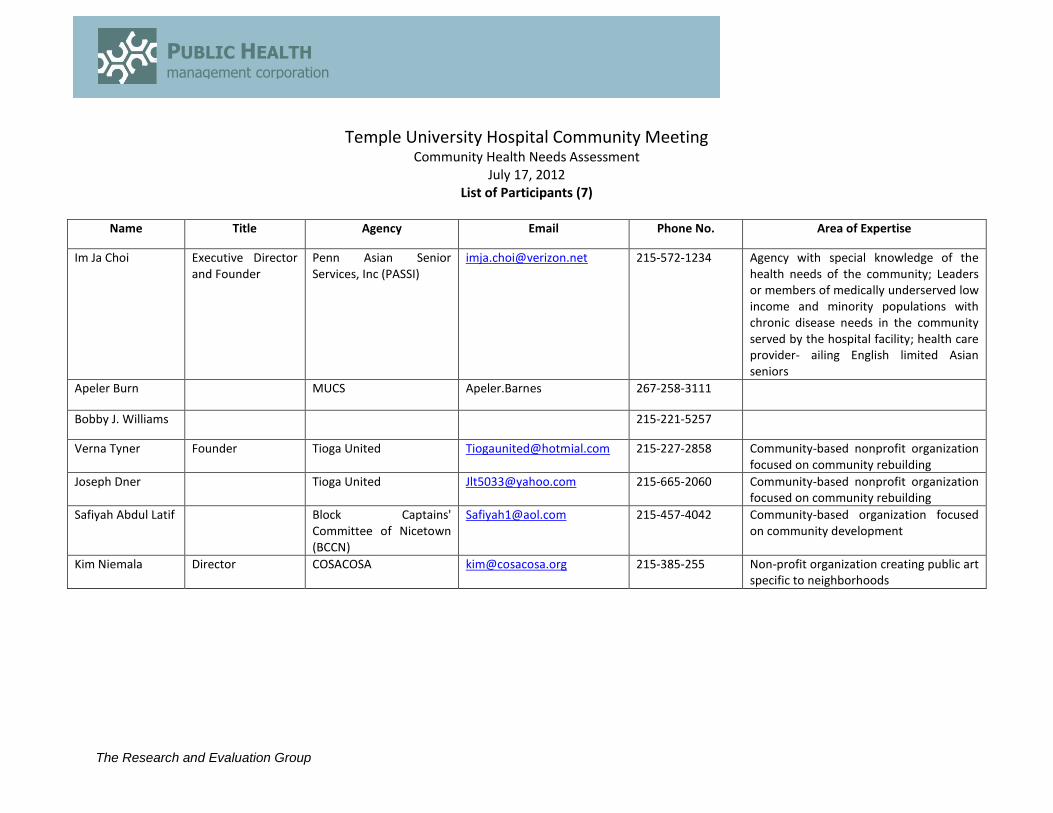
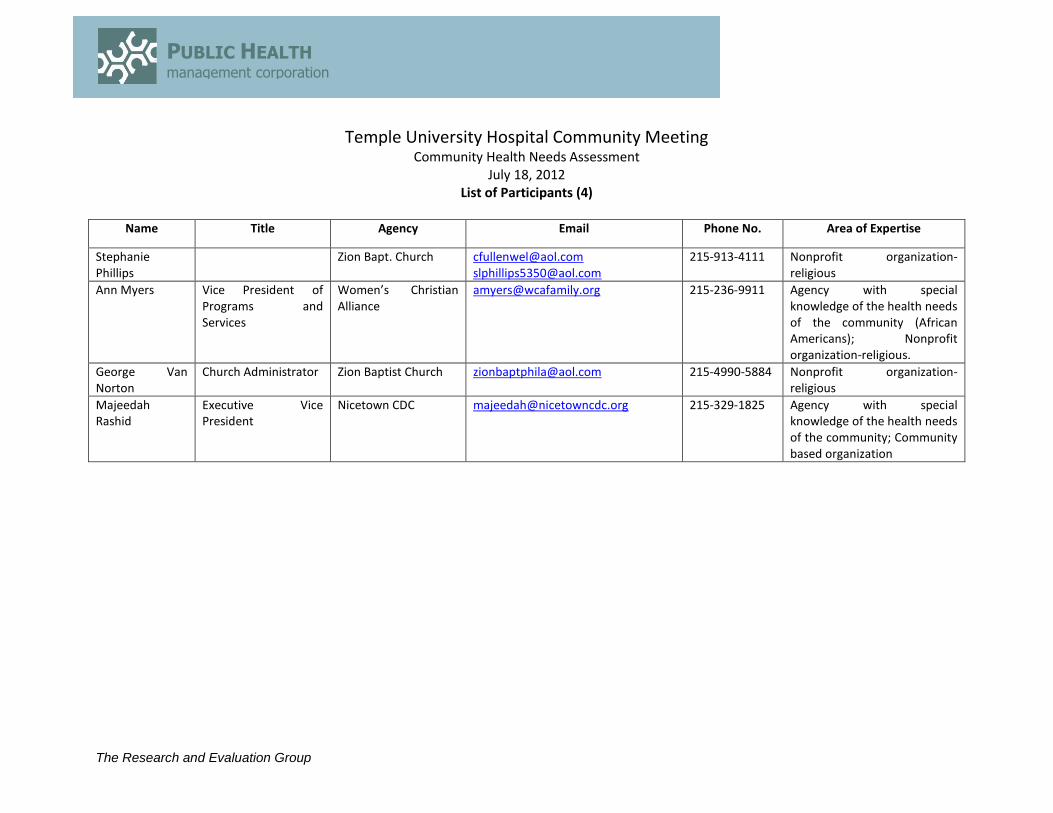
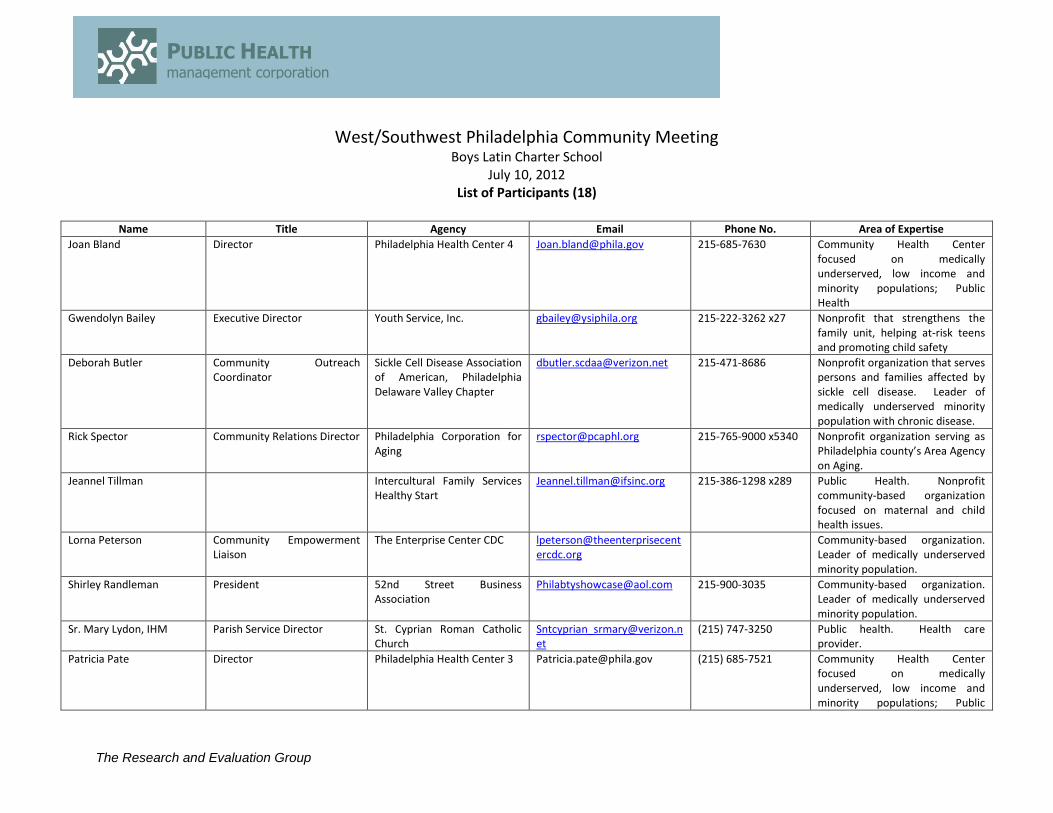
COMMUNITY REPRESENTATIVES Information on the health status and health care needs of the residents of Temple University Hospital’s service area was also collected through community meetings with residents, public health representatives, service providers, and advocates knowledgeable about community health. The meetings were guided by a set of written questions. Three meetings were held; two at Temple University Hospital on June 17 and June 18, 2012 and one at its Episcopal Campus on June 16, 2012. Community leaders, providers, public health representatives, and residents participated. In addition to the meetings held at Temple University Hospital facilities, information on the health status and health needs were obtained by PHMC at four additional meetings held in Philadelphia County. These meetings were held in:
- Center City (PHMC) on July 24, 2012; - West/Southwest Philadelphia (Boys Latin Charter School) on July 10, 2012; - Northeast Philadelphia (Holy Family University) on May 30, 2012; and - Northwest Philadelphia (the York House) on June 26, 2012.
(For complete lists of participant names and agencies from all community meetings, please see Appendix A).
INFORMATION GAPS Quantitative information for socioeconomic and demographic information, vital statistics, and health was available at the ZIP code cluster level for the service area. To fill potential gaps in information, these data were supplemented by detailed information about the service area obtained from community meetings. The next section, III. Findings, summarizes the results of the needs assessment process.
The Research and Evaluation Group
PUBLIC HEALTH management corporation
16
III. FINDINGS
HEALTH NEEDS OF THE COMMUNITY Health Status The health of a community can be assessed by comparing birth outcomes, self-reported health status and health conditions, communicable disease rates, self-reported health concerns and perceptions, and mortality rates to statewide indicators and Healthy People 2020 goals for the nation. Birth Rate There is an average of 8,600 births annually to women in Temple University Hospital’s service area (See Appendix C for the Vital Statistics Tables).
The birth rate in the service area (82.9 per 1,000 women 15-44 years of age) is higher than the Philadelphia County rate (71.1) and the Pennsylvania rate (58.7) (Figure 4).
Within the service area, Latina women have the highest birth rate (106.0), while White women have the lowest birth rate (48.2). In general, the racial and ethnic birth rate patterns are higher in the service area compared with Philadelphia County and the state.
Teenage pregnancy has been associated with a number of negative birth outcomes, including prematurity and low birth weight, making it an important outcome to track.
In the service area, the adolescent birth rate is 22.7 per 1,000 women 10-17 years of age, which is higher than the Philadelphia County rate (17.1) and three times higher than the state rate (6.9) (Figure 4).
Within the service area, the adolescent birth rate is highest for Latina women (31.7) and lowest for White women (8.7). The racial and ethnic adolescent birth rate patterns are generally higher in the service area compared with the county and the state.
The Research and Evaluation Group
PUBLIC HEALTH management corporation
17
Low Birth Weight Low birth weight infants (<2,500 grams or 5lbs 8 ozs.) are at greater risk for dying within the first year of life than infants of normal birth weight.
In the service area, 12.5% of infants are low birth weight. This percentage is comparable with the Philadelphia County average (11.3%), higher than the state average (8.3%), and has not met the Healthy People 2020 target goal (7.8%) (Figure 5). The percentage of infants born at low birth weight in the service area represents an annual average of approximately 1,100 infants weighing less than 2,500 grams at birth.
In the service area, the percentage of low birth weight infants is highest among Black infants (14.7%) and lowest for Asian infants (8.1%). In general, the racial and ethnic percentages of infants in the service area who are born at low birth weight are comparable to the county and the state.
82.9
22.7
71.1
17.1
58.7
6.9
0
20
40
60
80
100
Women 15-44 Years Adolescent Women 10-17 years
Per
1,0
00
Wo
men
Figure 4. Average Annualized Birth Rates for Women 15-44 Years and
Adolescent Women 10-17 Years, 2005-2008
Temple University Hospital Philadelphia County Pennsylvania
Source: Pennsylvania Department of Health, Bureau of Health Statistics and Research. Calculations prepared by PHMC.
The Research and Evaluation Group
PUBLIC HEALTH management corporation
18
Infant Mortality Rate In Temple University Hospital’s service area, every year an average of 100 infants die before their first birthday, representing an infant mortality rate of 11.6 infant deaths per 1,000 live births.
The service area’s infant mortality rate is generally comparable with the Philadelphia County rate (12.2) but is slightly higher than the state rate (7.5) and has not yet met the Healthy People 2020 target goal of 6.0 infant deaths per 1,000 live births.
Self-reported Health Status Fair or Poor Health Self-reported health status is one of the best indicators of the population health. This measure has consistently shown to correlate very strongly with mortality rates.1 In the Temple University Hospital service area, the majority (70.1%) of adults rates their health as excellent, very good or good (See Appendix D for Household Health Survey Tables). However, a sizable percentage (29.9%) of adults is in fair or poor health, representing 103,100 adults.
This percentage is higher than the statewide average2 (16.8%), the SEPA region (16.1%), and Philadelphia County (22.9%).
1 Idler EL, Benyamini Y. Self-Rated Health and Mortality: A Review of Twenty-Seven Community Studies. Journal of
Health and Social Behavior. 1997; 21-37. 2 2011 Behavioral Risks of Pennsylvania Adults, PA Department of Health.
12.5% 11.3% 8.3%
0%
10%
20%
30%
40%
50%
Temple University Hospital Philadelphia County Pennsylvania
Figure 5. Average Annualized Percentage of Infants Born at Low Birth Weight, 2005-2008
Healthy People 2020 Goal: 7.8%
Source: Pennsylvania Department of Health, Bureau of Health Statistics and Research. Calculations prepared by PHMC.
The Research and Evaluation Group
PUBLIC HEALTH management corporation
19
Among older adults in the service area, 42.8% are in fair or poor health; this percentage represents 19,300 adults 65 years of age and older. The percentage of older adults in fair or poor health has remained steady since 2010. (Figure 6)
Nearly one-half (47.3%) of older adults have at least one or more instrumental activities of daily living limitations and one in four (23.7%) has at least one or more activities of daily living limitations. (Figure 7)
42.8%
27.4%
31.4%
18.1%
23.0%
14.0%
0%
10%
20%
30%
40%
50%
Fair or Poor Health Signs of Depression
Figure 6. Older Adults (65+), Health Status & Mental Health, 2012
Temple University Hospital Philadelphia County SEPA
Source: PHMC's 2012 Southeastern Pennsylvania Household Health Survey
The Research and Evaluation Group
PUBLIC HEALTH management corporation
20
One in seven (13.2%) children in the service area is in fair or poor health. Health Conditions High blood pressure, diabetes, asthma, cancer, and mental health conditions are common illnesses that require ongoing care. In the service area:
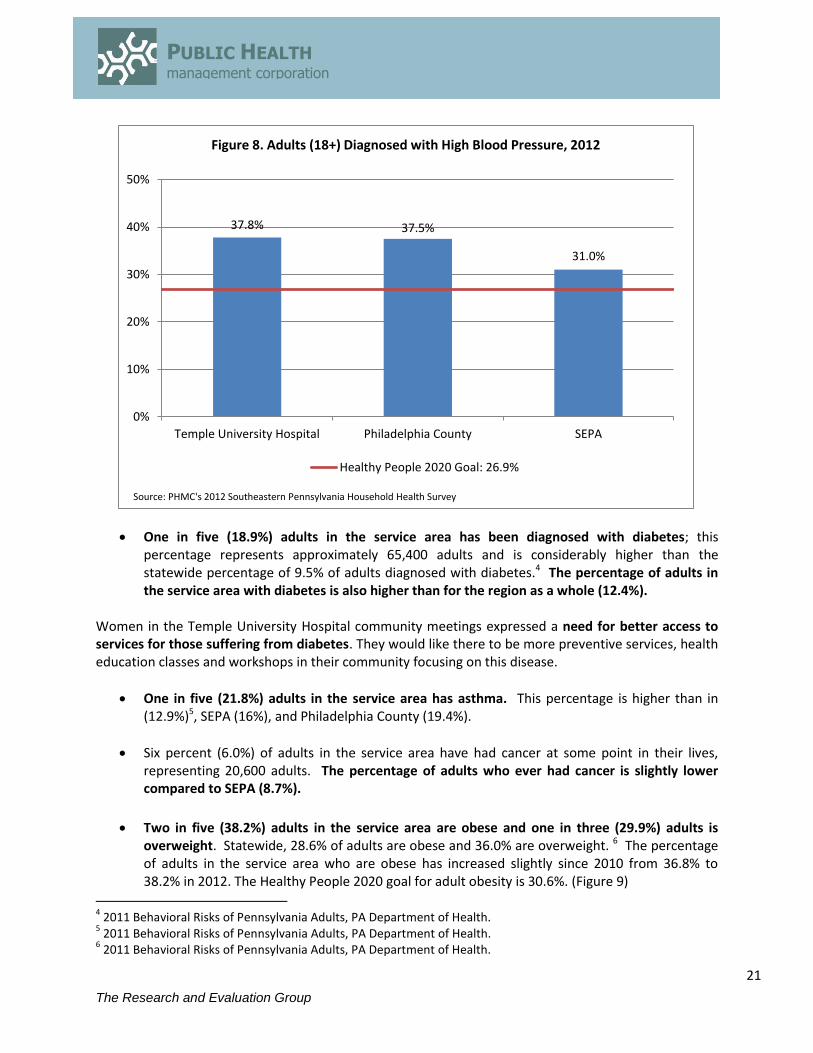
More than one-third (37.8%) of adults have been diagnosed with high blood pressure; this represents 130,000 adults. This percentage has remained constant from 2010 and is higher than the Healthy People 2020 goal of 26.9% of adults with high blood pressure.
In Pennsylvania, three in ten (31.0%) adults have high blood pressure.3 The percentage of adults in the service area with high blood pressure is higher than for the region (31%), but is comparable to Philadelphia County (37.5%). (Figure 8)
3 2009 Behavioral Risks of Pennsylvania Adults, PA Department of Health.
23.7%
47.3%
16.1%
35.1%
12.1%
28.6%
0%
10%
20%
30%
40%
50%
At Least One ADL Limitation At Least One IADL Limitation
Figure 7. Older Adults (65+), Activities of Daily Living, 2012
Temple University Hospital Philadelphia County SEPA
Source: PHMC's 2012 Southeastern Pennsylvania Household Health Survey
The Research and Evaluation Group
PUBLIC HEALTH management corporation
21
One in five (18.9%) adults in the service area has been diagnosed with diabetes; this percentage represents approximately 65,400 adults and is considerably higher than the statewide percentage of 9.5% of adults diagnosed with diabetes.4 The percentage of adults in the service area with diabetes is also higher than for the region as a whole (12.4%).
Women in the Temple University Hospital community meetings expressed a need for better access to services for those suffering from diabetes. They would like there to be more preventive services, health education classes and workshops in their community focusing on this disease.
One in five (21.8%) adults in the service area has asthma. This percentage is higher than in (12.9%)5, SEPA (16%), and Philadelphia County (19.4%).
Six percent (6.0%) of adults in the service area have had cancer at some point in their lives, representing 20,600 adults. The percentage of adults who ever had cancer is slightly lower compared to SEPA (8.7%).
Two in five (38.2%) adults in the service area are obese and one in three (29.9%) adults is overweight. Statewide, 28.6% of adults are obese and 36.0% are overweight. 6 The percentage of adults in the service area who are obese has increased slightly since 2010 from 36.8% to 38.2% in 2012. The Healthy People 2020 goal for adult obesity is 30.6%. (Figure 9)
4 2011 Behavioral Risks of Pennsylvania Adults, PA Department of Health.
5 2011 Behavioral Risks of Pennsylvania Adults, PA Department of Health.
6 2011 Behavioral Risks of Pennsylvania Adults, PA Department of Health.
37.8% 37.5%
31.0%
0%
10%
20%
30%
40%
50%
Temple University Hospital Philadelphia County SEPA
Figure 8. Adults (18+) Diagnosed with High Blood Pressure, 2012
Healthy People 2020 Goal: 26.9%
Source: PHMC's 2012 Southeastern Pennsylvania Household Health Survey
The Research and Evaluation Group
PUBLIC HEALTH management corporation
22
Approximately one-quarter (24.6%) of children in the service area are obese and 11.2% are overweight. The percentage of obese children in the service area is higher than for SEPA as a whole (18.2%). The percentage of obese children in the service area has decreased from 27.1% in 2010 to 24.6% in 2012. (Figure 10)
29.9%
38.2%
33.3% 31.9%
35.1%
27.6%
0%
10%
20%
30%
40%
50%
Overweight Obese
Figure 9. Adults (18+), Body Mass Index, 2012
Temple University Hospital Philadelphia County SEPA
Source: PHMC's 2012 Southeastern Pennsylvania Household Health Survey
The Research and Evaluation Group
PUBLIC HEALTH management corporation
23
Community members expressed concern for youth suffering from obesity. Additionally, community members believed that there is a need to inform parents of warning signs for chronic diseases among children. They stated that it is easier to give children money to purchase their own foods than it is to provide them with a well-balanced meal to eat at school. They believe that there should be education specific to children around nutrition, diabetes and hypertension. They claim that children need to be taught early on what it means to be healthy. Temple University Hospital community members would like more access to information/training surrounding dietary needs and nutrition. Community members felt that obesity, malnutrition and hunger all occur together and cut across age groups. Access to food has become more of a problem for many people with changes in the SNAP benefits; there is now an income requirement. In addition, community members stated that there are a number of services pertaining to youth that are in high need. For example, community members expressed a need for better care surrounding pediatric asthma including education on cigarette/marijuana smoking around children. Also, community members indicated that there is a need for better quality nurses/health services in schools as these services are limited. Mental and Behavioral Health
One in five (24.4%) adults in the service area has been diagnosed with a mental health condition; this percentage represents 84,300 adults. Of those with a mental health condition, more than one-third (34.1%) is not receiving treatment for the condition. (Figure 11)
o One in three (27.4%) older adults in the service area has signs of depressions which
11.4%
24.6%
12.9%
24.5%
15.3% 18.2%
0%
10%
20%
30%
40%
50%
Overweight Obese
Figure 10. Children (6-17), Body Mass Index, 2012
Temple University Hospital Philadelphia County SEPA
Source: PHMC's 2012 Southeastern Pennsylvania Household Health Survey
The Research and Evaluation Group
PUBLIC HEALTH management corporation
24
are defined as having four or more depression symptom on a ten item scale. This percentage is higher than for the region as a whole (14%).
Approximately 47,700 adults (13.9%) in the service area are in recovery for a substance abuse problem.
According to Temple University Hospital community members, the lack of mental health services was a concern for adults and youth.
Members of the community expressed that seeking mental health care is especially problematic for the youth. They would like more services for children touched by violence, as this is a need specific to North Philadelphia. There should additionally be increased mental health care and emotional support for children suffering through these traumas.
Community members are also disappointed at the long waiting lists for those seeking mental/emotional health care as there have simultaneously been funding cuts in the Philadelphia School District budgets to address these issues. The parents of youth overcoming these issues are in need of support as well.
Community participants expressed concern that older adults, especially older women, suffer from issues relating to isolation and depression. They say that depression is mostly under diagnosed and untreated. They also experience barriers in seeking mental health care.
24.4%
34.1%
19.9%
38.7%
16.4%
38.2%
0%
10%
20%
30%
40%
50%
Diagnosed with Mental Health Condition Not Receiving treatment for Mental HealthCondition
Figure 11. Adults (18+), Mental Health Status, 2012
Temple University Hospital Philadelphia County SEPA
Source: PHMC's 2012 Southeastern Pennsylvania Household Health Survey
The Research and Evaluation Group
PUBLIC HEALTH management corporation
25
Communicable Diseases The communicable disease rates for chronic Hepatitis B, Tuberculosis, Varicella (chicken pox), Chlamydia, Gonorrhea, and Syphilis (primary and secondary) in Philadelphia County are higher than state rates while the county rate for Lyme Disease is lower compared to the state rate (Figure 12). The county rate for Pertussis (whooping cough) is comparable to the state rate.
Morbidity HIV and AIDS In Philadelphia County, there are 16,234 individuals who are living with HIV, including AIDS, representing a prevalence rate of 1,121.6 cases per 100,000 population. This prevalence rate is five times higher than the state’s rate (244.9).
Among Philadelphia residents who are living with HIV or AIDS, more than two-thirds (69%) are men.
Two-thirds (66%) are Black, one-fifth (21%) are White, more than one-tenth (12%) are Latino, and 1% are Asian (Figure 13).
374.1
101.4
23.1
11.6
2.9
30.0
1.9
1273.1
428.1
31.7
30.6
15.6
9.1
6.3
0 250 500 750 1000 1250 1500
Chlamydia
Gonorrhea
Varicella*
Chronic Hepatitis B
Syphilis
Lyme Disease
Tuberculosis
Figure 12. Communicable Disease Rates, 2010
Philadelphia County Pennsylvania
Source: Pennsylvania Department of Health, Bureau of Health Statistics and Research, EpiQMS. * Indicates information is from 2007-2009.Communicable disease rates are calculated per 100,000 population.
The Research and Evaluation Group
PUBLIC HEALTH management corporation
26
Overall Mortality The overall death rate in the Temple University Hospital service area (1,015.7 deaths per 100,000 population) is higher than the Philadelphia County rate (931.2) and the state rate (785.2) (Figure 14).
Heart disease is the leading cause of death in the service area (247.4), the county (232.2), and the state (203.2); but the heart disease death rate is highest in the service area.
The other four leading causes of death in the service area are: all forms of cancer (226.7), lung cancer (63.7), stroke (53.0), and female breast cancer (31.6). The death rates for these conditions are higher in the service area compared with the county and the state.
o Additionally, the service area’s homicide rate (35.4) is higher than the countywide rate (24.6) and nearly six times higher than the statewide rate (6.1).
21%
66%
12%
1%
Figure 13. Racial and Ethnic Distribution of Individuals Living with HIV or AIDS, Philadelphia County, 2008
White Black Latino Asian
Source: Pennsylvania Department of Health, HIV/AIDS Investigation-Bureau of Epidemiology and American Communtiy Survey.
The Research and Evaluation Group
PUBLIC HEALTH management corporation
27
Access and Barriers to Care
The Healthy People 2020 Goals for access to health care include:
Increase the proportion of the population with health insurance to 100%;
Reduce the proportion of individuals who are unable to obtain or delay in obtaining necessary medical care, dental care or prescription medicines to 9% overall (4.2% for medical care, 5% for dental care and 2.8% for prescription medications); and
Increase the proportion of persons with a usual primary care provider to 83.9%. Health Insurance Status Having health insurance and a regular place to go when sick are important in ensuring continuity of care over time. The majority of adults (75.3%) in the Temple University Hospital service area have health insurance coverage. However, a sizable percentage of adults do not have any private or public health insurance; 24.7% of adults aged 18-64 in the service area are uninsured, representing 73,200 uninsured adults (Figure 15).
The percentage of uninsured adults in the service area has increased since 2010 from 21.0% to 24.7% in 2012.
The percentage of adults in the service area without insurance is higher than for adults ages 18-64 in Philadelphia County (18.5%) and does not meet the Healthy People 2020 goal of 100% of adults with health coverage.
785.2
931.2
1,105.7
0 200 400 600 800 1000 1200
Pennsylvania
Philadelphia County
Temple University Hospital
Per 100,000 Population
Figure 14. Average Annualized Overall Mortality Rate, 2005-2008
Source: Pennsylvania Department of Health, Bureau of Health Statistics and Research. Calculations prepared by PHMC.
The Research and Evaluation Group
PUBLIC HEALTH management corporation
28
Community members indicated that the uninsured and underinsured experience significant barriers to care. This includes both working and non-working individuals who cannot afford to purchase an insurance plan for themselves and who earn too much money to obtain federal insurance coverage. Community members also indicated that the uninsured need to know how to access low-cost health insurance and where they can get free care. One community member expressed concern that you cannot see a specialist if you are uninsured or underinsured. It was also stated that because of insurance restrictions people may have to travel prohibitively far distances to receive care. Prescription Drug Coverage
One in three (30.5%) adults in the service area does not have prescription drug coverage. This percentage represents 104,000 adults without this coverage and is higher than compared to the percentage without prescription coverage in 2010; in 2010 13.5% of adults did not have prescription drug coverage.
The percentage of adults without prescription drug coverage in the service area is higher than in Philadelphia County (24.5%) and in the SEPA region as a whole (18.6%).
Economic Barriers
With or without health insurance, 65,800 adults in the service area are unable to get needed care due to the cost of that care; 19.1% of adults reported that there was a time in the past year when they needed health care, but did not receive it due to the cost. (Figure 16)
24.7%
18.5%
12.2%
0%
10%
20%
30%
40%
50%
Temple Univeristy Hospital Philadelphia County SEPA
Figure15. Adults (18-64) without Health Insurance, 2012
Healthy People 2020 Goal: 0%
Source: PHMC's 2012 Southeastern Pennsylvania Household Health Survey
The Research and Evaluation Group
PUBLIC HEALTH management corporation
29
About 74,200 adults in service area (21.5%) were prescribed a medication but did not fill the prescription due to cost in the past year. (Figure 16)
One in three (31.9%) adults in the service area in 2010 did not get dental care due to the cost of the visit. This percentage is higher than for Philadelphia County (26.8%) and SEPA (24.1%) as a whole.
Source of Care Having a regular source of care is important since people who have a regular source of care are more likely to seek care when they are sick compared with those who do not.
In the service area, 15.4% of adults do not have a regular source of care; this percentage represents approximately 53,000 adults (Figure 17).
The percentage of adults in the service area with a regular source of care (84.6%) meets the Healthy People 2020 goal of 83.9%.
o Most children (97.5%) in the service area have a regular source of care. However, approximately 3,100 children in the service area do not have a regular source of care.
While 58.5% of service area adults’ usual source of care is a doctor’s office, 22.3% usually access health care at a community health clinic and 10.8% usually access care at a hospital outpatient clinic. The remaining 8.4% of adults receive their usual source of care at a hospital emergency room or some other place.
19.1% 21.5%
15.8% 18.5%
12.4% 14.7%
0%
10%
20%
30%
40%
50%
Did Not Receive Health Care Due to Cost Did Not Fill Prescription Due to Cost
Figure 16. Adults (18+), Cost Barriers to Care, 2012
Temple University Hospital Philadelphia County SEPA
Source: PHMC's 2012 Southeastern Pennsylvania Household Health Survey
The Research and Evaluation Group
PUBLIC HEALTH management corporation
30
Pre-Natal Care Receiving pre-natal care during the first trimester of pregnancy can help ensure that health concerns are identified and addressed in a timely manner.
Less than one-half of women in Temple University Hospital’s service area (47.1%) receive early pre-natal care, which is below the Philadelphia County average (52.3%) and far below the state average (70.6%) and has not met the Healthy People 2020 target goal (77.9%).
In fact, more than one-half of women in the service area (52.9%) receive pre-natal care during the second or third trimester of pregnancy or no pre-natal care at all, representing an average of nearly 4,000 women annually in the service area (Figure 18).
More than one-half of Asian women (57.1%) in the service area receive late or no pre-natal care compared to 46.3% of White women. The racial and ethnic percentages of women in the service area receiving late or no pre-natal care are either comparable with or higher than the county and higher than the state averages.
15.4% 13.1%
11.2%
0%
10%
20%
30%
40%
50%
Temple University Hospital Philadelphia County SEPA
Figure 17. Adults (18+), with No Regular Source of Health Care, 2012
Healthy People 2020 Goal: 5%
Source: PHMC's 2012 Southeastern Pennsylvania Household Health Survey
The Research and Evaluation Group
PUBLIC HEALTH management corporation
31
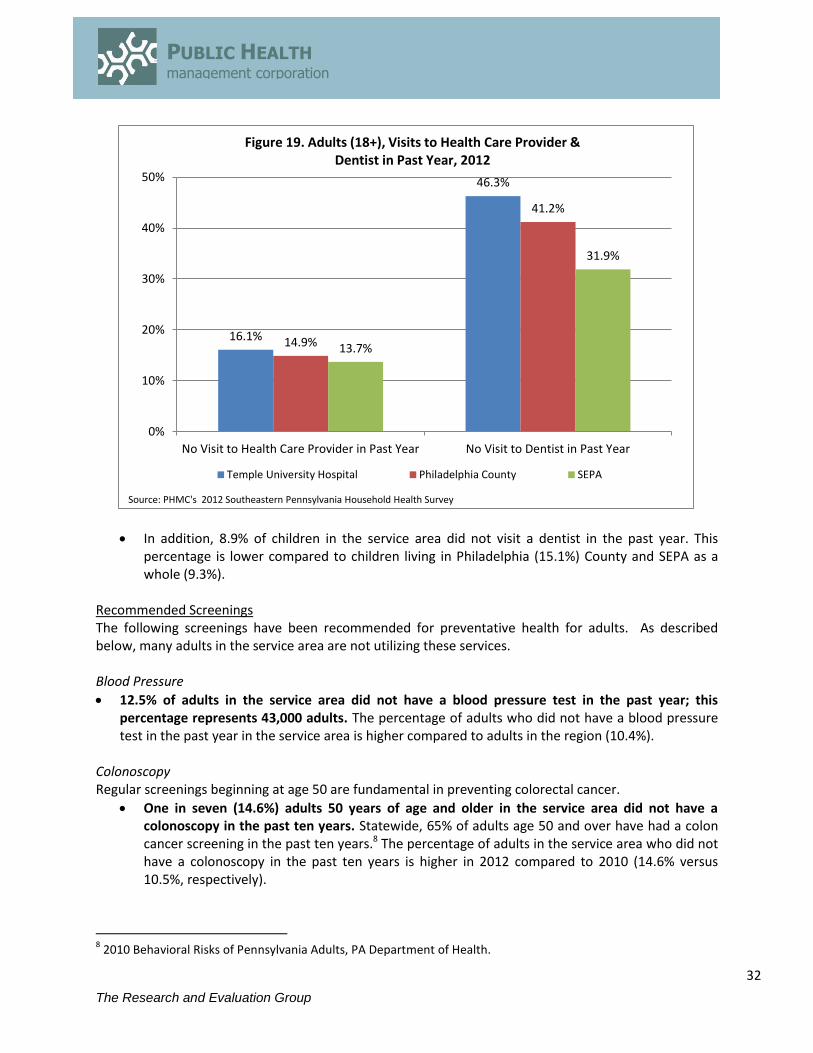
Utilization of Services Regular health screenings can help identify health problems before they start. Early detection can improve chances for treatment and cure and help individuals to live longer, healthier lives. In the service area, more than one in ten (16.1%) adults did not visit a health care provider in the past year; this percentage represents 53,200 adults. (Figure 19) Dental Visit
One in two (46.3%) adults in the service area did not visit a dentist in the past year; this percentage represents 159,000 adults. This percentage has increased slightly since 2010 (43.8%) and is higher compared to adults in Philadelphia County (41.2%) and the SEPA region as a whole (31.9%). (Figure 19)
The percentage of adults (46.3%) who did not visit a dentist in 2012 in the service area is considerably higher than for adults statewide (29.0%).7
7 2011 Behavioral Risks of Pennsylvania Adults, PA Department of Health.
52.9% 47.7%
29.4%
0%
20%
40%
60%
80%
100%
Temple University Hospital Philadelphia County Pennsylvania
Figure 18. Average Annualized Percentage of Women Receiving Late or No Pre-Natal Care, 2005-2008
Healthy People 2020 Goal: 22.1%
Source: Pennsylvania Department of Health, Bureau of Health Statistics and Research. Calculations prepared by PHMC.
The Research and Evaluation Group
PUBLIC HEALTH management corporation
32
In addition, 8.9% of children in the service area did not visit a dentist in the past year. This percentage is lower compared to children living in Philadelphia (15.1%) County and SEPA as a whole (9.3%).
Recommended Screenings The following screenings have been recommended for preventative health for adults. As described below, many adults in the service area are not utilizing these services. Blood Pressure
12.5% of adults in the service area did not have a blood pressure test in the past year; this percentage represents 43,000 adults. The percentage of adults who did not have a blood pressure test in the past year in the service area is higher compared to adults in the region (10.4%).
Colonoscopy Regular screenings beginning at age 50 are fundamental in preventing colorectal cancer.
One in seven (14.6%) adults 50 years of age and older in the service area did not have a colonoscopy in the past ten years. Statewide, 65% of adults age 50 and over have had a colon cancer screening in the past ten years.8 The percentage of adults in the service area who did not have a colonoscopy in the past ten years is higher in 2012 compared to 2010 (14.6% versus 10.5%, respectively).
8 2010 Behavioral Risks of Pennsylvania Adults, PA Department of Health.
16.1%
46.3%
14.9%
41.2%
13.7%
31.9%
0%
10%
20%
30%
40%
50%
No Visit to Health Care Provider in Past Year No Visit to Dentist in Past Year
Figure 19. Adults (18+), Visits to Health Care Provider & Dentist in Past Year, 2012
Temple University Hospital Philadelphia County SEPA
Source: PHMC's 2012 Southeastern Pennsylvania Household Health Survey
The Research and Evaluation Group
PUBLIC HEALTH management corporation
33
Pap Smear Test
Nearly one in four (37.9%) women in the service area did not receive a Pap Smear test in the past year. This percentage represents approximately 75,200 women. The percentage of women who have not received a Pap Smear test in the past year is slightly lower in the service area compared to women in Philadelphia County (40.9%) and for SEPA as a whole (41.9%). (Figure 20)
Mammogram The American Cancer Society recommends annual mammograms beginning at age 40 for women in good health.
One third (33.0%) of women age 40 or older in the service area is not receiving this screening annually. This is lower than the statewide percentage (42.0%)9 and for the region as a whole (36.8%). (Figure 20)
Community Members underscore the data by expressing that women need more access to Gynecological and female specific services. Temple University Hospital community members expressed the need for more access to gynecological services including screenings for ovarian/cervical cancer. Community members believe there should be culturally competent education around health issues, especially for women. They claim that education requires rapport building to gain trust and overcome fears. In addition, many community members noted that violence against women and domestic violence are pressing issues in the community and are related to women’s health. 9 2011 Behavioral Risks of Pennsylvania Adults, PA Department of Health.
37.9%
34.0% 33.0%
40.9%
33.7% 34.8%
41.9%
33.0% 36.8%
0%
10%
20%
30%
40%
50%
No Pap Smear in the past year(women 18+)
No Breast exam in the pastyear (women 18+)
No Mammogram in the pastyear (women 40+)
Figure 20. Adult Women, Utilization of Health Screenings, 2012
Temple University Hospital Philadelphia County SEPA
Source: PHMC's 2012 Southeastern Pennsylvania Household Health Survey
The Research and Evaluation Group
PUBLIC HEALTH management corporation
34
PSA or Rectal Exams for Prostate Cancer
One-half (51.3%) of men ages 45 years and over in the service area did not have a screening for prostate cancer in the past year. The percentage of men who have not had a prostate exam in the past year is higher in the service area compared to SEPA as a whole (45.4%). Statewide, 53% of men ages 50 and over did not have this test.
In addition, community members discussed the need for health education. They felt that there is increased need for education around receiving cancer screenings and obesity/hypertension/diabetes screenings. Also, community members believe people must be made to realize the importance of receiving preventive screenings. Some community members noted that Einstein/American Diabetes Association provide education about diabetes, but many African Americans don’t understand kidney disease. Many community members thought that parents should be given the tools to properly educate their children and be “good” parents. It was proposed that families could educate themselves together. It was stressed that health education must be at the appropriate comprehension level for those it is intended to reach, even for those who are completely illiterate. Health Behaviors Nutrition According to the USDA’s MyPlate food guidelines, adults should eat four to five servings of fruits and vegetables daily.10
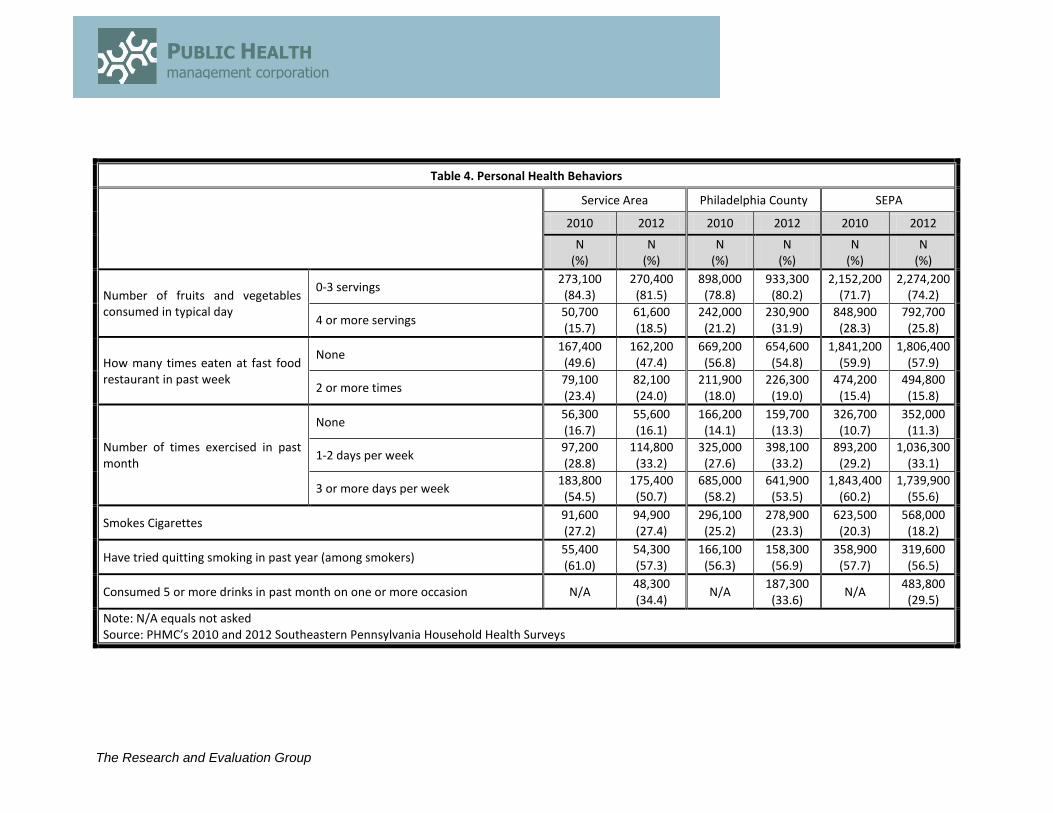
In the service area, eight in ten (81.5%) adults do not reach this recommended goal. Nationally, less than three-quarters of adults (74%) eat three or more servings of fruits and vegetables daily.11
Fast foods are high in unhealthy calories, saturated fats, sugar, and salt. One-quarter (24.0%) of adults in the service area eats fast food two or more times a week.
Exercise The U.S. Department of Health and Human Services’ 2008 Physical Activity Guidelines for Americans recommends that adults (ages 18-64) get two and a half hours of moderate aerobic physical activity each week.12
One in six (16.1%) of adults in the service area do not participate in any exercise. One-half (50.7%) of adults exercise three or more days a week as recommended. The Healthy People 2020 goal is to reduce the percentage of adults who participate in no leisure time physical activity to 32.6%.
10
The U.S. Departments of Agriculture, (2011). Dietary Guidelines Consumer Brochure. Retrieved online on October 23, 2012 at http://www.choosemyplate.gov/food-groups/downloads/MyPlate/DG2010Brochure.pdf 11
U.S. Centers for Disease Control and Prevention. State-Specific Trends in Fruit and Vegetable Consumption Among Adults, 2000-2009 (2011). 12
U.S.Department of Health and Human Services. 2008 Physical Activity Guidelines for Americans, 2008.
One in four (27.4%) adults in service area currently smokes; this percentage is higher than the smoking rate statewide (22.4%) and for SEPA as a whole (18.2%). (Figure 21)
The percentage of adults who smoke in the service area does not meet the Healthy People 2020 goal of 12%.13
Nearly six in ten (57.3%) adults who smoke in the service area tried to quit in the past year.
The percentage of adults in the service area who smoke has remained constant since 2010; in 2010, 27.2% of adults smoked cigarettes.
Alcohol Consumption According to the Centers for Disease Control and Prevention (CDC), binge drinking is a common pattern of excessive alcohol use in the U.S. and is defined as five or more drinks on one occasion.14
One in three (34.4%) service area adults participated in binge drinking on one or more occasions in the past month. The binge drinking percentage is higher than the statewide percentage of 18.3%.15
13
2011 Behavioral Risks of Pennsylvania Adults, PA Department of Health. 14
U.S. Centers for Disease Control and Prevention. Fact Sheets – Binge Drinking – Alcohol (2010). 15
2011 Behavioral Risks of Pennsylvania Adults, PA Department of Health.
27.4% 23.3%
18.2%
57.3% 56.9% 56.5%
0%
20%
40%
60%
80%
100%
Temple University Hospital Philadelphia County SEPA
Figure 21. Cigarette Smoking and Cessation Behaviors among Adults (18+), 2012
Smokes Cigarettes Smokers who have Tried to Quit in Past Year
Healthy People 2020 Goal: 12% Healthy People 2020 Goal: 80%
Source: PHMC's 2012 Southeastern Pennsylvania Household Health Survey
The Research and Evaluation Group
PUBLIC HEALTH management corporation
36
Social Capital and Neighborhood Neighborhood factors have important roles in the overall health and well-being of residents. Social capital is one measure used to understand an individual’s neighborhood and role in that neighborhood.
The majority (81.7%) of adults in service area feel like they belong in their neighborhood, and three-quarters (73.2%) have worked on a community project to improve the area. (Figure 22)
Best Methods for Sharing Health Information Community members indicated that word of mouth and working with individuals one-on-one is the best way to address many health concerns in the community. Community members noted that input from the community is needed before creating programs. This may be difficult as communities are more fragmented than they used to be. People require education that is not passive and meets people where they are. Faith based institutions, community organizations/meetings, block captains, schools, educational workshops in the community were mentioned as ways to disseminate information to the community and there needs to be a sustained relationship with a community based upon connections that already exist in institutions that they trust. Several other programs were mentioned as ways to share health information including The Center in the Park program which teaches people to deal with their diabetes on their own and St. John’s Church
76.4%
66.6%
84.7%
56.3%
0%
20%
40%
60%
80%
100%
Belong in Neighborhood Neighbors Worked to ImproveNeighborhood
Figure 22. Adults (18+), Social Capital, 2012
Temple University Hospital SEPA
Source: PHMC's 2012 Southeastern Pennsylvania Household Health Survey
The Research and Evaluation Group
PUBLIC HEALTH management corporation
37
partners to provide prostate screenings, mammograms and host health fairs. The church has over 2,000 members and also has a home visiting program for homebound and hospice patients. Patient advocates were also thought to be needed in the community to help people navigate the health care system and not just a resource guide. Other ways to share information mentioned were:
Printed media, including community and hospital-based newsletters and ethnic newspapers, including Comcast.
Electronic media including TV broadcasts (including ethnic channels), public television and the internet/Facebook.
City health officials/offices
HEALTH NEEDS OF SPECIAL POPULATIONS
One of the goals of this needs assessment is to identify the health needs of special populations across the service area. The following section focuses on the selected health status and access to care needs of special populations in the service area. Health Status
Within the service area nearly four in ten (38%) poor adults living below 150% of the Federal Poverty Level are in fair or poor health compared to 20.3% of non-poor adults. One in three Latino (34.1%) adults is in fair or poor health, followed by 28.8% of Black adults and 25.8% of White adults.
Poor adults (41.8%) in the service area are more likely to have high blood pressure compared to non-poor (34.1%) adults. In the service area, more than four in ten (44.2%) Black adults have high blood pressure, followed by 36.9% of White adults and 28.6% of Latino adults.
Poor adults are more likely to have been diagnosed with a mental health condition compared to the non-poor; nearly three in ten (28.8%) of poor adults have been diagnosed with a mental health condition compared to one in seven (14.5%) non-poor adults. Nearly three in ten (28.9%) Latino adults in the service area have been diagnosed with a mental health problem; this percentage is higher than for White (23.4%) and Black (17.6%) adults.
One third of poor adults (33.3%) smoke cigarettes. Poor adults are more likely to smoke cigarettes compared to non-poor adults (22.7%).
Insurance Status
One in four (27.6%) poor adults in the service area is uninsured compared to 19.1% of non-poor adults. Latino adults (30.4%) are more likely to be uninsured than are Black (21.8%) and White (16.6%) adults.
Other Barriers The Temple University Hospital and North Philadelphia community members expressed that immigrants and non-English speaking residents of the area suffer from issues surrounding access to care, including Asian Americans and Latinos, especially if they are undocumented and lack coverage. Community
The Research and Evaluation Group
PUBLIC HEALTH management corporation
38
members indicated that language barriers present obstacles to care in the non-English speaking immigrant communities. Community members recognize language as a barrier for the Asian/Korean communities specifically as they attempt to access health care. They say the Language Line is ineffective and there are barriers accessing and utilizing interpreters/translators. Additionally, they would like interpreters to be present at each health care facility and for educational materials to be printed in other languages.
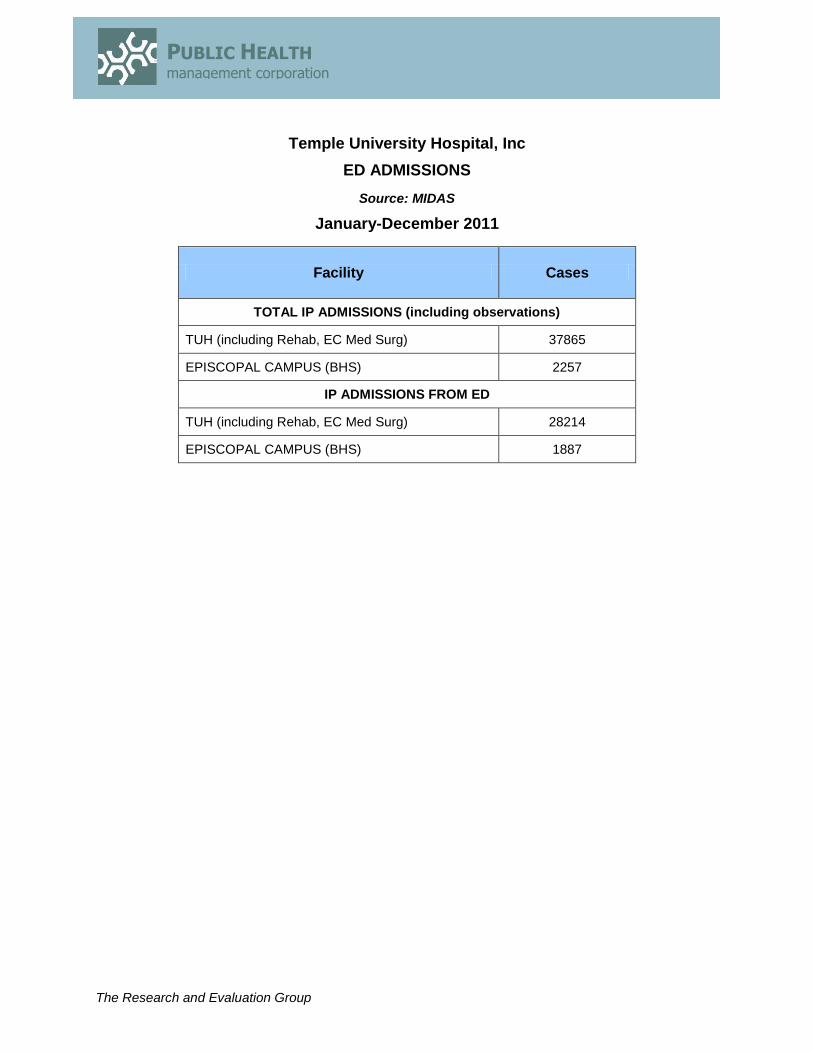
EXAMINATION OF SPECIAL DATA FOR TEMPLE UNIVERSITY HEALTH SYSTEM The following is a brief examination of Temple University Health System inpatient data from January–December 2011. These data are for Temple University Hospital (Main Campus), Episcopal Division – Med/Surg, Temple Rehabilitation and Behavioral Health. These data were provided by Temple University Health System staff for the purpose of providing additional information to assess unmet needs for this community health needs assessment. Tables for these data are located in Appendix F.
According to Temple University Hospital inpatient data, Temple University hospital had 28,132 inpatient admissions from January-December 2011, Episcopal had 852, Temple Rehab had 330 and Behavioral Health had 2,232. More inpatients were female than male at Temple University Hospital Main Campus (16,411 versus 11,721). There were slightly more females (441) than males (411) admitted to the Episcopal Division, but slightly more males than females admitted to both Temple Rehab (182 males versus 148 females) and at Temple’s Behavioral Health Campus (1,213 males versus 1,018 females).
The majority of patients at Temple University Hospital were Black (13,878) patients admitted, followed by White (5,906) patients and patients from other ethnic groups (8,348). At the Episcopal Division, there were slightly more White (254) patients admitted than Black (198) patients. At Temple Rehab, more Black (167) patients were admitted compared to White (88) patients. Similarly, more Black patients were admitted to Behavioral Health (1,154) than White (557) patients.
The average patient age differs across the hospitals. The average age for inpatient admissions for Temple University Hospital was 43.9 compared to 54.2 for the Episcopal Division and 60.5 for Temple Rehab. Temple’s Behavioral Health division had an average patient age of 40.2.
During the time period these data were collected, the mortality rate was 2.3% for Temple University Hospital, 0% for both Episcopal and Temple Rehab, and .1% for Temple’s Behavioral Health division.
Complication rates represent events that occurred in the hospital. They are deemed to have not been present at the time of admission. The complication rate was 14.1% at Temple University Hospital as compared to an expected rate of 13.6%, representing a deviation from the expected of 0.5%. Complication rates at the Episcopal Division were 1.4%, performing better than expected and the Rehabilitation Unit’s rate was 22.2%, which was a 7.3% deviation.
The Research and Evaluation Group
PUBLIC HEALTH management corporation
39
The average length of stay was 5.1 days at Temple University Main. The average length of stay at Temple’s Behavioral Health division was 19.8 days, 11.9 days at Temple Rehab and 2.7 days at Episcopal division. The length of stay reflects the complexity of care delivered at each facility. All length of stay comparisons fell into the expected norms for the population served.
The Research and Evaluation Group
PUBLIC HEALTH management corporation
40
IV. UNMET COMMUNITY HEALTH NEEDS
UNMET NEEDS AND IDENTIFICATION PROCESS The unmet health care needs for this service area were identified and prioritized by comparing the health status, access to care, health behaviors, and utilization of services for residents of the service area to results for the county and state and the Healthy People 2020 goals for the nation. In addition, for Household Health Survey measures, tests of significance were conducted to identify and prioritize unmet needs. Lastly, input from the community meeting participants was also used to further identify and prioritize unmet needs, local problems with access to care, and populations with special health care needs.
In the Temple University Hospital service area, seven in ten (70.1%) adults rate their health as excellent, very good or good. A sizable percentage (29.9%) of adults are in fair or poor health; this percentage is higher than the statewide average16 (16.8%), the percentage in fair or poor health for the SEPA region as a whole (16.1%), and the percentage for Philadelphia County (22.9%).
Heart disease is the leading cause of death in the service area. More than one-third (37.8%) of adults have been diagnosed with high blood pressure and one in five (18.9%) adults in the service area has been diagnosed with diabetes.
Two in five (38.2%) adults in the service area are obese and one in three (29.9%) adults is overweight. Approximately one-quarter (24.6%) of children in the service area are obese and 11.2% are overweight. The percentage of obese children in the service area is higher than for SEPA as a whole (18.2%).
One in five (24.4%) adults in the service area has been diagnosed with a mental health condition; this percentage represents 84,300 adults. Of those with a mental health condition, more than one-third (34.1%) is not receiving treatment for the condition.
A sizable percentage of adults do not have any private or public health insurance; 24.7% of adults aged 18-64 in the service area are uninsured, representing 73,200 uninsured adults
For many SEPA Household Health Survey indicators, the findings for the service area were statistically significantly worse (p<.01) than the remainder of SEPA. These indicators could be prioritized for improvement. These areas are:
Percentage of uninsured adults and adults without prescription drug coverage;
Overweight or obese adults and children;
Cigarette smoking and problem drinking among adults;
Adults and older adults in fair or poor health and with asthma, diabetes and high blood pressure; and
16
2011 Behavioral Risks of Pennsylvania Adults, PA Department of Health.
The Research and Evaluation Group
PUBLIC HEALTH management corporation
41
Dental visits among children. Preliminary analysis of the quantitative and qualitative data collected shows that the unmet health care needs of the residents of this service area include the following prioritized needs:
Access to primary and preventive care for adults and children, particularly those individuals living in poverty, and who are uninsured or underinsured.
Access to dental care, prescription coverage for adults and children, and mental health services for women and older adults.
Priority unmet needs in this area also include increased educational programs to address:
Cultural and language barriers particularly among non-English speakers;
Heart disease, and cancer management for all residents;
Smoking prevention, interventions, and cessation programs;
Overweight and obese children and adults;
Access to long cost health insurance; and
Health education about healthy lifestyles and disease management.
Many of these unmet needs are already being addressed in the service area by the hospital, other health care providers, government, and local non-profits. In addition, many of these unmet needs are not within the hospital’s mission. This list should be used to assist the hospital in addressing these needs in their needs assessment implementation plan.
The Research and Evaluation Group
PUBLIC HEALTH management corporation
APPENDIX A: COMMUNITY MEETING ATTENDEES
The Research and Evaluation Group
PUBLIC HEALTH management corporation
Temple University Hospital Community Meeting Community Health Needs Assessment
July 17, 2012 List of Participants (7)
Name Title Agency Email Phone No. Area of Expertise
Im Ja Choi Executive Director and Founder
Penn Asian Senior Services, Inc (PASSI)
[email protected] 215-572-1234 Agency with special knowledge of the health needs of the community; Leaders or members of medically underserved low income and minority populations with chronic disease needs in the community served by the hospital facility; health care provider- ailing English limited Asian seniors
Apeler Burn MUCS Apeler.Barnes 267-258-3111
Bobby J. Williams 215-221-5257
Verna Tyner Founder Tioga United [email protected] 215-227-2858 Community-based nonprofit organization focused on community rebuilding
Joseph Dner Tioga United [email protected] 215-665-2060 Community-based nonprofit organization focused on community rebuilding
Safiyah Abdul Latif Block Captains' Committee of Nicetown (BCCN)
[email protected] 215-457-4042 Community-based organization focused on community development
Kim Niemala Director COSACOSA [email protected] 215-385-255 Non-profit organization creating public art specific to neighborhoods
[email protected] 215-236-9911 Agency with special knowledge of the health needs of the community (African Americans); Nonprofit organization-religious.
George Van Norton
Church Administrator Zion Baptist Church [email protected] 215-4990-5884 Nonprofit organization-religious
Majeedah Rashid
Executive Vice President
Nicetown CDC [email protected] 215-329-1825 Agency with special knowledge of the health needs of the community; Community based organization
Cyndi Dinger Director of Nutrition and Client Services
Metropolitan Area Neighborhood Nutrition Alliance (MANNA)
215-496-2662 X 122
[email protected] Nonprofit organization focused on nutrition, especially for underserved low income and minority persons living with HIV/AIDS
Lynn Trombetta Assistant Executive Director
Aid for Friends [email protected] Nonprofit organization that provides emergency shelter, transitional housing and other supportive services to individuals and families facing homelessness.
Kevin Burns Executive Director ActionAIDS 215-981-3338 [email protected] Nonprofit organization providing services works in partnership with people living with or affected by HIV/AIDS, to sustain and enhance their quality of life.
Elisha Coffey Housing Systems Advocate
Mental Health Association of Southeastern Pennsylvania
267-507-3813 [email protected] Nonprofit organization providing mental health and social services and advocacy for adults, families, and youth
Martin Nock President & CEO Communities In Schools of Philadelphia, Inc.
267-386-4671 [email protected] Nonprofit organization providing services to youth to help them stay in school
Mary Jane Morrison Social Worker Maternity Care Coalition 215-989-3548 [email protected]
Public health; Nonprofit organization to improve the health and wellbeing of mothers and children
Priscilla Koutsouradis Communications Director
Delaware Valley Healthcare Council of HAP
215-906-2739 [email protected] Nonprofit organization of hospitals in the Delaware Valley
West/Southwest Philadelphia Community Meeting Boys Latin Charter School
July 10, 2012 List of Participants (18)
Name Title Agency Email Phone No. Area of Expertise
Joan Bland Director Philadelphia Health Center 4 [email protected] 215-685-7630 Community Health Center focused on medically underserved, low income and minority populations; Public Health
Gwendolyn Bailey Executive Director Youth Service, Inc. [email protected] 215-222-3262 x27 Nonprofit that strengthens the family unit, helping at-risk teens and promoting child safety
Deborah Butler
Community Outreach Coordinator
Sickle Cell Disease Association of American, Philadelphia Delaware Valley Chapter
[email protected] 215-471-8686 Nonprofit organization that serves persons and families affected by sickle cell disease. Leader of medically underserved minority population with chronic disease.
Rick Spector Community Relations Director Philadelphia Corporation for Aging
[email protected] 215-765-9000 x5340 Nonprofit organization serving as Philadelphia county’s Area Agency on Aging.
Jeannel Tillman Intercultural Family Services Healthy Start
[email protected] 215-386-1298 x289 Public Health. Nonprofit community-based organization focused on maternal and child health issues.
(215) 747-3250 Public health. Health care provider.
Patricia Pate Director Philadelphia Health Center 3 [email protected] (215) 685-7521 Community Health Center focused on medically underserved, low income and minority populations; Public
Northeast Philadelphia Community Meeting Holy Family University
May 30, 2012 List of Participants (34)
NAME Title ORGANIZATION TELEPHONE NUMBER
E-MAIL ADDRESS Area of Expertise
Kelly Andrews Health Representative
American Cancer Society
215-985-5310 [email protected] Leaders of medically underserved low income and minority populations with chronic disease needs in the community (cancer)
Karen Gurmankin Field Representative, Congressional District Office
Barry Stucker President Temple Beth Ami 215-673-2511 [email protected] Nonprofit organization- religious
Denise Mallon Legislative Assistant
Pa. Sen. Stack 215-281-2539 [email protected] Local government official
Anthony Szuszczewicz
Chairman of the Board
Nazareth Hospital 267-334-5764 [email protected] Leaders or members of medically underserved low income and minority populations with chronic disease needs in the community served by the hospital facility; Health care provider
Joe Cascerceri Nazareth Hospital 267-334-5764 [email protected] Leaders or members of medically underserved low income and minority populations with chronic disease needs in the community served by the hospital facility; Health care provider
Barbara Tantum Director of Planning
Holy Redeemer Hospital
215-938-4662 [email protected] Leaders or members of medically underserved low income and minority populations with chronic
Stan Rynkiewicz Administrator Deer Meadows 215-624-6078 [email protected] Special knowledge or expertise in public health (seniors); Nonprofit organization- senior center; Health care provider
Brian Levesque Administrator for Personal Care and Independent Living
Deer Meadows 215-624-7575 [email protected] Special knowledge or expertise in public health (seniors); Nonprofit organization- senior center; Health care provider
Lisa Sofia President and CEO
Deer Meadows 215-624-7575 [email protected] Special knowledge or expertise in public health (seniors); Nonprofit organization- senior center; Health care provider
Joy Marotto Director of Geriatric Care Management
Senior Care Partners 215-796-0005 [email protected] Special knowledge or expertise in public health (seniors); Health care provider
Veronica Gibbone Director Immaculate Mary Home
215-992-1822 [email protected] Special knowledge or expertise in public health (seniors); Nonprofit organization, religious ; Health care provider
Christopher Hess Coordinator, Center for Small Business Education, Growth & Training
Jack Conroy Owner Conroy Caterers 215-722-8082 Private business
Tiffani Coalison Sales and Marketing
Deer Meadows 267-808-2671 [email protected] Special knowledge or expertise in public health (seniors); Nonprofit organization- senior center; Health care provider
Jonathan Hood PA. Rep. Kevin Boyce 215-331-2600 [email protected] Local government official
Lorre Jackson Peer Support Specialist
DePaul House 215-438-3991 [email protected] Special knowledge or expertise in public health (homeless); Nonprofit organization with a focus on housing; Health care provider (physical and behavioral)
Rev. Dennis Boyle Pastor St. Jerome Parish 215-333-4461 [email protected] Nonprofit organization-religious
Sharon Nendza Principal St. Jerome Parish 215-333-4461 [email protected] Nonprofit organization-religious ; Academic expert
Bruce Miller President Imaging Management Associates (IMA)
Rhawnhurst NORC at Jewish Federation of Greater Philadelphia
215-320-0351 [email protected] Special knowledge or expertise in public health (older adults); Nonprofit organization – religious with a focus on seniors
Sr. Mary Ann Dillon
Senior Vice-President for Mission
Mercy Health System [email protected] Leaders or members of medically underserved low income and minority populations with chronic disease needs in the community served by the hospital facility; Health care provider
Bill Schoppe Intellectual Disabilities Director
PATH, Inc. 215-728-4634 [email protected] Special knowledge or expertise in public health- behavioral health, intellectual
Katie Cloud Representative VITAS Hospice 215-840-9128 [email protected] Special knowledge or expertise in public health (end of life); Healthcare provider
Danielle Stephens Director of Community Development
Arthritis Foundation 215-574-3060 [email protected] Special knowledge or expertise in public health (arthritis); Leaders of medically underserved low income and minority populations with chronic disease needs (arthritis); Nonprofit organization
Michael Touchstone
Fire Paramedic Service Chief, EMS training
Phila Fire Dept/EMS 215-685-8969 [email protected] Health care provider- emergency services
Francis Bachmayer
District Captain Phila Police Dept 15th
Dist
215-332-7747 [email protected] Agency with special knowledge of the health needs of the community
Marc Collazzo District Office Manager
Pa. Rep. John Taylor 215-744-2600 [email protected] Local government official
Notes: The birth rate is calculated per 1,000 women 15-44 years of age. White, Black, Asian and Other races include Latinas. Source: Pennsylvania Department of Health, Bureau of Health Statistics and Research. Calculations prepared by PHMC.
Table 2: Average Annualized Birth Rates for Adolescent Women 10-17 Years by Race and Ethnicity, 2005-2008
Service Area Philadelphia County Pennsylvania
Rate (Number)
Rate (Number)
Rate (Number)
Total 22.7 17.1 6.9 (711) (1,361) (4,427)
White 8.7 5.2 3.7 (52) (128) (1,900)
Black 22.1 20.5 19.8 (401) (891) (1,653)
Asian 9.7 6.3 3.0 (10) (23) (42)
Other 30.5 28.7 19.0 (189) (237) (604)
Latina 31.7 31.5 25.5 (255) (319) (935)
Non-Latina 18.8 14.2 5.6 (436) (990) (3,400)
Notes: The birth rate is calculated per 1,000 women 10-17 years of age. White, Black, Asian and Other races include Latinas. Source: Pennsylvania Department of Health, Bureau of Health Statistics and Research. Calculations prepared by PHMC.
The Research and Evaluation Group
PUBLIC HEALTH management corporation
Table 3: Average Annualized Percentage of Infants Born at Low Birth Weight by Race and Ethnicity, 2005-2008
Service Area Philadelphia County Pennsylvania
Percent (Number)
Percent (Number)
Percent (Number)
Total 12.5 11.3 8.3 (1,083) (2,595) (12,022)
White 9.8 7.7 7.1 (109) (469) (7,552)
Black 14.7 14.2 13.6 (681) (1,594) (2,918)
Asian 8.1 7.7 8.0 (24) (109) (424)
Other 10.6 10.1 9.0 (209) (307) (795)
Latino/a 10.0 9.5 8.7 (255) (361) (1,142)
Non-Latino/a 13.5 11.6 8.2 (796) (2,126) (10,648)
Notes: Low birth weight is defined as an infant weighing less than 2500 grams (5.5 lbs.) at birth. White, Black, Asian and Other races include Latino/as. Source: Pennsylvania Department of Health, Bureau of Health Statistics and Research. Calculations prepared by PHMC.
Table 4: Average Annualized Infant Mortality Rate by Race and Ethnicity, 2005-2008
Service Area Philadelphia County Pennsylvania
Rate (Number)
Rate (Number)
Rate (Number)
Total 11.6 12.2 7.5 (100) (279) (1,090)
White 27.2 11.6 6.4 (30) (71) (681)
Black 13.5 16.1 16.2 (63) (181) (348)
Asian ND ND 4.3 (23)
Other ND ND ND
Latino/a 8.5 8.9 7.0 (22) (34) (92)
Non-Latino/a 13.1 13.0 7.6 (77) (238) (985)
Notes: Infant mortality is defined as the death of an infant within the first year of birth and is calculated per 1,000 live infant births. White, Black, Asian and Other races include Latino/as. ND=Not Displayed. Rates are not calculated and displayed when the count is less than 10. Source: Pennsylvania Department of Health, Bureau of Health Statistics and Research. Calculations prepared by PHMC.
The Research and Evaluation Group
PUBLIC HEALTH management corporation
Table 5: Average Annualized Mortality Rates, 2005-2008
Service Area Philadelphia County Pennsylvania
Rate (Number)
Rate (Number)
Rate (Number)
All Causes 1,015.7 931.2 785.2 (4,084) (14,960) (124,136)
All Cancer 226.7 216.4 184.7 (890) (3,386) (28,616)
Female Breast Cancer 31.6 28.2 23.9 (75) (264) (2,082)
Lung Cancer 63.7 61.8 50.9 (248) (954) (7,852)
Colorectal Cancer 24.1 21.5 17.8 (93) (341) (2,802)
Note: Mortality rates are calculated per 100,000 population. Source: Pennsylvania Department of Health, Bureau of Health Statistics and Research. Calculations prepared by PHMC.
The Research and Evaluation Group
PUBLIC HEALTH management corporation
Table 6: Currently Living with HIV, including AIDS by Gender and Race/Ethnicity, 2008
Philadelphia County
Pennsylvania
Total number currently living with HIV, including AIDS
16,234 30,479
Currently living with HIV, including AIDS (rate per 100,000)*
1,121.6 244.9
Gender (percentage)
Male 69% N/A (11,261)
Female 31% N/A (4,973)
Race/Ethnicity (percentage)
White 21% N/A (3,386)
Black 66% N/A (10,789)
Latino 12% N/A (1,900)
Asian 1% N/A (109)
Other 0% N/A (50)
Notes: N/A=Data are not available. *Rates calculated by PHMC using HIV prevalence estimates provided by the Pennsylvania Department of Health divided by population estimates from the 2008 American Community Survey. Source: Pennsylvania Department of Health, HIV/AIDS Investigations-Bureau of Epidemiology and American Community Survey.
Notes: Communicable disease rates are calculated per 100,000 population. * Indicates information is from 2007-2009. Source: Pennsylvania Department of Health, Bureau of Health Statistics and Research, EpiQMS.
The Research and Evaluation Group
PUBLIC HEALTH management corporation
Table 8: Average Annualized Percentage of Women Receiving Late or No Pre-Natal Care by Race and Ethnicity, 2005-2008
Note: White, Black, Asian and Other races include Latinas. Source: Pennsylvania Department of Health, Bureau of Health Statistics and Research. Calculations prepared by PHMC.
The Research and Evaluation Group
PUBLIC HEALTH management corporation
APPENDIX D: HOUSEHOLD HEALTH SURVEY TABLES
The Research and Evaluation Group
PUBLIC HEALTH management corporation
Table 1. Health Status
Service Area Philadelphia County SEPA
2010 2012 2010 2012 2010 2012
N (%)
N (%)
N (%)
N (%)
N (%)
N (%)
Health Status
Excellent/Very Good/Good 245,400
(72.3) 242,100
(70.1) 911,900
(22.8) 923,800
(77.1) 2,577,100
(83.8) 2,623,800
(83.9)
Fair/Poor 93,900 (27.7)
103,100 (29.9)
268,600 (22.8)
274,800 (22.9)
498,200 (16.2)
501,900 (16.1)
Mental Health
Diagnosed with mental health condition 58,100 (17.2)
84,300 (24.4)
183,200 (15.6)
238,100 (19.9)
448,900 (14.6)
513,200 (16.4)
Receiving treatment for mental health condition
37,900 (65.2)
55,500 (65.9)
112,200 (61.3)
146,100 (61.3)
276,200 (61.7)
316,100 (61.8)
High level of stress 133,300
(40.3) N/A
445,000 (38.4)
N/A 1,141,200
(37.6) N/A
Currently in recovery 49,600 (14.8)
47,700 (13.9)
134,000 (11.4)
138,500 (11.7)
275,900 (9.0)
256,600 (8.3)
Body Mass Index
Overweight 109,700
(33.2) 101,500
(29.9) 393,700
(34.2) 390,100
(33.3) 1,075,100
(35.7) 1,074,300
(35.1)
Obese 121,700
(36.8) 129,700
(38.2) 369,300
(32.1) 374,200
(31.9) 791,300
(26.3) 844,100
(27.6)
Chronic Health Conditions
Ever diagnosed with cancer N/A 20,600
(6.0) N/A
88,500 (7.4)
N/A 273,700
(8.7)
Ever diagnosed with asthma 63,800 (18.8)
75,300 (21.8)
194,200 (16.5)
232,600 (19.4)
460,000 (15.0)
501,600 (16.0)
Ever diagnosed with diabetes 54,300 (16.0)
65,400 (18.9)
157,500 (13.4)
191,400 (16.0)
334,000 (10.9)
388,800 (12.4)
Ever diagnosed with high blood pressure 128,500
(38.5) 130,000
(37.8) 422,900
(36.0) 448,300
(37.5) 969,400
(31.6) 968,800
(31.0)
Notes: N/A equals not asked High level of stress is defined as seven of higher on a 10 point scale. Overweight is defined as having a BMI of 25-29 and obese is defined as having a BMI of 30 or greater. Source: PHMC’s 2010 and 2012 Southeastern Pennsylvania Household Health Surveys
The Research and Evaluation Group
PUBLIC HEALTH management corporation
Table 2. Health Insurance & Source of Care
Service Area Philadelphia County SEPA
2010 2012 2010 2012 2010 2012
N (%)
N (%)
N (%)
N (%)
N (%)
N (%)
Uninsured (18-64) 60,700 (21.0)
73,200 (24.7)
156,500 (16.1)
179,700 (18.5)
283,500 (11.4)
300,100 (12.2)
No prescription drug coverage 37,100 (13.5)
104,000 (30.5)
118,100 (11.6)
290,900 (24.5)
270,700 (9.8)
577,400 (18.6)
No regular source of care 44,100 (13.0)
53,000 (15.4)
144,700 (12.3)
156,800 (13.1)
270,700 (10.3)
349,300 (11.2)
Note: N/A equals not asked Source: PHMC’s 2010 and 2012 Southeastern Pennsylvania Household Health Surveys
The Research and Evaluation Group
PUBLIC HEALTH management corporation
Table 3. Cost Barriers to Care
In the past year DID NOT…
Service Area Philadelphia County SEPA
2010 2012 2010 2012 2010 2012
N (%)
N (%)
N (%)
N (%)
N (%)
N (%)
Receive health care due to cost 56,900 (16.7)
65,800 (19.1)
165,300 (14.0)
189,400 (15.8)
367,800 (12.2)
386,400 (12.4)
Receive dental care due to cost 107,500
(31.9) N/A
315,000 (26.8)
N/A 740,200
(24.1) N/A
Fill prescription due to cost 70,800 (20.9)
74,200 (21.5)
216,900 (18.4)
222,100 (18.5)
483,700 (15.7)
459,000 (14.7)
Note: N/A equals not asked Source: PHMC’s 2010 and 2012 Southeastern Pennsylvania Household Health Surveys
The Research and Evaluation Group
PUBLIC HEALTH management corporation
Table 4. Personal Health Behaviors
Service Area Philadelphia County SEPA
2010 2012 2010 2012 2010 2012
N (%)
N (%)
N (%)
N (%)
N (%)
N (%)
Number of fruits and vegetables consumed in typical day
0-3 servings 273,100
(84.3) 270,400
(81.5) 898,000
(78.8) 933,300
(80.2) 2,152,200
(71.7) 2,274,200
(74.2)
4 or more servings 50,700 (15.7)
61,600 (18.5)
242,000 (21.2)
230,900 (31.9)
848,900 (28.3)
792,700 (25.8)
How many times eaten at fast food restaurant in past week
None 167,400
(49.6) 162,200
(47.4) 669,200
(56.8) 654,600
(54.8) 1,841,200
(59.9) 1,806,400
(57.9)
2 or more times 79,100 (23.4)
82,100 (24.0)
211,900 (18.0)
226,300 (19.0)
474,200 (15.4)
494,800 (15.8)
Number of times exercised in past month
None 56,300 (16.7)
55,600 (16.1)
166,200 (14.1)
159,700 (13.3)
326,700 (10.7)
352,000 (11.3)
1-2 days per week 97,200 (28.8)
114,800 (33.2)
325,000 (27.6)
398,100 (33.2)
893,200 (29.2)
1,036,300 (33.1)
3 or more days per week 183,800
(54.5) 175,400
(50.7) 685,000
(58.2) 641,900
(53.5) 1,843,400
(60.2) 1,739,900
(55.6)
Smokes Cigarettes 91,600 (27.2)
94,900 (27.4)
296,100 (25.2)
278,900 (23.3)
623,500 (20.3)
568,000 (18.2)
Have tried quitting smoking in past year (among smokers) 55,400 (61.0)
54,300 (57.3)
166,100 (56.3)
158,300 (56.9)
358,900 (57.7)
319,600 (56.5)
Consumed 5 or more drinks in past month on one or more occasion N/A 48,300 (34.4)
N/A 187,300
(33.6) N/A
483,800 (29.5)
Note: N/A equals not asked Source: PHMC’s 2010 and 2012 Southeastern Pennsylvania Household Health Surveys
The Research and Evaluation Group
PUBLIC HEALTH management corporation
Table 5. Utilization of Services
In the past year DID NOT…
Service Area Philadelphia County SEPA
2010 2012 2010 2012 2010 2012
N (%)
N (%)
N (%)
N (%)
N (%)
N (%)
Visit a health care provider N/A 53,200 (16.1)
N/A 171,500
(14.9) N/A
417,700 (13.7)
Visit a dentist 147,000
(43.8) 159,000
(46.3) 460,000
(39.2) 491,900
(41.2) 926,600
(30.2) 997,300
(31.9)
DID NOT have the following screenings…
HIV test in the past year 197,600
(59.6) 191,400
56.1 797,900
(69.6) 774,300
(65.9) 2,314,000
(78.5) 2,355,700
(77.6)
Blood pressure test in the past year 40,000 (11.9)
43,000 (12.5)
136,600 (11.7)
136,900 (11.5)
290,100 (9.5)
324,400 (10.4)
Colonoscopy in past 10 years (adults 50+) 9,600 (10.5)
16,600 (14.6)
60,200 (16.0)
71,900 (17.2)
199,900 (18.0)
238,500 (20.2)
Pap smear in the past year (women) 67,800 (35.7)
75,200 (37.9)
241,100 (37.6)
268,300 (40.9)
618,000 (37.9)
696,800 (41.9)
Breast exam in the past year (women) 65,700 (34.7)
67,800 (34.0)
200,600 (35.0)
222,800 (33.7)
490,200 (30.1)
552,100 (33.0)
Mammogram in the past year (women 40+) 38,400 (34.3)
40,500 (33.0)
141,600 (35.0)
147,800 (34.8)
379,700 (34.6)
419,200 (36.8)
PSA or rectal exam for prostate cancer in past year (men 45+) 38,000 (53.1)
33,200 (51.3)
130,300 (46.1)
116,100 (45.1)
347,800 (41.9)
355,100 (45.4)
Note: N/A equals not asked Source: PHMC’s 2010 and 2012 Southeastern Pennsylvania Household Health Surveys
The Research and Evaluation Group
PUBLIC HEALTH management corporation
Table 6. Older Adult Health Status
Service Area Philadelphia County SEPA
2010 2012 2010 2012 2010 2012
N (%)
N (%)
N (%)
N (%)
N (%)
N (%)
Health Status
Excellent/Very Good/Good 23,900 (56.4)
25,900 (57.2)
125,400 (67.8)
134,400 (68.6)
413,400 (76.7)
442,900 (77.0)
Fair/Poor 18,500 (43.6)
19,300 (42.8)
59,700 (32.2)
61,600 (31.4)
125,400 (23.3)
132,100 (23.0)
Mental Health Signs of Depression 6,600 (17.7)
11,400 (27.4)
22,800 (13.6)
32,800 (18.1)
52,800 (10.6)
75,400 (14.0)
Activities of Daily Living
At least one ADL 7,700 (18.1)
10,900 (23.7)
24,400 (13.2)
31,800 (16.1)
55,000 (10.2)
69,900 (12.1)
At least one IADL 16,500 (38.8)
21,800 (47.3)
57,600 (31.1)
69,300 (35.1)
132,800 (24.5)
165,600 (28.6)
Notes: N/A equals not asked ADL refers to Activities of Daily Living. IADL refers to Instrumental Activities of Daily Living. Signs of depression is defined as having four or more depression symptoms on a ten item scale. Source: PHMC’s 2010 and 2012 Southeastern Pennsylvania Household Health Surveys
The Research and Evaluation Group
PUBLIC HEALTH management corporation
Table 7. Selected Child Health Indicators
Service Area Philadelphia County SEPA
2010 2012 2010 2012 2010 2012
N (%)
N (%)
N (%)
N (%)
N (%)
N (%)
Health Status Excellent/Very Good/Good
120,200 (93.3)
111,600 (86.8)
328,900 (95.8)
315,500 (91.1)
892,600 (96.8)
878,100 (95.4)
Fair/Poor 8,600 (6.7)
17,000 (13.2)
14,400 (4.2)
30,700 (8.9)
29,600 (3.2)
42,000 (4.6)
Body Mass Index
Overweight 13,000 (18.4)
7,600 (11.2)
29,600 (15.3)
25,500 (12.9)
88,200 (15.6)
85,700 (15.3)
Obese 19,200 (27.1)
16,800 (24.6)
49,200 (25.4)
48,400 (24.5)
108,500 (19.2)
102,200 (18.2)
No regular source of care 6,500 (5.0)
3,100 (2.5)
10,600 (3.1)
12,400 (3.6)
23,400 (2.5)
27,100 (3.0)
Did not visit dentist in the past year 15,200 (15.6)
8,600 (8.9)
32,300 (12.6)
40,500 (15.1)
65,800 (9.1)
68,000 (9.3)
Notes: N/A equals not asked Overweight is calculated for children 6-17 years and is defined as scoring in the 85
th-94
th BMI-for-age percentile.
Obese is calculated for children 6-17 years and is defined as scoring in the 95th
of greater BMI-for-age percentile. Source: PHMC’s 2010 and 2012 Southeastern Pennsylvania Household Health Surveys
The Research and Evaluation Group
PUBLIC HEALTH management corporation
APPENDIX E: ASSET MAPS
The Research and Evaluation Group
PUBLIC HEALTH management corporation
The Research and Evaluation Group
PUBLIC HEALTH management corporation
The Research and Evaluation Group
PUBLIC HEALTH management corporation
The Research and Evaluation Group
PUBLIC HEALTH management corporation
The Research and Evaluation Group
PUBLIC HEALTH management corporation
The Research and Evaluation Group
PUBLIC HEALTH management corporation
Hospitals - Philadelphia County
Name Address City State Zip Code Type
Albert Einstein Medical Center Phil 5501 Old York Road Philadelphia PA 19141 Hospital
Aria Health Frankford 4900 Frankford Ave Philadelphia PA 19124 Hospital
Aria Health Torresdale 10800 Knights Road Philadelphia PA 19114 Hospital
Belmont Behavioral Health 4200 Monument Road Philadelphia PA 19131 Hospital
Cancer Treatment Centers of America 1331 East Wyoming Avenue Philadelphia PA 19124 Hospital
Chestnut Hill Hospital 8835 Germantown Ave Philadelphia PA 19118 Hospital
Children's Hospital of Philadelphia 34th and Civic Center Blv Philadelphia PA 19104 Hospital
Fox Chase Cancer Center 333 Cottman Ave Philadelphia PA 19111 Hospital
Friends Hospital 4641 Roosevelt Boulevard Philadelphia PA 19124 Hospital
Girard Medical Center 8th Street and Girard Ave Philadelphia PA 19122 Hospital
Hahnemann University Hospital 230 N Broad St Philadelphia PA 19102 Hospital
Hospital of the University of Penns 3400 Spruce Street Philadelphia PA 19104 Hospital
Jeanes Hospital 7600 Central Ave Philadelphia PA 19111 Hospital
Magee Rehabilitation Hospital 1513 Race Street Philadelphia PA 19102 Hospital
Mercy Hospital of Philadelphia 501 S 54th Street Philadelphia PA 19143 Hospital
Methodist Hospital 2301 South Broad Street Philadelphia PA 19148 Hospital
Nazareth Hospital 2601 Holme Avenue Philadelphia PA 19152 Hospital
Penn Presbyterian Medical Center 51 North 39th Street Philadelphia PA 19104 Hospital
Pennsylvania Hospital 800 Spruce Street Philadelphia PA 19107 Hospital
Philadelphia VA Medical Center 3900 Woodland Ave Philadelphia PA 19104 Hospital
Roxborough Memorial Hospital 5800 Ridge Ave Philadelphia PA 19128 Hospital
Saint Christopher's Hospital for Ch N. Front St & W. Erie Ave Philadelphia PA 19134 Hospital
Saint Joseph's Hospital 16th Street and Girard Av Philadelphia PA 19130 Hospital
Temple University Hospital 3401 North Broad St Philadelphia PA 19140 Hospital
Temple University Hospital- Episcopal 100 E. Lehigh Avenue Philadelphia PA 19125 Hospital
Thomas Jefferson University Hospital 111 South 11th Street Philadelphia PA 19107 Hospital
Wills Eye Institute 840 Walnut Street Philadelphia PA 19107 Hospital
Health Assets - Philadelphia County
Name Address City State Zip Code Type
GPHA 4th Street Behavioral Health 1401 South 4th Street Philadelphia PA 19147 Community Health Center
FPCN Abbottsford Falls Family Practice and Counseling 4700 Wissahickon Avenue Philadelphia PA 19144 Community Health Center
Broad Street Health Center 1415 North Broad Street Philadelphia PA 19122 Community Health Center
GPHA Chinatown Medical Services 930 Washington Avenue Philadelphia PA 19147 Community Health Center
Covenant House - Mt Pleasant Health Center 8125 Stenton Ave Philadelphia PA 19150 Community Health Center
Covenant House Health Services 251 East Bringhurst Street Philadelphia PA 19144 Community Health Center
The Research and Evaluation Group
PUBLIC HEALTH management corporation
FPCN Eleventh Street Family Health Services of Drexel 800 North 11th Street Philadelphia PA 19123 Community Health Center
Esperanza Health Center 4417 North 6th Street Philadelphia PA 19140 Community Health Center
Esperanza Health Center 3156 Kensington Avenue Philadelphia PA 19134 Community Health Center
Esperanza Health Center 2940 North 5th Street Philadelphia PA 19133 Community Health Center
DVCH Fairmount Primary Care Center 1412 Fairmount Avenue Philadelphia PA 19130 Community Health Center
GPHA Frankford Health Center 4500 Frankford Avenue Philadelphia PA 19124 Community Health Center
Haddington Health Center 5619 Vine Street Philadelphia PA 19139 Community Health Center
Public Health Center #1 500 South Broad St Philadelphia PA 19146 Community Health Center
Public Health Center #10 2230 Cottman Avenue Philadelphia PA 19149 Community Health Center
Public Health Center #2 1720 South Broad Street Philadelphia PA 19145 Community Health Center
Public Health Center #3 555 South 43rd St Philadelphia PA 19104 Community Health Center
Public Health Center #4 4400 Haverford Ave Philadelphia PA 19104 Community Health Center
Public Health Center #5 1920 North 20th Street Philadelphia PA 19121 Community Health Center
Public Health Center #6 321 West Girard Ave Philadelphia PA 19123 Community Health Center
Public Health Center #9 131 East Chelten Ave Philadelphia PA 19144 Community Health Center
GPHA Hunting Park Health Center 1999 West Hunting Park Avenue Philadelphia PA 19140 Community Health Center
DVCH Maria de los Santos Health Center 455 West Allegheny Avenue Philadelphia PA 19140 Community Health Center
Mary Howard Health Center 125 South 9th Street Philadelphia PA 19107 Community Health Center
QCHC Meade Elementary School 18th and Oxford Streets Philadelphia PA 19121 Community Health Center
DVCH Parkview OB-Gyn 1331 East Wyoming Ave Philadelphia PA 19124 Women's Health Center
PHMC Health Connection 1035 West Berks Street Philadelphia PA 19122 Community Health Center
QCHC Family Health Center 2501 West Lehigh Avenue Philadelphia PA 19132 Community Health Center
Rising Sun Health Center 500 Adams Avenue Philadelphia PA 19120 Community Health Center
Sayre Health Center 5800 Walnut Street Philadelphia PA 19139 Community Health Center
GPHA Southeast Health Center 800 Washington Avenue Philadelphia PA 19147 Community Health Center
Public Health Strawberry Mansion Health Center 2840 W. Dauphin Street Philadelphia PA 19132 Community Health Center
FPCN Health Annex 6120 Woodland Avenue Philadelphia PA 19142 Community Health Center
QCHC Vaux Middle School 2300 W Master St Philadelphia PA 19121 Community Health Center
GPHA Wilson Park Medical Center 2520 Snyder Avenue Philadelphia PA 19145 Community Health Center
GPHA Woodland Avenue Medical Center 5000 Woodland Ave Philadelphia PA 19143 Community Health Center
QCHC Finley 2813 West Diamond Street Philadelphia PA 19121 Community Health Center
QCHC Cooke Elementary School 1300 West Louden Street Philadelphia PA 19141 Community Health Center
Concentra Urgent Care 7000 Holstein Ave Philadelphia PA 19153 Urgent Care Center
Concentra Urgent Care 2010 Levick St Philadelphia PA 19149 Urgent Care Center
Drexel Convenient Care Center 1625 Chestnut St Philadelphia PA 19103 Urgent Care Center
Advanced Urgent Care 5058 City Ave Philadelphia PA 19131 Urgent Care Center
University of Pennsylvania Pain Center? 1840 South St Philadelphia PA 19146 Urgent Care Center
The Research and Evaluation Group
PUBLIC HEALTH management corporation
North Philadelphia Health System: Urgent Care Center 16 Girard Ave Philadelphia PA 19122 Urgent Care Center
CVS 6501 Harbison Avenue Philadelphia PA 19149 Urgent Care Center
CVS 1301 Rhawn Street Philadelphia PA 19444 Urgent Care Center
Social Assets - Philadelphia County
Name Address City State Zip Type
Columbia North YMCA 1400 N. Broad St Philadelphia PA 19121 YMCA/YWCA
Roxborough YMCA 7201 Ridge Ave Philadelphia PA 19128 YMCA/YWCA
West Philadelphia YMCA 5120 Chestnut Street Philadelphia PA 19139 YMCA/YWCA
Center in the Park 5818 Germantown Ave Philadelphia PA 19144 Senior Services
CSS Norris Square Senior Citizen Center 2121 North Howard St Philadelphia PA 19122 Senior Services
CSS St. Anne's Senior Citizen Center 2607 East Cumberland St Philadelphia PA 19125 Senior Services
CSS St. Charles Senior Community Center 1941 Christian St Philadelphia PA 19146 Senior Services
CSS Star Harbor Senior Center 4700 Springfield Ave Philadelphia PA 19143 Senior Services
Haddington Multi-Services for Older Adults 5331 Haverford Ave Philadelphia PA 19139 Senior Services
JCCs Klein Branch Senior Center and Russia 10100 Jamison Ave Philadelphia PA 19116 Senior Services
JCC's Stiffel Senior Center 604 West Porter St Philadelphia PA 19148 Senior Services
JCCs Tabas House Satellite 2101 Strahle St Philadelphia PA 19152 Senior Services
Juniata Park Older Adult Center 1251 East Sedgley Ave Philadelphia PA 19134 Senior Services
Lehigh Senior Center 1701 West Lehigh Ave Philadelphia PA 19132 Senior Services
Lutheran Settlement House Senior Center 1340 Frankford Ave Philadelphia PA 19125 Senior Services
Mann Older Adult Center 3201 North 5th Street Philadelphia PA 19140 Senior Services
Marconi Senior Citizen Program/Samuel S. F 2407 South Broad St Philadelphia PA 19148 Senior Services
Martin Luther King Older Adult Center 2101 West Cecil B. Moore Ave Philadelphia PA 19121 Senior Services
Nationalities Senior Program 11th & Rockland Streets Philadelphia PA 19141 Senior Services
North Broad Street Senior Center 1438 North Broad St Philadelphia PA 19121 Senior Services
Northeast Older Adult Center 8101 Bustleton Ave Philadelphia PA 19152 Senior Services
Older Adult Sunshine Center 137 South 58th St Philadelphia PA 19139 Senior Services
Olney Senior Program 5900 North Fifth St Philadelphia PA 19120 Senior Services
On Lok House 219 North 10th St Philadelphia PA 19107 Senior Services
Peter Bressi N.E. Senior Center 4744 Frankford Ave Philadelphia PA 19124 Senior Services
PHA Cassie L. Holly Satellite 2100 Dickinson St Philadelphia PA 19146 Senior Services
PHA Emlen Arms Satellite 6733 Emlen St Philadelphia PA 19119 Senior Services
PHA Wilson Park Satellite 2508 Jackson St Philadelphia PA 19145 Senior Services
Philadelphia Senior Center - Main Branch 509 South Broad St Philadelphia PA 19147 Senior Services
Philadelphia Senior Center - Tioga Branch 1531 West Tioga St Philadelphia PA 19140 Senior Services
Philadelphia Senior Center Coffee Cup Sate 247 South 10th St Philadelphia PA 19107 Senior Services
South Philadelphia Older Adult Center 1430 East Passyunk Ave Philadelphia PA 19147 Senior Services
The Research and Evaluation Group
PUBLIC HEALTH management corporation
Southwest Senior Center 6916 Elmwood Ave Philadelphia PA 19142 Senior Services
Spring Garden Center 1221 Spring Garden St Philadelphia PA 19123 Senior Services
The Center at Journey's Way 403 Rector St Philadelphia PA 19128 Senior Services
West Oak Lane Senior Center 7210 Ogontz Ave Philadelphia PA 19138 Senior Services
West Philadelphia Senior Community Center 1016 North 41st St Philadelphia PA 19104 Senior Services
Outreach Coordination Center 1515 Fairmount Avenue Philadelphia PA 19130 Community Center
Maternity Care Coalition 2000 Hamilton Street Philadelphia PA 19130 Community Center
Salvation Army HQ 701 North Broad Street Philadelphia PA 19123 Community Center
The Salvation Army Citadel and Korean 5830 Rising Sun Ave Philadelphia PA 19120 Community Center
The Salvation Army Developmental Disability 701 North Broad Street Philadelphia PA 19123 Community Center
The Salvation Army Pioneer 1920 E Allegheny Ave Philadelphia PA 19134 Community Center
The Salvation Army Ray and Joan Kroc Center 4200 Wissahickon Ave Philadelphia PA 19129 Community Center
The Salvation Army Roxborough 6730 Ridge Avenue Philadelphia PA 19128 Community Center
The Salvation Army Tabernacle 3150 N. Mascher St Philadelphia PA 19133 Community Center
The Salvation Army Temple 1340 Brown Street Philadelphia PA 19123 Community Center
The Salvation Army Eliza Shirley House 1320 Arch Street Philadelphia PA 19107 Community Center
The Salvation Army Emergency Disaster Services 701 N. Broad St. Philadelphia PA 19123 Community Center
The Salvation Army - West Philadelphia 5501 Market St. Philadelphia PA 19139 Community Center
The Salvation Army Ivy Residence Senior Ho 4051 Ford Road Philadelphia PA 19131 Community Center
The Salvation Army Adult Rehabilitation Center 4555 Pechin Street Philadelphia PA 19128 Community Center
The Salvation Army Booth Manor Residence S 5522 Arch Street Philadelphia PA 19139 Community Center
The Salvation Army Red Shield Family Residence 715 North Broad Street Philadelphia PA 19123 Community Center
The Salvation Army Soups' On! Project 4050 Conshohocken State Road Philadelphia PA 19131 Education/Employment Center
Old Pine Community Center 401 Lombard Street Philadelphia PA 19147 Community Center
People's Emergency Center 325 N. 39th Street Philadelphia PA 19104 Homeless Services/Shelter
Office of Supportive Housing 141 N. Juniper Street Philadelphia PA 19107 Homeless Services/Shelter
Eliza Shirley House 1320 Arch Street Philadelphia PA 19107 Homeless Services/Shelter
Ridge Avenue Shelter 1360 Ridge Avenue Philadelphia PA 19107 Homeless Services/Shelter
Mercy Hospice 334 South 13th Street Philadelphia PA 19107 Homeless Services/Shelter
People's Emergency Center 3902 Spring Garden Street Philadelphia PA 19104 Homeless Services/Shelter
Wayne Hall 5200 Wayne Avenue Philadelphia PA 19144 Homeless Services/Shelter
Brotherhood Mission 401 E. Girard Avenue Philadelphia PA 19125 Homeless Services/Shelter
Ontario St. Baptist Mission 114 W. Ontario St. Philadelphia PA 19140 Homeless Services/Shelter
St. John's Hospice 1221 Race Street Philadelphia PA 19105 Homeless Services/Shelter
Sunday Breakfast Association 302 North 13th Street Philadelphia PA 19105 Homeless Services/Shelter
Whosoever Gospel Mission 101 E. Chelten Avenue Philadelphia PA 19144 Homeless Services/Shelter
Covenant House 417 Callowhill Street Philadelphia PA 19123 Homeless Services/Shelter
The Research and Evaluation Group
PUBLIC HEALTH management corporation
Department of Human Services Division of C 1515 Arch Street Philadelphia PA 19102 Homeless Services/Shelter
Voyage House 1431 Lombard Street Philadelphia PA 19146 Homeless Services/Shelter
Youth Emergency Services 1526 Fairmount Avenue Philadelphia PA 19130 Homeless Services/Shelter
Traveler's Aid Society 121 N. Broad Street Philadelphia PA 19107 Homeless Services/Shelter
Women Against Abuse 100 South Broad Street Philadelphia PA 19110 Homeless Services/Shelter
VA Drop In Center 213 N. 4th Street Philadelphia PA 19106 Social Services
Philadelphia Committee to End Homelessness 802 N. Broad Street Philadelphia PA 19130 Homeless Services/Shelter
University City Hospitality Coalition 3741 Walnut Street Philadelphia PA 19104 Homeless Services/Shelter
Gateway Services Center 907 Hamilton Street Philadelphia PA 19107 Homeless Services/Shelter
West Philadelphia WIC Office 4148 Lancaster Avenue Philadelphia PA 19104 WIC
City Health Center #5 1900 N. 20th Street Philadelphia PA 19121 WIC
Frankford Avenue WIC Office 4806 Frankford Avenue Philadelphia PA 19124 WIC
Roxborough Health Center 5830 Henry Avenue Philadelphia PA 19128 WIC
Mobile Unit 642 N. Broad Street Philadelphia PA 19130 WIC
North Philadelphia WIC Office 3141 Germantown Avenue Philadelphia PA 19133 WIC
Lehigh WIC Office 217 Lehigh Avenue Philadelphia PA 19133 WIC
Kensington WIC Office 3047 Kensington Avenue Philadelphia PA 19134 WIC
Aramingo Avenue WIC Office 2401 E.Tioga Avenue Philadelphia PA 19134 WIC
Woodland Avenue Health Center 1741 S. 54th Street Philadelphia PA 19143 WIC
Germantown WIC Office Germantown and Mt. Pleasant A Philadelphia PA 19144 WIC
South Philadelphia WIC Office 1536 S. Broad Street Philadelphia PA 19147 WIC
Northeast WIC Office 8570 Bustleton Avenue Philadelphia PA 19152 WIC
Food Assets - Philadelphia County
Name Address City State Zip Code Type
22nd and Tasker 22nd and Tasker St Philadelphia PA 19145 Farmers Market/Farm Stand
29th and Wharton 29th and Wharton St Philadelphia PA 19146 Farmers Market/Farm Stand
33rd and Diamond 2140 North 33rd Street Philadelphia PA 19121 Farmers Market/Farm Stand
58th and Chester 58th and Chester St Philadelphia PA 19143 Farmers Market/Farm Stand
Broad and Snyder Broad and Snyder St Philadelphia PA 19145 Farmers Market/Farm Stand
Broad and South Broad and South St Philadelphia PA 19147 Farmers Market/Farm Stand
Cecil B Moore Cecil B Moore Ave & N Broad St. Philadelphia PA 19122 Farmers Market/Farm Stand
Chestnut Hill Growers Market Winston Rd & Germantown Ave Philadelphia PA 19118 Farmers Market/Farm Stand
Clark Park 43rd St and Baltimore Ave Philadelphia PA 19104 Farmers Market/Farm Stand
Cliveden Park Chew Ave and Johnson St Philadelphia PA 19119 Farmers Market/Farm Stand
Dickinson E Moyamensing and Morris St Philadelphia PA 19148 Farmers Market/Farm Stand
Drexel University 33rd and Market St Philadelphia PA 19104 Farmers Market/Farm Stand
East Falls Kelly Dr & Ridge Ave Philadelphia PA 19129 Farmers Market/Farm Stand
The Research and Evaluation Group
PUBLIC HEALTH management corporation
Fair Food 12th st and Arch St. Philadelphia PA 19107 Farmers Market/Farm Stand
Fairhill Square 4th St and Lehigh Ave Philadelphia PA 19133 Farmers Market/Farm Stand
Fairmount Farmers Market 22nd St and Fairmont Ave Philadelphia PA 19130 Farmers Market/Farm Stand
Farm 51 51st St and Chester Ave Philadelphia PA 19143 Farmers Market/Farm Stand
Fitler Square Market 23rd and Pine St Philadelphia PA 19103 Farmers Market/Farm Stand
Fountain 11th and Tasker St Philadelphia PA 19147 Farmers Market/Farm Stand
Francisville 1400 Ridge Ave Philadelphia PA 19130 Farmers Market/Farm Stand
Frankford and Berks Frankford Ave and East Berks St Philadelphia PA 19125 Farmers Market/Farm Stand
Frankford Transportation Center Bridge St and Frankford Ave Philadelphia PA 19124 Farmers Market/Farm Stand
Germantown 6026 Germantown Ave Philadelphia PA 19144 Farmers Market/Farm Stand
Girard and 27th Farm Stand 27th St and Girard Ave Philadelphia PA 19130 Farmers Market/Farm Stand
Gorgas Park Ridge Ave at Acorn St Philadelphia PA 19128 Farmers Market/Farm Stand
Greensgrow Farm 2501 E Cumberland Ave Philadelphia PA 19125 Farmers Market/Farm Stand
Grumblethorpe House 5267 Germantown Ave Philadelphia PA 19144 Farmers Market/Farm Stand
Haddington 52nd St and Haverford Ave Philadelphia PA 19139 Farmers Market/Farm Stand
Headhouse 2nd and Lombard St Philadelphia PA 19147 Farmers Market/Farm Stand
Henry Got Crops 7100 Henry Ave Philadelphia PA 19128 Farmers Market/Farm Stand
Hunting Park W Hunting Park Ave and Old York Philadelphia PA 19140 Farmers Market/Farm Stand
IBC Market 1901 Market St Philadelphia PA 19103 Farmers Market/Farm Stand
Jefferson 10th and Chestnut St Philadelphia PA 19107 Farmers Market/Farm Stand
Lancaster Ave 3700 Lancaster Ave Philadelphia PA 19104 Farmers Market/Farm Stand
Mill Creek Farm 4901 Brown Street Philadelphia PA 19139 Farmers Market/Farm Stand
Mt Airy (Weaver's Way) Carpenter Lane & Greene St Philadelphia PA 19119 Farmers Market/Farm Stand
Norris Square Park N Hancock St & Diamond St Philadelphia PA 19122 Farmers Market/Farm Stand
Olney Transportation Center Broad St and Olney Ave Philadelphia PA 19141 Farmers Market/Farm Stand
Overbrook Farms 6376 City Ave Philadelphia PA 19151 Farmers Market/Farm Stand
Oxford Circle 900 East Howell St Philadelphia PA 19149 Farmers Market/Farm Stand
Farmers Market at the Piazza 1033 N 2nd St Philadelphia PA 19123 Farmers Market/Farm Stand
Rittenhouse 18th and Walnut St Philadelphia PA 19103 Farmers Market/Farm Stand
Schuylkill River Park Market 25th and Spruce Philadelphia PA 19103 Farmers Market/Farm Stand
SEPTA Farmstand 1234 Market St Philadelphia PA 19107 Farmers Market/Farm Stand
Shar-Nels 2211 N21st St Philadelphia PA 19132 Farmers Market/Farm Stand
South and Passyunk South St and Passyunk Ave Philadelphia PA 19147 Farmers Market/Farm Stand
Suburban Station 16th St Concourse Philadelphia PA 19102 Farmers Market/Farm Stand
The Porch 30th Street Station Philadelphia PA 19104 Farmers Market/Farm Stand
University Square 36th and Walnut St Philadelphia PA 19104 Farmers Market/Farm Stand
Urban Tree Harvest 53rd St Between Wyalusing and P Philadelphia PA 19131 Farmers Market/Farm Stand
The Research and Evaluation Group
PUBLIC HEALTH management corporation
Wadsworth 1555 Wadsworth Ave Philadelphia PA 19150 Farmers Market/Farm Stand
Walnut Hill 4610 Market St Philadelphia PA 19139 Farmers Market/Farm Stand
Weavers Way Community Programs Farm Stand 8424 Germantown Ave Philadelphia PA 19118 Farmers Market/Farm Stand
West Oak Lane 7200 Ogontz Ave Philadelphia PA 19138 Farmers Market/Farm Stand
48th & Baltimore Farmers Market 801 South 48th Street Philadelphia PA 19143 Farmers Market/Farm Stand
Academy Fresh 400 Washington Avenue Philadelphia PA 19147 Farmers Market/Farm Stand
Bella Vista 9th & Montrose St Philadelphia PA 19147 Farmers Market/Farm Stand
Broad and Ritner Broad and Ritner St Philadelphia PA 19148 Farmers Market/Farm Stand
Chestnut Hill Flower & Garden 7639 Germantown Ave Philadelphia PA 19118 Farmers Market/Farm Stand
Drexel Farmers Market 3290 Chestnut Street Philadelphia PA 19104 Farmers Market/Farm Stand
Dutch Country Farmers Market 2031 Cottman Avenue Philadelphia PA 19149 Farmers Market/Farm Stand
Federation of Neighborhood Centers Teens 8TH & Poplar St Philadelphia PA 19123 Farmers Market/Farm Stand
Firehouse FM 701 South 50th Street & Baltimore Philadelphia PA 19143 Farmers Market/Farm Stand
Fitler Square 23rd Street & Pine Street Philadelphia PA 19103 Farmers Market/Farm Stand
Fountain Farmers Market East Passyunk Avenue and Tasker Philadelphia PA 19148 Farmers Market/Farm Stand
Francisville Fm 1400 Ridge Ave Philadelphia PA 19130 Farmers Market/Farm Stand
Germantown 6700 Germantown Avenue Philadelphia PA 19119 Farmers Market/Farm Stand
Germantown Kitchen Garden 215 E Penn St Philadelphia PA 19144 Farmers Market/Farm Stand
Growing for Good 1552 Wadsworth Ave Philadelphia PA 19150 Farmers Market/Farm Stand
Mayor's Farmers Market 15th St. and JFK Blvd. Philadelphia PA 19107 Farmers Market/Farm Stand
MFSP Heritage Farm 4300 Monument Road Philadelphia PA 19131 Farmers Market/Farm Stand
Neighborhood Foods 53RD & Wyalusing Philadelphia PA 19131 Farmers Market/Farm Stand
New Growth Project 27th & Master Street Philadelphia PA 19121 Farmers Market/Farm Stand
Norris Square W Susquehanna Ave & Howard St Philadelphia PA 19122 Farmers Market/Farm Stand
Palmer Park Farmers Market Frankford Avenue & East Palmer Philadelphia PA 19125 Farmers Market/Farm Stand
Penn Campus 36th & Walnut Streets Philadelphia PA 19104 Farmers Market/Farm Stand
Penn University Farmers Market 3600 Walnut Street Philadelphia PA 19104 Farmers Market/Farm Stand
Pennsy Flea Market 1600 S Warfield St Philadelphia PA 19145 Farmers Market/Farm Stand
Pennypack Farm 43rd and Baltimore Philadelphia PA 19104 Farmers Market/Farm Stand
Prestons Paradise 839 N Preston St Philadelphia PA 19104 Farmers Market/Farm Stand
Produce Connection 1812 E Allegheny Ave Philadelphia PA 19134 Farmers Market/Farm Stand
Produce Farmers Market & Deli 2043 West Oregon Avenue Philadelphia PA 19145 Farmers Market/Farm Stand
Right Triangle Inc 1201 South 19th Street Philadelphia PA 19146 Farmers Market/Farm Stand
Sals Produce Plus 676 North Broad Street Philadelphia PA 19130 Farmers Market/Farm Stand
Share Food Program 2901 West Hunting Park Avenue Philadelphia PA 19129 Farmers Market/Farm Stand
Stenton Family Manor 1300 E Tulpehocken St Philadelphia PA 19138 Farmers Market/Farm Stand
The Point Breeze 1529 South 22nd Street Philadelphia PA 19146 Farmers Market/Farm Stand
The Research and Evaluation Group
PUBLIC HEALTH management corporation
West Philadelphia Fresh Food Hub 38th & Lancaster Ave Philadelphia PA 19104 Farmers Market/Farm Stand
Greater Philadelphia Coalition Against Hu 1725 Fairmount Ave. Philadelphia PA 19130 Food Pantry/Cupboard
Philabundance 3616 South Galloway Street Philadelphia PA 19148 Food Pantry/Cupboard
St. Mark's Church 1625 Locust St. Philadelphia PA 19103 Food Pantry/Cupboard
Sidney Hillman Apts. 22 S. 22nd St. Philadelphia PA 19103 Food Pantry/Cupboard
First African Presbyterian Church 4159 W. Girard Ave Philadelphia PA 19104 Food Pantry/Cupboard
One Day At A Time 4016 Lancaster Ave. Philadelphia PA 19104 Food Pantry/Cupboard
Chester Dionna Habitat 4086 Haverford Ave Philadelphia PA 19104 Food Pantry/Cupboard
Mantua Haverford Community Center 631 N. 39th St Philadelphia PA 19104 Food Pantry/Cupboard
Mantua Family Center 3543 Fairmount Ave Philadelphia PA 19104 Food Pantry/Cupboard
Intercultural Family Services 4225 Chestnut St Philadelphia PA 19104 Food Pantry/Cupboard
Indomitable Spirit 437 N. 42nd Street Philadelphia PA 19104 Food Pantry/Cupboard
Holy Tabernacle Church 3835 Haverford Ave Philadelphia PA 19104 Food Pantry/Cupboard
Greater Love Chapel 437 N. 40th Street Philadelphia PA 19104 Food Pantry/Cupboard
Grace Evangelical Lutheran Church 3529 Haverford Ave. Philadelphia PA 19104 Food Pantry/Cupboard
Christian M. F. Baptist Church 533 N. 36th St Philadelphia PA 19104 Food Pantry/Cupboard
40th Street Church of God 651 N. 40th Street Philadelphia PA 19104 Food Pantry/Cupboard
New Bethlehem Baptist Church Preston & Aspen Sts. Philadelphia PA 19104 Food Pantry/Cupboard
Peoples Emergency Center 3902 Spring Garden St. Philadelphia PA 19104 Food Pantry/Cupboard
Mantua Scattered Site 3804 Mt. Vernon St Philadelphia PA 19104 Food Pantry/Cupboard
Community Church of God 42nd & Parrish St Philadelphia PA 19104 Food Pantry/Cupboard
Church of Hope & Faith Inc 662 N. 39th St. Philadelphia PA 19104 Food Pantry/Cupboard
Mercy Douglass Ctr. Shepard 642 N. 41st St Philadelphia PA 19104 Food Pantry/Cupboard
Interfaith Food Cupboard 3600 Baring St Philadelphia PA 19104 Food Pantry/Cupboard
Gate to Heaven Ministry 3415 Haverford Ave Philadelphia PA 19104 Food Pantry/Cupboard
Sarah Allen Seniors 4035 Parrish Street Philadelphia PA 19104 Food Pantry/Cupboard
Second Antioch Baptist Church 912 N. 41st St. Philadelphia PA 19104 Food Pantry/Cupboard
Victory Baptist Church 4238 Walllace Street Philadelphia PA 19104 Food Pantry/Cupboard
Metropolitan Church 3500 Baring St Philadelphia PA 19104 Food Pantry/Cupboard
St. John United Church of God 856 N. 40th Street Philadelphia PA 19104 Food Pantry/Cupboard
Sharing & Caring Center 500 N. 39th St. Philadelphia PA 19104 Food Pantry/Cupboard
St. Mary’s Church 3916 Locust Walk Philadelphia PA 19104 Food Pantry/Cupboard
Caring About Sharing Inc. 3900 Spring Garden Street Philadelphia PA 19104 Food Pantry/Cupboard
United Emergency Action 1117 N. 40th Street Philadelphia PA 19104 Food Pantry/Cupboard
West Phila. SDA Church 4018 Fairmount Avenue Philadelphia PA 19104 Food Pantry/Cupboard
Ralston/Mercy Douglass House 3817 Market St Philadelphia PA 19104 Food Pantry/Cupboard
Old St. Joseph's Church 321 Willings Alley Philadelphia PA 19106 Food Pantry/Cupboard
The Research and Evaluation Group
PUBLIC HEALTH management corporation
St. Peters Church 313 Pine St. Philadelphia PA 19106 Food Pantry/Cupboard
Fillipino American Congress 251 Lawrence St Philadelphia PA 19106 Food Pantry/Cupboard
Philadelphia Community Health Alternatives 1201 Chestnut St., 3rd Fl Philadelphia PA 19107 Food Pantry/Cupboard
First Church of the Nazarene 1707 Shelmire Ave Philadelphia PA 19111 Food Pantry/Cupboard
Oxford Village Food Cupboard 6150 Algon Ave Philadelphia PA 19111 Food Pantry/Cupboard
Mt. Olive Church of God 7244 Rising Sun Avenue Philadelphia PA 19111 Food Pantry/Cupboard
All Saints 9601 Frankford Ave Philadelphia PA 19114 Food Pantry/Cupboard
Memorial Church of St. Luke 1946 Welsh Rd Philadelphia PA 19115 Food Pantry/Cupboard
St. Paul's Church 22 E. Chestnut Hill Ave Philadelphia PA 19118 Food Pantry/Cupboard
Germantown SDA Church 200 E. Cliveden St Philadelphia PA 19119 Food Pantry/Cupboard
Asian Social Services Center 4943 N. 5th St Philadelphia PA 19120 Food Pantry/Cupboard
Bethel Full Gospel 520 W. Roosevelt Blvd Philadelphia PA 19120 Food Pantry/Cupboard
Incarnation of Our Lord Church 5105 N. 5th St Philadelphia PA 19120 Food Pantry/Cupboard
Moriah Baptist Church 4815-17 N. Front St Philadelphia PA 19120 Food Pantry/Cupboard
Feltonville Presbyterian 214 E. Wyoming Ave Philadelphia PA 19120 Food Pantry/Cupboard
Faith Tabernacle Church of God 2431 W. Master Street Philadelphia PA 19121 Food Pantry/Cupboard
Christ Evangel. Lutheran Church 3006 W. Diamond St Philadelphia PA 19121 Food Pantry/Cupboard
Christian Love Baptist Church 1801 N. 32nd St Philadelphia PA 19121 Food Pantry/Cupboard
Church of the Advocate 2121 N. Gratz St. Philadelphia PA 19121 Food Pantry/Cupboard
Cornerstone Baptist Church 2117 N. 33rd St Philadelphia PA 19121 Food Pantry/Cupboard
Fair Havens Human Support 2343 Ridge Ave. Philadelphia PA 19121 Food Pantry/Cupboard
Johnson Concern & Care Center. 2229 W. Thompson St Philadelphia PA 19121 Food Pantry/Cupboard
Johnson Homes Tenant Council 2500 W. Norris St Philadelphia PA 19121 Food Pantry/Cupboard
Kelsey Keys 1756 N. 25th St. Philadelphia PA 19121 Food Pantry/Cupboard
Madeira Family Center 2123 N. Gratz St. Philadelphia PA 19121 Food Pantry/Cupboard
Mt. Olive Holy Temple 1469 N. Broad Street Philadelphia PA 19121 Food Pantry/Cupboard
Family Resource Center 2114 N. Gratz Street Philadelphia PA 19121 Food Pantry/Cupboard
Montgomery Townhouse 2002 W. Berks St Philadelphia PA 19121 Food Pantry/Cupboard
New Salem Baptist Church 1721-23 N. Croskey St Philadelphia PA 19121 Food Pantry/Cupboard
Senior Citizens Community 2124 Cecil B. Moore Ave Philadelphia PA 19121 Food Pantry/Cupboard
Special Needs 1632 N. 29th St Philadelphia PA 19121 Food Pantry/Cupboard
Susquehanna 1815 Susquehanna Ave Philadelphia PA 19121 Food Pantry/Cupboard
Deliverance Revival Temple 2000 N. 18th Street Philadelphia PA 19121 Food Pantry/Cupboard
Golden Star Baptist Church 1635 27th Street Philadelphia PA 19121 Food Pantry/Cupboard
Wayland Temple B.C. 2500 Cecil B. Moore Ave. Philadelphia PA 19121 Food Pantry/Cupboard
New Mt. Zion Pentacostal COGIC 1501 N. 20th Street Philadelphia PA 19121 Food Pantry/Cupboard
New Greater Straightway 1705 N. 7th St Philadelphia PA 19122 Food Pantry/Cupboard
The Research and Evaluation Group
PUBLIC HEALTH management corporation
A.P.M. Assoc. Inc. 2147 N. 6th St Philadelphia PA 19122 Food Pantry/Cupboard
Berean Presbyterian Church 2101 N. Broad St. Philadelphia PA 19122 Food Pantry/Cupboard
Yorktown Community 1300 W. Jefferson St Philadelphia PA 19122 Food Pantry/Cupboard
Harris Plaza 1240 N. 10th St Philadelphia PA 19122 Food Pantry/Cupboard
Mt Olive Holy Temple 1469 N. Broad St Philadelphia PA 19122 Food Pantry/Cupboard
Norris Homes Tenant Council 1915 N. 11th St Philadelphia PA 19122 Food Pantry/Cupboard
Penrose Recreation Center 1101 W. Susquehanna St. Philadelphia PA 19122 Food Pantry/Cupboard
St. Boniface Church 174 W. Diamond St. Philadelphia PA 19122 Food Pantry/Cupboard
St. Malachy Church 1429 N. 11th Street Philadelphia PA 19122 Food Pantry/Cupboard
Lewis Temple Pentecostal Church 509 W. Diamond St Philadelphia PA 19122 Food Pantry/Cupboard
Ludlow Community 1437 N. 7th St. Philadelphia PA 19122 Food Pantry/Cupboard
West Poplar 637 N. 13th St Philadelphia PA 19123 Food Pantry/Cupboard
St. Paul's Baptist Church 10th & Wallace St Philadelphia PA 19123 Food Pantry/Cupboard
Friends Neighborhood Guild 735 Fairmount Ave Philadelphia PA 19123 Food Pantry/Cupboard
Salvation Army Temple 1340 Brown St Philadelphia PA 19123 Food Pantry/Cupboard
Bebashi Inc. 1217 Spring Garden St Philadelphia PA 19123 Food Pantry/Cupboard
Women's Community Revitalization 411 Fairmount St Philadelphia PA 19123 Food Pantry/Cupboard
Old First Reformed Church 515 N. 4th Street Philadelphia PA 19123 Food Pantry/Cupboard
Faith Assembly of God 1926 Margaret Street Philadelphia PA 19124 Food Pantry/Cupboard
The Salvation Army 4344 Frankford Ave. Philadelphia PA 19124 Food Pantry/Cupboard
Triumph Baptist Church 1538 E. Wingohocking St Philadelphia PA 19124 Food Pantry/Cupboard
Second Baptist of Frankford 1801 Meadow St Philadelphia PA 19124 Food Pantry/Cupboard
Keep The Faith Ministry 1901 Harrison Street Philadelphia PA 19124 Food Pantry/Cupboard
Lutheran Settlement House 1340 Frankford Avenue Philadelphia PA 19125 Food Pantry/Cupboard
Inner City Mission 2433 Kensington Ave Philadelphia PA 19125 Food Pantry/Cupboard
St. Michael's Food Bank Trenton and Cumberland Streets Philadelphia PA 19125 Food Pantry/Cupboard
Brotherhood Mission 401 E. Girard Ave Philadelphia PA 19125 Food Pantry/Cupboard
Visitation BVM Church 2625 B Street Philadelphia PA 19125 Food Pantry/Cupboard
Union Tabernacle Presbyterian 2036 E. Cumberland St Philadelphia PA 19125 Food Pantry/Cupboard
Holy Temple of God 6709 Ogontz Ave Philadelphia PA 19126 Food Pantry/Cupboard
Feltonville Presbyterian Church 212 East Wyoming Avenue Philadelphia PA 19126 Food Pantry/Cupboard
New Galilee Baptist Church 6216 N. 7th Street Philadelphia PA 19126 Food Pantry/Cupboard
St. Mark's Lutheran Church 1420 Chelten Avenue Philadelphia PA 19126 Food Pantry/Cupboard
Asian American Cultural 2nd St. & 65th Ave. Philadelphia PA 19126 Food Pantry/Cupboard
North Light Community Center 175 Green Lane Philadelphia PA 19127 Food Pantry/Cupboard
Drug Task Force Ministry 3252 N. Etting Avenue Philadelphia PA 19129 Food Pantry/Cupboard
St. Francis Xavier 2321 Green St. Philadelphia PA 19130 Food Pantry/Cupboard
The Research and Evaluation Group
PUBLIC HEALTH management corporation
Trinity Baptist Church 2720 Poplar St. Philadelphia PA 19130 Food Pantry/Cupboard
United Methodist 804 N. Broad St. Philadelphia PA 19130 Food Pantry/Cupboard
Temple of Divine Love Church 1518-20 W. Girard Ave Philadelphia PA 19130 Food Pantry/Cupboard
Enon Baptist Church 19th and Green Streets Philadelphia PA 19130 Food Pantry/Cupboard
Baptist Women's Center Inc 1428 W. Poplar St Philadelphia PA 19130 Food Pantry/Cupboard
Multi-Life Service 829 N. Capitol Street Philadelphia PA 19130 Food Pantry/Cupboard
Carroll Park Community Council 5218 Master St Philadelphia PA 19131 Food Pantry/Cupboard
Pinn Memorial Baptist Church 2251 N. 54th St. Philadelphia PA 19131 Food Pantry/Cupboard
Freedom Develop. Corp. 4500 Westminster Ave. Philadelphia PA 19131 Food Pantry/Cupboard
Parkside Association 5180 Viola St Philadelphia PA 19131 Food Pantry/Cupboard
Resurrection Baptist Church 1610 N. 54th St Philadelphia PA 19131 Food Pantry/Cupboard
Wynnefield Presbyterian Church 2247 N. 54th St. Philadelphia PA 19131 Food Pantry/Cupboard
Camphor Memorial U.M. Church 5620 Wyalusing Ave Philadelphia PA 19131 Food Pantry/Cupboard
Simpson Fletcher Conestoga 5353 W. Master St Philadelphia PA 19131 Food Pantry/Cupboard
RHD Family House Now 1020 N. 46th Street Philadelphia PA 19131 Food Pantry/Cupboard
Laceys Day Care 1665 N. Wilton Street Philadelphia PA 19131 Food Pantry/Cupboard
North Penn Civic Assoc 29th & Chalmers Ave Philadelphia PA 19132 Food Pantry/Cupboard
One Day at a Time 2310 N. Broad St Philadelphia PA 19132 Food Pantry/Cupboard
James Spring Baptist Memorial Church 1845 W. Huntingdon Street Philadelphia PA 19132 Food Pantry/Cupboard
South Lehigh Action Council 2213 W. Sergeant St Philadelphia PA 19132 Food Pantry/Cupboard
North Penn Baptist Church 2413 N. 27th St Philadelphia PA 19132 Food Pantry/Cupboard
Morning Star COGIC 2326 N. 31st St. Philadelphia PA 19132 Food Pantry/Cupboard
Jubilee Commandment Keepers 2440 N.15th St. Philadelphia PA 19132 Food Pantry/Cupboard
Gather's The People House 3061 N. 15th Street Philadelphia PA 19132 Food Pantry/Cupboard
Fellowship Revival Church 2408 W. Lehigh Ave Philadelphia PA 19132 Food Pantry/Cupboard
Faithful Temple Church 3416 W. Allegheny Ave Philadelphia PA 19132 Food Pantry/Cupboard
Geiger Memorial Brethren Church 2543 W. Lehigh Ave. Philadelphia PA 19132 Food Pantry/Cupboard
Saint Martin de Porres 2340 W. Lehigh Ave. Philadelphia PA 19132 Food Pantry/Cupboard
Cathedral Baptist Church 1700 West Camber Street Philadelphia PA 19132 Food Pantry/Cupboard
Colorado Community Program 2247 N. 20th St Philadelphia PA 19132 Food Pantry/Cupboard
Minute by Minute 2562 N. 18th Street Philadelphia PA 19132 Food Pantry/Cupboard
Little Gospel Temple Cupboard 2540 N. 25th Street Philadelphia PA 19132 Food Pantry/Cupboard
New Pond Baptist Church 3224 W. York Street Philadelphia PA 19132 Food Pantry/Cupboard
CASMI 2602 N. Corlies St. Philadelphia PA 19132 Food Pantry/Cupboard
City Temple Baptist Church 2512 N. Broad St Philadelphia PA 19132 Food Pantry/Cupboard
Operation Second Chance Rescue 507 York St Philadelphia PA 19133 Food Pantry/Cupboard
Davis Temple Bapt. Church 2261 Franklin St Philadelphia PA 19133 Food Pantry/Cupboard
The Research and Evaluation Group
PUBLIC HEALTH management corporation
Neighborhood Action Bureau 2565 Germantown Ave Philadelphia PA 19133 Food Pantry/Cupboard
Prim Iglesia Hispanic Alliance 810 W. Somerset Street Philadelphia PA 19133 Food Pantry/Cupboard
Salvation Army 3150 N. Mascher St Philadelphia PA 19133 Food Pantry/Cupboard
Southern Home Services 3149 Germantown Ave. Philadelphia PA 19133 Food Pantry/Cupboard
People United Together 1007 W. Lehigh Ave Philadelphia PA 19133 Food Pantry/Cupboard
Holy Cross Church/MLK Center 813 W. Lehigh Ave. Philadelphia PA 19133 Food Pantry/Cupboard
Germantown Salvation Army 2601 N. 11th St. Philadelphia PA 19133 Food Pantry/Cupboard
Hope Prison Ministry 508 W. Cumberland St. Philadelphia PA 19133 Food Pantry/Cupboard
Fairhill Tenant Council 2411 North 11th Street Philadelphia PA 19133 Food Pantry/Cupboard
The Lighthouse 152 W. Lehigh Ave. Philadelphia PA 19133 Food Pantry/Cupboard
Crossroads Community Center 2918 N. 6th St. Philadelphia PA 19133 Food Pantry/Cupboard
St. Mark Outreach Baptist Church 924 West Cambria Street Philadelphia PA 19133 Food Pantry/Cupboard
Congreso de Latinos 216 W. Somerset St. Philadelphia PA 19133 Food Pantry/Cupboard
Father House Of Prayer Mission 3040 Germantown Ave Philadelphia PA 19133 Food Pantry/Cupboard
Kensington Neighborhood House Frankford Avenue Philadelphia PA 19134 Food Pantry/Cupboard
St. Joan of Arc Church 2025 E. Atlantic St. Philadelphia PA 19134 Food Pantry/Cupboard
The Salvation Army Pioneer Corps 1920 E. Allegheny Ave Philadelphia PA 19134 Food Pantry/Cupboard
Kensington Assembly of God Frankford Avenue Philadelphia PA 19134 Food Pantry/Cupboard
Divine Breath Baptist Church 428 E. Erie Ave Philadelphia PA 19134 Food Pantry/Cupboard
Free Church of St. John 3089 Emerald St. Philadelphia PA 19134 Food Pantry/Cupboard
St Jerome Church Holme Ave & Stamford St Philadelphia PA 19136 Food Pantry/Cupboard
St. Peter's Evangelical Lutheran Church 74th Avenue & Briar Road Philadelphia PA 19138 Food Pantry/Cupboard
Christian Church of Divine Truth 6065 E. Wister Street Philadelphia PA 19138 Food Pantry/Cupboard
Corinthian Baptist Church 6113 N. 21st St. Philadelphia PA 19138 Food Pantry/Cupboard
New Covenant Presbyterian Church 6329 Limekiln Pike Philadelphia PA 19138 Food Pantry/Cupboard
St. Luke's Food Cupboard 5421 Germantown Avenue Philadelphia PA 19138 Food Pantry/Cupboard
Pathway Evangelical Church 5604 Chew Ave. Philadelphia PA 19138 Food Pantry/Cupboard
Grace Community Baptist Church 6628 Limekiln Pike Philadelphia PA 19138 Food Pantry/Cupboard
St. Benedict 1940 E. Chelten Ave. Philadelphia PA 19138 Food Pantry/Cupboard
Harambe Baptist Church 5648 Chew Ave. Philadelphia PA 19138 Food Pantry/Cupboard
Community Blessing Center 26 S. 57th Street Philadelphia PA 19139 Food Pantry/Cupboard
Mt. Olive 5501 Locust Street Philadelphia PA 19139 Food Pantry/Cupboard
Emmanuel A.M.E. Church 5917 Chestnut Street Philadelphia PA 19139 Food Pantry/Cupboard
Zion Hill Baptist Church 5301 Spruce St Philadelphia PA 19139 Food Pantry/Cupboard
Holy Temple Community Center 363 N. 60th St Philadelphia PA 19139 Food Pantry/Cupboard
Church of the Holy Apostles 260 S. 51st St. Philadelphia PA 19139 Food Pantry/Cupboard
Holy Temple of Lord 5116 Market Street Philadelphia PA 19139 Food Pantry/Cupboard
The Research and Evaluation Group
PUBLIC HEALTH management corporation
West Park Plaza 4600 Fairmount Ave Philadelphia PA 19139 Food Pantry/Cupboard
The Salvation Army 5501 Market St. Philadelphia PA 19139 Food Pantry/Cupboard
Tabernacle Lutheran Church 5843 Spruce St Philadelphia PA 19139 Food Pantry/Cupboard
Reeve Memorial Presbyterian Church 50th & Aspen St. Philadelphia PA 19139 Food Pantry/Cupboard
Our Lady of the Rosary Church 345 N. 63rd Street Philadelphia PA 19139 Food Pantry/Cupboard
Open Door Mission True Light Church 401 N. 52nd St. Philadelphia PA 19139 Food Pantry/Cupboard
Mt. Carmel Baptist Church 5732 Race St. Philadelphia PA 19139 Food Pantry/Cupboard
Holy Temple Church Community Center 363 N. 60th Street Philadelphia PA 19139 Food Pantry/Cupboard
The Word In Action 1539 W. Courtland Street Philadelphia PA 19140 Food Pantry/Cupboard
H.E.R.O. Community Center 3439 N. 17th Street Philadelphia PA 19140 Food Pantry/Cupboard
Taylor Memorial Baptist Church Shepherds Kitchen Philadelphia PA 19140 Food Pantry/Cupboard
Nicetown CDC/NAC 4414 Germantown Avenue Philadelphia PA 19140 Food Pantry/Cupboard
Worldwide Evangelistic Church 3919 N. 5th Street Philadelphia PA 19140 Food Pantry/Cupboard
Zion Community Center 3600 N. Broad Street Philadelphia PA 19140 Food Pantry/Cupboard
Our Lady of Hope 1907 W. Tioga Street Philadelphia PA 19140 Food Pantry/Cupboard
Bridgeway, Inc 1800 W. Ontario St Philadelphia PA 19140 Food Pantry/Cupboard
Casa del Carmen 4400 N. Reese St. Philadelphia PA 19140 Food Pantry/Cupboard
Christ Church & St. Ambrose PO Box 38109 Philadelphia PA 19140 Food Pantry/Cupboard
Fellowship Tabernacle Church 4541 N. Broad St Philadelphia PA 19140 Food Pantry/Cupboard
First Redemption Church 4400 N. Broad St Philadelphia PA 19140 Food Pantry/Cupboard
Harold O. Davis Baptist Church 4500 N. 10th Street Philadelphia PA 19140 Food Pantry/Cupboard
Hunting Park CDC 3961 N. 9th St. Philadelphia PA 19140 Food Pantry/Cupboard
Iglesia Pente, Rosa de Saron 3718 N. Randolph St. Philadelphia PA 19140 Food Pantry/Cupboard
Memorial Tabernacle Baptist Church 2249 W. Hunting Park Ave Philadelphia PA 19140 Food Pantry/Cupboard
Opportunity Towers 1717 W. Hunting Park Ave Philadelphia PA 19140 Food Pantry/Cupboard
Hunting Park 1044C Rising Sun Ave Philadelphia PA 19140 Food Pantry/Cupboard
People In Progress 4131 N. Broad St. Philadelphia PA 19140 Food Pantry/Cupboard
St. Hugh Catholic Church 145 W. Tioga St. Philadelphia PA 19140 Food Pantry/Cupboard
Zion Baptist Church 3601 N. Broad St Philadelphia PA 19140 Food Pantry/Cupboard
Bible Believing Church 928 W. Duncannon Ave Philadelphia PA 19141 Food Pantry/Cupboard
Champlost Homes 1953 Nedro Avenue Philadelphia PA 19141 Food Pantry/Cupboard
Second Macedonia Baptist 1301 W. Ruscomb St Philadelphia PA 19141 Food Pantry/Cupboard
Our Lady of Hope 5200 N. Broad St. Philadelphia PA 19141 Food Pantry/Cupboard
Holy Rock Miss. Baptist 1980 Church Lane Philadelphia PA 19141 Food Pantry/Cupboard
Have Fun! Refund 1900 W. Logan St Philadelphia PA 19141 Food Pantry/Cupboard
Page Academy 1524 Champlost Avenue Philadelphia PA 19141 Food Pantry/Cupboard
Burning Bush Ministry 6037 Elmwood Avenue Philadelphia PA 19142 Food Pantry/Cupboard
The Research and Evaluation Group
PUBLIC HEALTH management corporation
Southwest Community Services 6424 Woodland Ave. Philadelphia PA 19142 Food Pantry/Cupboard
Catholic Social Services / Our Lady of Lo 6214 Grays Avenue Philadelphia PA 19142 Food Pantry/Cupboard
Paradise Emmanuel Church 4704 Woodland Ave. Philadelphia PA 19143 Food Pantry/Cupboard
St. Philip Lutheran Church 5210 Wylausing Avenue Philadelphia PA 19143 Food Pantry/Cupboard
New Spirit Presbyterian Church 5736 Chester Ave. Philadelphia PA 19143 Food Pantry/Cupboard
Allen Food Bank 5902 Addison St. Philadelphia PA 19143 Food Pantry/Cupboard
Black Concerned Citizens 5101 Pine St. Philadelphia PA 19143 Food Pantry/Cupboard
Concerned Parents Inc. 5407 Woodland Ave Philadelphia PA 19143 Food Pantry/Cupboard
Crusaders for Christ 1201 S. 47th St Philadelphia PA 19143 Food Pantry/Cupboard
59th Street Baptist Church 315 59th St Philadelphia PA 19143 Food Pantry/Cupboard
Bartram Village Tenant 5407 Bartram Drive Philadelphia PA 19143 Food Pantry/Cupboard
Mt Zion Baptist Church 5015 Woodland Ave Philadelphia PA 19143 Food Pantry/Cupboard
Southwest Community Enrichment Center 1341 S. 46th St. Philadelphia PA 19143 Food Pantry/Cupboard
The People’s Baptist Church 5039 Baltimore Ave. Philadelphia PA 19143 Food Pantry/Cupboard
Theresa Maxis Center @ Most Blessed Sacra 5628 Chester Ave. Philadelphia PA 19143 Food Pantry/Cupboard
R.A.G.S. to Riches CDC 626 S. 60th Street Philadelphia PA 19143 Food Pantry/Cupboard
Judah House of Prayer 626 S. 60th Street Philadelphia PA 19143 Food Pantry/Cupboard
St. Cyprian Church 525 S. Cobbs Creek Parkway Philadelphia PA 19143 Food Pantry/Cupboard
St. Matthew's First Baptist Church 634 E. Chelten Ave Philadelphia PA 19144 Food Pantry/Cupboard
Adoni Baptist Church 221 E. Logan St Philadelphia PA 19144 Food Pantry/Cupboard
Polite Temple Baptist Church 38 E. Price Street Philadelphia PA 19144 Food Pantry/Cupboard
Wister Townhouse 292 E. Ashmead St Philadelphia PA 19144 Food Pantry/Cupboard
Enon Tabernacle Baptist Church 230 W. Coulter St Philadelphia PA 19144 Food Pantry/Cupboard
Germantown Settlement 324 E. High St Philadelphia PA 19144 Food Pantry/Cupboard
Grace Community Christian Center 29 W. Johnson St Philadelphia PA 19144 Food Pantry/Cupboard
Happy Hollow Advisory Council 4800 Wayne Ave Philadelphia PA 19144 Food Pantry/Cupboard
Queen Lane Apartments 301 W. Queen Lane Philadelphia PA 19144 Food Pantry/Cupboard
St. Stephen's Memorial Baptist 15 W. Harvey St Philadelphia PA 19144 Food Pantry/Cupboard
St. Vincent De Paul Church 109 E. Price St. Philadelphia PA 19144 Food Pantry/Cupboard
Faith Chapel Church 108 E. Price St. Philadelphia PA 19144 Food Pantry/Cupboard
Wisdom Germantown Settlement 16 E. Wister St. Philadelphia PA 19144 Food Pantry/Cupboard
The Peace Factory 218 E. Haines Street Philadelphia PA 19144 Food Pantry/Cupboard
Youth Services, Inc 6325 Burbridge St Philadelphia PA 19144 Food Pantry/Cupboard
Zion Hill Church of God in Christ 529 E. Washington Lane Philadelphia PA 19144 Food Pantry/Cupboard
United Morton Homes Tenant 5842 Osceola Street Philadelphia PA 19144 Food Pantry/Cupboard
As the Holy Spirit Leads 1843 S. 22nd St Philadelphia PA 19145 Food Pantry/Cupboard
Chester Dionna Habitat for Children 2247 S. 15th Street Philadelphia PA 19145 Food Pantry/Cupboard
The Research and Evaluation Group
PUBLIC HEALTH management corporation
Tasker Homes 3103 Fernon St Philadelphia PA 19145 Food Pantry/Cupboard
Tasker St. Baptist Church 2018 Tasker St Philadelphia PA 19145 Food Pantry/Cupboard
Wilson Park 2500 Jackson St Philadelphia PA 19145 Food Pantry/Cupboard
Bibleway M.B. Church 1705 Point Breeze Ave. Philadelphia PA 19145 Food Pantry/Cupboard
Older Adult 2319 Fitzwater Street Philadelphia PA 19146 Food Pantry/Cupboard
Zion Hill Memorial Baptist Church 2702 Ellsworth Street Philadelphia PA 19146 Food Pantry/Cupboard
First Pentecostal Church 1503-1507 S. 20th Street Philadelphia PA 19146 Food Pantry/Cupboard
New Light Beulah Baptist 1701 Bainbridge St Philadelphia PA 19146 Food Pantry/Cupboard
Catholic Social Services / St. Charles Bo 1941 Christian Street Philadelphia PA 19146 Food Pantry/Cupboard
Church of the Redeemer Baptist 1440 S. 24th St Philadelphia PA 19146 Food Pantry/Cupboard
Ebenezer Church 15th and Christian Sts. Philadelphia PA 19146 Food Pantry/Cupboard
Greater Faith Church 1101 S. 27th St Philadelphia PA 19146 Food Pantry/Cupboard
John Gloucester House 2147 Manton St Philadelphia PA 19146 Food Pantry/Cupboard
Salvation Army / Grays Ferry Corps 3225 Reed St. Philadelphia PA 19146 Food Pantry/Cupboard
Tindley Temple U.M. Church 762 S. Broad St. Philadelphia PA 19146 Food Pantry/Cupboard
Zion Hill Memorial Baptist 2702 Ellsworth St Philadelphia PA 19146 Food Pantry/Cupboard
St. Gabriel Parish 2917 Dickinson St Philadelphia PA 19146 Food Pantry/Cupboard
One Day At A Time 425 South Broad St. Philadelphia PA 19147 Food Pantry/Cupboard
United Communities-Hawthorne 1100 Catherine St Philadelphia PA 19147 Food Pantry/Cupboard
Christ Presbyterian Church 1020 S. 10th Street Philadelphia PA 19147 Food Pantry/Cupboard
Southeast Asian Mutual Assoc 1622 S. 7th St Philadelphia PA 19148 Food Pantry/Cupboard
St. Paul's Episcopal Church 2611 S. Broad St Philadelphia PA 19148 Food Pantry/Cupboard
United Community Houston 2029 S. 8th St Philadelphia PA 19148 Food Pantry/Cupboard
Renew In Christ Ministry 1734 South 5th Street Philadelphia PA 19148 Food Pantry/Cupboard
Temple Shalom Mitzvah Large St. & Roosevelt Blvd. Philadelphia PA 19149 Food Pantry/Cupboard
Remmanil Church 7710 Ogontz Avenue Philadelphia PA 19150 Food Pantry/Cupboard
Phila Deliverance Taber. Church 7501 Ogontz Ave Philadelphia PA 19150 Food Pantry/Cupboard
St. Rose of Lima Church 1535 N. 59th Street Philadelphia PA 19151 Food Pantry/Cupboard
Asian American Community Center 6218 Woodbine Ave Philadelphia PA 19151 Food Pantry/Cupboard
Calvin Presbyterian Church 1401 N. 60th St. Philadelphia PA 19151 Food Pantry/Cupboard
Children of the Light Mission 734 North 63rd St. Philadelphia PA 19151 Food Pantry/Cupboard
St. Barnabas Mission 6400 Haverford Ave. Philadelphia PA 19151 Food Pantry/Cupboard
Good Samaritan Baptist Church 6148 Lansdowne Ave. Philadelphia PA 19151 Food Pantry/Cupboard
New World Association 2218 Glendale Ave Philadelphia PA 19152 Food Pantry/Cupboard
Eastwick United Methodist Church 8321 Lindbergh Blvd. Philadelphia PA 19153 Food Pantry/Cupboard
Holy Redeemer 12265 Townsend Rd Philadelphia PA 19154 Food Pantry/Cupboard
ST JOHN NEUMANN NURSING HOME 21 226 226 226 226 97.8
ST MONICA MANOR 21 180 180 180 180 97.9
TRANSITIONAL CARE UNIT AT NAZARETH HOSP 21 28 28 28 0 74.1
TUCKER HOUSE NURSING & REHAB CENTER 25 180 180 180 180 98.3
WESLEY ENHANCED LIVING AT STAPELEY 21 120 120 120 120 94.7
WILLOW TERRACE 24 180 180 180 180 93.3
WILLOWCREST 25 138 138 138 138 51.7
COUNTY TOTAL - 7,604 7,549 6,836 7,443 92.9
Source: Pennsylvania Department of Health 2011 Nursing Home Reports, available online at http://www.portal.state.pa.us/portal/server.pt?open=514&objID=596753&mode=2
Prepared by PHMC
*Organization Type: Type of organization legally responsible for the operation of the facility. 11=State 12=County 14=City/County 22=Nonprofit, Other 23=Profit, Individual Investor, 24=Profit, Partnership, 25=Profit, Corporation, 20=Church Owned/Operated, 21=Nonprofit Corporation.