Public Housing Magnets: Public Housing Supply and Immigrants’ Location Choices * Gregory Verdugo † October 19, 2010 Abstract This paper contributes both to the study of the determinants of public housing supply and the impact of public housing on location choice. The paper emphasizes that public housing supply per capita increases more rapidly in declining cities and in cities that have become less politically fractionalized over time. These results are robust to reverse causal- ity. I use the variations provided by these factors to identify the impact of the dispersion in public housing supply across cities on the location choice of new immigrants in France between 1968 and 1990. Results indicate that increasing a city’s public housing supply has a large "magnetic effect" on new immigrants living as a couple which is larger for non-European immigrants. * I thank the Centre Maurice Halbwachs (CMH) for having made the data available and in particular Alexandre Kych for his help. Most data used in this paper are available upon request for researchers from the CMH. The author also wishes to acknowledge the INSEE that provided the underlying data making this research possible. I thank Jean-François Royer from CREST-INSEE for his help to access the restricted version of the 1999 Census. I thank Karin Edmark, Thierry Magnac, Eric Maurin, Javier Ortega, Jean-Louis Pan Ké Shon, Gilles Saint-Paul, Patrick Sevestre, Karine Van Der Straeten, Etienne Wasmer, and seminar participants in many places for insightful comments. Data from the 1999 French Census used in this paper are confidential but the author access is not exclusive. For additional information, contact the author. This paper does not necessarily reflect the views of the Banque de France. † Service des Analyses Microéconomiques, Direction des Etudes Microéconomiques et Structurelles, Banque de France, 31 rue Croix-des-petits-champs, 75049 Paris Cedex 01, France. Email: gregory.verdugo@banque- france.fr 1
Transcript
Public Housing Magnets: Public Housing Supply andImmigrants’ Location Choices∗
Gregory Verdugo†
October 19, 2010
Abstract
This paper contributes both to the study of the determinants of public housing supplyand the impact of public housing on location choice. The paper emphasizes that publichousing supply per capita increases more rapidly in declining cities and in cities that havebecome less politically fractionalized over time. These results are robust to reverse causal-ity. I use the variations provided by these factors to identify the impact of the dispersionin public housing supply across cities on the location choice of new immigrants in Francebetween 1968 and 1990. Results indicate that increasing a city’s public housing supplyhas a large "magnetic effect" on new immigrants living as a couple which is larger fornon-European immigrants.
∗I thank the Centre Maurice Halbwachs (CMH) for having made the data available and in particular AlexandreKych for his help. Most data used in this paper are available upon request for researchers from the CMH. Theauthor also wishes to acknowledge the INSEE that provided the underlying data making this research possible. Ithank Jean-François Royer from CREST-INSEE for his help to access the restricted version of the 1999 Census.I thank Karin Edmark, Thierry Magnac, Eric Maurin, Javier Ortega, Jean-Louis Pan Ké Shon, Gilles Saint-Paul,Patrick Sevestre, Karine Van Der Straeten, Etienne Wasmer, and seminar participants in many places for insightfulcomments. Data from the 1999 French Census used in this paper are confidential but the author access is notexclusive. For additional information, contact the author. This paper does not necessarily reflect the views of theBanque de France.†Service des Analyses Microéconomiques, Direction des Etudes Microéconomiques et Structurelles, Banque
de France, 31 rue Croix-des-petits-champs, 75049 Paris Cedex 01, France. Email: [email protected]
Public housing is a major policy issue in Europe. Public housing accounts for 20% of the
total housing stock in Austria, the United Kingdom, Sweden, and Denmark and more than
10% in Germany, Ireland, France, and Belgium (Priemus and Dieleman, 2002) while in the
Netherlands, more than 40% of the housing stock is public rented housing. Surprisingly, the
consequences of Europe’s relatively massive increase (with respect to North America) in the
supply of public housing since the 1960s have not been thoroughly explored previously in the
literature.1 However, given that the housing stock is durable, public housing might have an ex-
ogenous impact on a city’s evolution (Glaeser and Gyourko, 2005; Glaeser et al., 2006). More
particularly, public housing might be a particular concern for immigration policymakers, con-
sidering that the participation rates of some groups of immigrants are much higher than the rate
of natives.2 In Amsterdam, it is estimated that more than 80% of Turkish and Moroccan im-
migrants lived in public housing in 1990 (Musterd and Deurloo, 1997) while in London, 40%
of foreign born residents are social tenants (Rutter and Latorre, 2008). Understanding of the
impact of public housing on immigrants may thus help decision makers to direct immigrants to
those areas where they are most needed, most easily absorbed, or most welcome.
France is a good case study for addressing these questions because, as stated before, a re-
markably large share of its population lives in public housing. Moreover, French data provide
very precise information on public housing supply and participation.3 In 1999, 16% of na-
tives and 31% of immigrants lived in housing projects.4 Strikingly, non-European immigrants
have much higher participation rates; for example, about 50% of immigrants from Algeria and
1Recent studies on public housing focus on neighborhood effects in housing projects in the U.S. or NorthAmerica, including Currie and Yelowitz (2000), Oreopoulos (2003), Kling et al. (2007) and Jacob (2004).
2The impact of immigration on a host country depends on where the immigrants locate (Borjas, 2001). Recentstudies on location choice have investigated the "welfare magnet" hypothesis, which examines whether differencesin welfare availability across U.S. states have a magnetic influence on the location choice of immigrants. Theavailable evidence is mixed - for the U.S., Borjas (1999) found evidences of positive effects, whereas Kaushal(2005) reported no impact. Giorgi and Pellizzari (2009) also studied the impact of differences in welfare benefitsacross European states on immigrant location choice, reporting a positive effect. Boeri (2010) study the particularimpact of welfare on immigrants in Europe.
3More precisely, I call public housing what the French call social housing (logement sociaux) or ‘HLM’ (Habi-tation à Loyer Moderé, which means, literally, housing with moderated rents). Public Housing is new constructionfinanced by the government and managed by local public housing authorities. In France, most public housing unitsare rented.
4All figures on France given in the introduction come from author’s tabulation of the French Census.
2
Morocco lived in public housing. Moreover, the public housing supply varies widely across
localities: the share of public housing over total housing varied from 7% in Nice to 44% in
Reims, with an average share of 20% in 1999.
In this paper, I investigate whether public housing influenced the location choice of im-
migrants in France since 1968. To do this, I first study the determinants of the variations in
public housing supply per capita within French cities over time, emphasizing the role of po-
litical fractionalization and population change. Using these results, I then investigate whether
public housing had an impact on the location choice of new immigrants who arrived in France
between 1968 and 1990.
The empirical analysis in the first part of the paper studies the role of political fraction-
alization and of city population decline in explaining the variations of public housing supply
per capita both across and within cities. I emphasize that changes in the concentration of
populations across municipalities within urban areas are related to different urbanization pat-
terns across urban areas that influence the public housing supply.5 Moreover, public housing is
durable and cannot be easily adjusted downward during economic downturn. Therefore, cities
that receive a negative economic shock might see their public housing per capita increase more
rapidly than growing cities, even if depressed cities do not build new units. Declining cities can
thus be attractive for public housing applicants because the public housing supply cannot be
adjusted in the short term and a higher probability of obtaining public housing might compen-
sate for a relative lack of economic opportunities. However, naive estimates about the impact
of city growth and of political fractionalization are likely to be biased by problems of reverse
causality. The variations of the fractionalization over time might depend of the change in public
housing supply because public housing construction might deter or attract inhabitants within
urban areas in municipalities with more or less public housing depending on their taste. As an
instrument for the variations of the political fractionalization of the city, I use the variations in
densities of the future urban area lagged 15 years before the changes in public housing supply at
the urban area level. These lagged density variables are related to differences in housing supply
elasticities across municipalities within urban areas but probably exogenous to changes in fu-
5E.g., Hoxby (2000) or Cutler and Glaeser (1997) for papers relating to political fractionalization and out-comes.
3
ture public housing supply. The second major identification problem is that population growth
or decline might be itself directly related to public housing construction. As an instrument for
population growth and decline, I use two shift share models with the industrial distribution of
workers in 1968 and the population growth related to differences in initial location across ethnic
groups (Bartik, 1991; Saiz, 2010). The empirical evidence confirms that the evolution of the
public housing supply within cities is related to changes in fractionalization and city population
decline. I find these evolutions to be a strong predictor of changes in the public housing supply
within cities: first, urban areas in which the degree of political fractionalization increased had
a lower increase of their supply of public housing per capita from 1968 to 1999. Second, I find
that public housing supply increases more rapidly in declining cities.
Using these results, I study whether public housing influenced the location choices of im-
migrants using the differences in public housing stock across cities. I estimate discrete location
choice models of new immigrants across urban areas with controls for time-invariant city char-
acteristics as in Jaeger (2008). The main econometric issue is that unobserved city specific
shocks affect both the public housing supply and the utility of choosing the city for an immi-
grant. I use the previous regression results to construct a control function with two alternative
instrumental variables strategies to deal with the potential endogenous evolution of the public
housing supply. As excluded instruments for the variations in public housing supply, I use the
counterfactual population growth and decline and the evolution of political fractionalization
across urban areas that are related to variations of the public housing supply per inhabitants but
are probably unrelated to the utility of choosing the city conditional on other covariates. To
further probe the possibility of reverse causality, I estimate models that include lagged, current,
and future public housing supply. Lagged stocks cannot be responding to future immigrant
flows while the inclusion of the lead public housing supply tests for endogenous shift in sup-
ply responding to immigrant flows. Reassuringly, I found small and statistically insignificant
effects of future variables.
The empirical results indicate that Europeans and non-European immigrants react quite
differently to the availability of public housing. Quantitatively, the estimates controlling for lo-
cation fixed effects indicate that, for non-European immigrants living as a couple with children,
4
a one-standard-deviation increase (about 5%) in the number of public housing units per capita
in the city increases the probability of an immigrant choosing a city with "average" character-
istics by about 60% for a Maghrebi or 30% for a European. The effect is fairly robust across
alternative specifications, such as changes in the choice set.
Other results confirm previous findings on immigrants’ location choices. As in Bartel
(1989) and Jaeger (2008), results indicate that the concentration of similar immigrants is one
of the most important determinants of an immigrant’s location choice.6
The next section of the paper describes the data. The second section develops the model
of public housing supply. Section three presents the location choice model. The final section
concludes.
1 Data Description and Public Housing in France
The empirical analysis draws data from the 1968, 1975, 1982, 1990 and, in part, from the 1999
censuses.7 I restrict the sample to men and women aged 16 to 60 and exclude students and in-
dividuals in the military.8 The sampling rate for the individual file is 20% for the 1975 Census
and 25% for the 1968, 1982 and 1990. Such high sampling rates enabled me to study small
subpopulations of immigrants separately. As a consequence, the attenuation bias from sam-
pling errors that plagued earlier empirical work on immigration (Aydemir and Borjas, 2006) is
less likely to present a problem in this study. We first present data on immigration, document-
ing the immigrant flows in France since 1962. In the second subsection, we present the data
used to estimate the variations of public housing supply between 1968 and 1999. In the third
6The literature investigating the location choice of immigrants also includes, among others: Jaeger (2001) andBauer et al. (2005) for the U.S., Pischke and Velling (1997) for Germany and Desplanques and Tabard (1991)and Jayet and Ukrayinchuk (2007) for France. All of these papers report a significant effect on the size of similarimmigrant communities in cities, but results concerning the effect of differences in economic opportunities aremore mixed.
7The public-use 1999 Census with geographical variables is available for researchers at a 5% sampling rate.However, in this extraction, no variable distinguishes naturalized citizens (which must be counted as immigrantsif they are born abroad) from natural-born citizens and no detailed country of birth or nationality variable isavailable. Therefore, it is impossible to define immigrants consistently with the 1999 public-use census data orto study immigrants separately by their countries of origin. In this study, I provide several figures from a 25%sample of the 1999 Census that I had access to while I was visiting the French Statistical Institute. However, forpractical reasons, I have not been able to repeat the whole analysis with this sample. Preliminary results suggestthat most results of this paper are qualitatively unchanged when the 1999 Census is also included.
8However, the population count used to select urban areas included in the analysis includes all individuals.
5
subsection, we present the evolution of public housing participation of immigrants and natives
during this period.
1.1 Immigration
An immigrant is defined as a foreign-born individual who is a non-citizen or naturalized French
citizen.9 Unlike U.S. Census data, there is no variable indicating the arrival year for each
foreign-born individual until the 1999 Census. However, each census reports the location of
an individual at the time of the previous census. I use this variable to identify newly-arrived
immigrants.10 In this study, a "new immigrant" is therefore an immigrant who declared to be
living abroad at the time of previous census.
We briefly summarize the characteristics of immigration during this period. Table 1 reports
estimates of the number of new immigrants in France from 1962 to 1999. The decline of the
annual immigration rates after 1974 is followed by a much larger decline during the 1990s.
This decline partly reflects a shift in French immigration policies after 1974, which changed
admission conditions during what was perceived as a temporary economic downturn. Theo-
retically, only migration for family reunion was permitted; in practice, economic immigration
never stopped and represented about half of total immigration in 1982.11 The last rows of
Table 1 report the change in composition of the national origins of immigrants. Over this pe-
riod, the share of European-based immigration decreased while African and Asian immigration
increased. Simultaneously, immigrants were also increasingly educated.
[Table 1 about here.]
[Table 2 about here.]
Because the study covers a relatively long time period of time, one concern may be the change
in the relative share of immigrants from different admission categories over time.12 In 1974,9This definition is identical to the one adopted by the French Statistical Institute.
10Estimates of immigrant flows from the French Statistical Institute typically rely on administrative data fromthe National Immigration Office and are very similar to the one computed using the census in this study. See Tavanet al. (2005, p.70) for figures based on these data.
11See Tavan et al. (2005, p.72) for a decomposition of immigrants across admissions categories based on ad-ministrative data.
12Jaeger (2008) using administrative data from the US Immigration and Naturalization Service estimates adifferent model of location choice for each different immigrant category. Typically, he reports few differences
6
France restricted its admission policy for economic immigrants, but facilitated family reunion
migration. Immigrants admitted for family reunion may not possess the same skills as eco-
nomic immigrants Chiswick (1986), and their location decision may depend on the location
of family members already living in France. Therefore, their decisions may be unrelated to
city characteristics. There is no information reported in the census on the admission category
of new immigrants. However, according to the best available figures from Tavan et al. (2005,
p.72), 80% of immigrants admitted for family reunion are female and most of the others are
children. To deal with that issue, I only include in the regressions of the location choice model
new male immigrants and exclude individuals reported as a child in a household.
1.2 Public Housing Data
The geographical unit used to study the location choices of immigrants should approximate the
relevant local labor market from which the characteristics determine the location choice (Card,
2001).13 I approximate local labor markets using mainly 57 urban areas. Urban areas are ag-
gregations of municipalities, between which there are no discontinuities across construction.
These urban areas were chosen by more than 85% of immigrants in 1968 and 1990.14 Includ-
ing additional alternatives would disproportionately increase the choice set by adding relatively
rare (and therefore undesirable) alternatives without adding many individual observations in the
sample. I use the definition of urban areas constructed by the French Statistical Institute for the
1990 Census. Because buildings are constructed and destroyed between censuses, new urban
areas are defined during each census.15 Therefore, each urban area is matched across censuses
using its national municipality code, which identifies each municipality by a consistent number
over time.16
A major interest of using French data is that information on whether a dwelling is in the
public rented sector is available from the Census of Housing and thus does not come from cur-
across categories.13Previous studies used either US states (Jaeger, 2008; Kaushal, 2005) or metropolitan areas (SMSAs) (Bartel,
1989; Bauer et al., 2005).14If one excludes European immigrants, the percentage increases to 92% in 1968 and 90% in 1990.15I use the term city and urban unit interchangeably throughout the paper to refer to the 1990 urban areas.16Each municipality has had a unique administrative identifier since 1945, which enables matching of similar
cities over time. Therefore, we do not have the problem of changes in the boundaries of cities over time, which isencountered in the US Censuses.
7
rent resident reports. To estimate the public housing supply per urban area across years, I use
the exhaustive dwelling file from the 1990 Census, which includes all dwellings and buildings
existing in France during that year. Because censuses prior to 1982 did not collect information
on public housing participation, and thus did not report whether a dwelling belonged to public
housing, I retrospectively approximate the number of public housing units per urban area for
these years with a variable indicating the construction year of each building. Because most con-
struction plans started in 1958 and there have been no destructions of public housing units since
that period, this method is a relatively accurate approximation of the dispersion and evolution
of public housing over time in various cities.17 Finally, it is important to note that during this
period there has been no destruction of public housing units. Moreover, there were no policies
converting public housing units’ apartments into condominiums as in the US. Such policies are
discussed nowadays in France but until now have never been implemented (Stébé, 2007).
[Figure 1 about here.]
[Table 3 about here.]
1.3 Public Housing and Immigration
The public housing program started about 15 years after the Second World War in a very spe-
cific political context. War destruction created severe housing shortages. To deal with this
problem, the government implemented rent control policies for new construction in 1948. As
a result, these policies drastically reduced the financial benefits of housing investments and, as
an unintended effect, reduced the housing supply in spite of high demand. In 1958, during a
period of rapid economic growth, the freshly elected center-right Gaullist government launched
the first construction. Unsurprisingly, part of the initial stock of public housing is related to war
destruction: public housing supply in 1968 was larger in cities which had been bombed during
Second World War such as Brest, le Havre or Dunkerque (Florentin, 1997). A list of the 16
17As emphasized by Glaeser et al. (2006) for the US, there is a very tight link between population and the stockof housing, so the stock of public housing per capita is very strongly connected with the stock of public housingover total housing: the correlation coefficient is 0.97 for 1990.
8
largest urban areas in 1990 is reported in Table 3 along with the name of the main municipal-
ity.18 These figures reveal large variations in public housing supply across cities: the share of
public housing varies from 8% in Nice to 30% in Rouen.19
Public housing’s appeal relies on the considerable benefits it offers, as rents in projects are
much lower than in the private sector: existing estimates suggest that rents were an average of
40% lower than in the private sector during the 1990s (Le Blanc et al., 1999) and about 30%
lower during the 1970s (Durif and Marchand, 1975). Not all households are eligible for public
housing: eligibility depends on the income per unit of consumption and family size, which
must be below a threshold that varies across regions. Public housing management is decentral-
ized at the municipal level and eligible families can apply in any city, regardless of their current
location or nationality.20
Our empirical analysis focuses on the impact that public housing might have on the loca-
tion choice of immigrants. Therefore, it is important to determine whether public housing con-
struction within cities was a direct response to immigrant flows. However, existing empirical
evidence on French housing policy suggests the absence of links between immigrant housing
needs and decisions regarding public housing construction. Figure 1 illustrates that between
1968 and 1999, the public housing stock per inhabitant increased more rapidly in cities with a
lower initial stock of immigrants. This relationship remains robust when non-European or new
immigrants are chosen instead of the stock of immigrants. Finally, if new public housing was
specifically constructed for immigrants, we should find that large shares of inhabitants of new
public housing buildings are actually immigrants. Figure 2 provides the cross-section relation-
ship between the increase in public housing per capita between 1982 and 1990 and the share
of immigrants over inhabitants in new public housing constructed during this period. Once
again, the figure suggests that there is a negative relationship between the two: in cities that
18Arbitrarily, the main municipality of the urban area is defined as the most populated municipality of the area.19Because of the large dispersion of public housing supply across municipalities, the French government en-
acted a law in 1999 to levy penalties against municipalities with less than 15% of their housing stock in publichousing.
20There exist about 820 different public housing agencies (‘organismes HLM’) in France. Public housingagencies are independent organizations responsible for one or several housing projects in their geographical level,usually a municipality or the county (département). The boards of these organizations are typically composed oflocal politicians from different levels of the French local and national administration. Contrary to several countrieswhere public housing has been privatized, all public housing in France remains rented. Stébé (2007) provides aconcise presentation of public housing organization in France.
9
more rapidly increased their public housing supply, there tends to be fewer immigrants living
in newly constructed public housing units.
Several pieces of historical evidence confirm the absence of links between public housing
supply and immigration. During the 1950s and 1960s, the French policy of immigrant housing
consisted primarily of providing housing to single male immigrants in specific public migrant
housing, called foyer Sonacotra.21 During the beginning of the 1960s, immigrants’ access to
public housing was severely restricted; to be eligible, several public housing agencies required
immigrants to first maintain residency for 10 years and to have children (Schor, 1996, p.214).
The number of immigrants in public housing was also often limited by quotas; in some regions,
no more than 6.5% of housing projects could be occupied by immigrants. Pinçon (1976) re-
ports that in 1968, only 5.5% of foreign workers in the Paris urban area lived in public housing,
versus 15.3% of natives. As a result, during the 1960s, many immigrants lived in slums around
French cities.22 In 1970, the decision was taken to eliminate immigrant slums and the quotas
of immigrants in housing projects subsequently increased (Weil, 2005, p.52). However, it was
only after the election of the socialist presidential candidate François Mitterrand in 1981 that
these discriminations disappeared, which may explain the large increase in the participation rate
of some immigrant groups between 1982 and 1999 reported in Table 2 (see also Boeldieu and
Thave, 2000).23 The figures indicate that, in 1999, the percentage of immigrants living in pub-
lic housing was double that of natives in public housing. Across immigrant groups, the share
of immigrants in public housing was particularly large for immigrants from Africa and Asia:
about half of immigrants from Maghreb lived in public housing in 1999, a difference of 34 per-
centage points compared to natives. The evolution in participation rates was quite spectacular
between 1982 and 1999. The figures reveal that the percentage of immigrants participating in
public housing increased by 10-15 percentage points for immigrants from Maghreb.
21These are not counted as public housing in my sample as they are defined by the census as "places of com-munity life." Less than 1% of immigrants lived in these places during the 1960s. That policy was implemented toencourage male immigrants to return to their country of origin during periods of economic downturn and to avoidfamily-based migration of wives and children (Weil, 2005, p.51).
22For example, in the Paris region in 1970, there were 113 slums (Lequin, 2006, p.410). About 23 000 individ-uals, most of them immigrants from Algeria, lived in La Folie in Nanterre, the biggest slum.
23There are no data on public housing participation rates in the 1968 and in 1975 Censuses. To my knowledge,there are no alternative sources available to study the participation rates of immigrants before 1982. The HousingConditions surveys (Enquêtes Logement) of 1973 and 1978, collected by the French Statistical Institute, did collectinformation on public housing participation but did not contain information on nationality.
10
[Figure 2 about here.]
[Table 4 about here.]
2 Determinant of Changes in the Public housing Supply
In light of this descriptive evidence, we turn to the task of modeling the changes in public
housing per capita over time across French urban areas, emphasizing the role of political frac-
tionalization and population change. The next subsection presents a model of the determinants
of the evolution of public housing per capita within urban areas. Estimation results from a
series of alternative specifications of the model are presented in the second subsection.
2.1 Methods
To empirically investigate the evolution of public housing supply over time, we adopt a simple
reduced form approach. Our dependant variable is the public housing supply per capita denoted
where γk is a city-specific fixed effect,Xkt is a set of control variables that reflect changes in the
underlying characteristics of the city. The parameters of interest are α1, α2 and η, which capture
the effect of population growth and political fractionalization. By including year and urban area
fixed effects, the effect of population growth and political fractionalization is identified from
deviations from location-specific and time-specific averages.
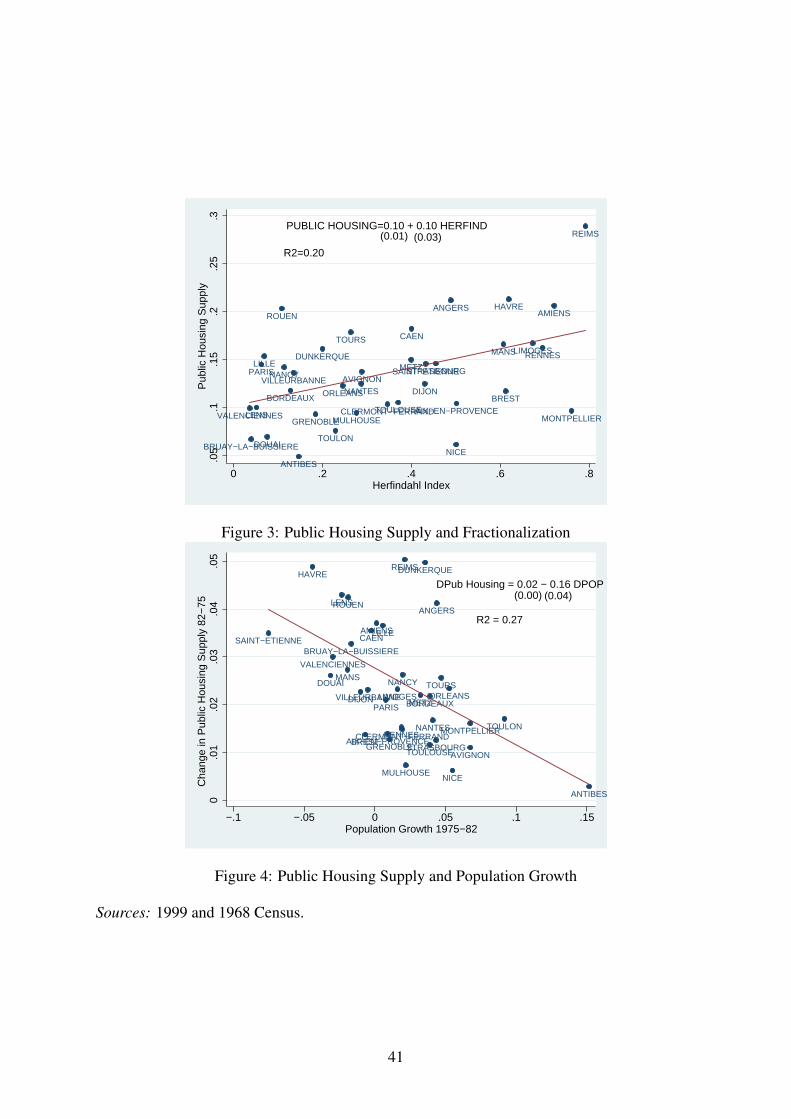
[Figure 3 about here.]
First, the model studies whether public housing supply is related with differences in urban
areas fractionalization. The variable Herfind is the Herfindalh index of the distribution of
the population across municipalities within the urban area and captures differences in political
fractionalization: this variable is a concentration index that takes the value one when the ur-
11
ban area is unified and tend to zero if it is extremely fragmented.24 Variations across cities of
the fractionalization index come from the fact that urban agglomerations typically aggregate
dozens of different municipalities. As a result, there are a lot of variations across different ur-
ban areas in the political fractionalization.25 The number of local governments could affect the
provision of public housing through a Tiebout mechanism: when there are more local govern-
ments, service provision will vary more within an agglomeration across municipalities. This
relationship relies on the tendency of municipalities within agglomerations to attract inhabi-
tants with different levels of wealth and preferences. Theoretically, the link between aggregate
supply of the public good and political fractionalization, assuming this last variable exogenous,
depends on the distribution of preferences. However, we observe in practice France a strongly
negative relationship in cross-section between the public housing supply and political fraction-
alization: Figure 3 shows that public housing supply is higher in more concentrated cities. A
simple univariate regression indicates that the public housing supply per habitants increases by
10 percentage points with respect to a completely fragmented city. This relationship remains
statistically significant when the sample includes all 433 cities of more than 10 000 inhabitants
or if one changes the reference year.
Second, the model investigates the impact of population change on the public housing sup-
ply per capita. Including separately the effect of population growth and decline is theoretically
motivated by the work of Glaeser and Gyourko (2005) who have emphasized the consequences
of the durability of housing on a city’s dynamics. Because housing is durable, public housing
cannot be adjusted when the city is declining. To capture this asymmetry between decline and
growth, I allow the effect of population growth and decline on the public housing supply per
capita to differ. The variables POPGAIN and POPLOSS are variables which take on a
value of zero if city k population is growing (respectively declining) between t and the previ-
ous census year and equals the actual growth rate of the population. During this period, there
has been no destruction of public housing units across France. So I expect the impact of city
decline, because there has been no destruction during this period, to increase the public housing
24The Herfindahl index is the sum of the square of the share of workers living across municipalities.25For example, the urban area of Bordeaux and Toulouse, which are similar in size, are composed of 44 and 58
municipalities, respectively. In 1990, Paris was composed of 398 municipalities.
12
supply per capita mechanically even if the political authorities do not construct any new public
housing units.
Estimating the effect of population growth and decline and the effect of political fraction-
alization creates some econometric problems because both population growth and the political
fractionalization of the urban area are likely to be to be correlated with the error term ekt.
2.1.1 Endogeneity Issues
First, population growth is directly related to changes in the public housing supply given there
is a direct relationship between housing supply and population growth (Glaeser et al., 2006).
Additional public housing units will thus increase the population in the urban area. Sym-
metrically, a large public housing supply might repel some potential inhabitants of the city
with preferences for locations with low public housing supply. As an excluded instrument for
the population change, I construct two shift share variables following Bartik (1991) and more
recently Glaeser et al. (2006), Saks (2008) and Saiz (2010). These variables predict a coun-
terfactual population growth based on industrial differences and differences in the distribution
of various ethnic groups across cities in 1968.26 I calculate the first instrument using national
variations of labor demand at the national level. I use these national evolutions to predict the
population growth based on initial industrial differences in 1968. The second instrument uses
change in population related to difference in ethnic group distribution in 1968 across cities.
Immigration inflows have been shown to be strongly associated with predetermined settlement
patterns of immigrant communities (Bartel, 1989; Card, 2001). I construct counterfactual flows
of immigrants in given cities using the national flows of immigrants from that community us-
ing 54 different nationalities available in the census across the years since 1968. The initial
distribution of immigrants across cities is likely to be conditionally unrelated with differences
in public housing supply across cities given that immigrants had basically no access to them
in 1968 as discussed above. Moreover, many immigrant communities entered France before
1958, when the first public housing programs were constructed.
26Note that because my model includes city fixed effects, I cannot instrument population growth using timeinvariant instruments such as differences in temperature across cities as in Glaeser and Gyourko (2005) or Saiz(2010).
13
Second, changes in the fractionalization index within cities over time are also likely to be
related with unobserved determinants of the public housing supply over time. Within cities, the
variations of the fractionalization over time come from different growth rate of the population
across municipalities of the urban areas. The variations of the political fractionalization within
urban areas might be a response to differences in public housing constructions across munici-
palities within urban areas. Large construction programs of public housing in one municipality
might influence the location choice of inhabitants within the urban area and, thus, influence
the supply of public housing at the urban area level. A good excluded instrument for political
fractionalization should be orthogonal to the population growth and changes in fractionaliza-
tion related to public housing construction between two periods. I follow Ciccone and Hall
(1996) and Combes et al. (2010) and use lagged geographical variables capturing the variations
in densities available across the municipalities of the urban area. The density of population
is one obvious proxy for the elasticity of housing supply across municipalities in a metropoli-
tan area because it causes housing supply constraints to be less binding across municipalities.
As political boundaries of municipalities were delimited during the French revolution and the
spatial size of municipalities differ widely, the instrument is thus linked with different urban-
ization patterns that were made possible within the boundaries of existing municipalities when
the density was low and those who increased by aggregating other municipalities. This pattern
is thus an indicator of the ability of the urban area to increase within the current boundaries
or through annexing other adjacent municipalities. In practice, I use the variables lagged 15
years.27 I compute the variance of population density across municipalities and the average and
weighted average density across municipalities.
2.2 Results
Table 5 presents a series of regression models based on Eq. (1) in which the dependant variable
is the public housing supply. Standard errors reported have been clustered within cities to take
into account a potential correlation of the error term across observations within cities. The
right-hand panel presents OLS regressions while the left hand panel presents 2SLS estimates27I use the variance in density lagged twice: I use 1962 densities with 1975 fractionalization, 1968 with 1982
and 1975 with 1990.
14
to take into account the potential endogeneity of the fractionalization index and population
growth. The first column reports regression results from a model without city fixed effects
while other columns include fixed effects.
The estimates in Table 5 point to a number of conclusions. The first four columns of the
table indicate a uniformly positive effect of the fractionalization index on the supply of public
housing, both in regressions with and without fixed effects. In regressions with fixed effects,
the parameter increases slightly indicating that changes in fractionalization within cities are re-
lated to the public housing supply. When controls for the population growth are included in the
model, the measured impact of fractionalization is actually higher: this indicates that variations
of the fractionalization index do indeed capture different urbanization patterns across cities and
do not only reflect differences in growth rates of the population across cities. Column (5) indi-
cates that results are similar when more cities are included in the sample.
As noted in the previous section, one concern with OLS estimates of Eq. (1) is the po-
tential endogeneity of the fractionalization index if differences in growth rates of population
within municipalities are related with the public housing supply. To address this concern, other
columns present regression results in which the fractionalization index is instrumented using
geographical variables related to lagged variations in densities across municipalities within the
urban area. Each excluded instrument for the fractionalization index proves to be strong com-
pared with the critical 5% value in Stock and Yogo (2002). The instruments also pass conven-
tional exogeneity tests. When the fractionalization index is instrumented, the coefficient is still
measured precisely and is slightly higher than in OLS regressions. Notice that the estimated
coefficient is strikingly similar to the one obtained in simple cross-section linear regression
reported in figure 3. Compared to an extremely fractionalized city, a unified city has a higher
public housing supply per inhabitants by about 12%. Therefore, this result suggests differences
in urbanization patterns do have an impact on the public housing supply. When the sample
includes more cities, as in column (5) and (9), results of the estimation are broadly similar,
even if the coefficient is somewhat lower in these specifications.
We now turn to the effect of population change on public housing supply. Simple OLS
regressions indicate that the impact of population growth and decline on the public housing
15
supply is not significant. On the other hand, 2SLS results suggest that there is a large asym-
metry between the increase and decrease of the population: the measured impact of a 1%
population decline is four times higher than a similar growth in population. As for the fraction-
alization index, each measure proves to be strong and passes conventional exogeneity tests. The
results strongly confirm that the public housing supply per capita tends to increase in declining
cities. In regressions including more cities in the sample, the impact of population decline is
significant even in OLS regressions while the effect of population growth is not significant. In
2SLS estimates using this sample, the impact of population decline is multiplied by 2. These
results confirm there is a connection between changes in public housing supply per capita and
population growth.
Finally, it should be noted that two other variables appear to be particularly significant in
most regressions: the immigrant share and the unemployment rate. For these variables, pa-
rameter estimates have a different sign between regressions with and without fixed effects.
Regression without fixed effect indicates that there is on average a lower public housing sup-
ply in cities with more immigrants and a higher unemployment rate, which is consistent with
evidence presented in figure 1 for the cross-section relationship between public housing supply
and the immigrant share. On the other hand, regressions with fixed effects indicate that public
housing per inhabitants increased more rapidly in cities where the immigrant stock and the un-
employment rate increased more rapidly, which is consistent with the hypothesis of a magnetic
effect of public housing on the location choice of immigrants.
Finally, I do not find any significant effect of the share of new immigrants or the graduate share.
The impact of having a mayor left wing mayor is negligible except in regressions with 433 cities
but its impact is economically small: it indicates that a urban area in with a left wing mayor
between two censuses will have a higher stock of public housing per inhabitants by 0.5%.
[Table 5 about here.]
16
3 Location Choice Model
Having documented the determinants of the variations of public housing supply within cities
in the last 30 years in France, we now turn to analyzing its consequences. In this section, we
investigate whether the dispersion of public housing supply across cities has influenced the lo-
cation choice of immigrants. Our aim is to use the variation in public housing supply induced
by the differences in political fractionalization and population change as a means to identify
the impact of public housing on the location choice.
The theoretical motivation for the empirical model of location choice builds upon the work of
Borjas (1999) on welfare magnets and Glaeser and Gyourko (2005) on durable housing. The
basic premise is that there is an asymmetry between the effect of public housing on immigrants
and natives. The model proposed by Borjas (1999) assumes that there are differences in welfare
benefits across locations and fixed costs to moving. Natives may have little interest in moving
to localities that offer the highest benefits if the differences in welfare benefits across regions
do not offset the moving costs. Family ties, for example, might deter natives’ internal migra-
tion (Mincer, 1978). In contrast, immigrants have already paid the fixed costs of migration.
Therefore, they can directly choose to live in localities that offer the highest level of welfare
benefits. A second explanation to an asymmetry of the effect of public housing supply be-
tween natives and immigrants may be that immigrants, particularly non-European immigrants,
are discriminated against in the private housing market as argued by Bouvard et al. (2009) and
are thus more attracted to public housing than natives are. If this is the case, then we should
observe a higher impact of public housing on the discriminated groups, which are potentially
non-European immigrants that form a more visible minority.
We first discuss the consequences of using public housing per capita as a proxy for the waiting
time for public housing on our estimates. In the second subsection, we present the econometric
model of location choice and while we discuss the endogeneity issues in the third subsection.
In the fourth subsection, we present the results of the estimates and discuss their robustness in
the fifth subsection.
17
3.1 Waiting Times and Public Housing Supply
Because differences in rents across housing projects are negligible, what matters for the loca-
tion choice, conditional to the characteristics of the city, are the differences in the probability
of being granted public housing and, thus, the average waiting time before obtaining a public
housing apartment. However, because figures on waiting times for public housing across lo-
calities are not available, I use the number of public housing units per capita, denoted as pj , as
a proxy for waiting times. A first question is whether public housing per capita is an accurate
measure for the availability of public housing in a given city. To answer this question, I use
data from the 1996 and the 2002 Housing Condition surveys. This dataset contains information
on waiting times after application for households living in public housing at the time of the
survey and after having obtained a flat during the three years prior to the survey.28 For reasons
of confidentiality, there is no information on the municipality or agglomeration of residences
on the public-use files of these surveys, but there is information on region and counties (dé-
partement) of residence. For each region29, I computed the average waiting time per region
reported by new public housing inhabitants living in agglomerations with more than 100 000
inhabitants.30 Figure 5 presents the relationship between the log of waiting time and the log of
public housing per capita. There is a clear negative relationship between average waiting times
and the public housing supply across regions, while the region Ile-de-France, which designates
the Paris regions, stands out as an obvious outlier.31 The previous evidences suggest that public
housing supply per capita might offer a reasonable proxy for the availability of public housing.
[Figure 4 about here.]
A second question is what is the consequence of using the public housing supply per inhabitants
instead of using waiting times directly in our estimates? Waiting times can be thought of as
a function of both supply and demand for public housing, which might explain why the Paris28This information is not available on earlier Housing Condition surveys.29The sample size is 2,490 observations. This small sample size does not enable me to compute specific waiting
times for immigrants. I use regions because I do not have enough observations to compute reliable averages acrosscounties. Four sparsely populated regions with fewer than 15 individual observations have been aggregated withthe neighboring region.
30I have also calculated normalized waiting times with regressions controlling for the impact of differences inhousehold characteristics on waiting times.
31A regression of the log waiting time on the log of public housing per capita, excluding the Paris region,provides a parameter (standard error) of -0.32 (0.13).
18
region is an outlier in the previous regression. Therefore, the previous regression only provides
an unbiased estimate of the relationship between supply and waiting times if the covariance
between supply and demand is zero. Suppose, for example, the waiting time for public housing
in city j is a linear function of a vector of k city characteristicsXj , which controls for the effect
of demand of public housing and the public housing stock per capita pj , which controls the
effect of supply:
Waitij = β0 +Xjβ1 + β2pj + ηi + uj
with β2 < 0 by assumption and ηi is an individual fixed effect, constant across location, which
accounts for the effect of household characteristics on the waiting time. Assume that the utility
of choosing city k for an immigrant i depends on city characteristics and negatively on the
waiting time:
Uij = γ0 +Xjγ1 + γ2iWaitj + εij
where γ2i is specific to the individual to capture the fact that some immigrants might not be
interested in applying for public housing. Combining the previous two equations to eliminate
where Uikt is the level of utility provided by location k to individual i in year t. The unob-
served component of utility εikt captures unobserved factors affecting utility. The resulting
estimates of δ provide information on the effect of public housing supply on the utility of im-
migrants, whereas αi indicate the effect of population gain and losses. The fixed effects Γk
control for constant over time unobservable characteristics of the city that may influence immi-
grants’ location decisions. Identification in this case relies from the within-location variation
of the covariates over time, and this model is estimated by pooling all cohorts together in the
sample. Cities’ characteristics, such as average temperature or distance to the country of origin,
typically introduced in location choice models and other various amenities that are invariants
over time, are absorbed by the fixed effects included in the model.
The main challenge in estimating the model of Eq. 3 is that variations of the public housing
supply within cities over time are related with unobserved characteristics of the city. To rule
out the possibility that the potential correlation between housing and location decision comes
from new housing that was built in response to immigrant flows, I estimate models using the
lagged stock of public housing pik,t−l where t − l is the year of the previous census.32 I also
present estimates of a dynamic version of Eq. (3):
Uikt = Ziktθ1 +Xktθ2 + α1POPGAIN + α2POPLOSS (4)
+δpk,t + δlagpk,t−l + δleadpk,t+l + γk + εikt
32Given that I use the lagged housing stock, I cannot use the arrivals before 1968 to estimate the previous modelas no information is available to compute the evolution of the housing stock between 1962 and 1968.
20
The lag values of public housing supply reflect the possibility of a time lag between the con-
struction of new public housing and the arrival of immigrants to the city. The lead terms enable
me to test for endogenous shifts of public housing supply following immigration. If the estima-
tion of the lead coefficient δlead is significant and positive, this can be interpreted as evidence
of reverse causality, whereas an estimate close to zero is consistent with the absence of such an
effect.
The model also controls for the growth rate of the population of the urban area in the regres-
sion, which accounts for the attractiveness of expanding cities for immigrants. The population
increase or decrease size is likely to be correlated with job opportunities and general economic
dynamism. I follow Glaeser and Gyourko (2005) and allow its effect to differ if the city is
growing or declining.
Finally, the vector Xkt is a set of control variables that vary at the city level and that re-
flect changes in the underlying characteristics of the city. To capture differences in economic
opportunities across cities, I use the differences in unemployment rates across cities, as no in-
formation on wages is collected across censuses. Similarly, differences in industrial structures
across cities may also influence immigrant choices because their occupational distribution is
different from those of natives. I use the percentage of workers employed in manufacturing
(as opposed to workers in the service industry or in public administration) with information on
industry affiliations. Because immigrants work in particular sectors of the economy, I also in-
clude in the model 10 variables that contain the distribution of workers across 11 industries. As
a proxy for the socio-demographic characteristics of the city, I include the percentage of uni-
versity graduates. This last variable should capture the attractiveness that more educated cities
have had in recent periods (Glaeser and Saiz, 2004). Variables in Zikt capture both the effect of
community size (of those from the same region/country of birth) and vary within communities
of immigrants across cities. Large communities of similar immigrants may offer larger net-
works for finding jobs, a larger linguistic community and may also minimize the psychological
costs of living in another country. I use two variables to evaluate the effect of the size of the
community: for each urban area, I compute the percentage of individuals in the city who are
immigrants from the same country/region of birth and the percentage of the community living
21
in the urban area. Unlike previous studies and because of the large sample extracts available
over the chosen period, I distinguish between groups with 54 different countries of birth, which
are always reported separately across censuses.33 New immigrants are excluded from these cal-
culations. I also include the total immigrant share of the city in the regression calculated using
immigrants from all origins. This variable controls for the characteristics that cities with many
immigrants ("traditional immigrant cities") might have. Cities with many immigrants may be
more attractive because they are more tolerant of the presence of immigrants.
To estimate (3), an assumption must be made regarding the density of the unobserved portion
of utility f(εikt). I follow the current approach used in literature regarding immigrants’ location
choices and assume that εikt is an independent and identically distributed extreme value.34 One
characteristic of the conditional logit model is that the relative odds of choosing two alterna-
tives are independent from the availability or attributes of other alternatives, a property known
as the Independence from Irrelevant Alternatives, or IIA. This hypothesis, common in literature
on immigrants’ location choices, considerably simplifies the analysis.35
3.3 Endogeneity Issues
As stated above, the main econometric issue confronting the estimations of Eq. (3) is the pos-
sibility that the public housing supply is correlated with unobserved city-specific factor that
affects the utility of choosing a given city. Problems of reverse causality might bias the esti-
mates upward if public housing construction were related to other unobserved (by the econo-
metrician) changes that increased the desirability of a city. Given the nonlinear model, I use
a control function approach to deal with this potential endogeneity of the changes in public
housing supply over time (Petrin and Train, 2010; Liu et al., 2010). Let me specify the error in
33Unreported estimates show that the estimated effect of immigrant concentration is much lower when theindexes of immigrant concentration are defined by region of birth instead of country of birth. I assign otherindividuals (less than 5% of new immigrants on average) into four regions of birth groups (Europe, Asia, Africaand Other).
34The conditional logit model is used in Bartel (1989), Kaushal (2005), Bauer et al. (2005), Jaeger (2008) andGiorgi and Pellizzari (2009).
35An alternative would be to estimate a nested logit, which would partially relax the IIA assumption. Eachnest, for example, would include several locations in the same region. This approach requires a computationallymore complex estimation procedure and would require more identifying variance than is available from the datain which many predictors included vary only at the city level. Moreover, there is no straightforward way to decidehow nests should be defined and results may depend on this choice McFadden (1982).
22
the utility function as a two-component error: εikt = ρξkt + εikt where εikt is an idiosyncratic
error term, assumed to be independent across individuals and locations, while ξjt is observed by
immigrants and influences their location choice but is unobserved by the researcher. If pjt and
ξjt are related, such that, for example, a higher level of public housing is constructed in cities
in which the unobserved factor is higher, εikt and pkt will be correlated, even after conditioning
on other covariates. This correlation violates the weak-exogeneity requirement for conditional
logit covariates and leads to inconsistent parameter estimates. Petrin and Train (2010) illus-
trates how the use of a control function can be used to test and correct the omitted-variables
problem. Denote as X the vector n × l of all l covariates included in the regression that vary
at the city level and the city fixed effects and H as an n-vector of a variable varying at the
city level not included in X but correlated with p. This variable does not affect utility directly
but only through its relationship with p. The linear projection of p on the exogenous variables
is p = Xπ1 + π2H + µ(ξ) which implies E(X ′µ) = 0 and E(H ′µ) = 0 where µkt(ξkt)
is one to one with ξ. The method consists in first performing a linear regression of p on X
and H to obtain a consistent estimate of π. The residual is then used to construct the control
function f(µ, λ), where µ is the disturbance from the first stage regression and λ a vector of
estimated parameters. Denoting byW the vector of all variables included in the location choice
model, utility can now be written: Uikt = Wiktθ + f(µkt, λ) + ηikt, where the new error term,
ηikt = βξkt − f(µkt, λ) + εikt, includes the difference between the actual specific error βξjt
and the control function plus the idiosyncratic error term. With additivity and independence
assumptions, µkt are straightforward to recover using OLS. Residuals from these regressions
can be thus used to estimate the control function.
As excluded instruments, we use the concentration index and the counterfactual growth of
the population described in the previous section. We thus assume that the concentration index
and the counterfactual population growth does not affect utility directly but only through their
relation with p. Notice that we assume that the growth and decline of the population to be
exogenous to the location choice of the individual: the actual growth rate and decline of the
population of the city already controls for the actual dynamism of the urban area. We include
directly in the first stage regression predicting the public housing supply the two different coun-
23
terfactual population growths described in the previous section. These sources of variation of
the population influence the variations of the public housing supply per capita but probably do
not influence the utility of the location choice model once the actual population growth and
other covariates controlling for city characteristics, particularly the actual distribution of work-
ers across industries and of ethnic groups across urban areas, are included in the model.
However, as discussed in the previous section, the variations of the fractionalization index,
which we assume to be excluded from the utility affecting the location choice, might them-
selves be endogenous in the location choice model. In other words, H might be related to the
same unobservable variations across cities which influence p. As in the previous section, we
use a set of lagged geographical variables denoted I , which are related to H that we assume
exogenous to the location choice model.36 The linear projection ofH on exogenous variables is
H = Xθ1 + Iθ2 + e where E(Xe) = 0 and E(Ie) = 0 by assumption. I construct the CF using
the residuals of the second stage regression p = Xπ1 + Hπ2 + e2 where e2 = π2(H − H) + µ
and H is the predicted value of H from the OLS regression of H on the exogenous variables
X and I . Finally, I specify the control function as linear in µkt. When a control function that
includes predicted values is added to the estimations, the coefficients are consistent but the
standard errors are invalid. I use bootstrapping methods to correct the standard errors.37
3.4 Results
I now present the estimates of the location choice model of new male immigrants who arrived in
France between 1962 and 1990. To simplify the interpretation of the results, I have standardized
all predictors to have an average of zero and a standard deviation of one across the 57 urban
areas included in the study. Concentration indexes, which vary by country of origin and city,
are thus standardized at the individual level.38 Because of the logistic form of the model,36Given that I is exogenous to the location choice model, it would be possible to include it directly in the control
function if I directly affected p. However, empirical evidences suggest that the variables I do not influence pdirectly but are related to H .
37While the delta method can be used to obtain analytical standard errors (Karaca-Mandic and Train, 2003),the bootstrap is simple and feasible with conditional logit. In the first stage, we bootstrap the city sample andregress the private wage on the exogenous variables. The control function in the second stage is a function of thefirst-stage residual. We run the conditional logit and the first-stage OLS or 2SLS with 100 replications for eachmodel including a control function.
38This assumption is equivalent to assuming that the relative dispersion of these variables within groups deter-mines the choice, rather than the absolute value, of the percentages. For example, the average percentage of the
24
the standardization simplifies the quantitative interpretation of the results. Denote P as the
predicted probability of the average city and Pk as the predicted probability of the average city
in which the variable k is higher by one standard deviation. In the appendix, I show that the
coefficient of a conditional logit in which the predictors have been standardized is equal to the
log difference between these two probabilities, logPk − logP = γk, where γk = βkσxk and
σxk is the standard deviation of the variable k with respect to initial alternatives included in the
choice set.
[Table 6 about here.]
I present different estimations depending on whether the immigrant is reported to be living as
a couple with children or not in the sample. Immigrants with children are more likely to be
eligible and to apply for public housing because they have a larger household size. The lower
panel of Table (2) indicates that 30% of non-European new immigrants couples lived in public
housing in 1990 against 15% for other immigrants. Therefore, differences in the estimated ef-
fect of public housing between these two groups offer a first test for whether our estimates are
biased by potential unobserved confounding factors. Similarly, a separate model is estimated
for Europeans and Maghrebis that allows the parameter to differ between these two groups.
Several models using different strategies to account for the endogeneity of the public housing
supply are reported: models in column (1) and (4) simply use the lag of the public housing
supply. To derive whether results depend on the choice of the excluded instrument included in
the control function, I report estimates using two alternative control functions constructed us-
ing separately the fractionalization index (column (2) and (4)) or the counterfactual population
growth (column (3) and (6)).
Table 6 presents estimation results from regressions for new male immigrants living as a
couple with children. The results strongly indicate that public housing influences the location
choice of new immigrants living as a couple with children. Unsurprisingly, given that European
immigrants are not overrepresented in public housing, parameter estimates suggest that public
housing has a much higher effect on immigrants from Maghreb than on European immigrants.
city population for immigrants from Algeria is 1%, whereas it is 0.01% for immigrants from Cameroon. Becausethe size of these two groups is different, normalizing is similar to assuming that a percentage of similar immigrantsof 1% has a different effect on immigrants from Cameroon than on immigrants from Algeria.
25
The estimated parameters imply that for an immigrant from Maghreb living as a couple, an
increase of one standard deviation in the public housing supply (about 5% over the period)
increases the probability of choosing the "average" city by about 25% for Europeans and 65%
for immigrants from Maghreb. Inclusion of the control function does not substantially change
the results. In both models used to construct the control function, the residuals enter signifi-
cantly and the coefficient is positive. A positive residual theoretically occurs when the change
in public housing supply is related to changes in other desirable characteristics of the city.
[Table 7 about here.]
If the impact of public housing that we capture in the previous regressions does not come
from spurious correlations, we should find much less impact of public housing on immigrants
who are less likely to be eligible in the short run, namely immigrants without children. Table
7 presents regressions estimated using new immigrants not living as a couple with children.
While the first column indicates a significant positive effect of public housing for European im-
migrants, the second column reports estimates of a model including a control function that ren-
ders the coefficient not statistically significant. In regressions using immigrants from Maghreb,
the effect of differences in public housing supply is even negative, which suggests that the
evolution of public housing supply within cities for this group might be related to undesirable
characteristics of the city imperfectly absorbed by the control variables included in the model.
With this sample, the estimated effect of public housing is different when one includes the con-
trol function: it turns insignificant with European and decreases slightly with immigrants from
Maghreb. As before, the residuals enter significantly and the parameter is positive most of the
time.
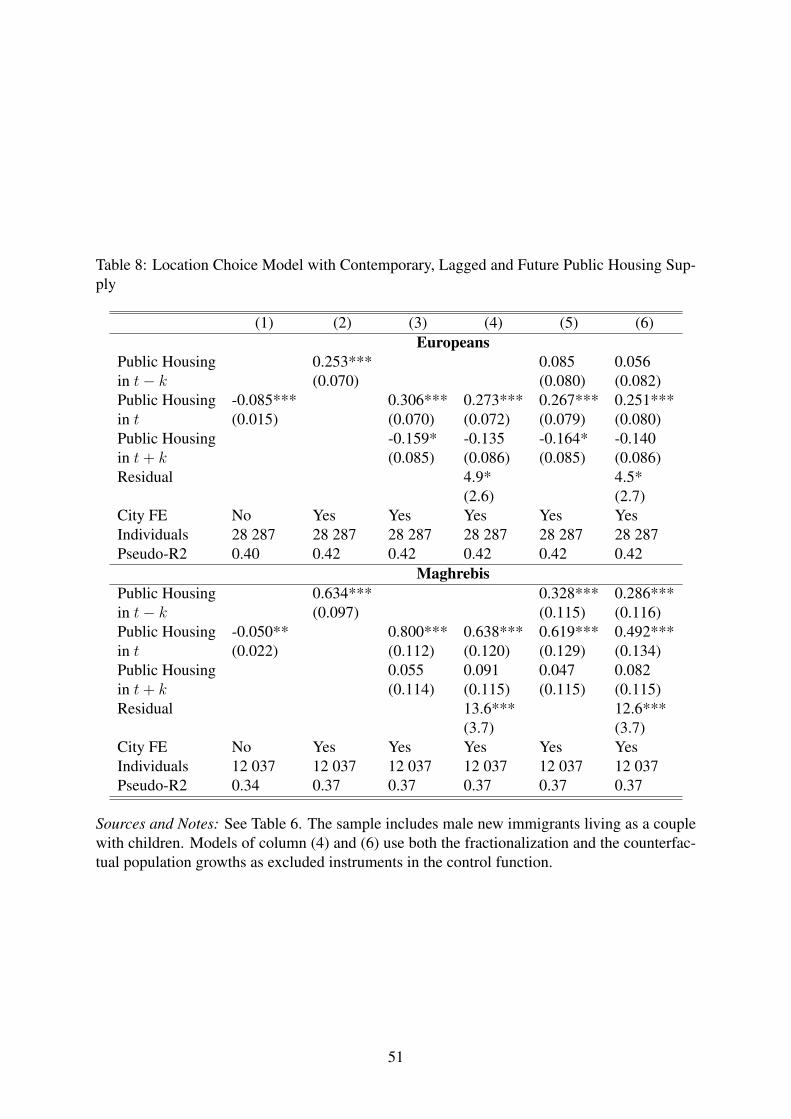
[Table 8 about here.]
To further probe the possibility of reverse causality, Table 8 reports estimates of models that
include lagged, current and future measures of the presence of public housing supply using
data from 1999. The first column reports regression results of the model without fixed effects:
the parameter is negative and significant. This indicates that cities with a large public housing
26
supply are not particularly attractive to immigrants with respect to other cities and that a large
public housing supply might be related to undesirable characteristics of the cities that are ab-
sorbed by the fixed effects in other regression. Other columns indicate that the contemporary
public housing supply appears to have the highest impact on the location choice with respect to
lagged and future public housing supply. For European immigrants, only contemporary public
housing supply is significant, lagged public housing supply coefficient being positive but not
significant. For immigrants from Maghreb, both lagged and contemporary public housing sup-
ply are significant. However, the coefficient of the past public housing supply is much lower
than the coefficient of the contemporary. More importantly, when we include the lead values of
the public housing supply in the models in columns 3,4, 5 and 6, we find that the coefficients
on the leads are all small, negative and statistically insignificant. While these tests are far from
definitive tests, they do provide some evidence that the relationship between public housing
supply per capita and immigrant flows is not driven by serious reverse causality.
[Table 9 about here.]
Finally, Table 9 presents regression results using other non-European immigrant groups. There
are far fewer individuals in these groups in the sample before 1982 as indicated by Table 1. This
group provides much less variations to estimate a model with fixed effects and, thus, the pa-
rameter estimates are much more imprecise. Regression results show nonetheless a significant
effect of differences in public housing in the model without control function, but this effect be-
comes insignificant when a control function is included. Columns (4) and (5) estimate a model
in which all non-European immigrants have been pooled in the same sample: this specification
provides many more variations to estimate the impact of city characteristics across groups but
constrain the other parameters of the utility function to be identical across groups of immi-
grants. The results from this model indicate a relatively similar impact on differences in public
housing supply across non-European groups. Once again, including the control function does
not change the results much.
Overall, we conclude there is robust evidences that differences in public housing supply
across cities attracted some new immigrant groups, particularly non-European immigrants with
a larger family.
27
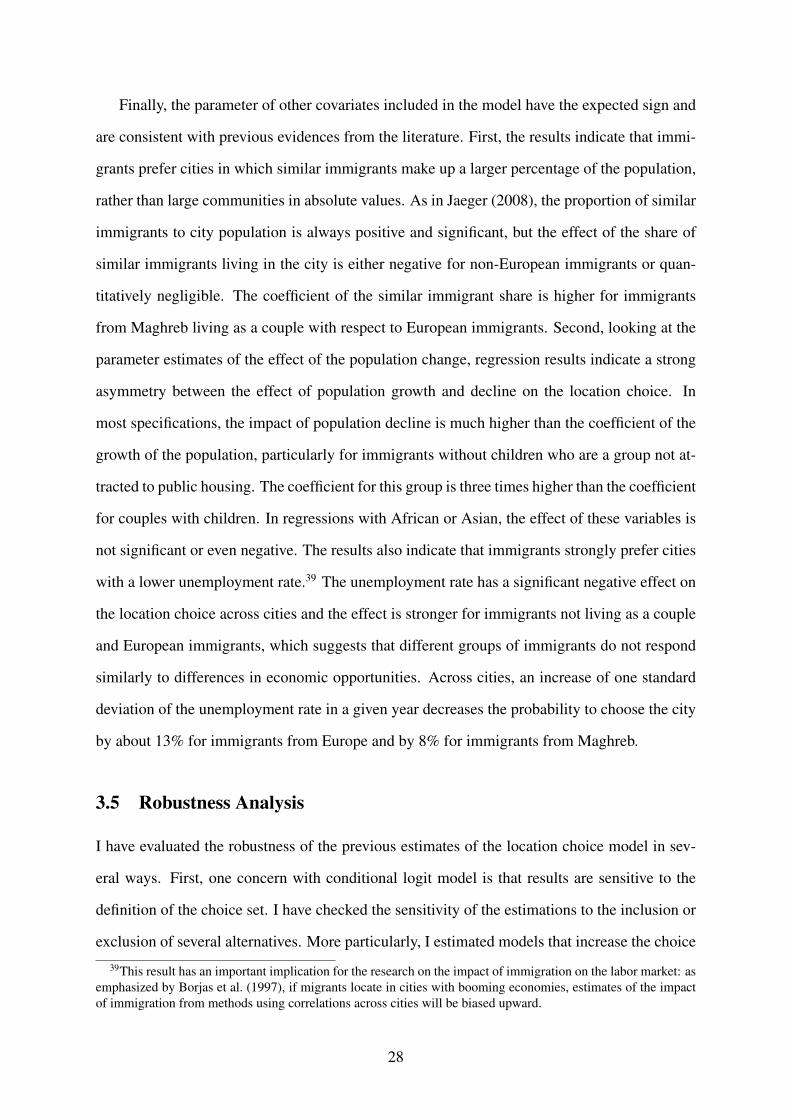
Finally, the parameter of other covariates included in the model have the expected sign and
are consistent with previous evidences from the literature. First, the results indicate that immi-
grants prefer cities in which similar immigrants make up a larger percentage of the population,
rather than large communities in absolute values. As in Jaeger (2008), the proportion of similar
immigrants to city population is always positive and significant, but the effect of the share of
similar immigrants living in the city is either negative for non-European immigrants or quan-
titatively negligible. The coefficient of the similar immigrant share is higher for immigrants
from Maghreb living as a couple with respect to European immigrants. Second, looking at the
parameter estimates of the effect of the population change, regression results indicate a strong
asymmetry between the effect of population growth and decline on the location choice. In
most specifications, the impact of population decline is much higher than the coefficient of the
growth of the population, particularly for immigrants without children who are a group not at-
tracted to public housing. The coefficient for this group is three times higher than the coefficient
for couples with children. In regressions with African or Asian, the effect of these variables is
not significant or even negative. The results also indicate that immigrants strongly prefer cities
with a lower unemployment rate.39 The unemployment rate has a significant negative effect on
the location choice across cities and the effect is stronger for immigrants not living as a couple
and European immigrants, which suggests that different groups of immigrants do not respond
similarly to differences in economic opportunities. Across cities, an increase of one standard
deviation of the unemployment rate in a given year decreases the probability to choose the city
by about 13% for immigrants from Europe and by 8% for immigrants from Maghreb.
3.5 Robustness Analysis
I have evaluated the robustness of the previous estimates of the location choice model in sev-
eral ways. First, one concern with conditional logit model is that results are sensitive to the
definition of the choice set. I have checked the sensitivity of the estimations to the inclusion or
exclusion of several alternatives. More particularly, I estimated models that increase the choice
39This result has an important implication for the research on the impact of immigration on the labor market: asemphasized by Borjas et al. (1997), if migrants locate in cities with booming economies, estimates of the impactof immigration from methods using correlations across cities will be biased upward.
28
set from 53 to 25 alternatives or exclude the Paris urban area in the choice set. The results
relative to the impact of public housing on location choice are qualitatively unaffected by such
changes in the choice set. As a consequence, all of these results do not offer evidence against
the use of a conditional logit. Second, the appropriate control function is a specification issue.
I tried other specifications, including a quadratic error term. These alternative specifications all
provided very similar results. Third, to check the robustness of these results to the definition
of the public housing supply, I estimated models in which turnover rates in public housing are
used instead of the stock of public housing to evaluate differences in housing supply. Turnover
rates were calculated by dividing the number of public housing units among households who
were absent during the previous census over the total city population. Given that information
on public housing participation is needed to compute turnover rates, only censuses after 1975
can be used. The results are broadly similar.
A concern with the model of location choice is that it does does not control for differences
in rents across cities. If rents are lower in cities with high public housing supply, our estimated
might be biased by this omission. However, data on rent and housing prices at the city level
are not available during the entire chosen time period. It is nonetheless possible to find data for
the 1990s on average housing costs across cities on the private housing market. I include these
figures in the regression using the average housing cost of the main municipalities of the urban
areas in 1990. In most regressions, differences in housing costs are insignificant or are econom-
ically negligible for most immigrant groups. More importantly, controlling for differences in
housing costs across cities does not affect the parameters of public housing on the regression.
Another concern arise from the fact that new immigrants are defined as those who arrived
between two censuses. Therefore, their exact arrival date may vary between 1-8 years prior to a
census date, depending on the period of time between censuses. This diversity can potentially
be a problem if immigrant locations change frequently during their first few years in France.40
There is no variable indicating the arrival year of migrants in 1982 and in 1990. A variable
indicating the arrival year for migrants arriving in France since the last census is only par-
40Jaeger (2008) and Kaushal (2005) using an exhaustive administrative dataset of legal immigrants from the USimmigration service’s attempt to deal with this problem by restricting the sample to individuals who arrived thesame year using the address where the green card was sent. Bartel (1989) uses the 1990/1982 sample of the USCensus, which indicates the arrival year of immigrants and aggregates immigrants by cohorts of five arrival years.
29
tially available in the 1975 Census.41 To determine whether duration in France affects location
choice, I estimated different location choice models by grouping new immigrants by three-year
arrival groups for those who arrived between 1962-1968, 1969-1974 and 1990-1999. Most of
the time, results were not qualitatively different across different arrival years. Moreover, ad-
missions decisions in public housing typically takes time, implying that the magnetic effect of
public housing on immigrant location decisions may not be observed by the initial location, but
only after a few years in France when an admission to public housing has been granted.
4 Conclusion
The past decades have been characterized by a large increase in public housing supply across
European countries. In this paper, we first studied the determinants of the public housing supply
per inhabitants across French cities over time. The paper emphasized the role of political
fractionalization and city decline in explaining changes in public housing supply within cities.
Then the paper studied the impact of public housing on the location choices of new immigrants
using the previous evidences to take into account the potential endogeneity of the evolution of
the public housing supply. The study finds relatively robust evidence that the availability of
public housing influences the location choices of new immigrants with children, particularly
non-European immigrants. Immigrants living as a couple tend to choose cities with a relatively
higher supply of public housing.
[Table 10 about here.]
The implications of these results in terms of public policy are ambiguous. On the one hand,
public housing probably attracts non-European immigrants in cities with fewer economic op-
portunities particularly because declining cities tend to offer more public housing. In these
cities, immigrants are more likely to be unemployed and to live on welfare, which is a non-
negligible risk because the unemployment rate of immigrants in France is double that of na-
tives. On the other hand, public housing may also have diminished the incentives to live in
cities with a large immigrant share, in which they benefit from social networks and social ties
41Values are missing for more than 30% of the sample in 1974.
30
but are isolated from the rest of the population. As a matter of fact, empirical evidences in-
dicate that the distribution of non-European immigrants in public and private housing across
urban areas differs widely; public housing participants are much less concentrated across cities
than are private housing participants. Table 10 reports the Herfindahl and the dissimilarity
index of the distribution of immigrants across cities with several characteristics of cities for
individuals in private and public housing in 1999.42 For most groups, both the Herfindahl and
the dissimilarity index for the public housing group are lower, particularly for immigrants from
Asia and Africa. The third column indicates that a considerably lower share of immigrants
in public housing live in traditional immigrant cities (Paris, Lyon and Marseille), particularly
African or Asian immigrants, compared to immigrants in private housing. Interestingly, notice
that for European immigrants, differences in city characteristics between individuals in private
and in public housing are negligible. Finally, the last column indicates that, on average, public
housing participants live in cities with fewer immigrants. If public housing has a causal effect
on the location choices of immigrants, the evidence given in Table 10 suggests that without
public housing many more immigrants would probably be concentrated in few cities. There-
fore, in some sense, this evidence suggests that public housing might have helped to "spread"
immigration over France.
Finally, the reason that the impact of public housing on immigrants differs widely between
European and non-European immigrants and between immigrants and natives across Europe is
deserving of more research. It remains to be explored whether the overrepresentation of non-
European immigrants in public housing is due to specific financial constraints, discrimination
in the housing market, or a low supply of cheap housing for families in the private housing
market.42The dissimilarity index uses cities as the base geographical definition. It represents the share of immigrants
that would have to switch cities to achieve an even distribution across cities.
31
Appendix
4.1 Interpretation of parameters of conditional logit with standardized
variables
In this section, I show that the parameters of a conditional logit where the predictors have been
standardized such that the variables of the choice set of each individual have an average of zero
and a variance of one have a simple and intuitive interpretation. See Gelman (2008) for a more
general discussion on the interest of scaling predictors of regressions model. Suppose the true
model is given by Eq. (3). Denote by zkj =xk
j−xk
σxk
the standardized variable of the predictor k of
alternative j; xk and σxk , respectively, the average and the standard deviation of the predictor
k over the initial choice set. Because only differences in utility matter (Train, 2003, p.23), the
model described by (3) can be rewritten as ZUiJ = ziJγ + εij, where the relation between β
and γ is simply given by βk = γk
σxk
for all predictor k.
Let me consider the counterfactual probability of choosing two alternatives not included in
the initial choice set. The first is the ‘average’ city for which the characteristics are equal to the
average of the J preexisting alternatives. The second is identical to the ‘average’ city except
that the characteristic l is equal to the average plus one standard deviation. When the predictors
have been standardized, the characteristics of the average city are a vector of zero, whereas the
vector of characteristics of the other additional alternative z is zl = 1 and zk = 0 for ∀k 6= l.
The probability P of the average alternative is equal to P = 1
1+exp(γk)+∑J
j exp(zjγ)whereas the
probability Pl for the other alternative is Pl = exp(γl)
1+exp(γl)+∑J
j exp(zjγ). It is straightforward to
derive that Pl
P= exp(γl) which implies that logPl − logP = γl. The previous expression
indicates that the parameter γl is equal to the log difference between the probability of choos-
ing the ‘average’ city and the probability of choosing the average city in which predictor l is
higher by one standard deviation when both cities are included in the choice set. Note that the
relationship between βl and γl is a function of the variance σxl and therefore γl depends on the
initial alternatives included in the choice set and used to standardize the variables.
32
References
Aydemir, Abdurrahman and George J. Borjas, “Attenuation Bias in Measuring the Wage
Impact of Immigration,” 2006.
Bartel, Ann P., “Where Do the New U.S. Immigrants Live?,” Journal of Labor Economics,
1989, 7 (4), 371–391.
Bartik, Timothy J., Who Benefits from State and Local Economic Development Policies? num-
ber wbsle. In ‘Books from Upjohn Press.’, W.E. Upjohn Institute for Employment Research,
November 1991.
Bauer, Thomas, Gil Epstein, and Ira Gang, “Enclaves, language, and the location choice of
migrants,” Journal of Population Economics, November 2005, 18 (4), 649–662.
Boeldieu, Julien and Suzanne Thave, “Le logement des immigrés en 1996,” INSEE Première,
August 2000, 730.
Boeri, Tito, “Immigration to the Land of Redistribution,” Economica, October 2010, 77 (308),
651–687.
Borjas, George J., “Immigration and Welfare Magnets,” Journal of Labor Economics, 1999,
17 (4), 607–637.
, “Does Immigration Grease the Wheels of the Labor Market?,” Brookings Papers on Eco-
nomic Activity, 2001, (1), 69–119.
, Richard B. Freeman, and Lawrence F. Katz, “How Much Do Immigration and Trade
Le Blanc, David, Anne Laferrère, and Rémy Pigois, “Les effets de l’existence du parc HLM
sur le profil de consommation des ménages,” Économie et Statistique, 1999, 8 (328), 37–59.
35
Lequin, Yves, “Immigrés en Ville,” in Yves Lequin, ed., Histoire des Étrangers et de
l’Immigration en France, Larousse 2006, pp. 408–429.
Liu, Xuepeng, Mary E. Lovelt, and Jan Ondrich, “The Location Decision of Foreign In-
vestors in China: Untangling the Effect of Wages Using a Control Function Approach,” The
Review of Economics and Statistics, 2010, 92 (1), 160–1666.
McFadden, Daniel L., Qualitative Response Models, Vol. Advances In Econometrics: Invited
Papers For The Fourth World Congress Of The Econometric Society, Cambridge University
Press,
Mincer, Jacob, “Family Migration Decisions,” Journal of Political Economy, October 1978,
86 (5), 749–73.
Musterd, S. and RC Deurloo, “Ethnic segregation and the role of public housing in Amster-
dam,” Tijdschrift voor economische en sociale geografie, 1997, 88, 158–168.
Oreopoulos, Philip, “The Long-Run Consequences Of Living In A Poor Neighborhood,” The
Quarterly Journal of Economics, November 2003, 118 (4), 1533–1575.
Petrin, Amil and Kenneth Train, “A Control Function Approach to Endogeneity in Consumer
Choice Models,” Journal of Marketing Research, 2010, 47 (1), 3–13.
Pischke, Jorn-Steffen and Johannes Velling, “Employment Effects of Immigration to Ger-
many: An Analysis Based on Local Labor Markets,” The Review of Economics and Statistics,
1997, 79 (4), 594–604.
Priemus, H. and F. Dieleman, “Social housing policy in the European Union: past, present
and perspectives,” Urban Studies, 2002, 39 (2), 191–200.
Rutter, J. and M. Latorre, Social housing allocation and immigrant communities, Equality
and Human Rights Commission, 2008.
Saiz, Albert, “The Geographic Determinants of Housing Supply*,” Quarterly Journal of Eco-
nomics, 2010, 125 (3), 1253–1296.
36
Saks, Raven E., “Job creation and housing construction: Constraints on metropolitan area
employment growth,” Journal of Urban Economics, July 2008, 64 (1), 178–195.
Schor, Ralph, Histoire de l’immigration en France de la fin du XIXe siècle a nos jours, Armand
Colin, 1996.
Stébé, Jean-Marc, Le logement social en France, PUF, 2007.
Stock, J.H. and M. Yogo, “Testing for weak instruments in linear IV regression,” NBER Work-
ing Paper, 2002.
Tavan, Chloé, Agnès Dugué, Jean-Paul Caille, and Maryline Bèque, Les immigrés en
France, INSEE, 2005.
Train, Kenneth, Discrete Choice Methods with Simulation, Cambridge University Press, 2003.
Weil, Patrick, La République et sa diversité: Immigration, intégration, discriminations, Seuil,
2005.
37
List of Figures1 Public Housing Supply Increase 1968-1999 and Initial Immigrant Stock in 1968 392 Change in Public Housing Supply 1982-1990 over Share of New Public Hous-
ing Units Inhabitants who are Immigrants . . . . . . . . . . . . . . . . . . . . 403 Public Housing Supply and Fractionalization . . . . . . . . . . . . . . . . . . 414 Public Housing Supply and Population Growth . . . . . . . . . . . . . . . . . 415 Waiting Times and Public Housing Supply across Regions . . . . . . . . . . . 42
38
BAYONNE
AVIGNON
DOUAI
BRUAY−LA−BUISSIERE
LYONPARIS
ANTIBES
NICE
AIX−EN−PROVENCE
CAEN
DIJON
BREST
TOULOUSE
BORDEAUXMONTPELLIER
RENNES
TOURS
GRENOBLE
SAINT−ETIENNE
NANTES ORLEANS
ANGERS
REIMS
NANCY METZ
DUNKERQUEVALENCIENNES
LILLE
LENS
CLERMONT−FERRAND
PAU
PERPIGNAN
STRASBOURG
MULHOUSE
MANS
ANNECY
HAVREROUENAMIENS
TOULON
LIMOGES
DPubHousing= 0.14 − 0.60 PIMMIG(0.01) (0.14)
.05
.1.1
5.2
Cha
nge
in P
ublic
Hou
sing
per
Inha
bita
nts
1968
−19
99
0 .05 .1 .15 .2Immigrant Share in 1968
Figure 1: Public Housing Supply Increase 1968-1999 and Initial Immigrant Stock in 1968
Sources: 1999 and 1968 Census of Population and 1999 Census of Housing.
39
VALENCE
ROMBAS
BAYONNE
AVIGNON
DOUAI
BRUAY−LA−BUISSIERE
LYON
PARISANTIBES
NICE
TROYES
AIX−EN−PROVENCE
CAEN
ANGOULEME
ROCHELLE
DIJON
MONTBELIARDBESANCON
BRESTNIMES
TOULOUSE
BORDEAUX
MONTPELLIER
RENNES
TOURS
GRENOBLESAINT−ETIENNE
SAINT−NAZAIRE
NANTES
ORLEANS
ANGERS
REIMS
NANCYLORIENT
THIONVILLE
METZ
MAUBEUGE
DUNKERQUE
VALENCIENNES
LILLE
CALAIS
LENS
CLERMONT−FERRANDPAU
PERPIGNAN
STRASBOURG
MULHOUSE
MANS
CHAMBERY
ANNECY
HAVREROUEN
MELUN
AMIENS
TOULON
POITIERS
LIMOGES
DPHLM = 2.63 − 5.83 SHNIMMIG(0.25) (2.43)
R2 = 0.09
01
23
45
Cha
nge
in P
ublic
Hou
sing
per
Inha
bita
nts
1982
−19
90
0 5 10 15 20Share Immigrants in New Public Housing Units
Figure 2: Change in Public Housing Supply 1982-1990 over Share of New Public HousingUnits Inhabitants who are Immigrants
Sources: 1982 and 1990 Censuses of Population, 1990 Census of Housing. Note: The sample
includes 57 cities with more than 100 000 inhabitants in 1990.
40
AVIGNON
DOUAIBRUAY−LA−BUISSIERE
VILLEURBANNEPARIS
ANTIBESNICE
AIX−EN−PROVENCE
CAEN
DIJONBREST
TOULOUSEBORDEAUX
MONTPELLIER
RENNES
TOURS
GRENOBLE
SAINT−ETIENNE
NANTESORLEANS
ANGERS
REIMS
NANCYMETZ
DUNKERQUE
VALENCIENNES
LILLE
LENS CLERMONT−FERRAND
STRASBOURG
MULHOUSE
MANS
HAVREROUEN AMIENS
TOULON
LIMOGES
R2=0.20
PUBLIC HOUSING=0.10 + 0.10 HERFIND(0.01) (0.03)
.05
.1.1
5.2
.25
.3P
ublic
Hou
sing
Sup
ply
0 .2 .4 .6 .8Herfindahl Index
Figure 3: Public Housing Supply and Fractionalization
AVIGNON
DOUAI
BRUAY−LA−BUISSIERE
VILLEURBANNEPARIS
ANTIBES
NICE
AIX−EN−PROVENCE
CAEN
DIJON
BRESTTOULOUSE
BORDEAUX
MONTPELLIERRENNES
TOURS
GRENOBLE
SAINT−ETIENNE
NANTES
ORLEANS
ANGERS
REIMS
NANCY
METZ
DUNKERQUE
VALENCIENNES
LILLE
LENS
CLERMONT−FERRANDSTRASBOURG
MULHOUSE
MANS
HAVRE
ROUEN
AMIENS
TOULON
LIMOGES
DPub Housing = 0.02 − 0.16 DPOP(0.00) (0.04)
R2 = 0.27
0.0
1.0
2.0
3.0
4.0
5C
hang
e in
Pub
lic H
ousi
ng S
uppl
y 82
−75
−.1 −.05 0 .05 .1 .15Population Growth 1975−82
Figure 4: Public Housing Supply and Population Growth
Sources: 1999 and 1968 Census.
41
Ile−de−France
Picardie et B−Norm.
Champagne−ArdenneHaute−NormandieCentre
Bourgogne
Nord−Pas−de−CalaisAls.−Lorr.
Franche−Comté
Bret.−PdLoire
Poitou−CharentesM.P. et Lim.
Aquitaine
Rhône−AlpesAuvergne
Languedoc−Roussillon
Provence−Alpes−Côte d’Azur
ln(wait)= 2.52 − 0.32 ln(public housing)(0.14)
R2=0.24
1.4
1.6
1.8
22.
2Lo
g W
aitin
g T
ime
1.5 2 2.5 3Log Public Housing Per Inhabitants
Figure 5: Waiting Times and Public Housing Supply across Regions
Sources: 1999 Census and the 1996 and the 2002 Housing Condition surveys.
42
List of Tables1 New Immigrants in France 1968-1999 . . . . . . . . . . . . . . . . . . . . . . 442 Participation rates in Public Housing per Nationality . . . . . . . . . . . . . . 453 Major Urban Area Characteristics in 1990 . . . . . . . . . . . . . . . . . . . . 464 Estimated Changes in Public Housing 1968-1999 . . . . . . . . . . . . . . . . 475 Determinants of the Evolution of Public Housing Supply 1975-1990 . . . . . . 486 Determinants of Location Choice : 57 Cities 1962-1990, Male living as a cou-
ple with Children . . . . . . . . . . . . . . . . . . . . . . . . . . . . . . . . . 497 Determinants of Location Choice : 57 Cities 1968-1990, Singles . . . . . . . . 508 Location Choice Model with Contemporary, Lagged and Future Public Hous-
ing Supply . . . . . . . . . . . . . . . . . . . . . . . . . . . . . . . . . . . . . 519 Determinants of Location Choice : 57 Cities 1968-1990, Non-European Groups 5210 Cities Characteristics for Average Individuals in Private and Public Housing in
Notes: The table present estimates from a conditional logit of the location choice of male newimmigrants who arrived in France between 1962 and 1999. Standard errors of model with acontrol function have been obtained using bootstrap using 100 replications. The model alsoincludes 10 variables for the distribution of workers of the city across 11 industries, a variablefor the effect of public housing supply in 1968. The sample only includes individuals whodeclared to live in couple with children at the time of the census. Column (2) and (5) use thefractionalization index as an excluded instrument in the control function while column (3) and(6) use the counterfactual population growths.Source: Censuses of Population 1968-1990 and Censuses of Housing 1990.
Share of similar 0.134*** 0.134*** -0.124*** -0.126***immigrant in city (0.016) (0.016) (0.014) (0.014)Similar Immigrant 0.324*** 0.324*** 0.422*** 0.423***share of population (0.008) (0.007) (0.005) (0.005)POPGAIN 2.201*** 2.211*** 1.482*** 1.443***
Sources and Notes: See table 6. The sample includes new immigrants not living as a cou-ple with children. Column (2) and (4) use both the fractionalization and the counterfactualpopulation growths as excluded instruments in the control function.
50
Table 8: Location Choice Model with Contemporary, Lagged and Future Public Housing Sup-ply
(1) (2) (3) (4) (5) (6)Europeans
Public Housing 0.253*** 0.085 0.056in t− k (0.070) (0.080) (0.082)Public Housing -0.085*** 0.306*** 0.273*** 0.267*** 0.251***in t (0.015) (0.070) (0.072) (0.079) (0.080)Public Housing -0.159* -0.135 -0.164* -0.140in t+ k (0.085) (0.086) (0.085) (0.086)Residual 4.9* 4.5*
Sources and Notes: See Table 6. The sample includes male new immigrants living as a couplewith children. Models of column (4) and (6) use both the fractionalization and the counterfac-tual population growths as excluded instruments in the control function.
51
Table 9: Determinants of Location Choice : 57 Cities 1968-1990, Non-European Groups
Asia Africa Non-Europeans(1) (2) (3) (4) (5) (6)
Share of similar -0.103*** -0.107*** -0.077 -0.078 -0.293*** -0.297***immigrant in city (0.036) (0.036) (0.049) (0.049) (0.020) (0.020)Similar Immigrant 0.310*** 0.308*** 0.269*** 0.269*** 0.378*** 0.382***share of population (0.016) (0.015) (0.020) (0.020) (0.009) (0.009)PopGain 1.580 1.930* -3.009** -2.599** 0.746** 0.902***
Sources and Notes: See Table 6. Models of column (2), (4) and (6) use both the fractionaliza-tion and the counterfactual population growths as excluded instruments in the control function.
52
Table 10: Cities Characteristics for Average Individuals in Private and Public Housing in 1999Herfindahl Dissimilariy Share in Immigrant
Notes and Sources: The sample includes all new immigrants who arrived between 1968 and1999. The first column indicate the Herfindahl index across all urban areas for the group. Thesecond column indicates the dissimilarity index using cities as a base geographical unit. Thethird column indicates the share of the group living in Paris, Lyon or Marseille, the fourthcolumn indicates the immigrant share of the city for the average immigrant.