Portland State University Portland State University PDXScholar PDXScholar Criminal Justice Policy Research Institute Research Research Briefs Criminal Justice Policy Research Institute 2013 Public Perceptions Regarding the Police Bureau and Public Perceptions Regarding the Police Bureau and Crime in Portland, Oregon Crime in Portland, Oregon Brian Renauer Portland State University Kimberly Barsamian Kahn Portland State University, [email protected]Kris R. Henning Portland State University, [email protected]Greg Stewart Portland Police Bureau Follow this and additional works at: https://pdxscholar.library.pdx.edu/cjpri_briefs Part of the Criminology Commons, Criminology and Criminal Justice Commons, Law Enforcement and Corrections Commons, and the Public Affairs, Public Policy and Public Administration Commons Let us know how access to this document benefits you. Recommended Citation Recommended Citation Renauer, Brian; Kahn, Kimberly Barsamian; Henning, Kris R.; and Stewart, Greg, "Public Perceptions Regarding the Police Bureau and Crime in Portland, Oregon" (2013). Criminal Justice Policy Research Institute Research Research Briefs. 2. https://pdxscholar.library.pdx.edu/cjpri_briefs/2 This Report is brought to you for free and open access. It has been accepted for inclusion in Criminal Justice Policy Research Institute Research Research Briefs by an authorized administrator of PDXScholar. Please contact us if we can make this document more accessible: [email protected].
Transcript
Portland State University Portland State University
PDXScholar PDXScholar
Criminal Justice Policy Research Institute Research Research Briefs Criminal Justice Policy Research Institute
2013
Public Perceptions Regarding the Police Bureau and Public Perceptions Regarding the Police Bureau and
Crime in Portland, Oregon Crime in Portland, Oregon
Brian Renauer Portland State University
Kimberly Barsamian Kahn Portland State University, [email protected]
Follow this and additional works at: https://pdxscholar.library.pdx.edu/cjpri_briefs
Part of the Criminology Commons, Criminology and Criminal Justice Commons, Law Enforcement and
Corrections Commons, and the Public Affairs, Public Policy and Public Administration Commons
Let us know how access to this document benefits you.
Recommended Citation Recommended Citation Renauer, Brian; Kahn, Kimberly Barsamian; Henning, Kris R.; and Stewart, Greg, "Public Perceptions Regarding the Police Bureau and Crime in Portland, Oregon" (2013). Criminal Justice Policy Research Institute Research Research Briefs. 2. https://pdxscholar.library.pdx.edu/cjpri_briefs/2
This Report is brought to you for free and open access. It has been accepted for inclusion in Criminal Justice Policy Research Institute Research Research Briefs by an authorized administrator of PDXScholar. Please contact us if we can make this document more accessible: [email protected].
Criminal Justice Policy Research Institute (CJPRI)
CJPRI strives to meet the research needs of its diverse clientele and expand the body of literature addressing criminology and criminal justice issues. Researchers at CJPRI employ a variety of methodological techniques including advanced statistical analysis, database development, GIS mapping, survey research, literature reviews, process evaluations, and program evaluation.
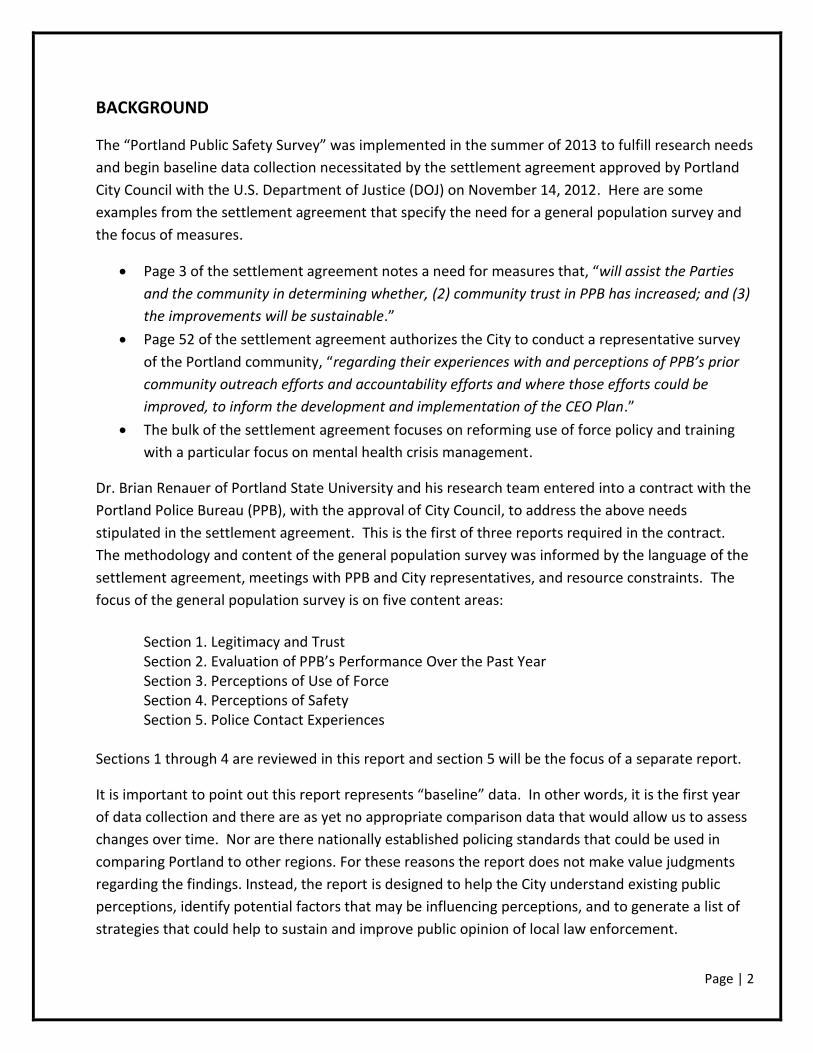
The “Portland Public Safety Survey” was implemented in the summer of 2013 to fulfill research needs
and begin baseline data collection necessitated by the settlement agreement approved by Portland
City Council with the U.S. Department of Justice (DOJ) on November 14, 2012. Here are some
examples from the settlement agreement that specify the need for a general population survey and
the focus of measures.
Page 3 of the settlement agreement notes a need for measures that, “will assist the Parties
and the community in determining whether, (2) community trust in PPB has increased; and (3)
the improvements will be sustainable.”
Page 52 of the settlement agreement authorizes the City to conduct a representative survey
of the Portland community, “regarding their experiences with and perceptions of PPB’s prior
community outreach efforts and accountability efforts and where those efforts could be
improved, to inform the development and implementation of the CEO Plan.”
The bulk of the settlement agreement focuses on reforming use of force policy and training
with a particular focus on mental health crisis management.
Dr. Brian Renauer of Portland State University and his research team entered into a contract with the
Portland Police Bureau (PPB), with the approval of City Council, to address the above needs
stipulated in the settlement agreement. This is the first of three reports required in the contract.
The methodology and content of the general population survey was informed by the language of the
settlement agreement, meetings with PPB and City representatives, and resource constraints. The
focus of the general population survey is on five content areas:
Section 1. Legitimacy and Trust Section 2. Evaluation of PPB’s Performance Over the Past Year Section 3. Perceptions of Use of Force Section 4. Perceptions of Safety Section 5. Police Contact Experiences
Sections 1 through 4 are reviewed in this report and section 5 will be the focus of a separate report.
It is important to point out this report represents “baseline” data. In other words, it is the first year
of data collection and there are as yet no appropriate comparison data that would allow us to assess
changes over time. Nor are there nationally established policing standards that could be used in
comparing Portland to other regions. For these reasons the report does not make value judgments
regarding the findings. Instead, the report is designed to help the City understand existing public
perceptions, identify potential factors that may be influencing perceptions, and to generate a list of
strategies that could help to sustain and improve public opinion of local law enforcement.
Page | 3
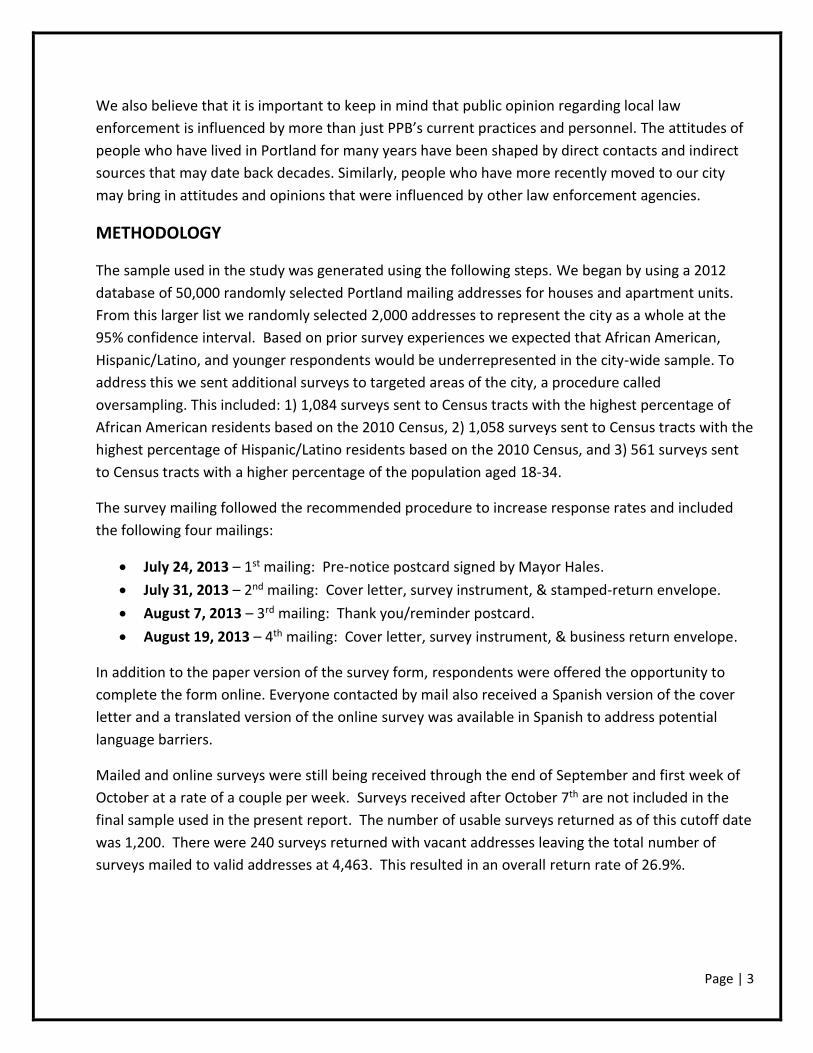
We also believe that it is important to keep in mind that public opinion regarding local law
enforcement is influenced by more than just PPB’s current practices and personnel. The attitudes of
people who have lived in Portland for many years have been shaped by direct contacts and indirect
sources that may date back decades. Similarly, people who have more recently moved to our city
may bring in attitudes and opinions that were influenced by other law enforcement agencies.
METHODOLOGY
The sample used in the study was generated using the following steps. We began by using a 2012
database of 50,000 randomly selected Portland mailing addresses for houses and apartment units.
From this larger list we randomly selected 2,000 addresses to represent the city as a whole at the
95% confidence interval. Based on prior survey experiences we expected that African American,
Hispanic/Latino, and younger respondents would be underrepresented in the city-wide sample. To
address this we sent additional surveys to targeted areas of the city, a procedure called
oversampling. This included: 1) 1,084 surveys sent to Census tracts with the highest percentage of
African American residents based on the 2010 Census, 2) 1,058 surveys sent to Census tracts with the
highest percentage of Hispanic/Latino residents based on the 2010 Census, and 3) 561 surveys sent
to Census tracts with a higher percentage of the population aged 18-34.
The survey mailing followed the recommended procedure to increase response rates and included
the following four mailings:
July 24, 2013 – 1st mailing: Pre-notice postcard signed by Mayor Hales.
August 7, 2013 – 3rd mailing: Thank you/reminder postcard.
August 19, 2013 – 4th mailing: Cover letter, survey instrument, & business return envelope.
In addition to the paper version of the survey form, respondents were offered the opportunity to
complete the form online. Everyone contacted by mail also received a Spanish version of the cover
letter and a translated version of the online survey was available in Spanish to address potential
language barriers.
Mailed and online surveys were still being received through the end of September and first week of
October at a rate of a couple per week. Surveys received after October 7th are not included in the
final sample used in the present report. The number of usable surveys returned as of this cutoff date
was 1,200. There were 240 surveys returned with vacant addresses leaving the total number of
surveys mailed to valid addresses at 4,463. This resulted in an overall return rate of 26.9%.
Page | 4
Sample Characteristics
The following demographic table compares the sample percentage of the respondent demographics
used in this report to the census percentage. The sample is reasonably representative of key
Portland city demographics. Female and older respondents (45+) are the most overrepresented
demographics. Statistical testing shows that there are few significant differences in opinions
between males and females and when differences are found for age and gender they are small (see
analysis and statistical procedures section); thus, we have decided not to weight the results.
Sample Characteristics
Demographic Factors n Sample % Census %
Males 481 41.0 49.3
Females 691 59.0 50.7
Age 45 or older 768 65.5 46.0
Age < 45 405 34.5 54.0
White Only 941 78.6 72.4
Minorities 310 21.4 27.6
Spanish, Hispanic, Latino 69 5.8 9.2
African American 83 6.9 6.1
Asian 52 4.3 7.1
Native American 37 3.1 0.6
Other 69 5.8 0.2
Born in Oregon 378 32.1 41.8
Born in other U.S. 692 58.8 43.3
Born outside U.S. 106 9.0 13.7
Some High School 41 3.5 10.1
HS Degree/GED 131 11.1 19.0
Some College 272 23.0 22.7
Associate Degree 105 8.9 6.3
Bachelors or higher 634 53.6 42.0 Note: Census %’s are based on city of Portland, American Community Survey 2007-2011
Page | 5
Analyses and Statistical Procedures
Two strategies were used in analyzing the survey questions. The first approach considered the
respondents’ original answers from the 5-point continuous scale used with each item. The means
and standard deviations for the items are reported first for the sample as a whole and then for
distinct subgroups within the sample. The subgroup analyses allowed for comparisons of males
versus females, younger residents (< age 45) versus older residents (45+), and for Whites versus
racial/ethnic Minorities. Independent samples t-tests were used with the latter three comparisons to
test for statistically significant differences between the groups.
“Statistical significance” in the present context refers to the probability that an altitudinal difference
observed between two groups could be due to random chance as opposed to representing a true
difference in opinions. With larger samples like the current study, some findings that are statistically
significant may have relatively limited practical significance in the real world. A .15 difference in male
and female mean scores on one of our opinion questions, for example, could be statistically
significant but might not reflect a large or meaningful gender difference in practical terms.
For this reason we also calculated and report in the text an effect size (Cohen’s d) for each
statistically significant finding. Cohen’s d measures the strength of an association and is not
influenced by the sample size in the same way that t-tests are. Effects sizes are helpful in determining
whether the difference observed in respondents’ attitudes are clinically or practically meaningful.
Commonly used cutoffs for Cohen’s d are: small = .20 to .49, medium = .50 to .79, and large = > .79
and this is the terminology used in the report.
The second strategy for analyzing the data was to collapse the 5-point scale into three levels and
analyze the result as a categorical item rather than continuous scale. For example, the original scale
used in some items was: 1) Strongly Disagree, 2) Disagree, 3) Neither Agree nor Disagree, 4) Agree, 5)
Strongly Agree. This was regrouped into: 1) Strongly Disagree or Disagree, 2) Neither Agree nor
Disagree, and 3) Strongly Agree or Agree.
Page | 6
I. LEGITIMACY AND TRUST
The 14 items in this section are designed to measure public perceptions of police legitimacy and
public trust in the police, which are key constructs that influence overall perceptions of police and
police behavior. The concepts of police legitimacy and trust reflect individuals’ assessments on
whether the police are seen as a rightful authority, should be respected, and whether their
decisions should be followed. Trust entails a public confidence that law enforcement officers
perform their duties fairly, equitably, and in good faith. Research demonstrates that citizens’
perceptions of police legitimacy and trust are directly linked to their confidence in police,
cooperation with law enforcement, and compliance with the law more generally (Sunshine & Tyler,
2003). Similarly, the belief that police engage in racial profiling negatively impacts citizens’
perceptions of police legitimacy, decreases trust in police, and reduces overall support for law
enforcement (Tyler & Wakslak, 2004; Weitzer & Tuch, 2005). The 14 items employed in this
section of the survey derive from criminal justice and psychological research over the last decade
that have been used in prior studies to assess police legitimacy and community trust in police. The
measures of trust and legitimacy in this survey include a focus on one’s neighborhood, one’s social
identity or personal trust in the police, and general trust in Portland Police actions related race and
mental health status. With a focus on mental health status and racial issues in particular, these
questions assess key components of the Department of Justice and City of Portland settlement.
Page | 7
3.4
3.4
3.4
3.5
3.3
3.4
3.3
1.0 2.0 3.0 4.0 5.0
Sample
Male
Female
45+
< 45
White
Minority
FULL
GEN
DER
AG
ER
AC
E
I. LEGITIMACY AND TRUST
Question #1 STRONGLY
AGREE
(5) AGREE
(4)
NEITHER AGREE
/DISAGREE
(3) DISAGREE
(2)
STRONGLY DISAGREE
(1)
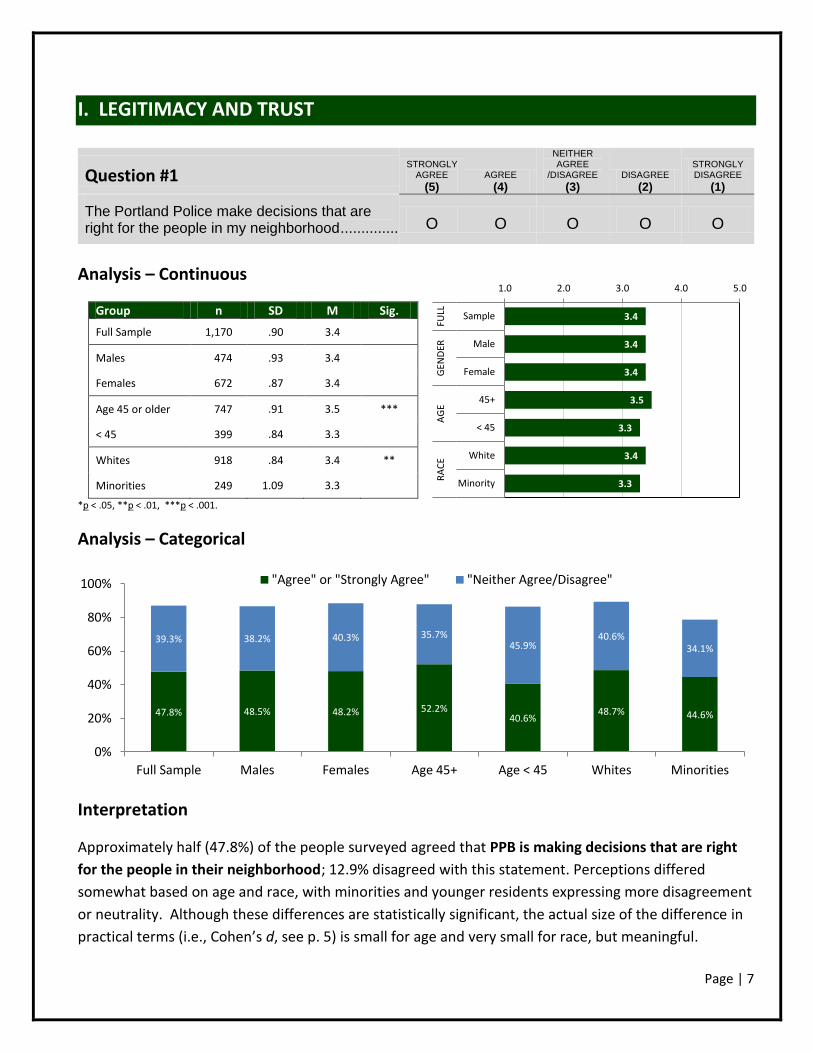
The Portland Police make decisions that are right for the people in my neighborhood ................ O O O O O
Analysis – Continuous
*p < .05, **p < .01, ***p < .001.
Analysis – Categorical
Interpretation
Approximately half (47.8%) of the people surveyed agreed that PPB is making decisions that are right
for the people in their neighborhood; 12.9% disagreed with this statement. Perceptions differed
somewhat based on age and race, with minorities and younger residents expressing more disagreement
or neutrality. Although these differences are statistically significant, the actual size of the difference in
practical terms (i.e., Cohen’s d, see p. 5) is small for age and very small for race, but meaningful.
47.8% 48.5% 48.2% 52.2%40.6%
48.7% 44.6%
39.3% 38.2% 40.3% 35.7%45.9%
40.6%34.1%
0%
20%
40%
60%
80%
100%
Full Sample Males Females Age 45+ Age < 45 Whites Minorities
"Agree" or "Strongly Agree" "Neither Agree/Disagree"
Group n SD M Sig.
Full Sample 1,170 .90 3.4
Males 474 .93 3.4
Females 672 .87 3.4
Age 45 or older 747 .91 3.5 ***
< 45 399 .84 3.3
Whites 918 .84 3.4 **
Minorities 249 1.09 3.3
Page | 8
3.4
3.4
3.5
3.5
3.4
3.5
3.3
1.0 2.0 3.0 4.0 5.0
Sample
Male
Female
45+
< 45
White
Minority
FULL
GEN
DER
AG
ER
AC
E
I. LEGITIMACY AND TRUST
Question #2 STRONGLY
AGREE
(5) AGREE
(4)
NEITHER AGREE
/DISAGREE
(3) DISAGREE
(2)
STRONGLY DISAGREE
(1)
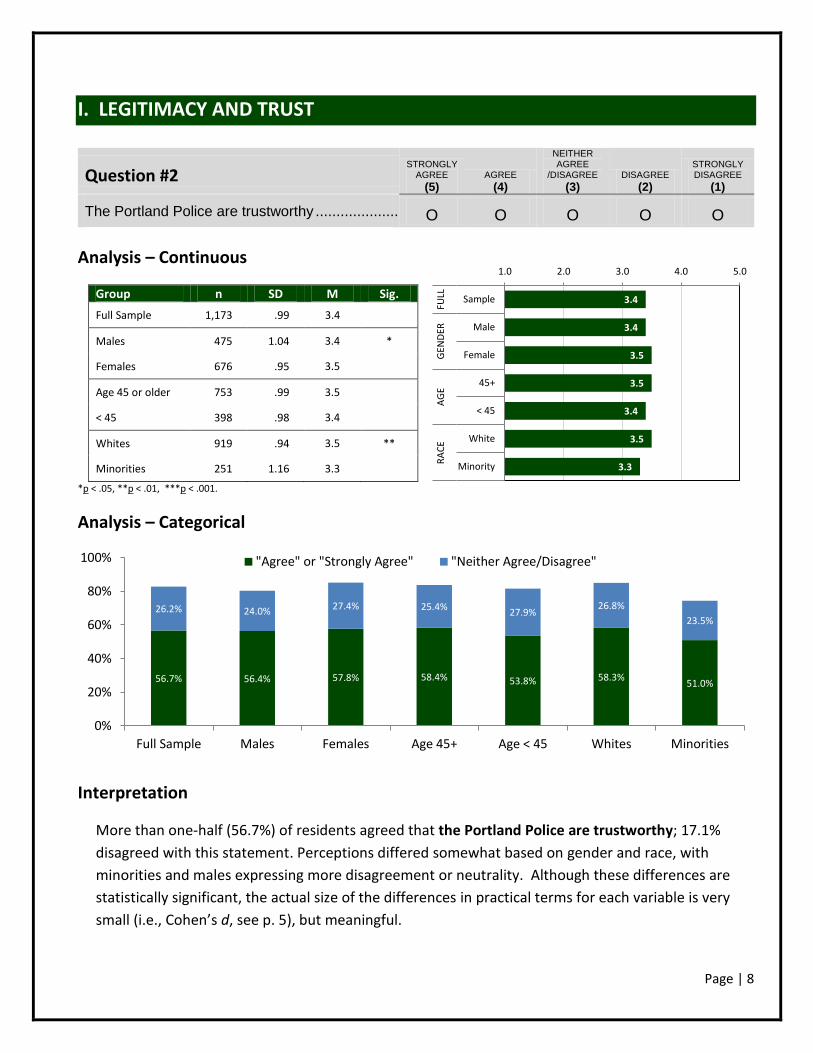
The Portland Police are trustworthy ...................... O O O O O
Analysis – Continuous
*p < .05, **p < .01, ***p < .001.
Analysis – Categorical
Interpretation
More than one-half (56.7%) of residents agreed that the Portland Police are trustworthy; 17.1%
disagreed with this statement. Perceptions differed somewhat based on gender and race, with
minorities and males expressing more disagreement or neutrality. Although these differences are
statistically significant, the actual size of the differences in practical terms for each variable is very
small (i.e., Cohen’s d, see p. 5), but meaningful.
56.7% 56.4% 57.8% 58.4% 53.8% 58.3%51.0%
26.2% 24.0% 27.4% 25.4%27.9%
26.8%
23.5%
0%
20%
40%
60%
80%
100%
Full Sample Males Females Age 45+ Age < 45 Whites Minorities
"Agree" or "Strongly Agree" "Neither Agree/Disagree"
Group n SD M Sig.
Full Sample 1,173 .99 3.4
Males 475 1.04 3.4 *
Females 676 .95 3.5
Age 45 or older 753 .99 3.5
< 45 398 .98 3.4
Whites 919 .94 3.5 **
Minorities 251 1.16 3.3
Page | 9
3.5
3.4
3.5
3.5
3.4
3.5
3.3
1.0 2.0 3.0 4.0 5.0
Sample
Male
Female
45+
45+
White
Minority
FULL
GEN
DER
AG
ER
AC
E
I. LEGITIMACY AND TRUST
Question #3 STRONGLY
AGREE
(5) AGREE
(4)
NEITHER AGREE
/DISAGREE
(3) DISAGREE
(2)
STRONGLY DISAGREE
(1)
I have confidence in the Portland Police ............... O O O O O
Analysis – Continuous
*p < .05, **p < .01, ***p < .001.
Analysis – Categorical
Interpretation
Over one-half (59.5%) of the people surveyed have confidence in the Portland Police; 18.2% disagreed
with this statement. Perceptions differed somewhat based on gender, age, and race, with males,
minorities and younger residents expressing more disagreement or neutrality. Although these three
differences are statistically significant, the actual size of the differences from an applied perspective is
very small (i.e., Cohen’s d, see p. 5) in each case, but meaningful.
59.5% 58.2% 61.0% 62.3%54.4%
62.1%50.2%
22.3% 22.6% 22.4% 20.7%25.9%
21.7%
24.1%
0%
20%
40%
60%
80%
100%
Full Sample Males Females Age 45+ Age < 45 Whites Minorities
"Agree" or "Strongly Agree" "Neither Agree/Disagree"
Group n SD M Sig.
Full Sample 1,177 1.05 3.5
Males 474 1.08 3.4 *
Females 679 1.01 3.5
Age 45 or older 753 1.05 3.5 **
< 45 401 1.02 3.4
Whites 921 .99 3.5 **
Minorities 253 1.21 3.3
Page | 10
3.7
3.6
3.7
3.6
3.7
3.7
3.3
1.0 2.0 3.0 4.0 5.0
Sample
Male
Female
45+
< 45
White
Minority
FULL
GEN
DER
AG
ER
AC
E
I. LEGITIMACY AND TRUST
Question #4 STRONGLY
AGREE
(5) AGREE
(4)
NEITHER AGREE
/DISAGREE
(3) DISAGREE
(2)
STRONGLY DISAGREE
(1)
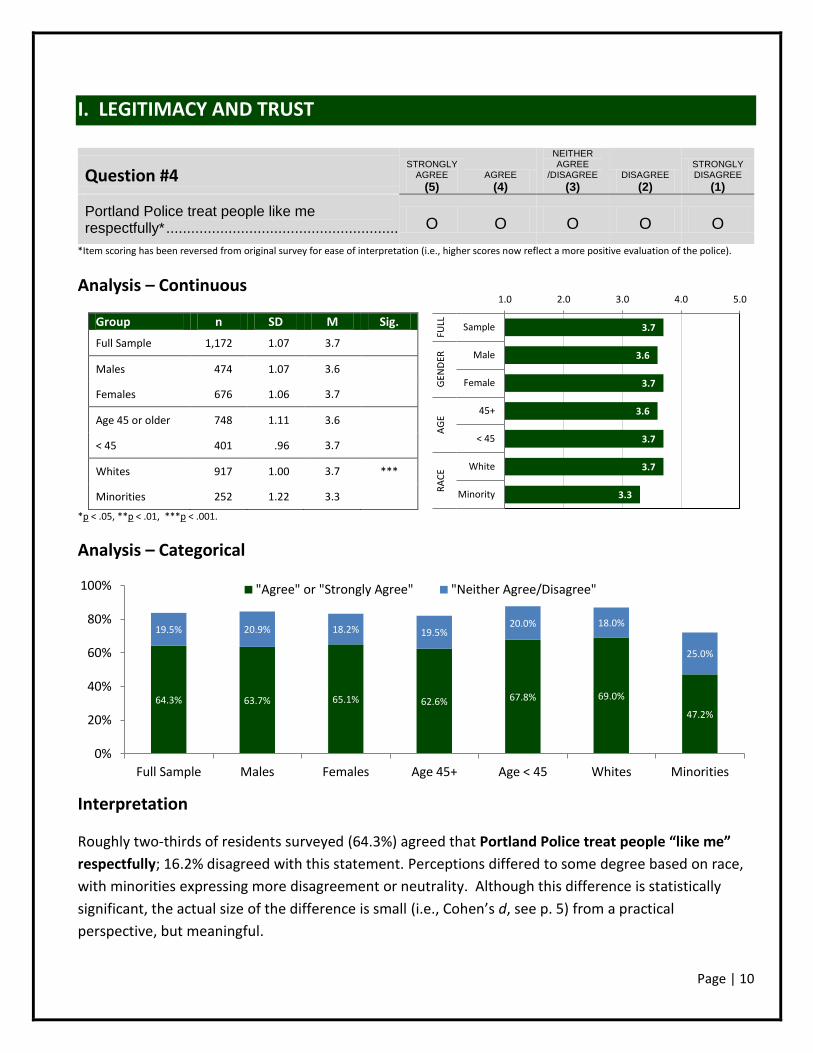
Portland Police treat people like me respectfully* .......................................................... O O O O O
*Item scoring has been reversed from original survey for ease of interpretation (i.e., higher scores now reflect a more positive evaluation of the police).
Analysis – Continuous
*p < .05, **p < .01, ***p < .001.
Analysis – Categorical
Interpretation
Roughly two-thirds of residents surveyed (64.3%) agreed that Portland Police treat people “like me”
respectfully; 16.2% disagreed with this statement. Perceptions differed to some degree based on race,
with minorities expressing more disagreement or neutrality. Although this difference is statistically
significant, the actual size of the difference is small (i.e., Cohen’s d, see p. 5) from a practical
perspective, but meaningful.
64.3% 63.7% 65.1% 62.6% 67.8% 69.0%
47.2%
19.5% 20.9% 18.2% 19.5%20.0% 18.0%
25.0%
0%
20%
40%
60%
80%
100%
Full Sample Males Females Age 45+ Age < 45 Whites Minorities
"Agree" or "Strongly Agree" "Neither Agree/Disagree"
Group n SD M Sig.
Full Sample 1,172 1.07 3.7
Males 474 1.07 3.6
Females 676 1.06 3.7
Age 45 or older 748 1.11 3.6
< 45 401 .96 3.7
Whites 917 1.00 3.7 ***
Minorities 252 1.22 3.3
Page | 11
3.6
3.6
3.6
3.7
3.5
3.7
3.4
1.0 2.0 3.0 4.0 5.0
Sample
Male
Female
45+
45+
White
Minority
FULL
GEN
DER
AG
ER
AC
E
I. LEGITIMACY AND TRUST
Question #5 STRONGLY
AGREE
(5) AGREE
(4)
NEITHER AGREE
/DISAGREE
(3) DISAGREE
(2)
STRONGLY DISAGREE
(1)
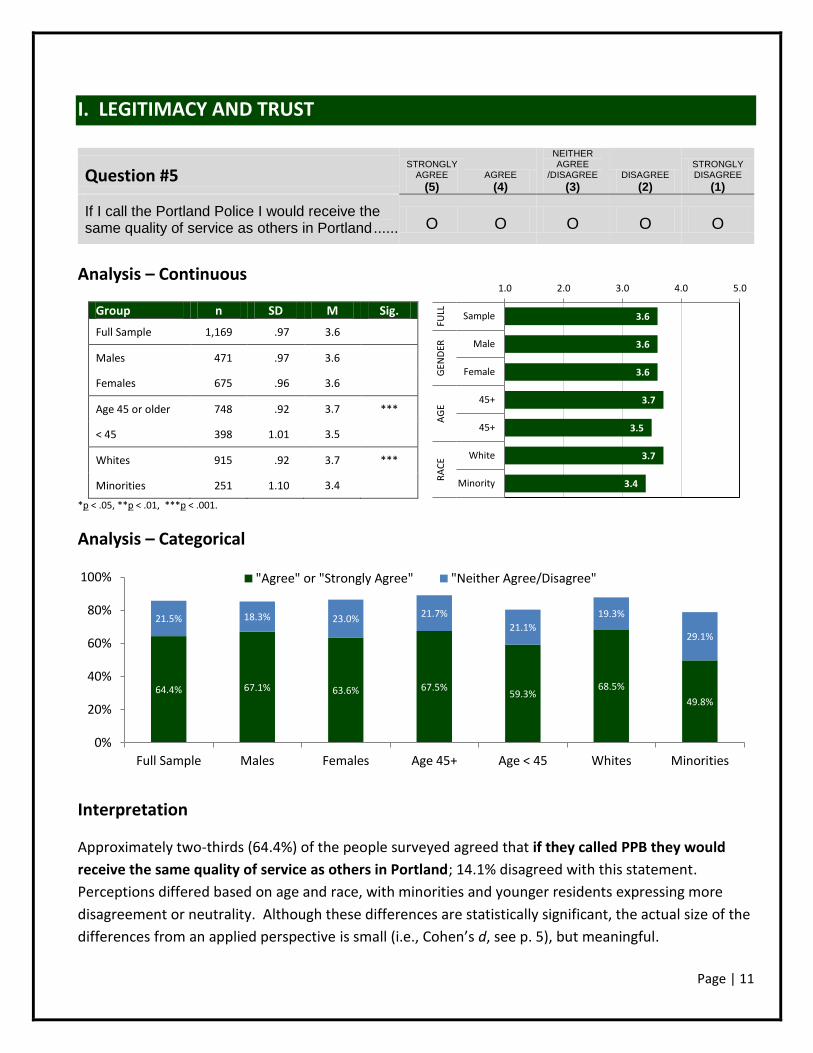
If I call the Portland Police I would receive the same quality of service as others in Portland ........ O O O O O
Analysis – Continuous
*p < .05, **p < .01, ***p < .001.
Analysis – Categorical
Interpretation
Approximately two-thirds (64.4%) of the people surveyed agreed that if they called PPB they would
receive the same quality of service as others in Portland; 14.1% disagreed with this statement.
Perceptions differed based on age and race, with minorities and younger residents expressing more
disagreement or neutrality. Although these differences are statistically significant, the actual size of the
differences from an applied perspective is small (i.e., Cohen’s d, see p. 5), but meaningful.
64.4% 67.1% 63.6% 67.5%59.3%
68.5%
49.8%
21.5% 18.3% 23.0%21.7%
21.1%
19.3%
29.1%
0%
20%
40%
60%
80%
100%
Full Sample Males Females Age 45+ Age < 45 Whites Minorities
"Agree" or "Strongly Agree" "Neither Agree/Disagree"
Group n SD M Sig.
Full Sample 1,169 .97 3.6
Males 471 .97 3.6
Females 675 .96 3.6
Age 45 or older 748 .92 3.7 ***
< 45 398 1.01 3.5
Whites 915 .92 3.7 ***
Minorities 251 1.10 3.4
Page | 12
3.8
3.7
3.8
3.8
3.7
3.8
3.5
1.0 2.0 3.0 4.0 5.0
Sample
Male
Female
45+
< 45
White
Minority
FULL
GEN
DER
AG
ER
AC
E
I. LEGITIMACY AND TRUST
Question #6 STRONGLY
AGREE
(5) AGREE
(4)
NEITHER AGREE
/DISAGREE
(3) DISAGREE
(2)
STRONGLY DISAGREE
(1)
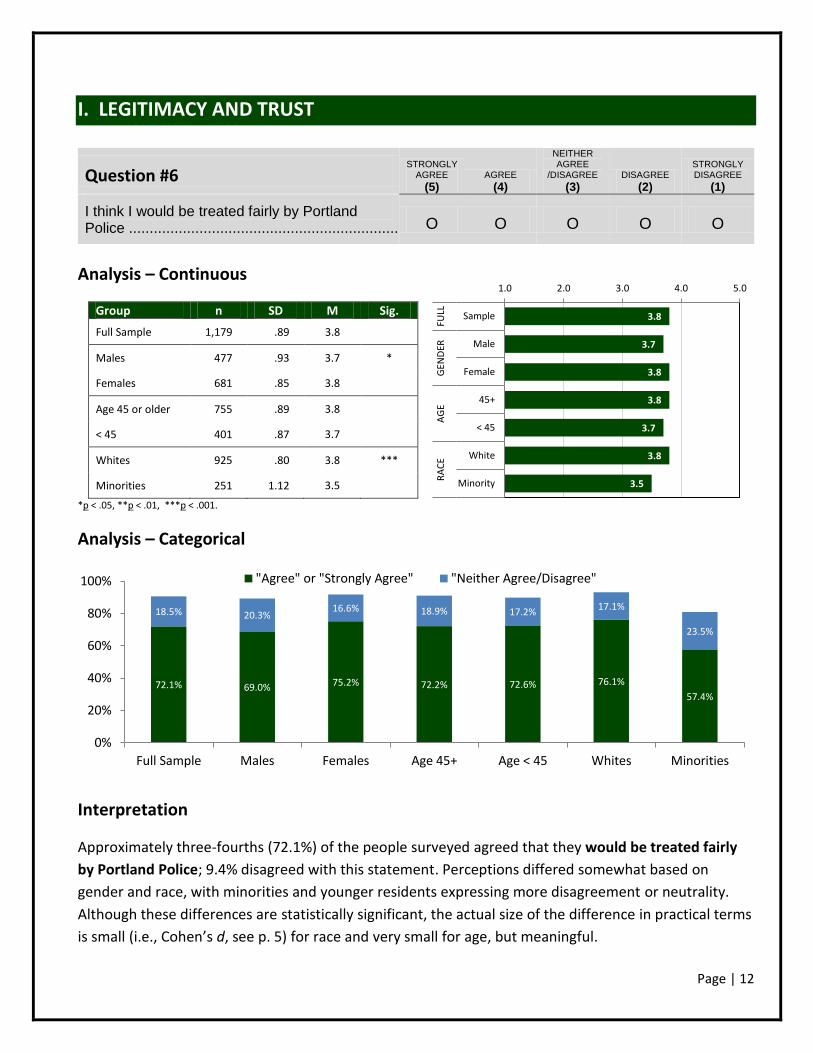
I think I would be treated fairly by Portland Police ................................................................... O O O O O
Analysis – Continuous
*p < .05, **p < .01, ***p < .001.
Analysis – Categorical
Interpretation
Approximately three-fourths (72.1%) of the people surveyed agreed that they would be treated fairly
by Portland Police; 9.4% disagreed with this statement. Perceptions differed somewhat based on
gender and race, with minorities and younger residents expressing more disagreement or neutrality.
Although these differences are statistically significant, the actual size of the difference in practical terms
is small (i.e., Cohen’s d, see p. 5) for race and very small for age, but meaningful.
72.1% 69.0% 75.2% 72.2% 72.6% 76.1%
57.4%
18.5% 20.3%16.6% 18.9% 17.2%
17.1%
23.5%
0%
20%
40%
60%
80%
100%
Full Sample Males Females Age 45+ Age < 45 Whites Minorities
"Agree" or "Strongly Agree" "Neither Agree/Disagree"
Group n SD M Sig.
Full Sample 1,179 .89 3.8
Males 477 .93 3.7 *
Females 681 .85 3.8
Age 45 or older 755 .89 3.8
< 45 401 .87 3.7
Whites 925 .80 3.8 ***
Minorities 251 1.12 3.5
Page | 13
3.4
3.4
3.4
3.4
3.3
3.4
3.2
1.0 2.0 3.0 4.0 5.0
Sample
Male
Female
45+
< 45
White
Minority
FULL
GEN
DER
AG
ER
AC
E
I. LEGITIMACY AND TRUST
Question #7 STRONGLY
AGREE
(5) AGREE
(4)
NEITHER AGREE
/DISAGREE
(3) DISAGREE
(2)
STRONGLY DISAGREE
(1)
People should respect decisions Portland Police make .......................................................... O O O O O
Analysis – Continuous
*p < .05, **p < .01, ***p < .001.
Analysis – Categorical
Interpretation
Almost one-half (46.6%) of the people surveyed agreed that people should respect decisions Portland
Police make; 15.3% disagreed with this statement. Perceptions differed somewhat based on race, with
minorities expressing more disagreement or neutrality. Although this difference is statistically
significant, the actual size of the difference in practical terms is small (i.e., Cohen’s d, see p. 5), but
meaningful.
46.6% 49.5% 44.9% 47.6% 43.9% 48.2%40.3%
38.1% 33.4% 41.5% 37.4% 40.4%39.1%
34.3%
0%
20%
40%
60%
80%
100%
Full Sample Males Females Age 45+ Age < 45 Whites Minorities
"Agree" or "Strongly Agree" "Neither Agree/Disagree"
Group n SD M Sig.
Full Sample 1,166 .96 3.4
Males 473 1.02 3.4
Females 670 .90 3.4
Age 45 or older 746 .96 3.4
< 45 396 .94 3.3
Whites 915 .92 3.4 **
Minorities 248 1.08 3.2
Page | 14
3.2
3.2
3.2
3.3
3.0
3.2
3.1
1.0 2.0 3.0 4.0 5.0
Sample
Male
Female
45+
< 45
White
Minority
FULL
GEN
DER
AG
ER
AC
E
I. LEGITIMACY AND TRUST
Question #8 STRONGLY
AGREE
(5) AGREE
(4)
NEITHER AGREE
/DISAGREE
(3) DISAGREE
(2)
STRONGLY DISAGREE
(1)
I think my values and the values of Portland Police are very similar ........................................... O O O O O
Analysis – Continuous
*p < .05, **p < .01, ***p < .001.
Analysis – Categorical
Interpretation
Four out of ten (42.0%) people surveyed agreed that “my” values and the values of Portland Police are
very similar; 24.0% of residents disagreed with this statement. Perceptions differed somewhat based
on age and race, with minorities and younger residents expressing more disagreement or neutrality.
Although these differences are statistically significant, the actual size of the difference in practical or
applied terms is small (i.e., Cohen’s d, see p. 5) for age and very small for race, but meaningful.
42.0% 43.9% 41.4% 46.9%32.8%
43.0% 38.6%
34.0% 30.3% 36.9%32.2%
38.3%
35.0%31.1%
0%
20%
40%
60%
80%
100%
Full Sample Males Females Age 45+ Age < 45 Whites Minorities
"Agree" or "Strongly Agree" "Neither Agree/Disagree"
Group n SD M Sig.
Full Sample 1,163 1.04 3.2
Males 472 1.09 3.2
Females 667 1.00 3.2
Age 45 or older 738 1.03 3.3 ***
< 45 400 1.03 3.0
Whites 909 1.01 3.2 *
Minorities 251 1.15 3.1
Page | 15
2.8
2.8
2.7
2.9
2.6
2.8
2.6
1.0 2.0 3.0 4.0 5.0
Sample
Male
Female
45+
< 45
White
Minority
FULL
GEN
DER
AG
ER
AC
E
I. LEGITIMACY AND TRUST
Question #9 STRONGLY
AGREE
(5) AGREE
(4)
NEITHER AGREE
/DISAGREE
(3) DISAGREE
(2)
STRONGLY DISAGREE
(1)
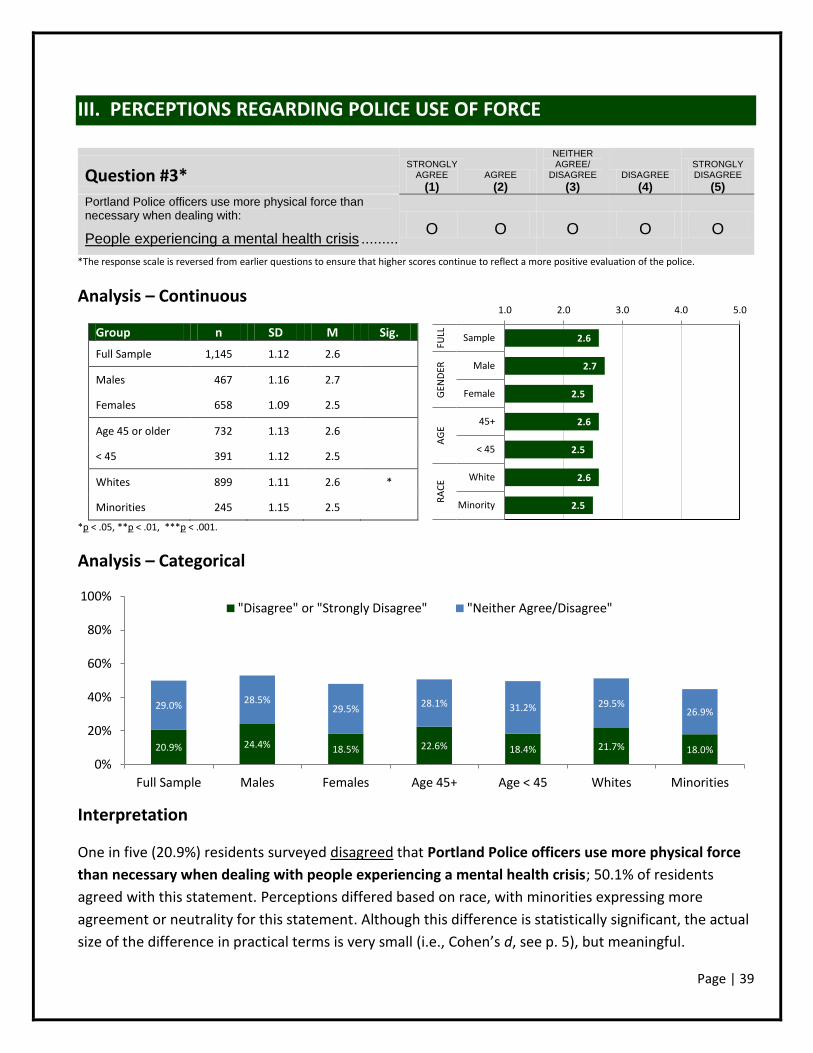
The police in Portland (do not) use race and ethnicity when deciding whether to stop someone* ............................................................. O O O O O
*Item scoring has been reversed from original survey for ease of interpretation (i.e., higher scores now reflect a more positive evaluation of the police).
Analysis – Continuous
*p < .05, **p < .01, ***p < .001.
Analysis – Categorical
Interpretation
One-quarter (23.4%) of the people surveyed agreed that Portland’s police do not use race and ethnicity
in deciding whether to stop someone; 40.8% of residents disagreed with this statement. Perceptions
differed based on age and race, with minorities and younger residents expressing more disagreement or
neutrality. These differences, while statistically significant, would be considered small (i.e., Cohen’s d,
see p. 5) in both cases for practical purposes, but meaningful.
23.4% 27.7%20.6% 26.7%
17.0%23.6% 22.8%
35.8% 31.9%38.4%
36.2%
34.9%
38.5%25.6%
0%
20%
40%
60%
80%
100%
Full Sample Males Females Age 45+ Age < 45 Whites Minorities
"Agree" or "Strongly Agree" "Neither Agree/Disagree"
Group n SD M Sig.
Full Sample 1,165 1.09 2.8
Males 473 1.14 2.8
Females 669 1.05 2.7
Age 45 or older 741 1.10 2.9 ***
< 45 401 1.04 2.6
Whites 917 1.04 2.8 **
Minorities 246 1.22 2.6
Page | 16
3.0
3.1
2.9
3.1
2.9
3.1
2.8
1.0 2.0 3.0 4.0 5.0
Sample
Male
Female
45+
< 45
White
Minority
FULL
GEN
DER
AG
ER
AC
E
I. LEGITIMACY AND TRUST
Question #10 STRONGLY
AGREE
(5) AGREE
(4)
NEITHER AGREE
/DISAGREE
(3) DISAGREE
(2)
STRONGLY DISAGREE
(1)
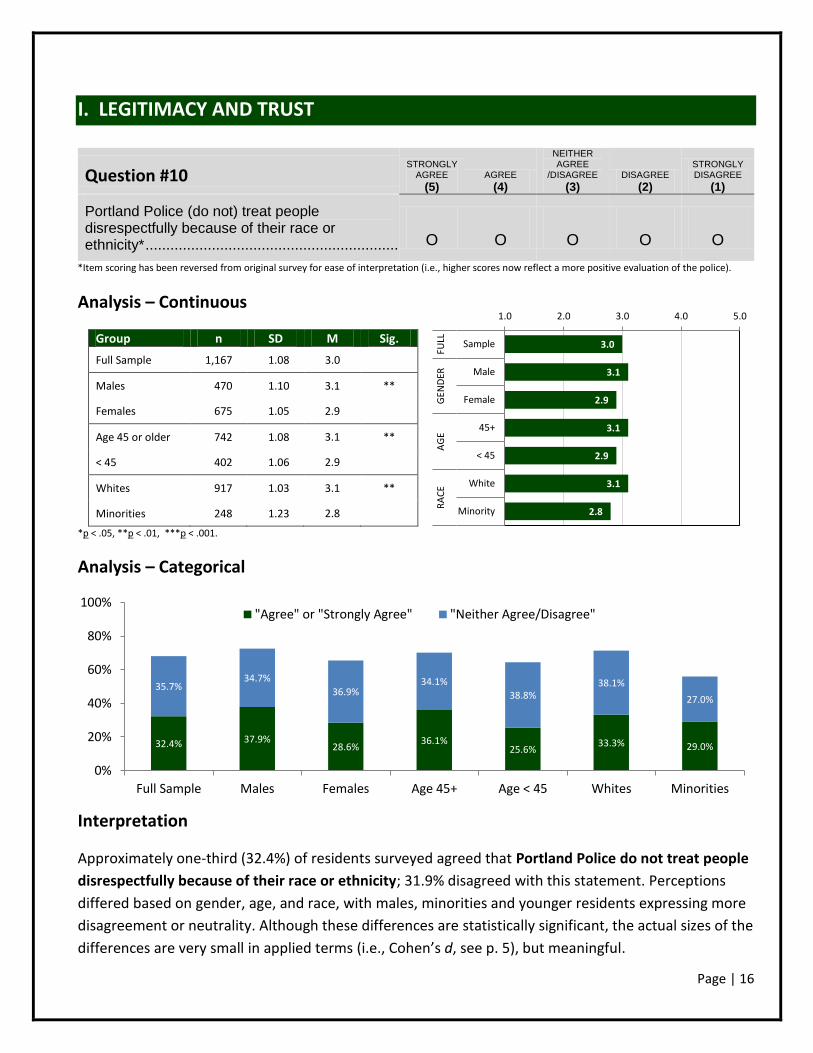
Portland Police (do not) treat people disrespectfully because of their race or ethnicity* ............................................................... O O O O O
*Item scoring has been reversed from original survey for ease of interpretation (i.e., higher scores now reflect a more positive evaluation of the police).
Analysis – Continuous
*p < .05, **p < .01, ***p < .001.
Analysis – Categorical
Interpretation
Approximately one-third (32.4%) of residents surveyed agreed that Portland Police do not treat people
disrespectfully because of their race or ethnicity; 31.9% disagreed with this statement. Perceptions
differed based on gender, age, and race, with males, minorities and younger residents expressing more
disagreement or neutrality. Although these differences are statistically significant, the actual sizes of the
differences are very small in applied terms (i.e., Cohen’s d, see p. 5), but meaningful.
32.4% 37.9%28.6%
36.1%25.6%
33.3% 29.0%
35.7%34.7%
36.9%34.1%
38.8%38.1%
27.0%
0%
20%
40%
60%
80%
100%
Full Sample Males Females Age 45+ Age < 45 Whites Minorities
"Agree" or "Strongly Agree" "Neither Agree/Disagree"
Group n SD M Sig.
Full Sample 1,167 1.08 3.0
Males 470 1.10 3.1 **
Females 675 1.05 2.9
Age 45 or older 742 1.08 3.1 **
< 45 402 1.06 2.9
Whites 917 1.03 3.1 **
Minorities 248 1.23 2.8
Page | 17
2.9
3.0
2.9
3.0
2.8
2.9
2.8
1.0 2.0 3.0 4.0 5.0
Sample
Male
Female
45+
< 45
White
Minority
FULL
GEN
DER
AG
ER
AC
E
I. LEGITIMACY AND TRUST
Question #11 STRONGLY
AGREE
(5) AGREE
(4)
NEITHER AGREE
/DISAGREE
(3) DISAGREE
(2)
STRONGLY DISAGREE
(1)
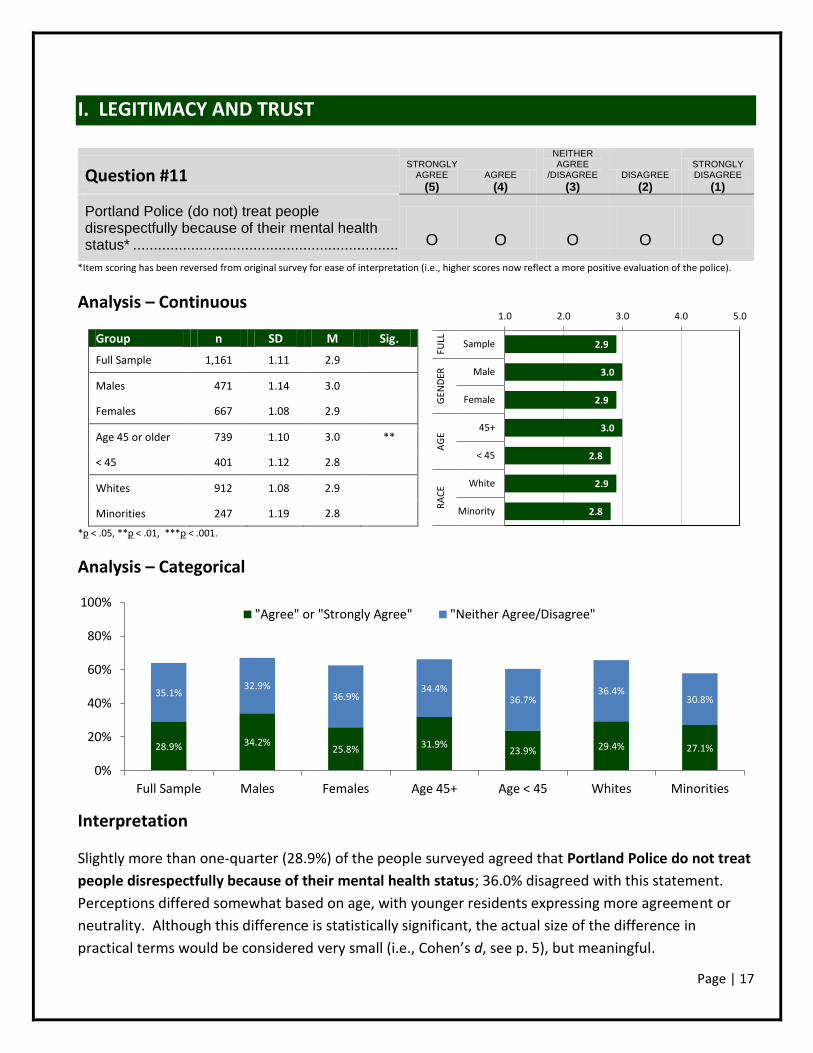
Portland Police (do not) treat people disrespectfully because of their mental health status* .................................................................. O O O O O
*Item scoring has been reversed from original survey for ease of interpretation (i.e., higher scores now reflect a more positive evaluation of the police).
Analysis – Continuous
*p < .05, **p < .01, ***p < .001.
Analysis – Categorical
Interpretation
Slightly more than one-quarter (28.9%) of the people surveyed agreed that Portland Police do not treat
people disrespectfully because of their mental health status; 36.0% disagreed with this statement.
Perceptions differed somewhat based on age, with younger residents expressing more agreement or
neutrality. Although this difference is statistically significant, the actual size of the difference in
practical terms would be considered very small (i.e., Cohen’s d, see p. 5), but meaningful.
28.9% 34.2%25.8% 31.9%
23.9% 29.4% 27.1%
35.1%32.9%
36.9%34.4%
36.7%36.4%
30.8%
0%
20%
40%
60%
80%
100%
Full Sample Males Females Age 45+ Age < 45 Whites Minorities
"Agree" or "Strongly Agree" "Neither Agree/Disagree"
Group n SD M Sig.
Full Sample 1,161 1.11 2.9
Males 471 1.14 3.0
Females 667 1.08 2.9
Age 45 or older 739 1.10 3.0 **
< 45 401 1.12 2.8
Whites 912 1.08 2.9
Minorities 247 1.19 2.8
Page | 18
3.7
3.7
3.7
3.7
3.7
3.9
2.9
1.0 2.0 3.0 4.0 5.0
Sample
Male
Female
45+
< 45
White
Minority
FULL
GEN
DER
AG
ER
AC
E
I. LEGITIMACY AND TRUST
Question #12 STRONGLY
AGREE
(5) AGREE
(4)
NEITHER AGREE
/DISAGREE
(3) DISAGREE
(2)
STRONGLY DISAGREE
(1)
I (do not) worry that Portland Police may stereotype me because of my race or ethnicity* .... O O O O O
*Item scoring has been reversed from original survey for ease of interpretation (i.e., higher scores now reflect a more positive evaluation of the police).
Analysis – Continuous
*p < .05, **p < .01, ***p < .001.
Analysis – Categorical
Interpretation
Nearly two-thirds (64.4%) of residents surveyed agreed with the statement: I do not worry that
Portland Police may stereotype them because of my race or ethnicity; 14.1% of respondents disagreed
with this statement. Perceptions differed based on race, with minorities expressing significantly more
disagreement or neutrality. The size of the difference between minority and white respondents in
practical terms would be considered large (i.e., Cohen’s d, see p. 5).
64.4% 63.8% 64.8% 62.7% 67.8% 72.2%
35.2%
21.5% 24.1% 19.5% 22.9% 19.2%20.4%
25.4%
0%
20%
40%
60%
80%
100%
Full Sample Males Females Age 45+ Age < 45 Whites Minorities
"Agree" or "Strongly Agree" "Neither Agree/Disagree"
Group n SD M Sig.
Full Sample 1,151 1.06 3.7
Males 464 1.04 3.7
Females 665 1.07 3.7
Age 45 or older 729 1.05 3.7
< 45 401 1.06 3.7
Whites 905 .91 3.9 ***
Minorities 244 1.23 2.9
Page | 19
4.4
4.4
4.5
4.4
4.4
4.4
4.3
1.0 2.0 3.0 4.0 5.0
Sample
Male
Female
45+
< 45
White
Minority
FULL
GEN
DER
AG
ER
AC
E
I. LEGITIMACY AND TRUST
Question #13 STRONGLY
AGREE
(5) AGREE
(4)
NEITHER AGREE
/DISAGREE
(3) DISAGREE
(2)
STRONGLY DISAGREE
(1)
If I saw a crime happening in my neighborhood I would call the Portland Police to report it ............ O O O O O
Analysis – Continuous
*p < .05, **p < .01, ***p < .001.
Analysis – Categorical
Interpretation
Nine out of ten (92.1%) people agreed that if I saw a crime happening in my neighborhood, I would call
the Portland Police to report it; 2.6% disagreed. Perceptions differed based on race, with minorities
expressing more disagreement or neutrality. Although this difference is statistically significant, the
actual size of the difference in practical terms would be considered as small (i.e., Cohen’s d, see p. 5),
but meaningful.
92.1% 90.3% 93.8% 93.0% 90.8% 93.2% 88.1%
5.3% 6.5% 4.1% 4.8% 6.2% 4.4% 8.7%
0%
20%
40%
60%
80%
100%
Full Sample Males Females Age 45+ Age < 45 Whites Minorities
"Agree" or "Strongly Agree" "Neither Agree/Disagree"
Group n SD M Sig.
Full Sample 1,181 .76 4.4
Males 476 .80 4.4
Females 681 .72 4.5
Age 45 or older 757 .74 4.4
< 45 401 .78 4.4
Whites 927 .74 4.4 *
Minorities 252 .82 4.3
Page | 20
4.4
4.4
4.4
4.4
4.4
4.4
4.2
1.0 2.0 3.0 4.0 5.0
Sample
Male
Female
45+
< 45
White
Minority
FULL
GEN
DER
AG
ER
AC
E
I. LEGITIMACY AND TRUST
Question #14 STRONGLY
AGREE
(5) AGREE
(4)
NEITHER AGREE
/DISAGREE
(3) DISAGREE
(2)
STRONGLY DISAGREE
(1)
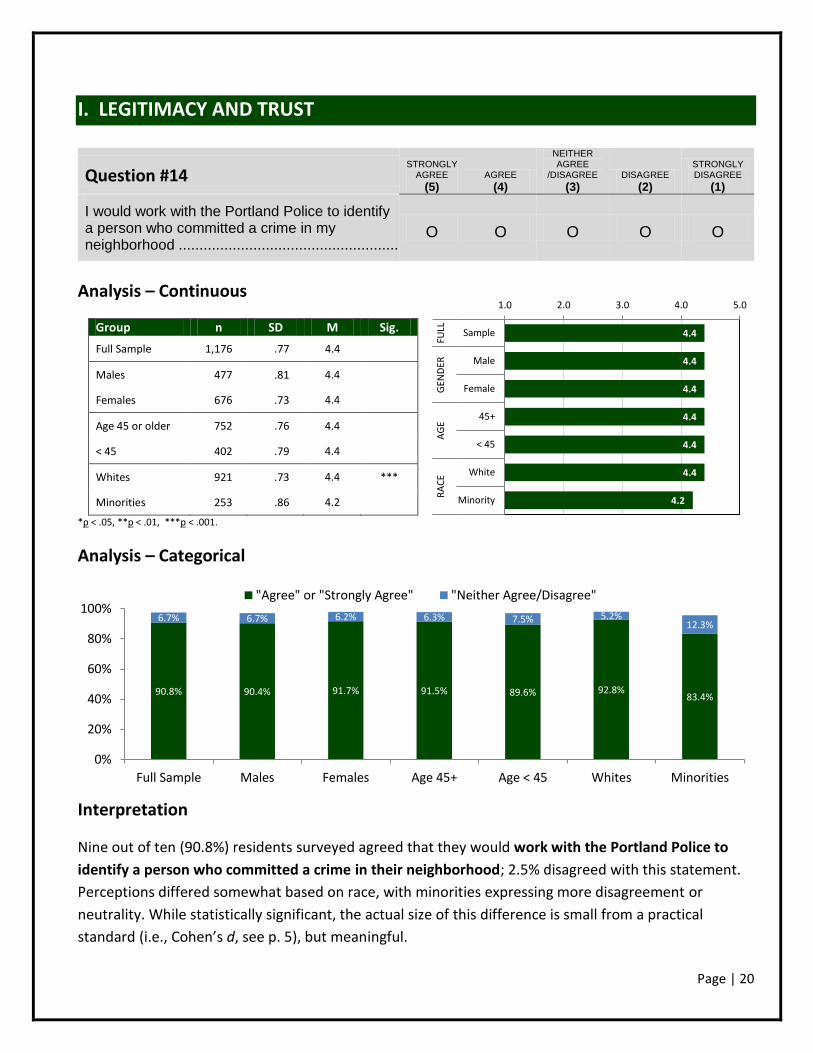
I would work with the Portland Police to identify a person who committed a crime in my neighborhood .......................................................
O O O O O
Analysis – Continuous
*p < .05, **p < .01, ***p < .001.
Analysis – Categorical
Interpretation
Nine out of ten (90.8%) residents surveyed agreed that they would work with the Portland Police to
identify a person who committed a crime in their neighborhood; 2.5% disagreed with this statement.
Perceptions differed somewhat based on race, with minorities expressing more disagreement or
neutrality. While statistically significant, the actual size of this difference is small from a practical
standard (i.e., Cohen’s d, see p. 5), but meaningful.
90.8% 90.4% 91.7% 91.5% 89.6% 92.8%83.4%
6.7% 6.7% 6.2% 6.3% 7.5% 5.2%12.3%
0%
20%
40%
60%
80%
100%
Full Sample Males Females Age 45+ Age < 45 Whites Minorities
"Agree" or "Strongly Agree" "Neither Agree/Disagree"
Group n SD M Sig.
Full Sample 1,176 .77 4.4
Males 477 .81 4.4
Females 676 .73 4.4
Age 45 or older 752 .76 4.4
< 45 402 .79 4.4
Whites 921 .73 4.4 ***
Minorities 253 .86 4.2
Page | 21
I. LEGITIMACY AND TRUST - SUMMARY
It is important that community members have trust in the members of their local police department
and perceive that the policies and practices of the organization are legitimate. Trust in local police is
embodied by a public confidence that law enforcement officers perform their duties fairly, equitably,
and in good faith with the interest of community safety. The legitimacy of local police is based on the
public’s recognition and respect of police authority and the public’s willingness to assist law
enforcement in addressing criminal incidents.
The survey results indicate that the majority of residents believe the Portland Police are fair and
trustworthy (questions 2, 5 & 6). Most residents also feel that local police would treat people “like me”
respectfully during interactions (item 4) and they express confidence in the Bureau as a whole (item 3).
A further indicator of their trust and confidence in local police was the finding that nine out of ten
residents would be willing to report a criminal incident in their neighborhood and help officers identify
the suspect(s) involved (items 13 & 14). Although there were some statistically significant differences in
responses to these items across demographic groups, these differences were for the most part small to
very small from an applied perspective, but shouldn’t be discounted.
These findings suggest that most residents in Portland have a positive view of the Portland Police
Bureau and its officers, particularly in relation to their own interactions or potential interactions with
the agency. Greater concerns were expressed, however, regarding the Bureau’s interactions with
certain subgroups in the population. Specifically, a third of respondents believed the Portland Police
might treat people differently based on their race/ethnicity or their mental health status (questions 9,
10, & 11). These concerns regarding equity were more pronounced among younger and minority
respondents.
Perhaps as a result of these targeted areas of concern, fewer than half of respondents believed they
shared similar values with the Portland Police (question 8) or agreed that people should respect
decisions that local police make (question 7).
Changing and improving public perceptions of police legitimacy and trust poses a number of challenges
for law enforcement agencies. Central to this challenge are two important considerations. First, public
perceptions of police legitimacy and trust are based not only on prior direct personal police experiences
but also indirect or vicarious experiences (e.g. media portrayals of police, neighbors/friends/family
experiences). Second, research indicates that attitudes towards the police are fairly stable over time
once established. In short, public perceptions about the police are formed through multiple pathways
and changing perceptions will likely require that the Bureau work to increase positive direct and indirect
encounters with officers. The conclusion section to the report offers more detailed strategies to help
the Bureau achieve these goals.
Page | 22
II. EVALUATION OF PPB’S PERFORMANCE OVER THE PAST 12 MONTHS
The 12 items in the following section focus on individuals’ evaluations of the Portland Police Bureau’s
performance across a wide range of police activities over the past 12 months. These items are
designed to measure public perception of PPB’s activities in the community over the last year and
their overall effectiveness in policing efforts. Community outreach and accountability have been
identified as important goals by the Portland Police Bureau. The following 12 items measure how
successful Portland citizen’s feel the PPB was at achieving these important policing and departmental
outcomes. The 12 public perception items fall into three major categories: 1) general satisfaction
with police services, 2) police outreach with the community, and 3) specific changes that PPB has
undertaken to improve its policing efforts in the community, which include implementing new
training procedures and efforts to reduce use of force. The results will provide important
performance feedback for PPB that can be used as a baseline to measure subsequent changes in the
public’s perceptions of police performance.
Page | 23
3.6
3.6
3.7
3.7
3.5
3.7
3.5
1.0 2.0 3.0 4.0 5.0
Sample
Male
Female
45+
< 45
White
Minority
FULL
GEN
DER
AG
ER
AC
E
II. EVALUATION OF PPB’S PERFORMANCE OVER THE PAST YEAR
Question #1
VERY GOOD
(5) GOOD
(4) FAIR
(3) POOR
(2)
VERY POOR
(1)
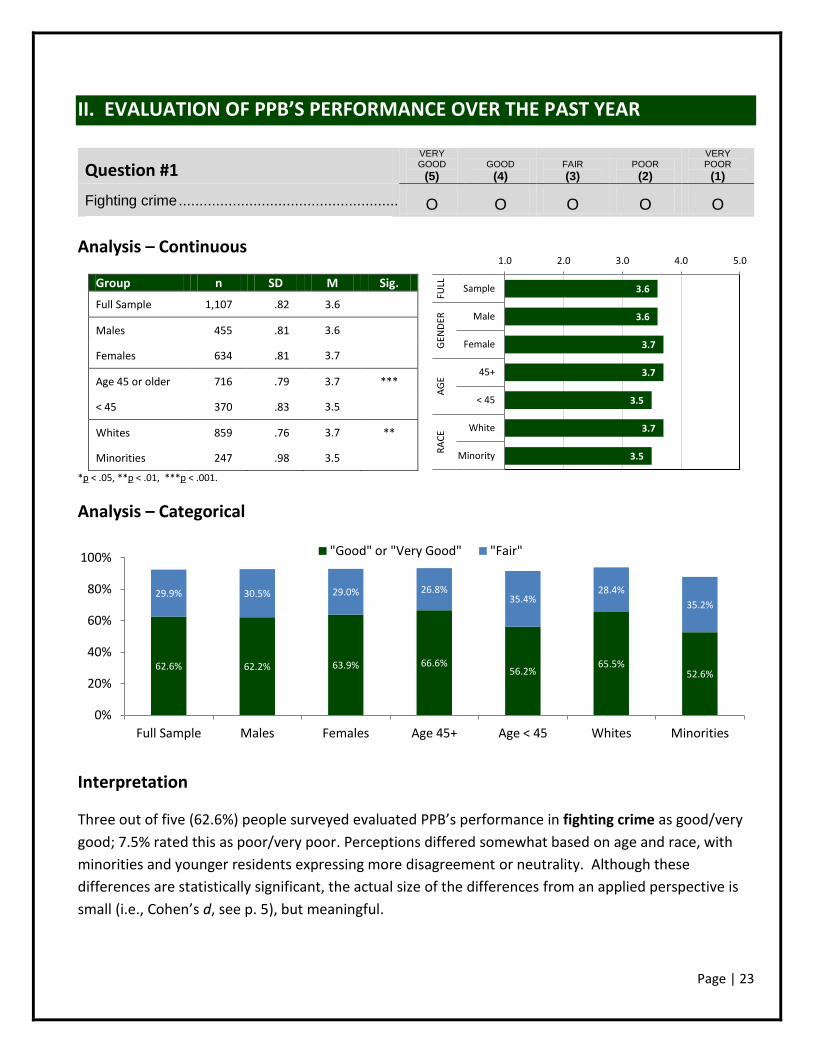
Fighting crime ....................................................... O O O O O
Analysis – Continuous
*p < .05, **p < .01, ***p < .001.
Analysis – Categorical
Interpretation
Three out of five (62.6%) people surveyed evaluated PPB’s performance in fighting crime as good/very
good; 7.5% rated this as poor/very poor. Perceptions differed somewhat based on age and race, with
minorities and younger residents expressing more disagreement or neutrality. Although these
differences are statistically significant, the actual size of the differences from an applied perspective is
small (i.e., Cohen’s d, see p. 5), but meaningful.
62.6% 62.2% 63.9% 66.6%56.2%
65.5%52.6%
29.9% 30.5% 29.0% 26.8%35.4%
28.4%
35.2%
0%
20%
40%
60%
80%
100%
Full Sample Males Females Age 45+ Age < 45 Whites Minorities
"Good" or "Very Good" "Fair"
Group n SD M Sig.
Full Sample 1,107 .82 3.6
Males 455 .81 3.6
Females 634 .81 3.7
Age 45 or older 716 .79 3.7 ***
< 45 370 .83 3.5
Whites 859 .76 3.7 **
Minorities 247 .98 3.5
Page | 24
3.5
3.5
3.6
3.6
3.3
3.6
3.3
1.0 2.0 3.0 4.0 5.0
Sample
Male
Female
45+
< 45
White
Minority
FULL
GEN
DER
AG
ER
AC
E
II. EVALUATION OF PPB’S PERFORMANCE OVER THE PAST YEAR
Question #2
VERY GOOD
(5) GOOD
(4) FAIR
(3) POOR
(2)
VERY POOR
(1)
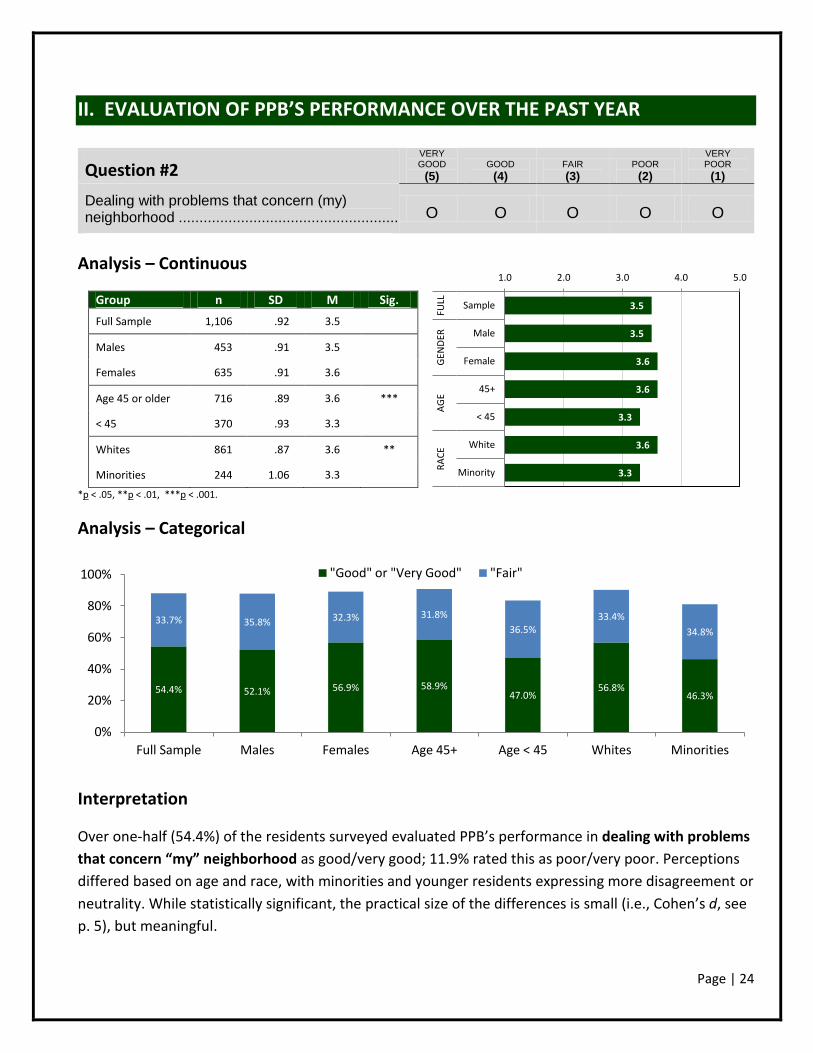
Dealing with problems that concern (my) neighborhood ....................................................... O O O O O
Analysis – Continuous
*p < .05, **p < .01, ***p < .001.
Analysis – Categorical
Interpretation
Over one-half (54.4%) of the residents surveyed evaluated PPB’s performance in dealing with problems
that concern “my” neighborhood as good/very good; 11.9% rated this as poor/very poor. Perceptions
differed based on age and race, with minorities and younger residents expressing more disagreement or
neutrality. While statistically significant, the practical size of the differences is small (i.e., Cohen’s d, see
p. 5), but meaningful.
54.4% 52.1% 56.9% 58.9%47.0%
56.8%46.3%
33.7% 35.8% 32.3% 31.8%
36.5%33.4%
34.8%
0%
20%
40%
60%
80%
100%
Full Sample Males Females Age 45+ Age < 45 Whites Minorities
"Good" or "Very Good" "Fair"
Group n SD M Sig.
Full Sample 1,106 .92 3.5
Males 453 .91 3.5
Females 635 .91 3.6
Age 45 or older 716 .89 3.6 ***
< 45 370 .93 3.3
Whites 861 .87 3.6 **
Minorities 244 1.06 3.3
Page | 25
3.7
3.6
3.8
3.8
3.6
3.8
3.5
1.0 2.0 3.0 4.0 5.0
Sample
Male
Female
45+
< 45
White
Minority
FULL
GEN
DER
AG
ER
AC
E
II. EVALUATION OF PPB’S PERFORMANCE OVER THE PAST YEAR
Question #3
VERY GOOD
(5) GOOD
(4) FAIR
(3) POOR
(2)
VERY POOR
(1)
Being available when you need them ................... O O O O O
Analysis – Continuous
*p < .05, **p < .01, ***p < .001.
Analysis – Categorical
Interpretation
Two-thirds (65.3%) of the people surveyed evaluated PPB’s performance in being available when you
need them as good/very good; 9.2% rated this as poor/very poor. Perceptions differed based on
gender, age and race, with male, minorities and younger residents expressing more disagreement or
neutrality. Although these differences are statistically significant, the actual size of the differences in
practical terms is small (i.e., Cohen’s d, see p. 5), but meaningful.
65.3% 61.5%68.9% 68.4% 61.4% 68.0%
55.8%
25.5% 29.1%22.7% 23.7%
28.1%24.8%
27.9%
0%
20%
40%
60%
80%
100%
Full Sample Males Females Age 45+ Age < 45 Whites Minorities
"Good" or "Very Good" "Fair"
Group n SD M Sig.
Full Sample 1,104 .89 3.7
Males 454 .88 3.6 *
Females 631 .89 3.8
Age 45 or older 713 .87 3.8 **
< 45 370 .91 3.6
Whites 863 .84 3.8 ***
Minorities 240 1.04 3.5
Page | 26
3.4
3.4
3.5
3.6
3.3
3.5
3.2
1.0 2.0 3.0 4.0 5.0
Sample
Male
Female
45+
< 45
White
Minority
FULL
GEN
DER
AG
ER
AC
E
II. EVALUATION OF PPB’S PERFORMANCE OVER THE PAST YEAR
Question #4
VERY GOOD
(5) GOOD
(4) FAIR
(3) POOR
(2)
VERY POOR
(1)
Understanding the concerns of (my) community ............................................................ O O O O O
Analysis – Continuous
*p < .05, **p < .01, ***p < .001.
Analysis – Categorical
Interpretation
More than one-half (53.4%) of the residents evaluated PPB’s performance in understanding the
concerns of “my” community as good/very good; 14.5% rated this as poor/very poor. Perceptions
differed based on gender, age and race, with males, minorities and younger residents expressing more
disagreement or neutrality with this item. While statistically significant, the practical size of the
differences in each case would be considered as small (i.e., Cohen’s d, see p. 5), but meaningful.
53.0% 49.6% 56.0% 58.0%45.2%
56.3%41.8%
32.5% 35.4%30.7% 30.3%
35.6%
32.0%
34.4%
0%
20%
40%
60%
80%
100%
Full Sample Males Females Age 45+ Age < 45 Whites Minorities
"Good" or "Very Good" "Fair"
Group n SD M Sig.
Full Sample 1,105 .95 3.4
Males 452 .96 3.4 *
Females 636 .91 3.5
Age 45 or older 710 .91 3.6 ***
< 45 374 .96 3.3
Whites 860 .90 3.5 ***
Minorities 244 1.04 3.2
Page | 27
3.2
3.2
3.3
3.4
3.0
3.3
3.1
1.0 2.0 3.0 4.0 5.0
Sample
Male
Female
45+
< 45
White
Minority
FULL
GEN
DER
AG
ER
AC
E
II. EVALUATION OF PPB’S PERFORMANCE OVER THE PAST YEAR
Question #5
VERY GOOD
(5) GOOD
(4) FAIR
(3) POOR
(2)
VERY POOR
(1)
Building trust with (my) community ....................... O O O O O
Analysis – Continuous
*p < .05, **p < .01, ***p < .001.
Analysis – Categorical
Interpretation
Four out of ten (41.8%) people surveyed evaluated PPB’s performance in building trust with “my”
community as good/very good; 21.8% rated this as poor/very poor. Age and race differences were
observed, with minorities and younger residents expressing more disagreement or neutrality. These
differences were statistically significant, but would be interpreted as small effects from an applied
perspective (i.e., Cohen’s d, see p. 5), but meaningful.
41.8% 41.2% 42.5% 48.0%
30.7%43.1% 37.2%
36.4% 34.1%38.3%
34.6%
39.4%
37.3%33.5%
0%
20%
40%
60%
80%
100%
Full Sample Males Females Age 45+ Age < 45 Whites Minorities
"Good" or "Very Good" "Fair"
Group n SD M Sig.
Full Sample 1,106 1.03 3.2
Males 451 1.07 3.2
Females 637 .98 3.3
Age 45 or older 710 1.01 3.4 ***
< 45 378 1.01 3.0
Whites 864 .99 3.3 **
Minorities 242 1.14 3.1
Page | 28
3.1
3.1
3.2
3.3
2.8
3.2
3.0
1.0 2.0 3.0 4.0 5.0
Sample
Male
Female
45+
< 45
White
Minority
FULL
GEN
DER
AG
ER
AC
E
II. EVALUATION OF PPB’S PERFORMANCE OVER THE PAST YEAR
Question #6
VERY GOOD
(5) GOOD
(4) FAIR
(3) POOR
(2)
VERY POOR
(1)
Involving (my) community in crime prevention efforts ................................................................... O O O O O
Analysis – Continuous
*p < .05, **p < .01, ***p < .001.
Analysis – Categorical
Interpretation
One-third (35.8%) of the residents in the sample evaluated PPB’s performance for involving “my”
community in crime prevention as good/very good; 25.3% rated this as poor/very poor. Perceptions
significantly differed based on age and race, with minorities and younger residents expressing more
disagreement or neutrality for this item. The size of the differences from a practical perspective was
very small for minority respondents, but medium for younger respondents (i.e., Cohen’s d, see p. 5).
35.8% 34.2% 37.3% 43.4%
21.1%36.4% 33.5%
38.9% 41.2% 37.5%38.0%
40.5%
39.1%38.0%
0%
20%
40%
60%
80%
100%
Full Sample Males Females Age 45+ Age < 45 Whites Minorities
"Good" or "Very Good" "Fair"
Group n SD M Sig.
Full Sample 1,088 1.01 3.1
Males 444 .97 3.1
Females 627 1.02 3.2
Age 45 or older 703 .99 3.3 ***
< 45 365 .95 2.8
Whites 846 .98 3.2 *
Minorities 242 1.09 3.0
Page | 29
3.0
2.9
3.0
3.0
2.9
3.0
3.0
1.0 2.0 3.0 4.0 5.0
Sample
Male
Female
45+
< 45
White
Minority
FULL
GEN
DER
AG
ER
AC
E
II. EVALUATION OF PPB’S PERFORMANCE OVER THE PAST YEAR
Question #7
VERY GOOD
(5) GOOD
(4) FAIR
(3) POOR
(2)
VERY POOR
(1)
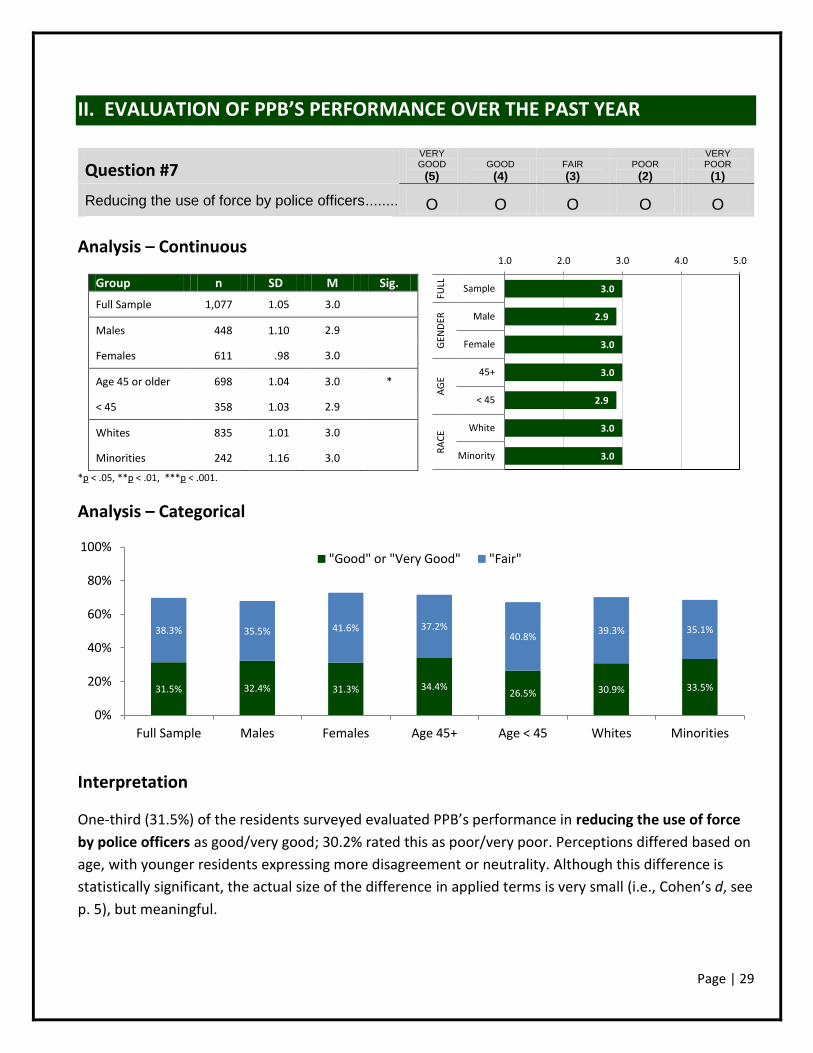
Reducing the use of force by police officers .......... O O O O O
Analysis – Continuous
*p < .05, **p < .01, ***p < .001.
Analysis – Categorical
Interpretation
One-third (31.5%) of the residents surveyed evaluated PPB’s performance in reducing the use of force
by police officers as good/very good; 30.2% rated this as poor/very poor. Perceptions differed based on
age, with younger residents expressing more disagreement or neutrality. Although this difference is
statistically significant, the actual size of the difference in applied terms is very small (i.e., Cohen’s d, see
p. 5), but meaningful.
31.5% 32.4% 31.3% 34.4%26.5% 30.9% 33.5%
38.3% 35.5% 41.6% 37.2%40.8%
39.3% 35.1%
0%
20%
40%
60%
80%
100%
Full Sample Males Females Age 45+ Age < 45 Whites Minorities
"Good" or "Very Good" "Fair"
Group n SD M Sig.
Full Sample 1,077 1.05 3.0
Males 448 1.10 2.9
Females 611 .98 3.0
Age 45 or older 698 1.04 3.0 *
< 45 358 1.03 2.9
Whites 835 1.01 3.0
Minorities 242 1.16 3.0
Page | 30
2.9
2.8
2.9
2.9
2.7
2.9
2.7
1.0 2.0 3.0 4.0 5.0
Sample
Male
Female
45+
< 45
White
Minority
FULL
GEN
DER
AG
ER
AC
E
II. EVALUATION OF PPB’S PERFORMANCE OVER THE PAST YEAR
Question #8
VERY GOOD
(5) GOOD
(4) FAIR
(3) POOR
(2)
VERY POOR
(1)
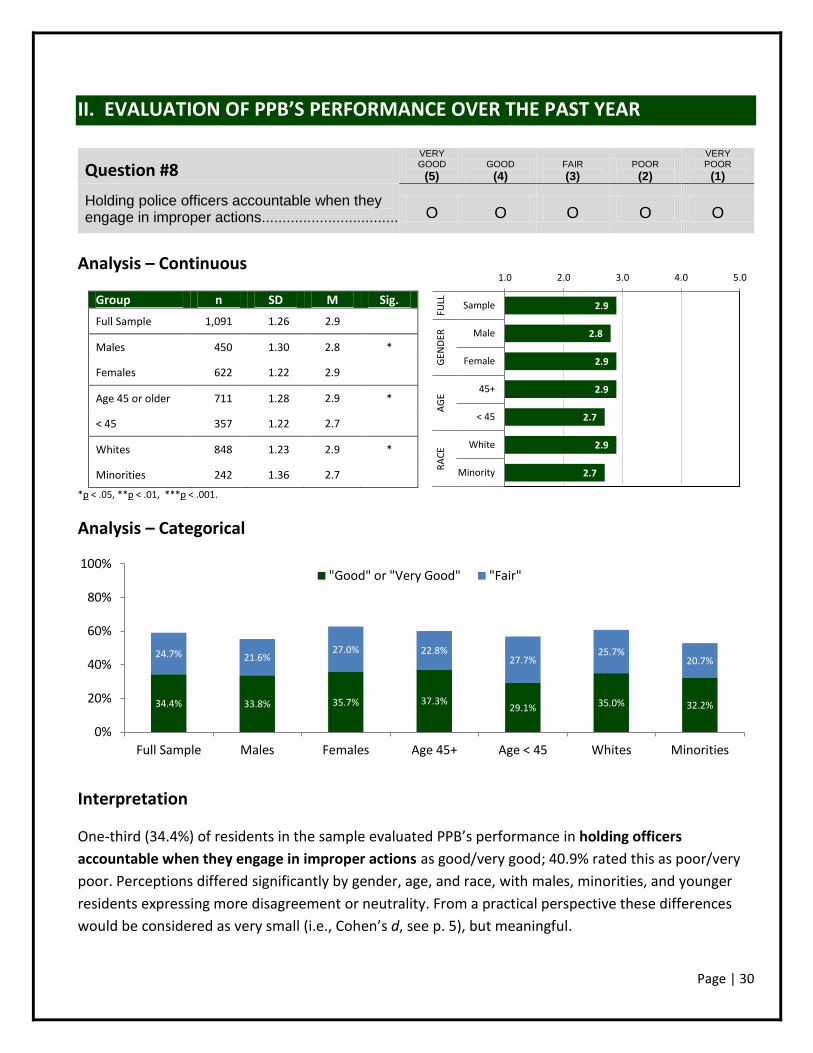
Holding police officers accountable when they engage in improper actions................................... O O O O O
Analysis – Continuous
*p < .05, **p < .01, ***p < .001.
Analysis – Categorical
Interpretation
One-third (34.4%) of residents in the sample evaluated PPB’s performance in holding officers
accountable when they engage in improper actions as good/very good; 40.9% rated this as poor/very
poor. Perceptions differed significantly by gender, age, and race, with males, minorities, and younger
residents expressing more disagreement or neutrality. From a practical perspective these differences
would be considered as very small (i.e., Cohen’s d, see p. 5), but meaningful.
34.4% 33.8% 35.7% 37.3%29.1% 35.0% 32.2%
24.7% 21.6%27.0% 22.8%
27.7%25.7%
20.7%
0%
20%
40%
60%
80%
100%
Full Sample Males Females Age 45+ Age < 45 Whites Minorities
"Good" or "Very Good" "Fair"
Group n SD M Sig.
Full Sample 1,091 1.26 2.9
Males 450 1.30 2.8 *
Females 622 1.22 2.9
Age 45 or older 711 1.28 2.9 *
< 45 357 1.22 2.7
Whites 848 1.23 2.9 *
Minorities 242 1.36 2.7
Page | 31
3.0
3.0
3.0
3.1
2.8
3.0
2.9
1.0 2.0 3.0 4.0 5.0
Sample
Male
Female
45+
< 45
White
Minority
FULL
GEN
DER
AG
ER
AC
E
II. EVALUATION OF PPB’S PERFORMANCE OVER THE PAST YEAR
Question #9
VERY GOOD
(5) GOOD
(4) FAIR
(3) POOR
(2)
VERY POOR
(1)
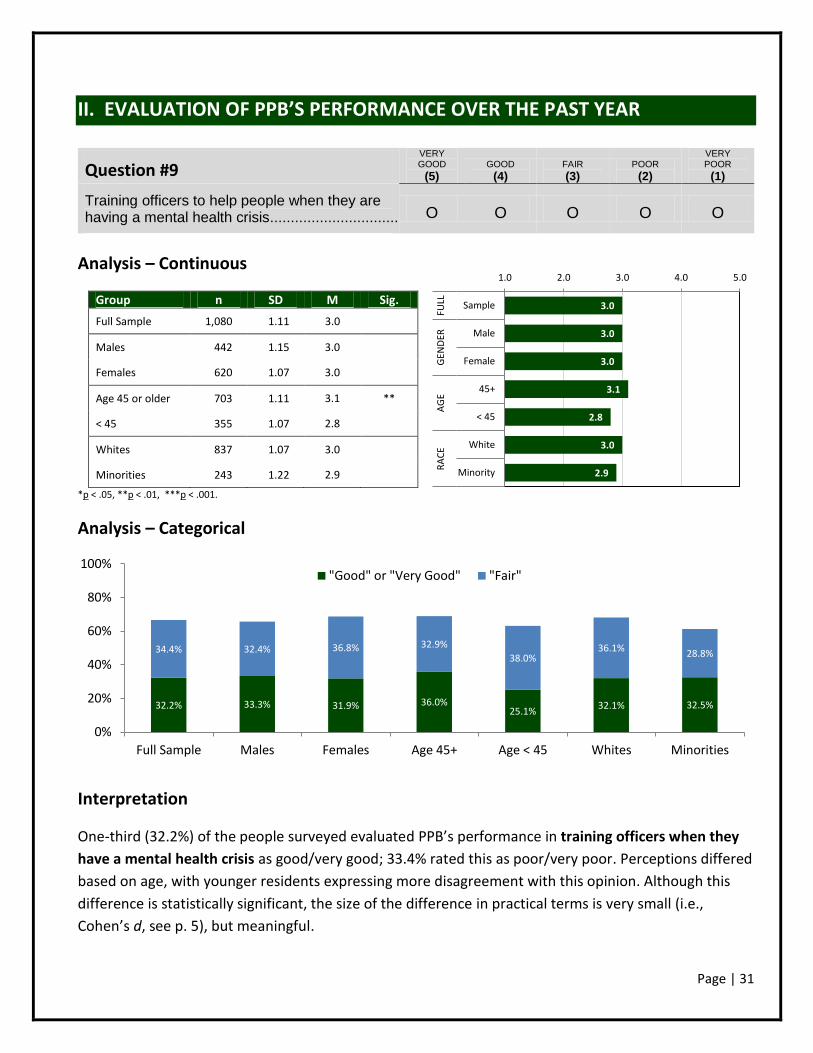
Training officers to help people when they are having a mental health crisis ................................. O O O O O
Analysis – Continuous
*p < .05, **p < .01, ***p < .001.
Analysis – Categorical
Interpretation
One-third (32.2%) of the people surveyed evaluated PPB’s performance in training officers when they
have a mental health crisis as good/very good; 33.4% rated this as poor/very poor. Perceptions differed
based on age, with younger residents expressing more disagreement with this opinion. Although this
difference is statistically significant, the size of the difference in practical terms is very small (i.e.,
Cohen’s d, see p. 5), but meaningful.
32.2% 33.3% 31.9% 36.0%25.1%
32.1% 32.5%
34.4% 32.4% 36.8% 32.9%
38.0%36.1%
28.8%
0%
20%
40%
60%
80%
100%
Full Sample Males Females Age 45+ Age < 45 Whites Minorities
"Good" or "Very Good" "Fair"
Group n SD M Sig.
Full Sample 1,080 1.11 3.0
Males 442 1.15 3.0
Females 620 1.07 3.0
Age 45 or older 703 1.11 3.1 **
< 45 355 1.07 2.8
Whites 837 1.07 3.0
Minorities 243 1.22 2.9
Page | 32
3.1
3.1
3.0
3.1
2.9
3.1
2.9
1.0 2.0 3.0 4.0 5.0
Sample
Male
Female
45+
< 45
White
Minority
FULL
GEN
DER
AG
ER
AC
E
II. EVALUATION OF PPB’S PERFORMANCE OVER THE PAST YEAR
Question #10
VERY GOOD
(5) GOOD
(4) FAIR
(3) POOR
(2)
VERY POOR
(1)
Training officers to work with people from diverse racial and ethnic backgrounds .................. O O O O O
Analysis – Continuous
*p < .05, **p < .01, ***p < .001.
Analysis – Categorical
Interpretation
One-third (33.7%) of residents in the sample evaluated PPB’s performance in training officers to work
with people from diverse racial and ethnic backgrounds as good/very good; 28.2% rated this as
poor/very poor. Statistically significant differences were found for age and race, with minorities and
younger residents expressing more disagreement with this opinion. The effect sizes or practical
significance for these differences would be considered small (i.e., Cohen’s d, see p. 5), but meaningful.
33.7% 36.8% 32.1% 37.1%26.9%
34.1% 32.4%
38.1% 37.0%39.6%
36.1%42.3%
41.2%
27.4%
0%
20%
40%
60%
80%
100%
Full Sample Males Females Age 45+ Age < 45 Whites Minorities
"Good" or "Very Good" "Fair"
Group n SD M Sig.
Full Sample 1,068 1.06 3.1
Males 443 1.07 3.1
Females 608 1.04 3.0
Age 45 or older 698 1.07 3.1 **
< 45 350 1.00 2.9
Whites 827 .99 3.1 **
Minorities 241 1.26 2.9
Page | 33
3.2
3.3
3.2
3.3
3.0
3.3
3.0
1.0 2.0 3.0 4.0 5.0
Sample
Male
Female
45+
< 45
White
Minority
FULL
GEN
DER
AG
ER
AC
E
II. EVALUATION OF PPB’S PERFORMANCE OVER THE PAST YEAR
Question #11
VERY GOOD
(5) GOOD
(4) FAIR
(3) POOR
(2)
VERY POOR
(1)
Diversifying their workforce (e.g., # minorities, women)................................................................. O O O O O
Analysis – Continuous
*p < .05, **p < .01, ***p < .001.
Analysis – Categorical
Interpretation
Four out of ten (39.4%) people surveyed evaluated PPB’s performance in diversifying their workforce as
good/very good; 21.5% rated this as poor/very poor. Perceptions differed based on age and race, with
minorities and younger residents expressing more disagreement or neutrality on this question. These
differences are statistically significant, but the effect sizes suggest small variations in practical terms
(i.e., Cohen’s d, see p. 5), but meaningful.
39.4% 41.6% 38.1% 44.2%29.8%
40.4% 36.1%
39.1% 38.4% 40.3%36.5%
44.7%
41.2%
31.8%
0%
20%
40%
60%
80%
100%
Full Sample Males Females Age 45+ Age < 45 Whites Minorities
"Good" or "Very Good" "Fair"
Group n SD M Sig.
Full Sample 1,048 .98 3.2
Males 435 .95 3.3
Females 596 .98 3.2
Age 45 or older 683 .97 3.3 ***
< 45 349 .97 3.0
Whites 815 .92 3.3 **
Minorities 233 1.13 3.0
Page | 34
3.2
3.1
3.2
3.3
2.9
3.2
3.1
1.0 2.0 3.0 4.0 5.0
Sample
Male
Female
45+
< 45
White
Minority
FULL
GEN
DER
AG
ER
AC
E
II. EVALUATION OF PPB’S PERFORMANCE OVER THE PAST YEAR
Question #12
VERY GOOD
(5) GOOD
(4) FAIR
(3) POOR
(2)
VERY POOR
(1)
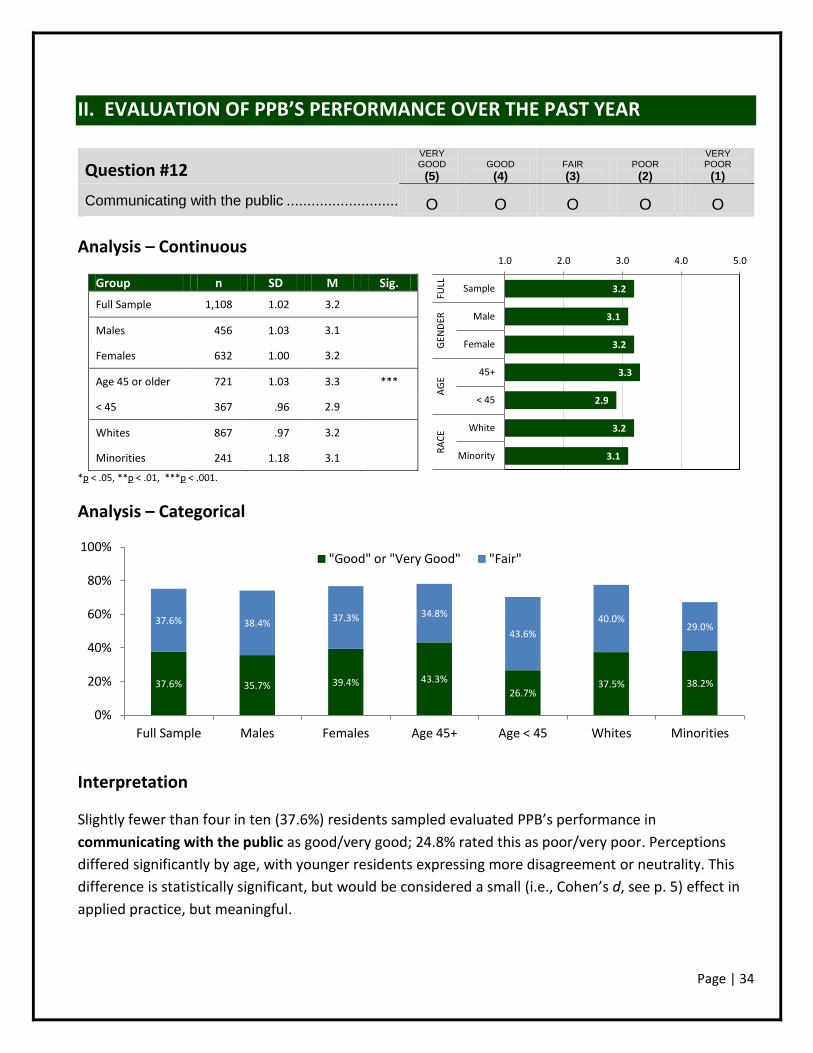
Communicating with the public ............................. O O O O O
Analysis – Continuous
*p < .05, **p < .01, ***p < .001.
Analysis – Categorical
Interpretation
Slightly fewer than four in ten (37.6%) residents sampled evaluated PPB’s performance in
communicating with the public as good/very good; 24.8% rated this as poor/very poor. Perceptions
differed significantly by age, with younger residents expressing more disagreement or neutrality. This
difference is statistically significant, but would be considered a small (i.e., Cohen’s d, see p. 5) effect in
applied practice, but meaningful.
37.6% 35.7% 39.4% 43.3%
26.7%37.5% 38.2%
37.6% 38.4% 37.3% 34.8%
43.6%
40.0%29.0%
0%
20%
40%
60%
80%
100%
Full Sample Males Females Age 45+ Age < 45 Whites Minorities
"Good" or "Very Good" "Fair"
Group n SD M Sig.
Full Sample 1,108 1.02 3.2
Males 456 1.03 3.1
Females 632 1.00 3.2
Age 45 or older 721 1.03 3.3 ***
< 45 367 .96 2.9
Whites 867 .97 3.2
Minorities 241 1.18 3.1
Page | 35
II. EVALUATION OF PPB’S PERFORMANCE - SUMMARY
It is important for a police department to understand the public’s perception of agency performance
related to public safety and professional integrity. Measuring public opinion about agency performance
poses a number of concerns. First, an agency needs measures to examine and illustrate its performance
trends to the public. Second, the public needs to be made aware of departmental activities and
performance trends. Although the public is more familiar with the police compared to most
government agencies, their breadth of knowledge of police operations and performance is typically
limited. An example of this concern is that an average of 9% of respondents did not answer the prior
performance questions, compared to 2% in the preceding legitimacy/trust section. In addition, the
most common response given across the performance evaluation questions was “fair”, averaging a third
of respondents for each item. The common use of “fair” as a performance response may be a reflection
of limited information about police activities.
The most positive evaluations of the PPB’s performance were for fighting crime (question 1), dealing
with neighborhood problems (item 2), being available (item 3), and understanding community concerns
(item 4). The majority of survey respondents rated Portland Police Bureau’s performance on these
items as good or very good. Weaker performance ratings (i.e. less than half of respondents rating the
item as good or very good) were given for building trust in communities (item 5), involving community
in crime prevention efforts (item 6), diversifying the workforce (item 11), and communicating with the
public (item 12).
The performance categories that received the lowest ratings, but were also the most commonly skipped
items, dealt with police performance in reducing use of force (question 7), holding officers accountable
(question 8), training officers to help persons having a mental health crisis (question 9) and work with
persons of diverse racial/ethnic backgrounds (question 10). Only about one-third of residents rated the
Bureau’s performance in these areas as “good” or “very good”.
Part of the struggle in improving the public’s perception of police performance will be ensuring the
positive work the Bureau achieves regarding community outreach, new training, and use of force trends
is being cataloged and then made readily available to the public and media sources. For example, is the
public aware of PPB’s new Behavioral Health Unit (http://www.portlandoregon.gov/police/62135) and what
it’s doing? The Behavioral Health Unit encompasses a broad approach to mental illness and crisis
management, many of which were implemented prior to this survey. The conclusion section to the
report offers potential strategies to help the Bureau to better promote its activities, particularly those
outside of traditional “crime fighting”, to the public.