1 Public Policies and FDI Location: Differences between Developing and Developed Countries # Timothy Goodspeed * Hunter College and CUNY Graduate Center [email protected]Jorge Martinez-Vazquez ** Georgia State University and rede, Universidad de Vigo [email protected]Li Zhang *** Central University of Finance and Economics, China [email protected]September 28, 2010 Abstract: Host country government officials in developing and developed countries alike would like to know the impact of their public policies on foreign investment in their countries. Unfortunately, the literature does not provide a single view, and there are likely to be differences in the correct answer between developing and developed countries. This paper examines the impact of three host country government policies on the host’s FDI stock: taxation, good governance, and infrastructure. We focus on whether the impact of these factors on FDI differs depending on the level of development of the host country. The regression results indicate that FDI is sensitive to host country taxation in developed countries, but not in developing countries; FDI is sensitive to host country governance measures and corruption in both developing countries and developed, with a somewhat larger impact for developing countries; and FDI shows sensitivity to host country infrastructure quality in both developed and developing host countries. * Mailing Address: Hunter College, Department of Economics, 695 Park Avenue, NY, NY, 10021 USA ** Mailing Address: Georgia State University, Andrew Young School of Policy Studies, 14 Marietta Street, Suite 557, Atlanta, Georgia 30303-3083. *** Mailing address: Central University of Finance and Economics, China Academy of Public Finance and Public Policy, 39 South College Road, Haidian District, Beijing, 100081, China. # We gratefully acknowledge the comments of participants in the 7 th Bundesbank MiDi Workshop, October 6, 2009, the Oxford CBT 2010 Summer Symposium, the 2010 IIPF Meetings and particularly Serena Fatica, two referees, Alfons Weichenrieder; we also thank Partha Deb for useful discussions. All errors are our own. Goodspeed gratefully acknowledges support from PSC-CUNY grant # 63707-00 41.
Transcript
1
Public Policies and FDI Location: Differences between
Abstract: Host country government officials in developing and developed countries alike would like to know the impact of their public policies on foreign investment in their countries. Unfortunately, the literature does not provide a single view, and there are likely to be differences in the correct answer between developing and developed countries. This paper examines the impact of three host country government policies on the host’s FDI stock: taxation, good governance, and infrastructure. We focus on whether the impact of these factors on FDI differs depending on the level of development of the host country. The regression results indicate that FDI is sensitive to host country taxation in developed countries, but not in developing countries; FDI is sensitive to host country governance measures and corruption in both developing countries and developed, with a somewhat larger impact for developing countries; and FDI shows sensitivity to host country infrastructure quality in both developed and developing host countries. * Mailing Address: Hunter College, Department of Economics, 695 Park Avenue, NY, NY, 10021 USA
** Mailing Address: Georgia State University, Andrew Young School of Policy Studies, 14 Marietta Street, Suite 557, Atlanta, Georgia 30303-3083.
*** Mailing address: Central University of Finance and Economics, China Academy of Public Finance and Public Policy, 39 South College Road, Haidian District, Beijing, 100081, China. #We gratefully acknowledge the comments of participants in the 7th Bundesbank MiDi Workshop, October 6, 2009, the Oxford CBT 2010 Summer Symposium, the 2010 IIPF Meetings and particularly Serena Fatica, two referees, Alfons Weichenrieder; we also thank Partha Deb for useful discussions. All errors are our own. Goodspeed gratefully acknowledges support from PSC-CUNY grant # 63707-00 41.
2
I. Introduction
Foreign direct investment (FDI) can provide a number of benefits to countries that
need capital including higher growth, greater exports, higher wages, and greater
productivity through technology spillovers to local firms. While the evidence of the
impact of FDI is somewhat mixed,1 government officials in developing and developed
countries alike would like to know the impact of their public policies on foreign
investment in their countries. Unfortunately for government officials, the literature does
not provide a single view. This is in part because the literature on the impact of policies
on FDI has taken place in at least four sub-disciplines within economics (public finance,
international economics, development economics, and regional economics), but perhaps
more importantly because previous studies have generally not differentiated between
developing and developed countries. Our contribution is to differentiate the impact of
public policies for developing host countries from the impact of public policies for
developed host countries.2
We examine the impact of three public policies on FDI in developing and
developed countries: taxation, infrastructure, and a good business environment. While
these public policies have been studied separately, few if any studies that we are aware of
consider the possibility that developing and developed host country public policies
impact FDI differently. We find some striking results that sometimes contradict the
perceived wisdom for developing countries. For instance, with respect to taxes, Gordon
1 Lipsey (2002) surveys this literature and finds that the evidence indicates that FDI increases exports, sometimes increases growth (especially in developing countries with export promotion policies), has a somewhat ambiguous impact on local wages, and also has an unclear impact on technology spillovers to local firms. 2 Blonigen and Wang (2004) suggest that even factors other than public policies could affect FDI differently for developing and developed countries.
3
and Hines (2002) find that “econometric work of the last fifteen years provides ample
evidence of the sensitivity of the level and location of FDI to its tax treatment.” We find
a more nuanced result: host country taxes negatively affect FDI for developed countries,
but have no impact in developing countries. Madies and Dethier (2010, p. 20) interpret
the previous literature in a way that is even more at odds with our result when they say
“Most empirical studies … conclude that FDI inflows into developing countries are
sensitive, to various degrees, to corporate income taxation and fiscal incentives.”
We think that there are good reasons to suspect that the impact on FDI of the three
public policies we examine might differ between developing and developed countries.
Perhaps most obvious is the case of good governance.3 While most developed countries
already have a high level of laws, customs and institutions that create a good governance
environment, the same cannot be said for most developing countries. Thus, if one
accepts the premise that good governance attracts FDI, diminishing marginal returns to
governance suggests that a marginal improvement for developing countries would have a
bigger impact on FDI than for developed countries. A similar argument can be made for
infrastructure.4 Developed countries often have good infrastructure while developing
3 The level of corruption is one measure of the business environment and Wei (2000a, 2000b) has carefully studied this aspect. He finds significant negative effects using several definitions of corruption. Dharmapala and Hines (2009) document the importance of good governance for tax havens, and find that taxes affect US FDI in well governed but not poorly governed countries, a result that is strikingly similar to our results with respect to taxes. Fatica (2009) uses a cross-section of countries and finds that the sensitivity of foreign investment to the tax rate varies with the level of host country institutional quality. A recent OECD working paper, Hajkova, Nicoletti, Vartia, and Yoo (2006) finds that government policies other than taxes are important determinants of FDI location in OECD countries. 4 In the international literature, Wheeler and Mody (1992) conducted an early and influential study of foreign investment determinants and found that agglomeration – measured by infrastructure quality – is an important determinant while taxes are not a significant determinant. A more recent study by Cheng and Kwan (2000) examines FDI in China and finds a positive impact of infrastructure, but they do not include a tax measure. The idea that government spending and investment decisions as well as taxes influence location decisions is a central theme of studies that examine regional or within-country location of mobile factors and is embodied in Tiebout (1956) models of location. Other papers in public finance have started to incorporate spending as well as taxes in examining FDI location (e.g. Buettner (2002) and Bénassy-
4
economies do not. Again, if one accepts the premise that good infrastructure attracts
FDI, diminishing marginal returns to infrastructure suggests that additional investment in
infrastructure might have a bigger impact in developing countries than developed
countries.
The case of taxation is perhaps the most complex.5 Taxes can be avoided on a
variety of margins from changing the level of FDI directly to other more subtle methods
such as transfer pricing and routing repatriations through several countries. In addition,
the tax regime of the source country can also impact the effect of taxes; for instance a
worldwide taxation system for the source country generally implies little impact for
destination countries with tax rates lower than the source country. One reason that taxes
might not be so important in developing countries is that tax administration is weaker in
developing countries. If taxes are easier to avoid, the tax rate might have little impact on
FDI. Thus, differences in tax enforcement abilities of developing and developed
countries could lead to differences along one or more margins and hence to differences in
the impact of taxes on FDI. Our goal is not to investigate the validity of tax avoidance
arguments per se (though this would be an interesting topic for future research); our goal
is the more modest one of testing whether FDI responds differently to tax and other
public policies in developing and developed countries. As noted in the above quotes
Quéré et al. (2007)) Mutti and Grubert (2004) examine multinational affiliate production and find that sensitivity to taxes is more pronounced in high-income countries, suggesting that “they offer better infrastructure, agglomeration benefits, or a uniquely attractive market opportunity.” (p. 357) 5 The tax literature is voluminous but begins from the 1980s, including Hartman (1984), Boskin and Gale (1987), and Young (1988). These papers use a time series of aggregate BEA data. Others, such as Swenson (1994) find significant effects when disaggregating the data by industry. Others, such as Hines and Rice (1994) and Grubert and Mutti (1991), use the cross-sectional breadth of the BEA data to examine FDI across countries for a given year. Firm level studies include Auerbach and Hassett (1993), Cummins and Hubbard (1995), Ondrich and Wayslenko (1993), and Altshuler, Grubert, Newlon (2001). Hines (1996) uses a panel, but exploits state-level tax differences using BEA data. All these studies find significant effects of taxation, but with a wide range of elasticity estimates.
5
from surveys of the literature in this area, researchers have made some generalizations
that may be valid for developed countries, but not for developing countries according to
the results we present here.
To summarize, in this paper we empirically examine the impact of a country’s
public policies on the stock of its FDI. Our focus is on differences between developing
and developed countries. We test for those differences along three public policy
dimensions: taxation, infrastructure, and good governance. Our findings indicate that the
stock of FDI is sensitive to host country taxation in developed countries, but not in
developing countries; FDI is sensitive to host country governance measures and
corruption in developing and developed countries with changes in corruption having a
somewhat larger impact in developing countries; and FDI shows sensitivity to host
country infrastructure quality in both developed and developing countries.
The rest of the paper is organized as follows. In section II we present our data. In
section III we discuss our estimation results. Section IV concludes.
II. Data Description
Our main objective is to estimate and compare the impact of a host country’s
taxation, infrastructure quality, and governance quality on its stock of FDI, testing for
differences between developing and developed countries. To do this we will use a panel
data set with a dummy for the type of country (developing or developed). The dummy is
interacted with our main variables of interest (taxation, infrastructure, and good
governance) to test whether there are marginal differences between developed and
6
developing countries. We, of course, will control for other well-known determinants of
FDI.
We will use two different measures of FDI for our dependent variable. Our first
measure is an aggregate measure of the stock of FDI of country i in year t, and comes
from UNCTAD (United Nations Conference on Trade and Development). This measure
aggregates together the FDI stock coming from all countries. Our second measure uses
OECD bilateral data on the FDI stock of destination country i in year t coming from
OECD source country j. This disaggregates substantially the aggregate measure of
UNCTAD and gives us a much larger number of observations and degrees of freedom.
In both cases we use the log of the relevant FDI stock measure in our regression analysis.
The independent variables, described below, are the same for both datasets (except for a
dummy variable for the source country and a distance indicator that we use in our
analysis of the bilateral OECD data).6
For our control variables, we follow the previous literature and include variables
that have been consistently found in the past to be determinants of FDI: population,
GDP, the unemployment rate, and exports; this last variable, exports, is lagged to try to
correct for potential endogeneity. The unemployment rate controls for business cycle
effects. Population is a proxy for market size, which other things equal should attract
more FDI. Exports control for the openness of an economy. Holding population
constant, GDP is a measure of wealth and can be roughly interpreted as controlling for
the return on investment or marginal product of capital. Generally, poorer countries lack
capital and hence should be expected to have a higher return on investment than wealthier
countries, other things equal, which implies an inverse relationship between GDP and
6 The distance indicator that we use is computed from the geographic coordinates of capital cities by CEPII.
7
FDI. There has been a recent surge of papers that use distance between countries
(suggested by the gravity equation as a determinant of FDI), and we include this when
possible (specifically in our bilateral OECD data specifications). We also include a
source country dummy in these bilateral specifications to control for any observable or
unobservable source country factors that affect FDI and that do not vary over time.
Our three main policy variables are taxes, infrastructure quality, and governance
quality. These variables present some measurement challenges. Our tax variable is
computed as the minimum of: (i) the effective tax rate faced by the firm calculated using
data from the Bureau of Economic Analysis (BEA),7 and (ii) the statutory tax rate from
data from the Office of Tax Policy Research (OTPR).8 The idea of this variable is that
the statutory tax rate may be too high because of depreciation allowances, tax holidays,
and so forth that are granted by the host country. The effective tax rate we use – (i)
above - is a simple measure of foreign taxes paid in country i divided by profits; if it is
lower than the statutory rate, we take this measure which helps to more accurately reflect
the true tax burden. This measure is also used by Hines and Rice (1994) and Dharmapala
and Hines (2009). We also lag our tax variable to try to correct for any endogeneity.
For our second main policy variable, the quality of infrastructure, we present the
results from two measures. The first measure that we use for infrastructure quality is a
general ranking computed by the World Competitiveness Center and it is based on data
from the IMD World Competitiveness Yearbook. It is one of the four main factors used
7 The effective tax rate is calculated as the ratio ((foreign income taxes)/(foreign income taxes + net income)) of all affiliates for U.S. firms operating in each country abroad and for each year. This is a proxy variable as we do not expect that the taxes paid abroad by the U.S. multinationals to be identical to the taxes paid by other multinationals. 8 We have the statutory tax rate only from 1995. Consequently we use the effective rate from 1982-1995 and the minimum of the statutory and effective rates for years from 1995 on. We have run some preliminary regressions using only the statutory rate and the results are similar. King-Fullerton effective rates are another possible measure but are unavailable for most developing countries.
8
in constructing the overall world competitiveness ranking indices from the IMD World
Competitiveness Yearbook. The infrastructure ranking is a consolidation of five sub-
factors (which are constructed from 110 relevant criteria) and highlight every facet of
overall infrastructure condition, including basic infrastructure (roads, other transportation
infrastructure, health infrastructure, and others), technological infrastructure
(telecommunications, computers, and so forth), energy self-sufficiency, and
environmental infrastructure (waste treatment and so forth). The ranking is such that a
higher number implies a lower infrastructure quality. To ease interpretation, we subtract
the actual ranking from 50 in our regressions so that a higher number implies better
infrastructure.
Though constructed with care, some might object to the fact that this measure of
infrastructure is a ranking. We therefore also use a second measure of infrastructure, the
number of telephone mainlines (telephone lines connecting a customer's equipment to the
public switched telephone network) per 1,000 people for the entire country. This
measure is obtained from the World Development Indicators (WDI) of the World Bank.
Our third policy variable of interest is a measure of good governance. We again
present results from two measures of good governance.9 The first is a measure of
corruption, the “Corruption Perception Index” from Transparency International. This
index is one that is commonly used (one of the measures used by Wei (2000a, 2000b) for
instance) and is the measure that we can find that has the most coverage for the countries
in our sample. This index ranges in value between 0 and 10. It uses a higher number for
9 We also have run regressions using the “rule of law” measure of Kaufmann et al (2009). The results are similar to the results using the broader good governance measure.
9
less corruption so in our empirical work we subtract the index from 10 in order to ease
the interpretation.
We also analyze a second broader measure of good governance, a ranking of
government efficiency from the IMD Competitiveness Yearbook. This is a very broad
measure that includes information on five areas: public finance, fiscal policy, institutional
framework, business legislation, and societal framework. Among the variables used to
analyze the institutional framework part of the measure is corruption.
We should note that observations for the three main policy variables (the tax rate,
the infrastructure index, and the corruption index) are available for varying numbers of
years and countries. In all, 53 (25 developing and 28 developed) countries are covered
for the tax rate for the years 1984 to 2002. The time span is shorter for our other
variables. The corruption index covers 46 countries from 1995 to 2002 and the
infrastructure index 37 countries from 1996 to 2002. We limit our regressions to include
countries and years for which all relevant information is available. The list of the
countries covered, missing data, definition of the variables, data sources, and summary
statistics are presented in Tables A-1, A-2, and A-3 in the Appendix.
III. Empirical Analysis and Estimation Results
This section analyzes the correlation between the pattern of host country FDI
stocks and host country policy variables.10 As mentioned above, we have two measures
of FDI stock, one an aggregate measure from UNCTAD, and the other the bilateral stock
10 As FDI is observed only in countries where there is some institutional quality and the tax rate is not prohibitively high, there could be some selection effects – in our sample of countries, most of the developing ones are relatively wealthy. Missing observations are dropped.
10
from the OECD.11 As this is our dependent variable, we have constructed two datasets
which we will analyze sequentially. We begin by analyzing the aggregate FDI data from
UNCTAD.
A. Analysis of UNCTAD aggregate FDI data
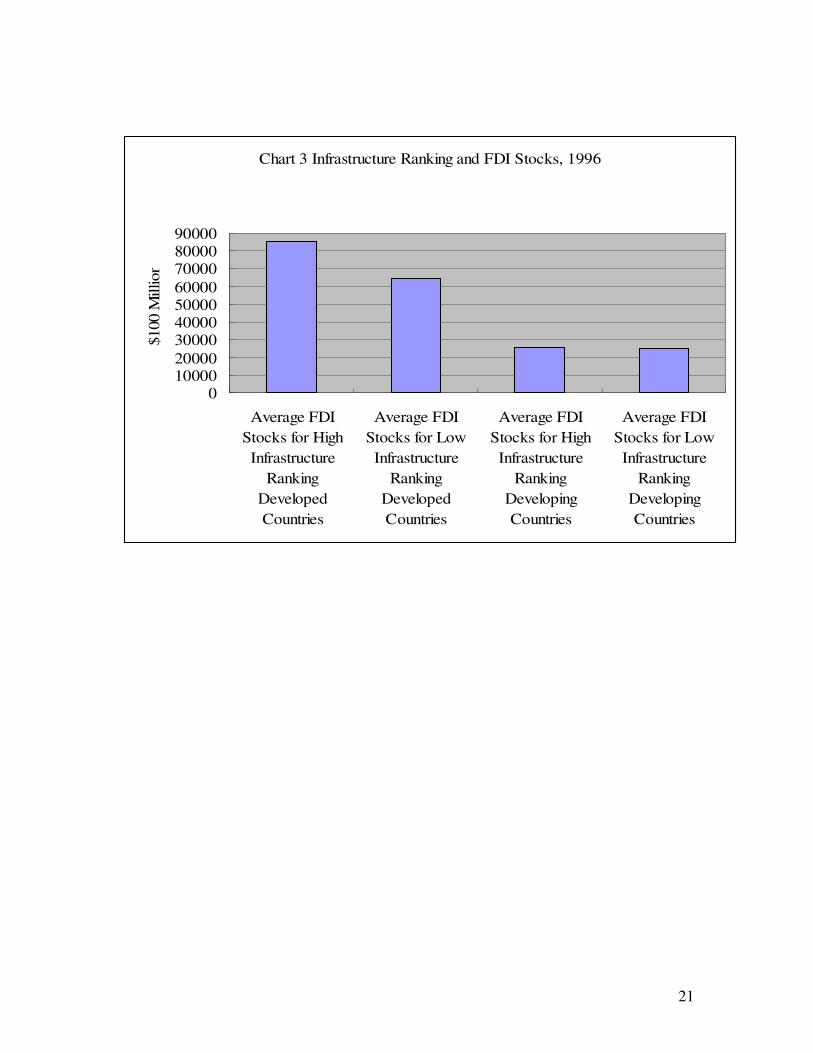
A very rough way to begin our examination is to divide our host countries into
developing and developed groups, then divide each of these groups in two again
according to whether the relevant policy variable (tax rate, infrastructure index,
corruption index) is high or low (defined relative to the median of each group). We can
then compare the average FDI stock for high and low values of our policy variables
within the developing country category, and similarly for developed countries.
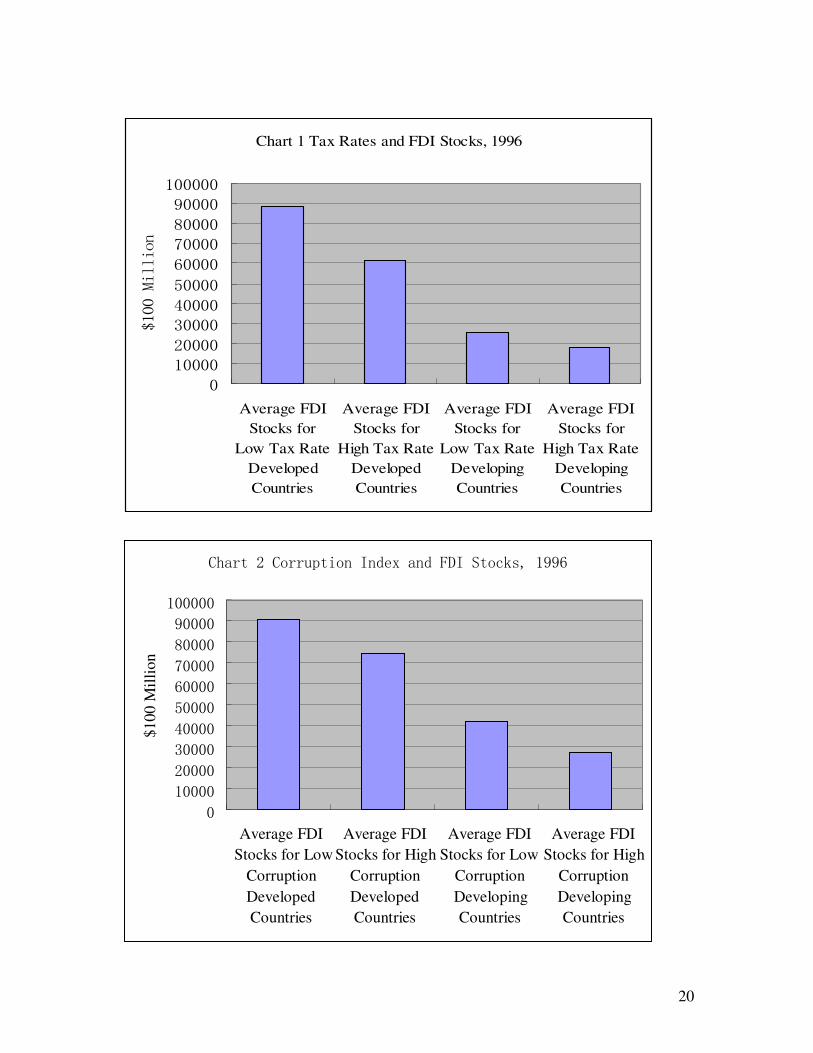
The results of this exercise are shown in Charts 1, 2, and 3 for the year 1996.
Chart 1 shows average host country FDI stocks for high- and low-tax developed
countries, and average host country FDI stocks for high- and low-tax developing
countries. A clear inverse relationship emerges for each group: low-tax developed
countries have on average greater FDI stocks than high-tax developed countries.
Similarly, low-tax developing countries have on average greater FDI stocks than high-tax
developing countries. Chart 2 shows average host country FDI stocks for high- and low-
corruption developed countries, and average host country FDI stocks for high- and low-
corruption developing countries. Again a clear inverse pattern is observed: low-
corruption developed countries have on average greater FDI stocks than high-corruption
countries, and similarly for developing countries. Chart 3 presents average host country
FDI stocks for high- and low-infrastructure quality for developed and developing
countries. The inverse relationship is evident for developed country hosts – high-
11 The set of host countries (both developed and developing) is the same in both data sets.
11
infrastructure quality hosts have higher FDI stocks than low-infrastructure hosts for
developed countries. The relationship for developing countries appears flat for 1996.
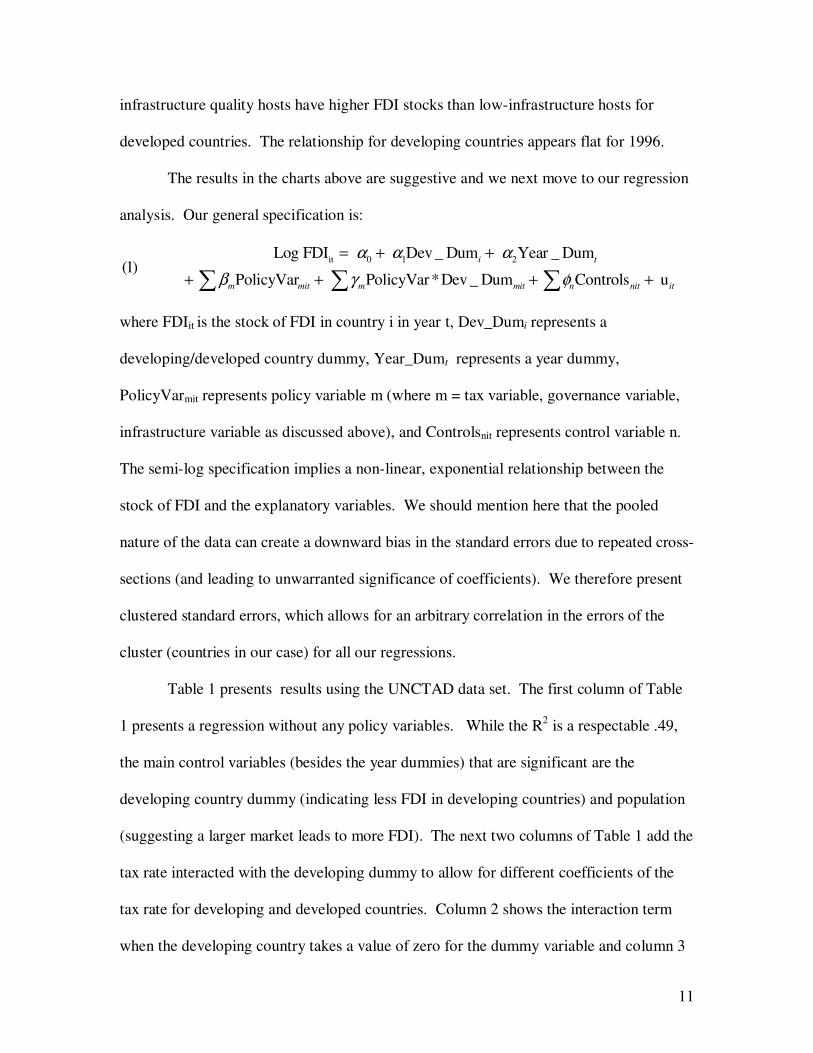
The results in the charts above are suggestive and we next move to our regression
analysis. Our general specification is:
it 0 1 2Log FDI Dev _ Dum Year _ Dum
(1) PolicyVar PolicyVar*Dev _ Dum Controls u
i t
m mit m mit n nit it
α α α
β γ φ
= + +
+ + + +∑ ∑ ∑
where FDIit is the stock of FDI in country i in year t, Dev_Dumi represents a
developing/developed country dummy, Year_Dumt represents a year dummy,
PolicyVarmit represents policy variable m (where m = tax variable, governance variable,
infrastructure variable as discussed above), and Controlsnit represents control variable n.
The semi-log specification implies a non-linear, exponential relationship between the
stock of FDI and the explanatory variables. We should mention here that the pooled
nature of the data can create a downward bias in the standard errors due to repeated cross-
sections (and leading to unwarranted significance of coefficients). We therefore present
clustered standard errors, which allows for an arbitrary correlation in the errors of the
cluster (countries in our case) for all our regressions.
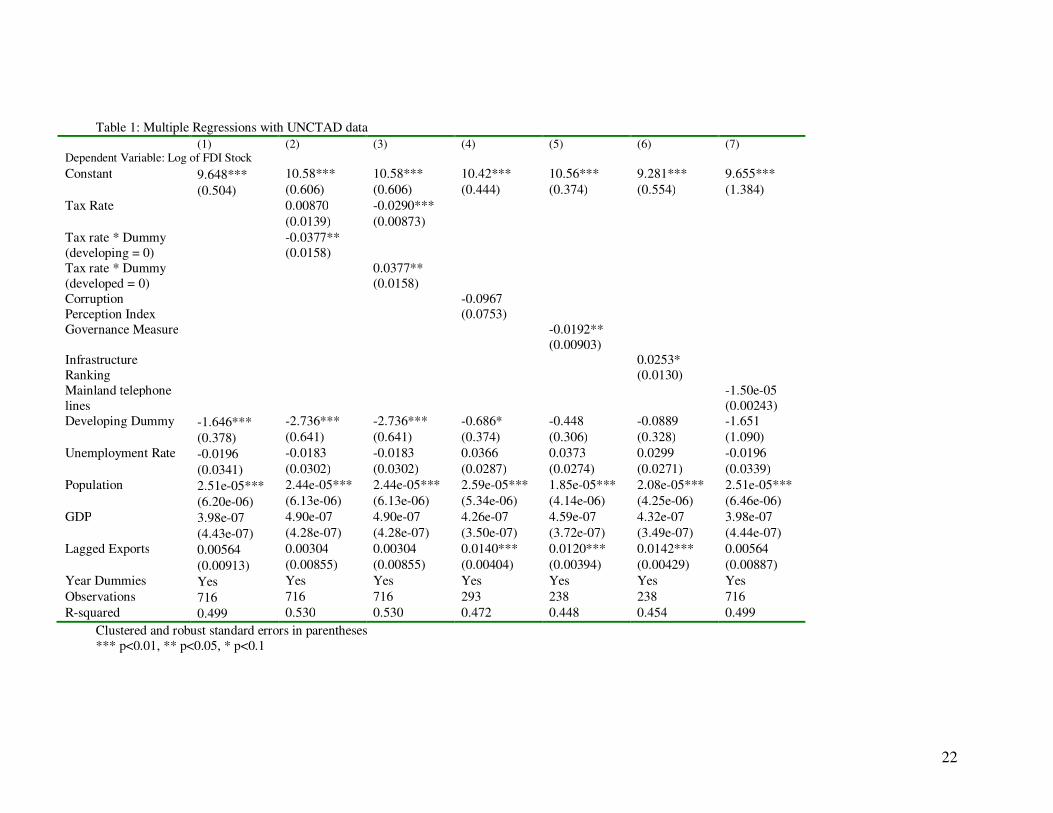
Table 1 presents results using the UNCTAD data set. The first column of Table
1 presents a regression without any policy variables. While the R2 is a respectable .49,
the main control variables (besides the year dummies) that are significant are the
developing country dummy (indicating less FDI in developing countries) and population
(suggesting a larger market leads to more FDI). The next two columns of Table 1 add the
tax rate interacted with the developing dummy to allow for different coefficients of the
tax rate for developing and developed countries. Column 2 shows the interaction term
when the developing country takes a value of zero for the dummy variable and column 3
12
show the results when the developed country takes a value of zero. We use this
presentation method to emphasize the differences between developing and developed
countries at times throughout the paper because it eases interpretation, and we offer a
short explanation here. Obviously the coefficient of the interaction term in column 3 will
be the negative of the interaction term in column 2. We show the results in this way in
order to present the correct standard error along with the coefficient of the tax rate for
developing countries (in column 2) and the correct coefficient and standard error for
developed countries (in column 3). Since the developing country dummy is zero in
column 2, the coefficient on the policy variable of column 2 presents the correct estimate
and standard error for developing countries. The developed country dummy takes on a
value of zero in column 3. Hence, the coefficient of the policy variable in column 3
presents the correct estimate and standard error for the developed country.12
The remaining columns of Table 1 give somewhat mixed results for our other
public policy measures. Column 4 indicates a negative but insignificant coefficient for
our corruption measure, but column 5 indicates that the broader efficient governance
measure is both negative and significant. The last two columns indicate significance for
our infrastructure ranking measure but insignificance for our mainland telephone measure
of infrastructure. When we try to distinguish between developing and developed
countries for the policy variables other than tax (in unreported regressions), we do not
find significance for the interaction term, although there is some significance for the
broader governance measure for developed countries. We also note that when our
developing/developed dummy is significant our corruption measure loses significance
12 Obviously the developed country tax coefficient can be arrived at by the addition of the tax and interaction coefficients from column 2. However, the correct standard error for the developed country coefficient is not shown in column 2. This is only easily obtained from column 3.
13
and when the dummy is insignificant our governance and infrastructure measures are
significant; this may suggest that we are having difficulty distinguishing between certain
policy variables and being a developing country. This might be improved with more
disaggregated data, to which we turn in the following sub-section.
To summarize, the results thus far indicate that taxes are an important determinant
of FDI for developed countries, but have little or no effect on the location of FDI for
developing countries. The evidence is mixed with respect to governance and
infrastructure. There is some evidence that bad governance or bad infrastructure reduces
FDI in Table 1. We will leave further interpretation of the coefficients for the regressions
using the OECD bilateral FDI data, where we are also able to improve our specification
by including distance, a variable suggested by the well-known gravity equation.
B. Analysis of bilateral OECD FDI data
We next turn to our more disaggregated dataset. We will follow the format of our
analysis above for the aggregate UNCTAD data. Our general specification for the
bilateral data is almost identical to (1) above:
ijt 0 1 2 3Log FDI Dev _ Dum Year _ Dum Source _ Dum(2)
PolicyVar PolicyVar*Dev _ Dum Controls u
i t j
m mijt m mijt n nijt ijt
α α α α
β γ φ
= + + +
+ + + +∑ ∑ ∑
where FDIijt is the stock of FDI in destination country i coming from source country j in
year t, Dev_Dumi represents a developing/developed country dummy, Year_Dumt
represents a year dummy, Source_ Dumj represents a dummy for the source country,
PolicyVarmijt represents policy variable m (where m = tax variable, governance variable,
infrastructure variable as discussed above), and Controlsnijt represents control variable n.
14
The only differences with our earlier specification is that we include a source country
dummy for FDI and we are also able to include a distance measure (as suggested by the
gravity equation) among our controls since we are using bilateral data here. The semi-log
specification implies a non-linear, exponential relationship between the stock of FDI and
the explanatory variables. Again the pooled nature of the data can create a downward
bias in the standard errors due to repeated cross-sections (leading to unwarranted
significance of coefficients). We therefore present clustered standard errors, which
allows for an arbitrary correlation in the errors of the cluster (source-destination pair in
our case) for all our regressions.
Tables 2 and 3 present the results using the OECD bilateral data. We follow our
previous Table 1 analysis of the UNCTAD data in Table 2. The first column of Table 2
presents the results without any policy variables. All of our control variables except
unemployment are significant, and with the expected sign. The distance variable is
negative indicating that the greater the distance between two countries, the lower is FDI.
Population is again positive as before indicating that a bigger market is an attraction for
FDI. Exports are also positively related to FDI. The negative sign on GDP is usually
interpreted in the literature as reflecting a diminishing return to capital in wealthier
countries.
The next two columns of Table 2 add the tax coefficient and a tax interaction term
and indicate that our tax variable is significant and negatively related to FDI location for
developed countries but not developing countries. The coefficient for developing
countries is both very low and insignificant. This mirrors the interesting asymmetry
between developing and developed countries with respect to the tax variable that we
15
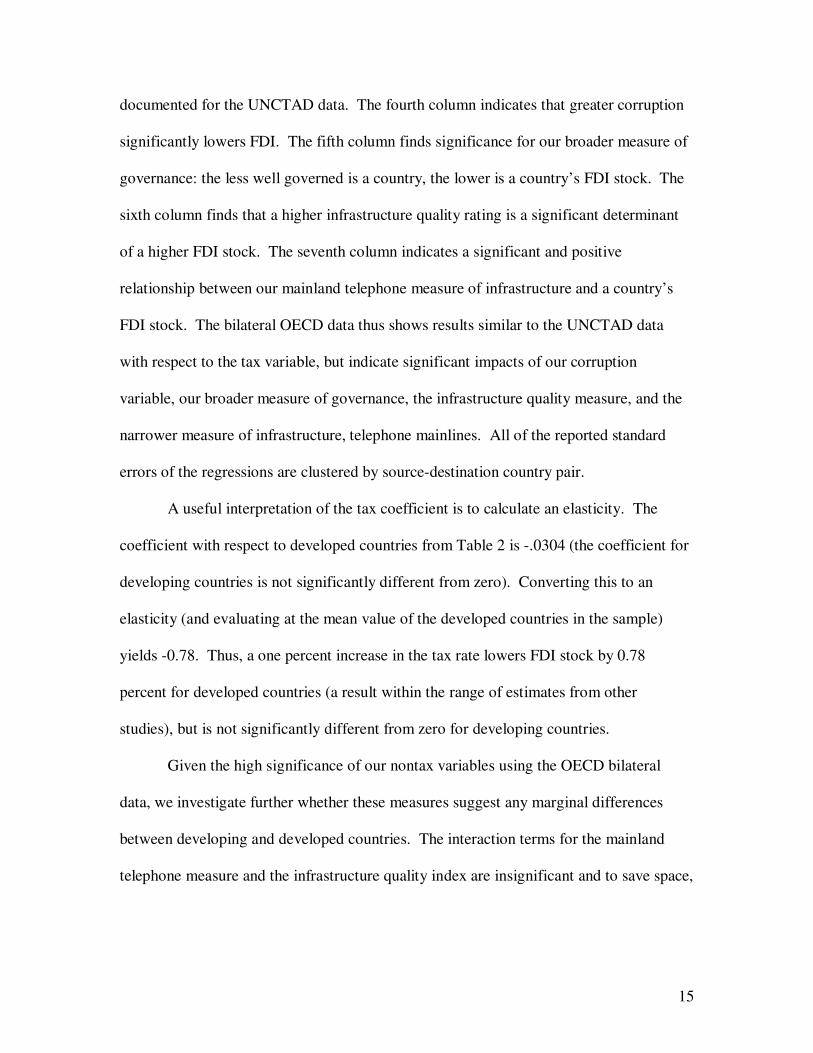
documented for the UNCTAD data. The fourth column indicates that greater corruption
significantly lowers FDI. The fifth column finds significance for our broader measure of
governance: the less well governed is a country, the lower is a country’s FDI stock. The
sixth column finds that a higher infrastructure quality rating is a significant determinant
of a higher FDI stock. The seventh column indicates a significant and positive
relationship between our mainland telephone measure of infrastructure and a country’s
FDI stock. The bilateral OECD data thus shows results similar to the UNCTAD data
with respect to the tax variable, but indicate significant impacts of our corruption
variable, our broader measure of governance, the infrastructure quality measure, and the
narrower measure of infrastructure, telephone mainlines. All of the reported standard
errors of the regressions are clustered by source-destination country pair.
A useful interpretation of the tax coefficient is to calculate an elasticity. The
coefficient with respect to developed countries from Table 2 is -.0304 (the coefficient for
developing countries is not significantly different from zero). Converting this to an
elasticity (and evaluating at the mean value of the developed countries in the sample)
yields -0.78. Thus, a one percent increase in the tax rate lowers FDI stock by 0.78
percent for developed countries (a result within the range of estimates from other
studies), but is not significantly different from zero for developing countries.
Given the high significance of our nontax variables using the OECD bilateral
data, we investigate further whether these measures suggest any marginal differences
between developing and developed countries. The interaction terms for the mainland
telephone measure and the infrastructure quality index are insignificant and to save space,
16
we will not report those results.13 The interpretation for those variables can be drawn
from Table 2. The infrastructure ranking coefficient is 0.0214. Converting this to an
elasticity evaluated at the mean yields 0.57. Thus a ten percent increase in the
infrastructure ranking from the mean of 26.5 to 29 (or from a country like Ireland to one
like Japan) increases FDI by about 5.7 percent. The telephone mainline coefficient from
Table 2 is 0.00147; converting this to an elasticity evaluated at the mean yields 0.49.
Thus, an increase of ten percent in telephone mainlines is estimated to increase FDI by
about 4.9 percent.
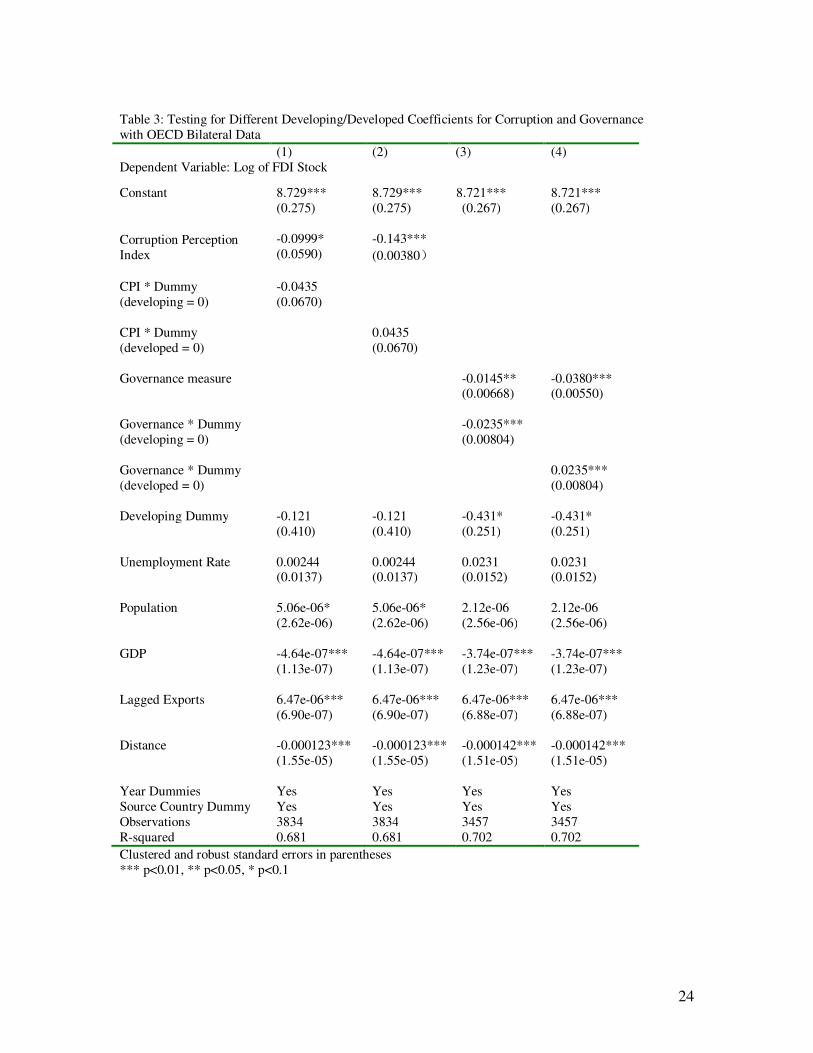
For our other policy variables, we report our results concerning differences
between developed and developing countries in Table 3. We follow our previous
presentation method: we define our dummy variable to be zero for developing countries
in the first column of the pair and zero for developed countries in the second column of
the pair. Thus, the coefficient for the relevant policy variable (with the correct standard
error) is that of developing countries in the first column and developed countries in the
second column of the pair.
Beginning with the corruption variable, we can see from columns 1 and 2 that the
corruption index is negative and significant for both developing and developed countries,
with slightly different coefficients. In order to interpret the coefficients for corruption, it
is useful to calculate elasticities for developed and developing countries. To do this, we
multiply the coefficient and the mean of corruption for the group (developed or
developing as the case may be). The result is that a point estimate of the elasticity of
FDI with respect to corruption is 0.33 for developed countries and 0.65 for developing
13 We should note that the significance of the infrastructure quality index is due mainly to significance for developed countries.
17
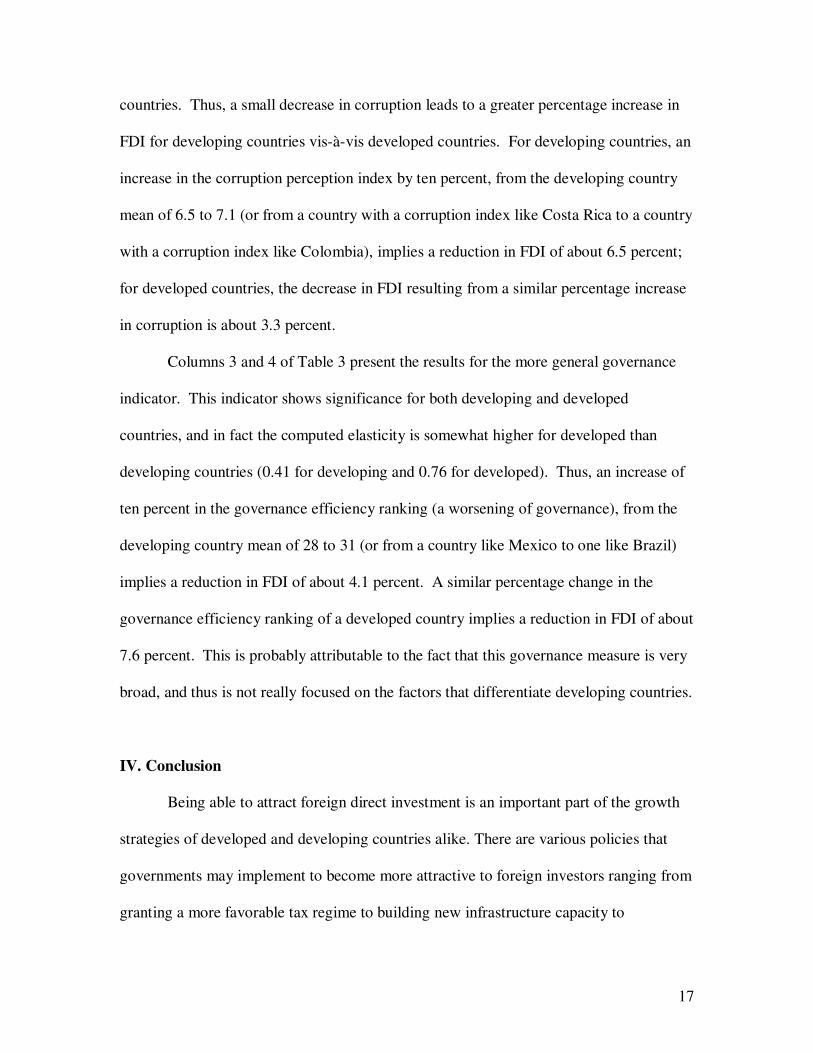
countries. Thus, a small decrease in corruption leads to a greater percentage increase in
FDI for developing countries vis-à-vis developed countries. For developing countries, an
increase in the corruption perception index by ten percent, from the developing country
mean of 6.5 to 7.1 (or from a country with a corruption index like Costa Rica to a country
with a corruption index like Colombia), implies a reduction in FDI of about 6.5 percent;
for developed countries, the decrease in FDI resulting from a similar percentage increase
in corruption is about 3.3 percent.
Columns 3 and 4 of Table 3 present the results for the more general governance
indicator. This indicator shows significance for both developing and developed
countries, and in fact the computed elasticity is somewhat higher for developed than
developing countries (0.41 for developing and 0.76 for developed). Thus, an increase of
ten percent in the governance efficiency ranking (a worsening of governance), from the
developing country mean of 28 to 31 (or from a country like Mexico to one like Brazil)
implies a reduction in FDI of about 4.1 percent. A similar percentage change in the
governance efficiency ranking of a developed country implies a reduction in FDI of about
7.6 percent. This is probably attributable to the fact that this governance measure is very
broad, and thus is not really focused on the factors that differentiate developing countries.
IV. Conclusion
Being able to attract foreign direct investment is an important part of the growth
strategies of developed and developing countries alike. There are various policies that
governments may implement to become more attractive to foreign investors ranging from
granting a more favorable tax regime to building new infrastructure capacity to
18
improving governance institutions. A fundamental motivation for this paper is that
country government officials everywhere would like to know the answer to this basic
question: what are the most effective policy measures I can take to attract foreign
investment to my country? The answer to this question may not be the same for
developing and developed countries. The literature to date has not directly addressed this
question and has not always considered that the answers can be different for developing
and developed countries.
In this paper we examine the impact of a country’s public policies in the areas of
taxation, infrastructure, and good governance on the stock of its FDI. In the analysis we
allow for differences in the response of FDI between developing and developed
countries, something other papers in the area do not do. Our findings indicate first that
the stock of FDI is sensitive to host country taxation in developed countries, but not in
developing countries. This is an important and provocative result that contradicts recent
surveys of the literature cited in the introduction, and it could be due to weak tax
administration in developing countries. It is similar to a result in Dharmapala and Hines
(2009) who find that taxes affect US FDI in well governed but not badly governed
countries. While beyond the scope of our current study, this is an issue well worth
investigating further in future studies. Second, both our governance measures (the
corruption index and the broader efficient governance ranking) indicate that FDI is
sensitive to the host country measure in both developing and developed countries. A
change in the corruption index is found to have a larger impact in developing countries
while a change in the broader governance index is found to have a somewhat larger
impact in developed countries. Third, the infrastructure ranking and mainland telephone
19
lines measures indicate that FDI is sensitive to the host country measure in both
developing and developed countries.
Thus, an important implication of our findings is that in order to be more effective
in attracting FDI, government officials in developing countries should pay more attention
to policy programs aimed at improving governance institutions and public infrastructure
and, at the same time, de-emphasize imitating the taxation policies of developed countries
regarding FDI. These countries would do better to address the more fundamental
institutional governance and infrastructure issues. Developed countries on the other hand
should pay more attention to taxation issues and also provide good infrastructure and
maintain good governance to attract FDI.
20
Chart 1 Tax Rates and FDI Stocks, 1996
0
1000020000
3000040000
50000
60000
7000080000
90000100000
Average FDI
Stocks for
Low Tax Rate
Developed
Countries
Average FDI
Stocks for
High Tax Rate
Developed
Countries
Average FDI
Stocks for
Low Tax Rate
Developing
Countries
Average FDI
Stocks for
High Tax Rate
Developing
Countries
$100 Million
Chart 2 Corruption Index and FDI Stocks, 1996
0
10000
20000
30000
40000
50000
60000
70000
80000
90000
100000
Average FDI
Stocks for Low
Corruption
Developed
Countries
Average FDI
Stocks for High
Corruption
Developed
Countries
Average FDI
Stocks for Low
Corruption
Developing
Countries
Average FDI
Stocks for High
Corruption
Developing
Countries
$1
00 M
illi
on
21
Chart 3 Infrastructure Ranking and FDI Stocks, 1996
Clustered and robust standard errors in parentheses *** p<0.01, ** p<0.05, * p<0.1
25
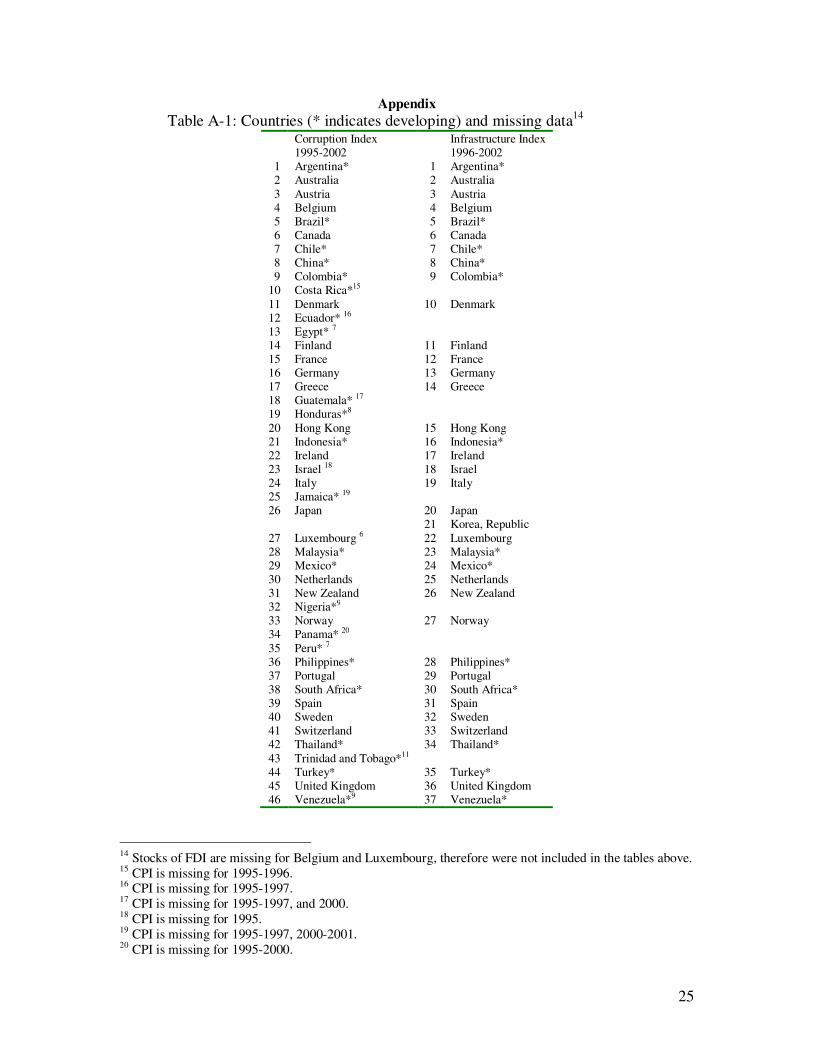
Appendix
Table A-1: Countries (* indicates developing) and missing data14 Corruption Index Infrastructure Index 1995-2002 1996-2002
1 Argentina* 1 Argentina* 2 Australia 2 Australia 3 Austria 3 Austria 4 Belgium 4 Belgium 5 Brazil* 5 Brazil* 6 Canada 6 Canada 7 Chile* 7 Chile* 8 China* 8 China* 9 Colombia* 9 Colombia*
10 Costa Rica*15 11 Denmark 10 Denmark 12 Ecuador* 16 13 Egypt* 7 14 Finland 11 Finland 15 France 12 France 16 Germany 13 Germany 17 Greece 14 Greece 18 Guatemala* 17 19 Honduras*8 20 Hong Kong 15 Hong Kong 21 Indonesia* 16 Indonesia* 22 Ireland 17 Ireland 23 Israel 18 18 Israel 24 Italy 19 Italy 25 Jamaica* 19 26 Japan 20 Japan
21 Korea, Republic 27 Luxembourg 6 22 Luxembourg 28 Malaysia* 23 Malaysia* 29 Mexico* 24 Mexico* 30 Netherlands 25 Netherlands 31 New Zealand 26 New Zealand 32 Nigeria*9 33 Norway 27 Norway 34 Panama* 20 35 Peru* 7 36 Philippines* 28 Philippines* 37 Portugal 29 Portugal 38 South Africa* 30 South Africa* 39 Spain 31 Spain 40 Sweden 32 Sweden 41 Switzerland 33 Switzerland 42 Thailand* 34 Thailand* 43 Trinidad and Tobago*11 44 Turkey* 35 Turkey* 45 United Kingdom 36 United Kingdom 46 Venezuela*9 37 Venezuela*
14 Stocks of FDI are missing for Belgium and Luxembourg, therefore were not included in the tables above. 15 CPI is missing for 1995-1996. 16 CPI is missing for 1995-1997. 17 CPI is missing for 1995-1997, and 2000. 18 CPI is missing for 1995. 19 CPI is missing for 1995-1997, 2000-2001. 20 CPI is missing for 1995-2000.
26
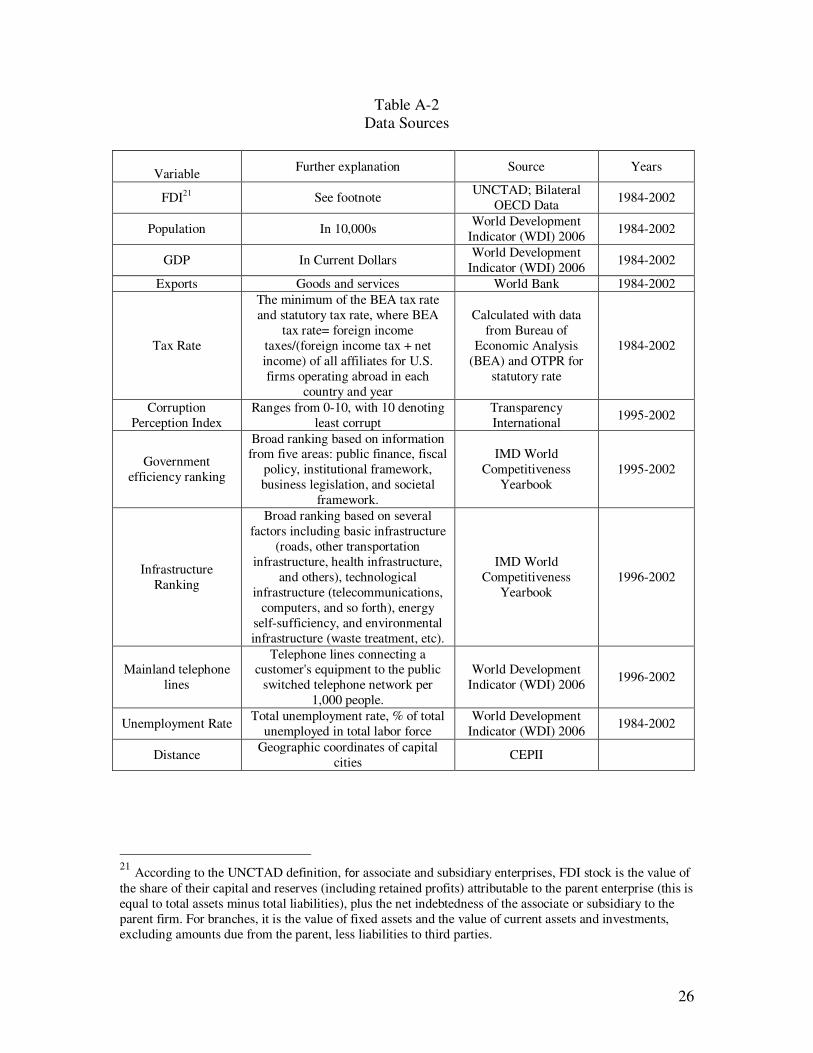
Table A-2 Data Sources
Variable Further explanation Source Years
FDI21 See footnote UNCTAD; Bilateral
OECD Data 1984-2002
Population In 10,000s World Development
Indicator (WDI) 2006 1984-2002
GDP In Current Dollars World Development
Indicator (WDI) 2006 1984-2002
Exports Goods and services World Bank 1984-2002
Tax Rate
The minimum of the BEA tax rate and statutory tax rate, where BEA
tax rate= foreign income taxes/(foreign income tax + net income) of all affiliates for U.S. firms operating abroad in each
country and year
Calculated with data from Bureau of
Economic Analysis (BEA) and OTPR for
statutory rate
1984-2002
Corruption Perception Index
Ranges from 0-10, with 10 denoting least corrupt
Transparency International
1995-2002
Government efficiency ranking
Broad ranking based on information from five areas: public finance, fiscal
policy, institutional framework, business legislation, and societal
framework.
IMD World Competitiveness
Yearbook 1995-2002
Infrastructure Ranking
Broad ranking based on several factors including basic infrastructure
(roads, other transportation infrastructure, health infrastructure,
and others), technological infrastructure (telecommunications,
computers, and so forth), energy self-sufficiency, and environmental infrastructure (waste treatment, etc).
IMD World Competitiveness
Yearbook 1996-2002
Mainland telephone lines
Telephone lines connecting a customer's equipment to the public
switched telephone network per 1,000 people.
World Development Indicator (WDI) 2006
1996-2002
Unemployment Rate Total unemployment rate, % of total
unemployed in total labor force World Development
Indicator (WDI) 2006 1984-2002
Distance Geographic coordinates of capital
cities CEPII
21 According to the UNCTAD definition, for associate and subsidiary enterprises, FDI stock is the value of the share of their capital and reserves (including retained profits) attributable to the parent enterprise (this is equal to total assets minus total liabilities), plus the net indebtedness of the associate or subsidiary to the parent firm. For branches, it is the value of fixed assets and the value of current assets and investments, excluding amounts due from the parent, less liabilities to third parties.
27
References
Altshuler, Rosanne, Harry Grubert, and T. Scott Newlon, 2001, "Has U.S. Investment Become More Sensitive to Tax Rates?" in: James R. Hines, Jr. (editor), International Taxation and Multinational Activity, University of Chicago Press, 9-32.
Asiedu, Elizabeth. 2002. “On the Determinants of Foreign Direct Investment in Developing Countries: Is Africa Different?” World Development 30:1, pp. 107-119.
Auerbach, Alan J. and Kevin Hassett. (1993) “Taxation and Foreign Direct Investment in the United States: A Reconsideration of the Evidence,” in Alberto Giovannini, R. Glenn Hubbard, and Joel Slemrod (eds.) Studies in International Taxation. Chicago: University of Chicago Press, 119-44.
Bénassy-Quéré, Agnes, Nicolas Gobalraja, and Alain Trannoy. 2007. “Tax and Public Input Competition.” Economic Policy. April 2007 pp. 385–430.
Blonigen, Bruce and Miao Wang. 2004. “Inappropriate pooling of wealthy and poor countries in empirical FDI studies.” NBER Working paper 10378.
Boskin, Michael J. and William G. Gale. 1987. "New Results on the Effects of Tax Policy on the International Location of Investment." In The effects of taxation on capital accumulation, 1987, pp. 201-19, A National Bureau of Economic Research Project Report Chicago and London: University of Chicago Press.
Buettner,T. 2002. “The Impact of Taxes and Public Spending on the Location of FDI: Evidence from FDI-flows within Europe.” ZEW Discussion Paper No. 02-17, Mannheim.
Cheng, Leonard and Yum Kwan. 2000. “What are the determinants of the location of foreign direct investment? The Chinese experience.” Journal of International Economics. 51: 379-400.
Cummins, Jason G. and R. Glenn Hubbard. 1995. "The Tax Sensitivity of Foreign Direct Investment: Evidence from Firm-Level Panel Data." In Martin Feldstein, James R. Hines Jr., and R. Glenn Hubbard eds. The Effect of Taxation on Multinational Corporations. Chicago: University of Chicago Press.
Dharmapala, Dhammika and James Hines. 2009. “Which Countries Become Tax Havens?” Journal of Public Economics, Volume 93, Issues 9-10, Pages 1058-1068.
Dollar, David, Mary Hallward-Driemeier, and Taye Mengistae. 2004. "Investment Climate and International Integration." Development Economics, World Bank. The World Bank, Policy Research Working Paper Series: 3323. http://unpan1.un.org/intradoc/groups/public/documents/APCITY/UNPAN019818.pdf
Fatica, Serena. 2009. “Taxation and the quality of institutions: Asymmetric effects on
28
FDI.” EU Taxation Paper Number 21.
Gordon, Roger and James R. Hines, Jr. 2002. "International taxation," Handbook of Public Economics, in: A. J. Auerbach & M. Feldstein (ed.), Handbook of Public Economics, edition 1, volume 4, chapter 28, pages 1935-1995 Elsevier.
Grubert, Harry and John Mutti. 1991. "Taxes, Tariffs, and Transfer Pricing in Multinational Corporate Decision Making." Review of Economics and Statistics, 73, 285-293.
Hajkova, Dana, G. Nicoletti, L. Vartia, and K. Yoo. 2006. “Taxation, Business Environment, and FDI Location in OECD Countries.” OECD Economics Department Working Paper No. 502.
Hartman, David G. 1984. "Tax Policy and Foreign Direct Investment in the United States." National Tax Journal, 37, 475-87. Hines, James R., Jr. 1996. “Altered States: Taxes and the Location of Foreign Direct Investment In America.” American Economic Review 86: 1076-1094.
Hines, James R., Jr. and Eric M. Rice. 1994. "Fiscal Paradise: Foreign Tax Havens and American Business." Quarterly Journal of Economics, February 1994, pp. 149-82.
Kaufmann, Daniel, Aart Kraay, and Massimo Mastruzzi, 2009. “Governance Matters VIII: Aggregate and Individual Governance Indicators 1996–2008.” World Bank Policy Research Working Paper #4978.
Kumar, Nagesh. 2001. "Infrastructure Availability, Foreign Direct Investment Inflows and Their Export-orientation: A Cross-Country Exploration." Research and Information System for Developing Countries, New Delhi, November 2001
Lipsey, Robert. 2002. “Home and Host Country Effects of FDI.” NBER Working Paper #9293.
Loree, David W. and Stephen E. Guisinger. 1995. "Policy and non-policy determinants of U.S. equity foreign direct investments." Journal of International Business Studies. 26:2, pp. 281-299.
Madies, Thierry and Jean-Jacques Dethier, 2010. “Fiscal Competition in Developing Countries: A Survey of the Theoretical and Empirical Literature.” World Bank Policy Research Working paper 5311.
Mutti, Jack and Harry Grubert, 2004. “Empirical asymmetries in foreign direct investment and taxation.” Journal of International Economics 62 (2004) 337– 358.
Oates, Wallace. 1999. “An Essay on Fiscal Federalism.” 1999. Journal of Economic
Literature, Vol. 37, No. 3., pp. 1120-1149.
29
Ondrich, Jan, and Michael Wasilenko. 1993. "Foreign Direct Investment in the United States: Issues, Magnitudes, and Location Choice of New Manufacturing Plants." Kalamazoo, Mich.: W. E. Upjohn Institute for Employment Research, pp. ix, 159. Swenson, Deborah. 1994. “The Impact of US Tax Reform on Foreign Direct Investment in the United States.” Journal of Public Economics. 54 (2), 243–266. Tiebout, Charles. 1956. “A pure theory of local expenditures.” Journal of Political
Economy. 64: 416-424. Wei, Shang-Jin. 2000a. "How Taxing is Corruption on International Investors?" Review
of Economics and Statistics. 82 (1): 1-11. Wei, Shang-Jin. 2000b. "Local Corruption and Global Capital Flows." Brookings Paper
on Economic Activity. 2: 303-354. Wheeler, David and Ashoka Mody. 1992. “International Investment Location Decisions: The Case of U.S. Firms.” Journal of International Economics. 33: 57-76. Young, Kan H. 1988. "The Effects of Taxes and Rates of Return on Foreign Direct Investment in the United States." National Tax Journal, March 1988, v. 41, iss. 1, pp. 109-21.