• • • - Public Service Electric and Gas Company P.O. Box 236 Hancocks Bridge, New Jersey 08038-0236 Nuclear Business Unit APR 1 3 1998 LR-N98176 United States Nuclear Regulatory Commission Document Control Desk Washington, DC 20555 GUARANTEED RETROSPECTIVE PREMIUMS FOLLOWING A NUCLEAR ACCIDENT SALEM AND HOPE CREEK GENERATING STATIONS DOCKET NOS. 50-272, 50-311 & 50-354 FACILITY OPERATING LICENSE NOS. DPR-70, -75 AND NPF-57 Gentlemen: Pursuant to the 1975 Amendments to the Price-Anderson Act (Public Law 94-197), the owners of Salem Generating Station, Unit Nos. 1 and 2, and the Hope Creek Generating Station submit the following statements and supporting documents to satisfy guarantee requirements as provided under 10CFR140.2l(e): 1. 1997 Stockholders' Annual Report of each owner. 2. Individual certified Internal Cash Flow Statements showing 1997 Actual and 1998 Projected with Explanation of Significant Variations. Should you have any questions regarding this request, we will be pleased to discuss them with you. Enclosures (8) 9804170226 -98o4i3 PDR ADOCK 05000272 I PDR The power is in your hands. Sincerely, David R. Powell Director - Licensing/Regulation & Fuels I 95-2168 REV. 6/94
Transcript
•
•
•
~ -OPS~G Public Service Electric and Gas Company P.O. Box 236 Hancocks Bridge, New Jersey 08038-0236
Nuclear Business Unit
APR 1 3 1998 LR-N98176
United States Nuclear Regulatory Commission Document Control Desk Washington, DC 20555
GUARANTEED RETROSPECTIVE PREMIUMS FOLLOWING A NUCLEAR ACCIDENT SALEM AND HOPE CREEK GENERATING STATIONS DOCKET NOS. 50-272, 50-311 & 50-354 FACILITY OPERATING LICENSE NOS. DPR-70, -75 AND NPF-57
Gentlemen:
Pursuant to the 1975 Amendments to the Price-Anderson Act (Public Law 94-197), the owners of Salem Generating Station, Unit Nos. 1 and 2, and the Hope Creek Generating Station submit the following statements and supporting documents to satisfy guarantee requirements as provided under 10CFR140.2l(e):
1. 1997 Stockholders' Annual Report of each owner.
2. Individual certified Internal Cash Flow Statements showing 1997 Actual and 1998 Projected with Explanation of Significant Variations.
Should you have any questions regarding this request, we will be pleased to discuss them with you.
Enclosures (8)
9804170226 -98o4i3 PDR ADOCK 05000272 I PDR
The power is in your hands.
Sincerely,
David R. Powell Director -Licensing/Regulation & Fuels
I
95-2168 REV. 6/94
•
•
•
Document Control Desk LR-N98176
-2-
C All w/o 1997 Stockholders' Annual Reports
Mr. H. Miller, Administrator - Region I U. S. Nuclear Regulatory Commission 475 Allendale Road King of Prussia, PA 19406
Mr. R. Ennis
APR 131998
Licensing Project Manager - Hope Creek (Acting) U. S. Nuclear Regulatory Commission One White Flint North Mail Stop 14E21 11555 Rockville Pike Rockville, MD 20852
Mr. P. Milano Licensing Project Manager - Salem U. S. Nuclear Regulatory Commission One White Flint North Mail Stop 14E21 11555 Rockville Pike Rockville, MD 20852
USNRC Resident Inspector Office (X24)
Mr. K. Tosch, Manager IV Bureau of Nuclear Engineering P. 0. Box 415 Trenton, NJ 08625
Mr. Robert Wood U. S. Nuclear Regulatory Commission One White Flint North 11555 Rockville Pike Mail Stop 12E4 Rockville, MD 20852
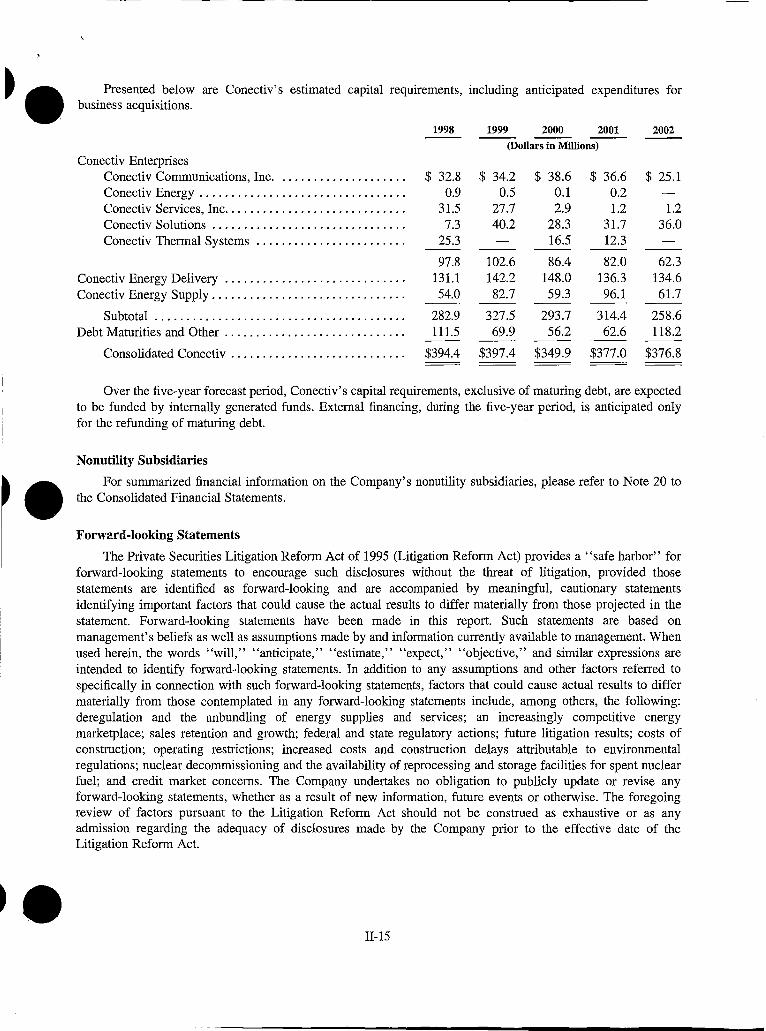
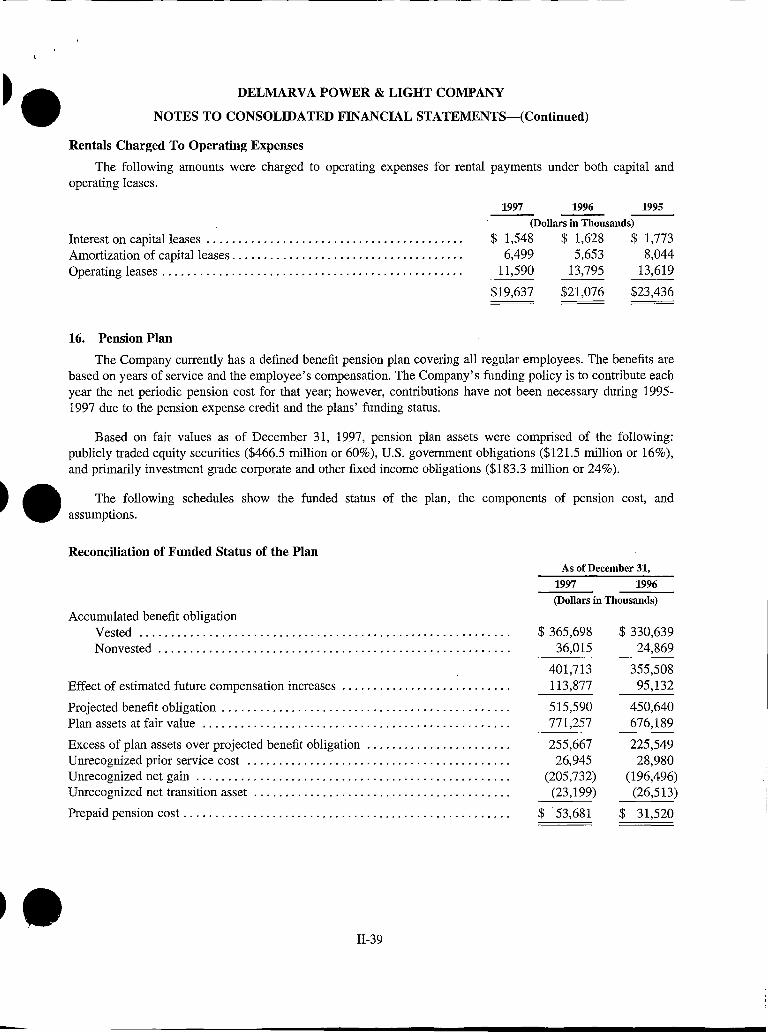
• Net Income
Less: Dividends Paid
Retained in Business
Adjustments:
Depreciation and Amortization
Amortization of Nuclear Fuel
Deferred Income Taxes and Investment Tax Credits
Statement of Financial Accounting Standards No. 90 - Regulated Enterprises - Accounting for Abandonments and Disallowance of Plant Costs (SFAS 90)
Allowance for Funds Used During Construction
Total Adjustments
Internal Cash Flow
Average Quarterly Cash Flow
$
PUBLIC SERVICE ELE.ND GAS COMPANY (Salem a Creek)
Projected Internal Flow Statement
For Year 1998 Compared to 1997 Actual (Millions of Dollars)
1997
Actual
528 $
535
(7)
616
60
19
(3)
(15)
677
1998
Projected
502
511
(9)
616
103
(32)
(2)
(18)
667
Explanation of Significant Variations
Primarily higher O&M expense due to SFAS 106, other Postretirement Benefits, and increased information technology expenses for Year 2000 readiness.
Lower funding requirements of parent and redemption of certain series of PSE&G preferred stock in 1997.
Due to restart of Salem 2 in August 1997 and anticipated restart of Salem 1 early in 1998.
Primarily deferred taxes associated with depreciation differences for Federal and State purposes. PSE&G became subject to the New Jersey Corporate Business Tax effective January 1, 1998 as a result of energy tax reform legislation.
Higher construction expenditures in 1998.
$==6=70= $ ==6=58=
$===1=68= $ ==1=65=
As indicated by this statement, the Average Quarterly Cash Flow covers the maximum contingent liability, which amounts to $18.0 million annually, of Public Service Electric and Gas Company as defined under the Price Anderson Act. The presentation of this statement is consistent with that of prior years' filings.
PUBLIC SERVICE ELECTRIC AND GAS COMPANY
""' (iJ;;;;. O!ilM-Patricia A. Rado
Vice President and Controller
DATE +·p 1, I 9)1
•
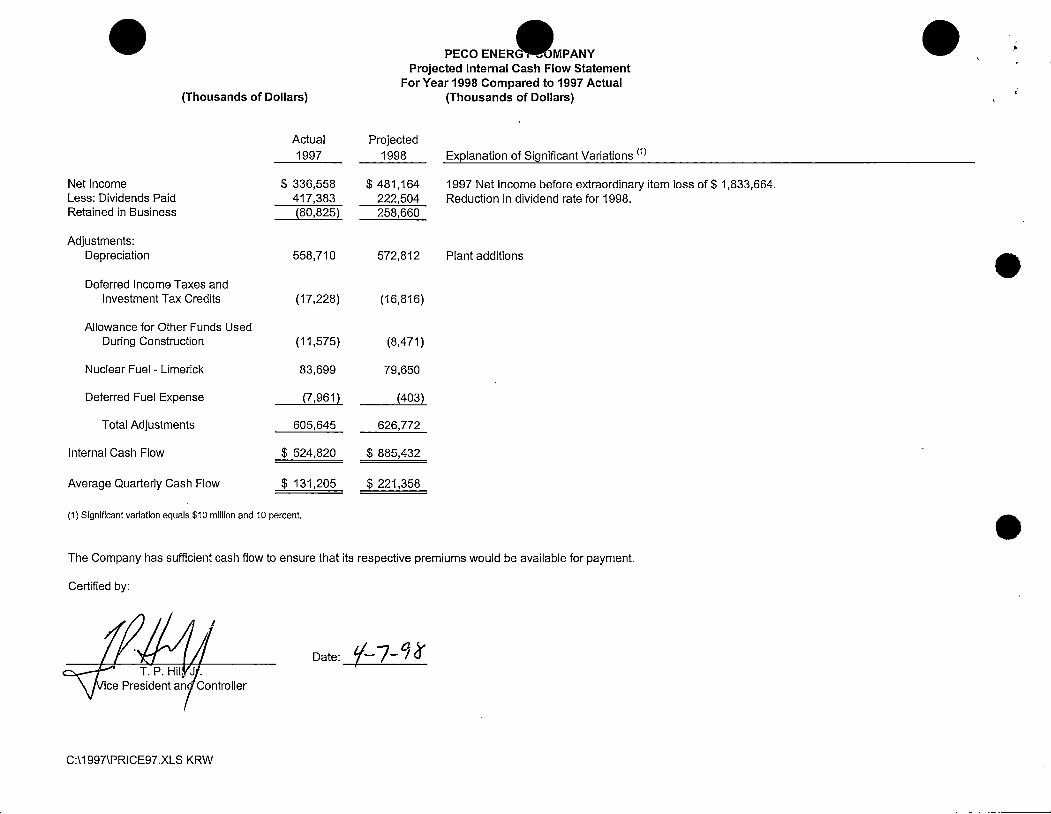
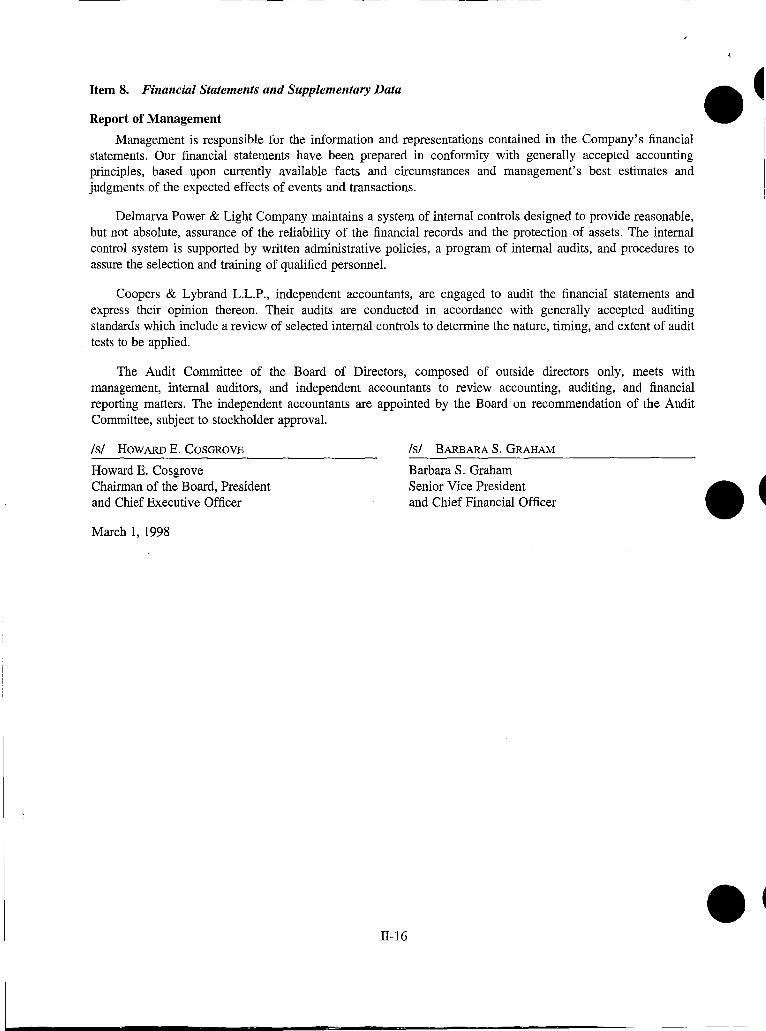
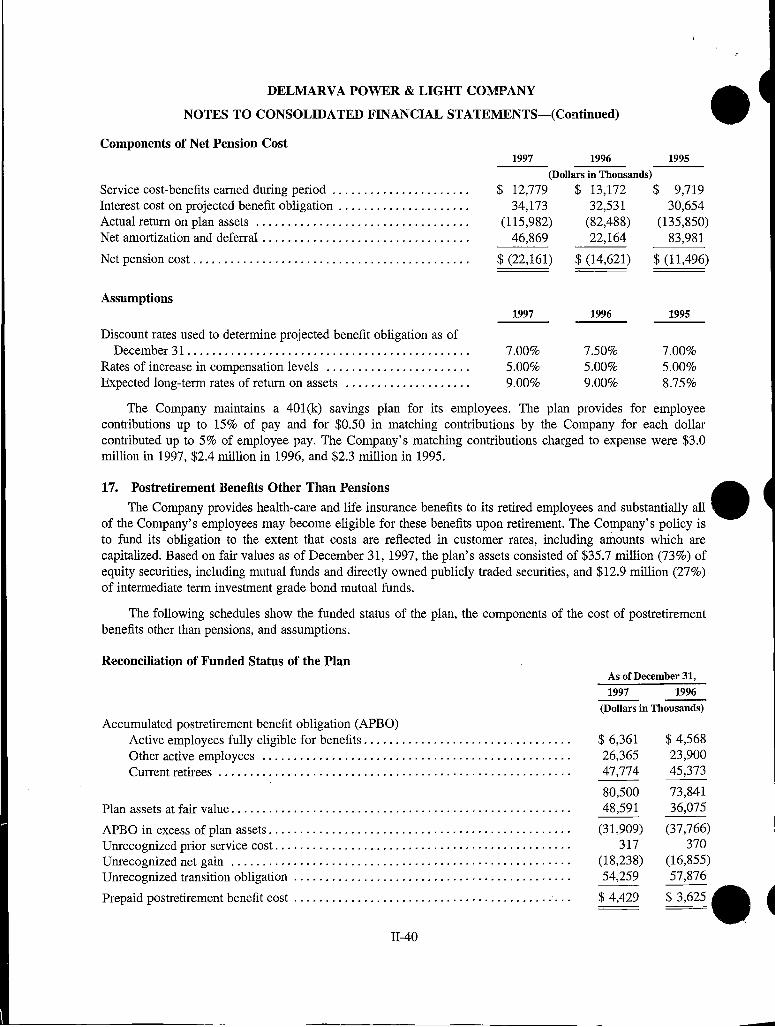
• (Thousands of Dollars)
Net Income Less: Dividends Paid Retained in Business
Adjustments: Depreciation
Deferred Income Taxes and Investment Tax Credits
Allowance for Other Funds Used During Construction
Nuclear Fuel - Limerick
Deferred Fuel Expense
Total Adjustments
Internal Cash Flow
Average Quarterly Cash Flow
Actual 1997
$ 336,558 417,383 (80,825}
558,710
(17,228)
(11,575)
83,699
(7,961}
605,645
$ 524,820
$ 131,205
(1) Significant variation equals $1 O million and 1 O percent.
For Year 1998 Compared to 1997 Actual (Thousands of Dollars)
Projected 1998
$ 481,164 222,504 258,660
572,812
(16,816)
(8,471)
79,650
(403)
626,772
$ 885,432
$ 221,358
Explanation of Significant Variations <1l
1997 Net Income before extraordinary item loss of$ 1,833,664. Reduction in dividend rate for 1998.
Plant additions
The Company has sufficient cash flow to ensure that its respective premiums would be available for payment.
Certified by:
Date: t/-7-q 2f
C:\1997\PRICE97.XLS KRW
•
e
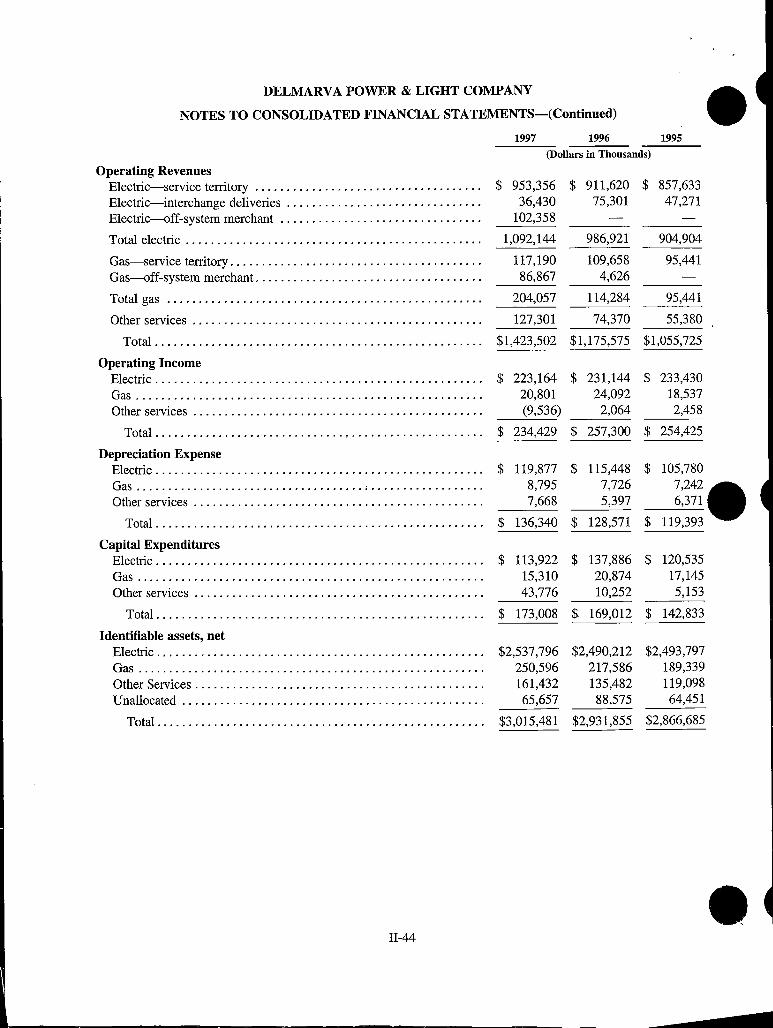
• Net Income Less Dividends
Retained in Business
Major Adjustments: Depreciation and Amortization Levelized Energy Clause - Net Deferred Income Taxes and Investment Tax Credits Unrecovered Purchased Power Costs Allowance for Funds Used During Construction Unrecovered State Excise Tax Other
Total Adjustments
Average Quarterly Cash Flow
Nuclear Generating Station Percentage Ownership Salem Unit #1 Salem Unit #2 Hope Creek #1
Maximum Contingent Liability (SEVERALLY AND NOT JOINTLY)
ATLANTIC CITY ELECTRIC CO. PROJECTED INTERNAL CASH FLOWS STATEMENT
FOR YEAR 1998 - COMPARED TO 1997 ACTUAL (Thousands of Dollars)
Actual 1997 Projected 1998
$
$
85,747 85,677
70
83,276 6,105
796 17,136 (1,818) 9,560
(28,884) 86,171
21,560
7.41% 7.41% 5.00%
$1,982
$
$
$
87,964 85,062 2,902
89,340 23,811
(15,875) 19,422
(209) 9,560
14,969 141,018
143,920
35,980
• Explanation of Significant Variations
Projected reflects increases in depreciation of Distribution and General Plant Assets. Projected reflects increased rates to recover deferred costs. Projected primarily reflects the recovery of deferred LEC costs noted above.
Primarily reflects changes in working capital components.
As indicated by this statement, the Average Quarterly Cash Flow fully covers the maxi City Electric Company which amounts to $1,982,000 as shown above.
•
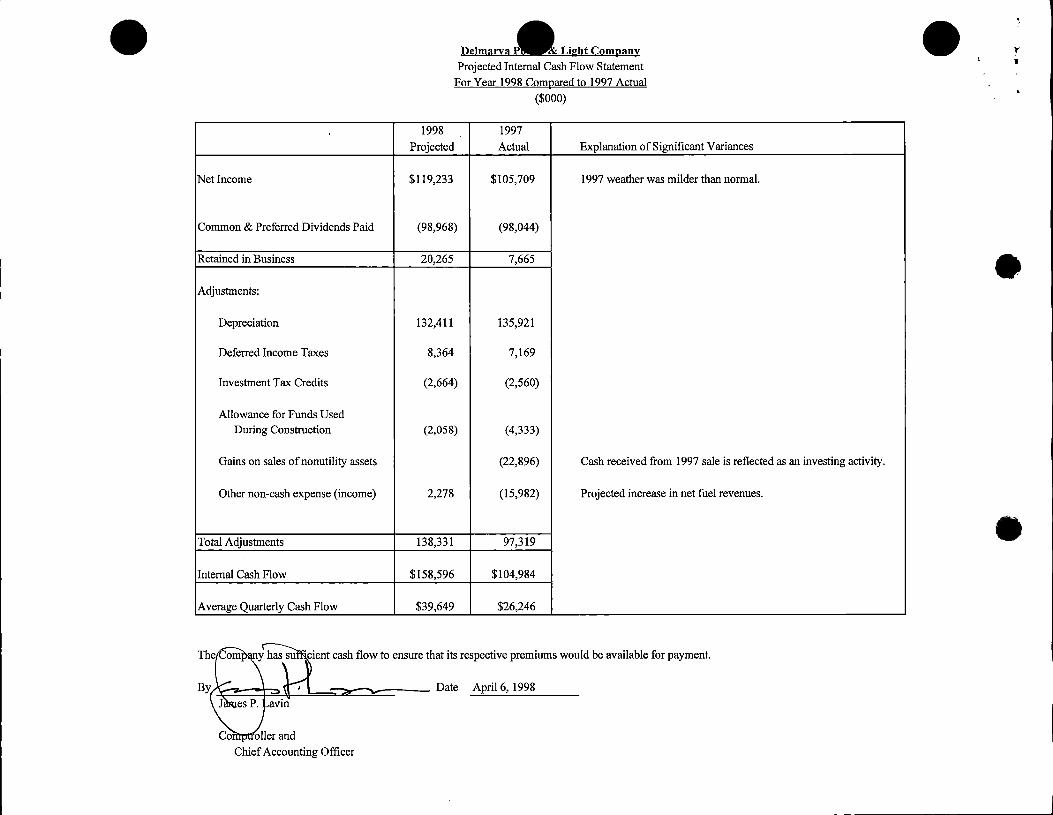
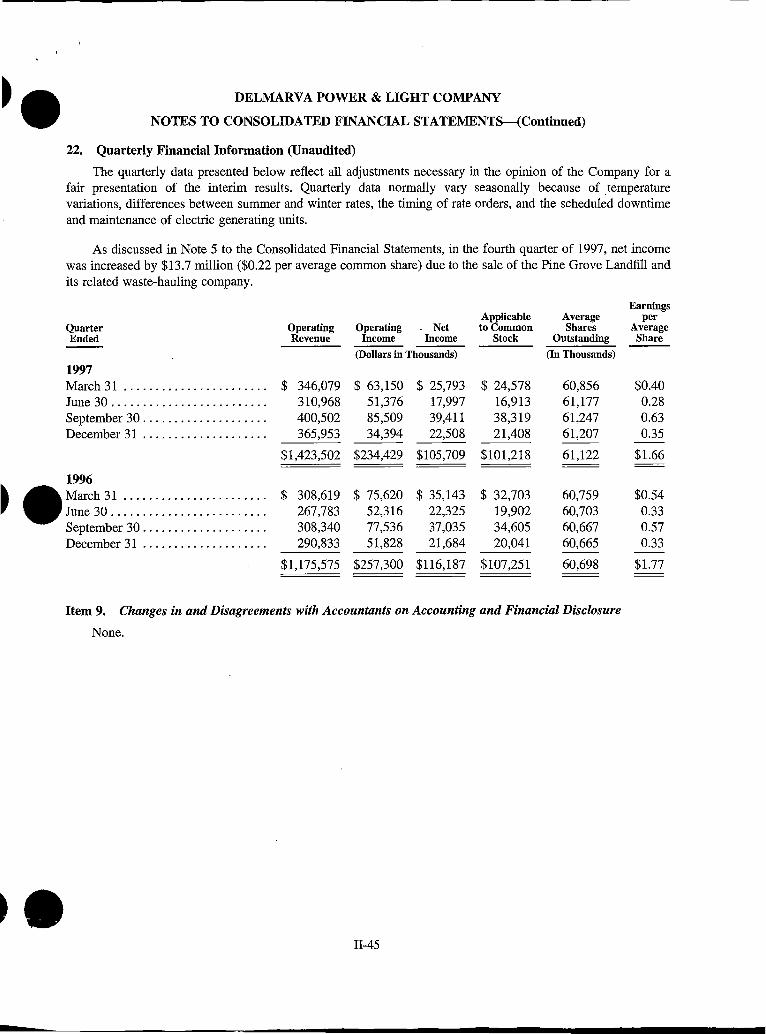
• Net Income
Common & Preferred Dividends Paid
Retained in Business
Adjustments:
Depreciation
Deferred Income Taxes
Investment Tax Credits
Allowance for Funds Used During Construction
Gains on sales ofnonutility assets
Other non-cash expense (income)
Total Adjustments
Internal Cash Flow
Average Quarterly Cash Flow
Delmarva P. Light Company Projected Internal Cash Flow Statement
For Year 1998 Compared to 1997 Actual
($000)
1998 1997
Projected Actual Explanation of Significant Variances
$119,233 $105,709 1997 weather was milder than normal.
(98,968) (98,044)
20,265 7,665
132,411 135,921
8,364 7,169
(2,664) (2,560)
(2,058) (4,333)
(22,896) Cash received from 1997 sale is reflected as an investing activity.
2,278 (15,982) Projected increase in net fuel revenues.
138,331 97,319
$158,596 $104,984
$39,649 $26,246
cient cash flow to ensure that its respective premiums would be available for payment.
Chief Accounting Officer
• r •
.. •
' . •
•
•
•
"'
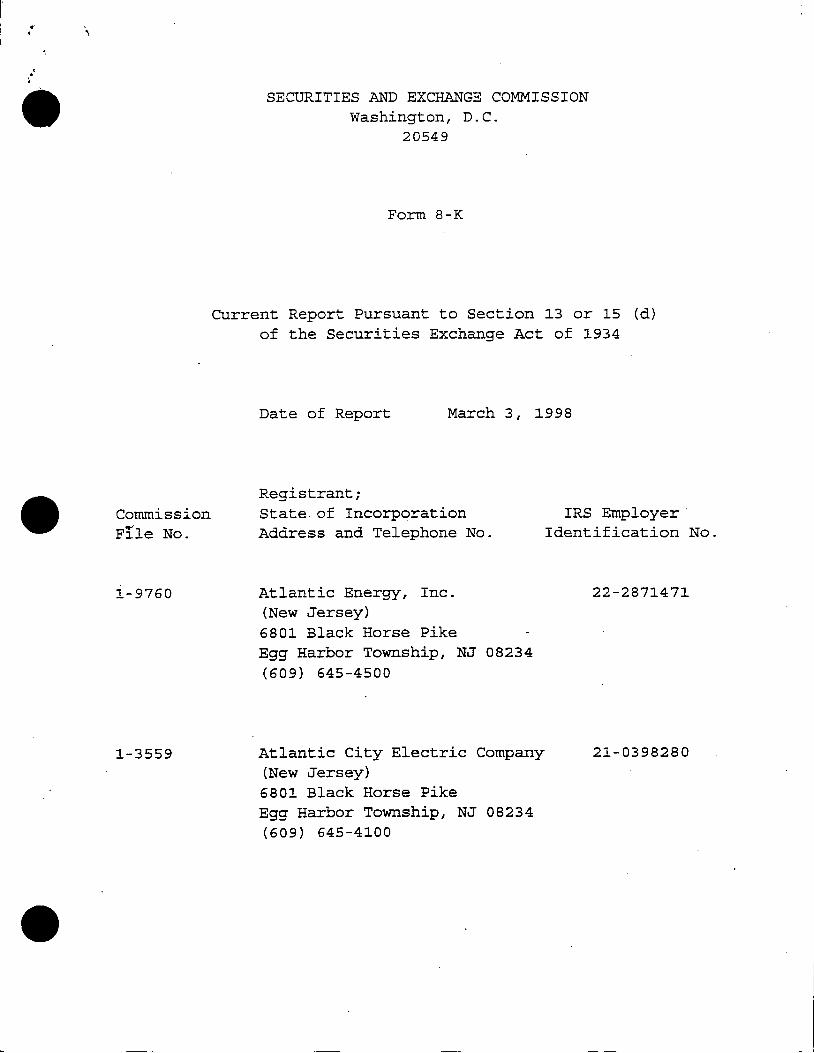
Commission Flle No.
1-9760
1-3559
SECURITIES AND EXCHANGE COMMISSION Washington, D.C.
20549
Form 8-K
Current Report Pursuant to Section 13 or 15 (d) of the Securities Exchange Act of 1934
Date of Report March 3, 1998
Registrant; State. of Incorporation Address and Telephone No.
Atlantic Energy, Inc. (New Jersey) 6801 Black Horse Pike Egg Harbor Township, NJ 08234 ( 609) 645-4500
Atlantic City Electric Company (New Jersey) 6801 Black Horse Pike Egg Harbor Township, NJ 08234 (609) 645-4100
IRS Employer Identification No.
22-2871471
21-0398280
ITEM 5 Other Events.
This report on Form 8-K includes the financial information listed below for:
Atlantic Energy, Inc.
Selected Financial Data (1997-1993) Management's Discussion and Analysis of Financial Condition and Results of Operations (for the three years ended December 31, 1997, 1996 and 1995) Report of Management Report of Audit Committee Independent Auditors' Report Consolidated Statements of Income for the three years ended
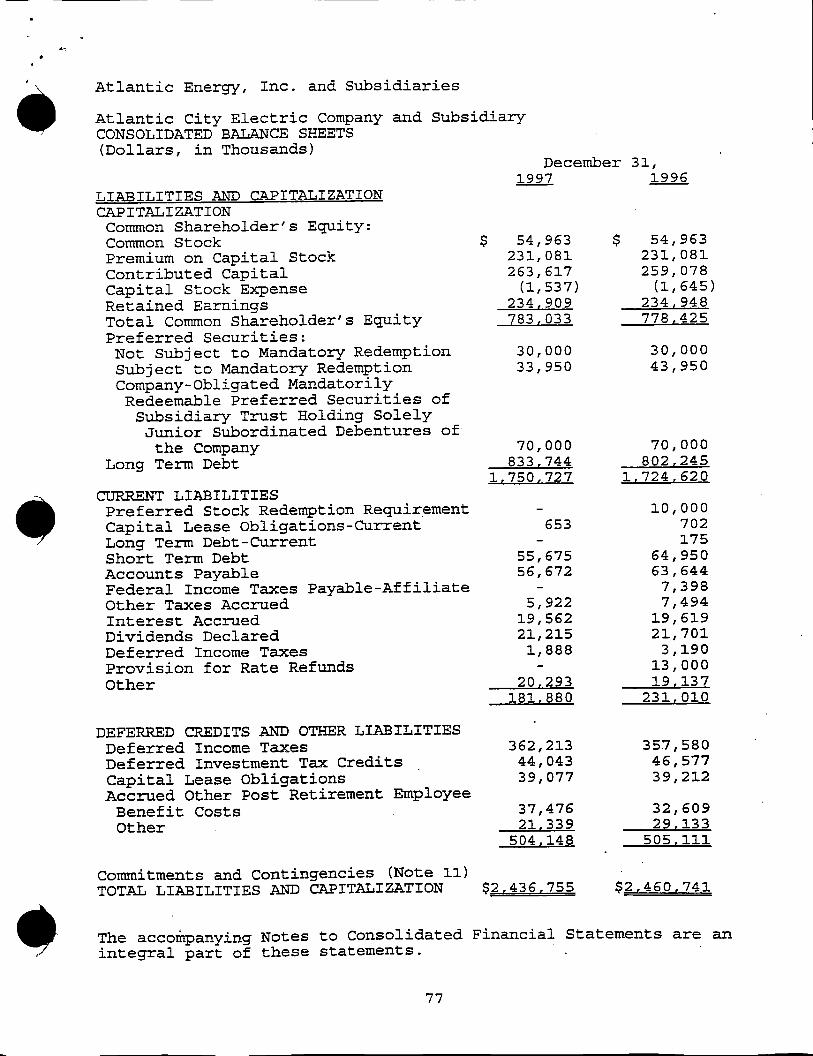
December 31, 1997, 1996 and 1995 Consolidated Balance Sheets as ·of December 31, 1997 and 1996 Consolidated Statements of Cash Flows for the three years ended
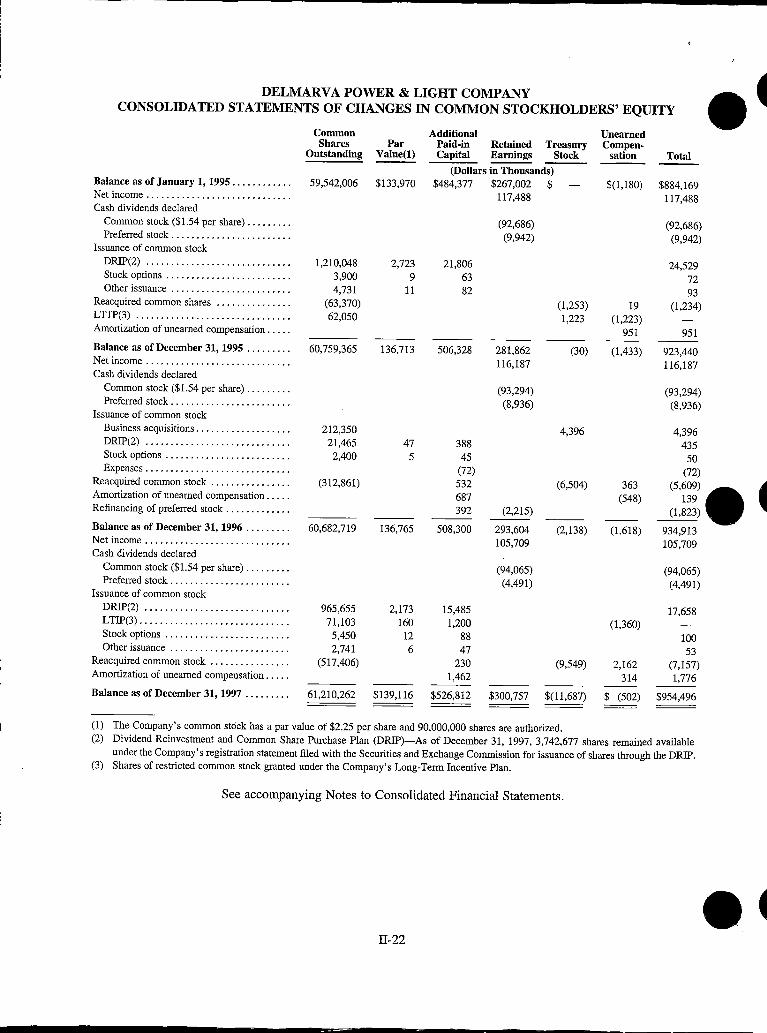
December 31, 1997, 1996 and 1995 Consolidated Statements of Changes in Common Stockholders' Equity
for the three years ended December 31, 1997, 1996 and 1995 Notes to Consolidated Financial Statements
Atlantic City Electric Company.
Independent Aud.ttors' Report. Consolidated Statements of Income for the three years ended
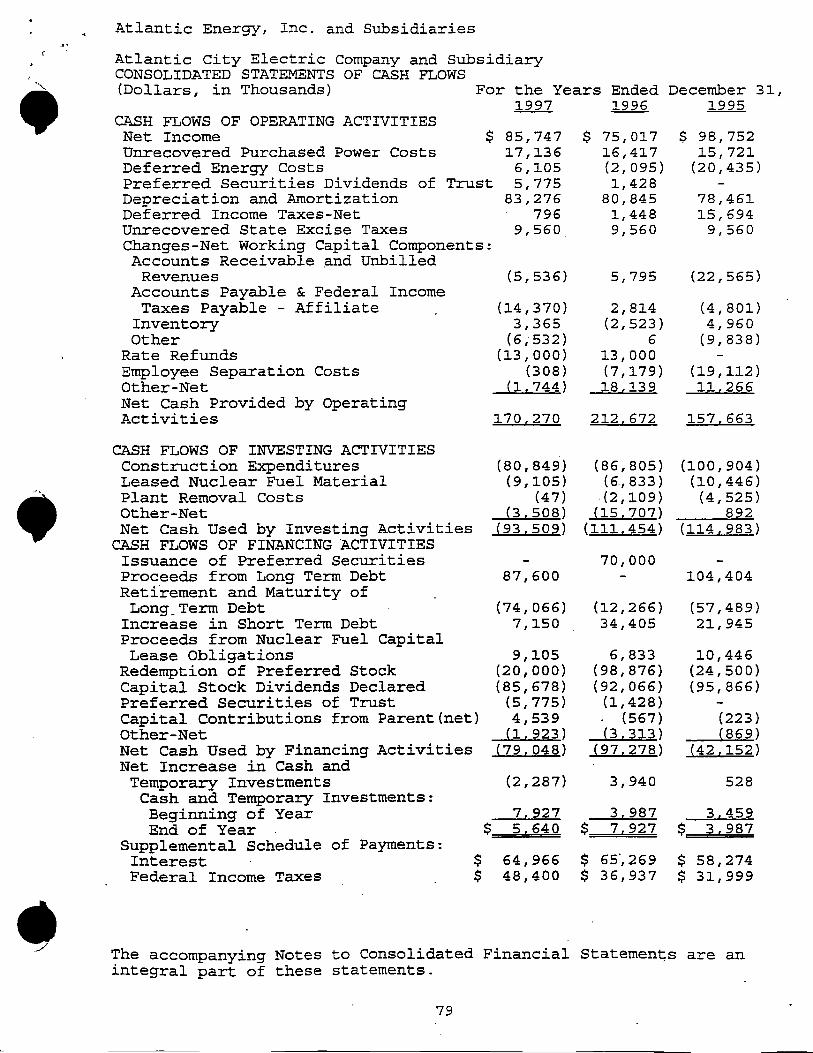
December 31, 1997, 1996 and 1995 Consolidated Balance Sheets as of December 31, 1997 and 1996 Consolidated Statements of Cash Flows for the three years ended
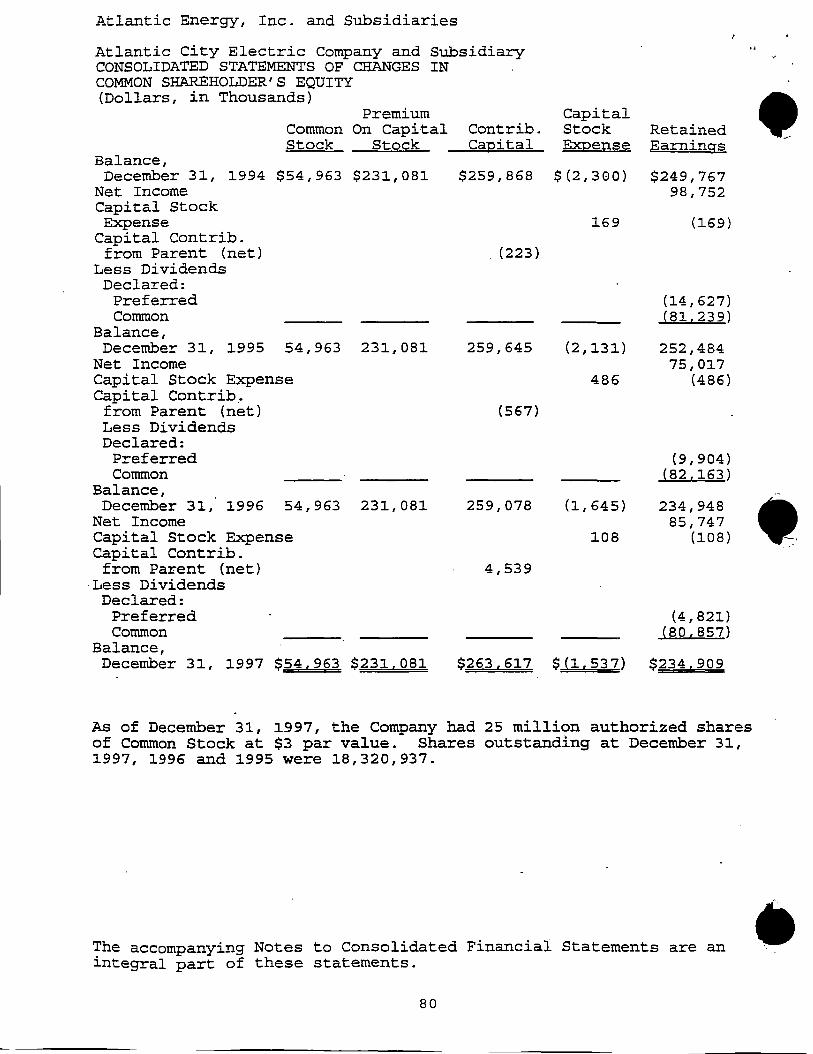
December 31, 1997, 1996 and 1995 Consolidated Statements of Changes in Common Stockholders' Equity
for the three years ended December 31, 1997, 1996 and 1995 Notes to Consolidated Financial Statements
i
•
•
•
'
ITEM 5 .
• ELECTED
Other Events
FINANCIAL DATA Selected financial data for the Company and ACE for each of the last five years is listed below.
Atlantic Energy, Inc.
(Thousands of Dollars)
Operating Revenue $1,102,360 $ 997,038* $ 958,054* Net Income $ 74,405 $ 58,767 $ 81,768 Basic and Diluted Earnings per Average Common Share $ 1.42 $ 1.12 $ 1.55 Total Assets(Year-end) $2,723,884 $2,670,762 $2,617,888 Long Term Debt and Redeemable Pref erred Securities(Year-erid) (b) $1,131,260 $1,051,945 $1,032,103
Amounts shown as total, rather than on a per-share basis, since ACE is a wholly-owned subsidiary of the Company. Includes current portion.
*Prior year amounts have been reclassified to conform to current year
reporting
1
1993
$ 865,799 $ 109,026
$ 91,621 $2,363,584
$ 937,101
$ 45,268
$ 81,347
Management's Discussion and Analysis of Financial Condition and Results of Operations
,
Atlantic Energy, Inc. (the Company, AEI or parent) merged with Delmarva Power & Light Company (DP&L) into a new company named Conectiv, Inc. (Conectiv) effective March 1, 1998. AEI is the parent of Atlantic City Electric Company (ACE), Atlantic Energy Enterprises, ·rnc. (AEE) and Atlantic Energy International, Inc. (AEII) which are wholly-owned subsidiaries. In October 1997, the Company and DP&L entered into an agreement to form Conectiv Solutions,LLC., a limited·liability corporation to market and sell offerings of energy, energy related services and other value-added services to large customers.
Financial Summary
Consolidated operating revenues for 1997, 1996 and 1995 were $1,102 million, $997 million and $958 million, respectively. The increase in 1997 revenues over 1996 is mostly due to increases in Wholesale Market Sales.and Other Services revenues. The increase in 1996 revenues over 1995.reflects an increase in kilowatt hour sales and in annual Levelized Energy Clause (LEC) revenues. These increases were offset in part by a $13.0 million revenue credit recorded as a result of stipulation agreements. Prior years consolidated operating revenues have been reclassified to conform to current year presentation. (See Operating Revenues under Results of Operations) .
~onsolidated basic and diluted earnings per share for 1997 were $1.42 on net income of $74.4 million compared to $1.12 on net income of $58.8 million in 1996 and $1.55 on net income of $81.8 million in 1995. The 1997 earnings primarily reflect reduced Operations and Maintenance expenses associated with the Salem outages which were offset by termi~ation of employee benefit plan costs in anticipation of the merger and losses from nonutility investments. The 1996 earnings reflect charges resulting from provisions for rate refunds, write-downs of nonutility property, losses from nonutility investments and ?igher operations and maintenance expenses associated with the continuing outage at the Salem Station.
2
l
•
•
•
'
•
•
The quarterly dividend paid on Common Stock was $.385 per share, or an annual rate of $1.54 per share. Information with respect to Common Stock is as follows:
1997 1996 1995
Dividends Paid Per Share .$ 1~54 $ 1.54 $ 1.54 Book Value Per Share $14.95 $15.00 $15.42 Annualized Dividend Yield 7.3% 9.0% 8.0% Return on Average Common Equity 9.5% 7.4% 9.9% Total Return (Dividends paid plus change in share price) 32.7% (3. 0) % 18.0%
Market to Book Value 142% 114% 125% Price/Earnings Ratio 15 15 12 Year End Closing Price-NYSE $21.19 $17.13 $19.25
Merger
On August 12, 1996, the Boards of Directors of AEI and DP&L jointly announced an agreement to merge the companies into a new company named Conectiv. Conectiv, a newly formed Delaware corporation, became the parent of AEI's subsidiaries and the parent of DP&L and its subsidiaries effective March 1, 1998. See discussion on approvals below.
DP&L is predominately a public utility engaged in electric and gas service. DP&L provides retail and wholesale electric service to customers located in about a 6,000 square mile territo~ located in Delaware, eastern shore counties in Maryland and the eastern shore area of Virginia. DP&L provides gas service to retail and transportation customers in an area consisting of about 275 square miles in Northern Delaware, including the City of Wilmington:
The merger is to be a tax-free, stock-for-stock transaction accounted for under the purchase method of accounting with DP&L as the acquirer. Under the terms of the agreement, DP&L shareholders will receive one share of Conectiv's common stock for each share of DP&L common stock he.ld. AEI shareholders will receive 0.75 shares of Conectiv's common.stock and 0.125 shares
3
of Conectiv's Class A common stock for each share of AEI common stock held.
On January 30, 1997, the merger was approved by the shareholders of both companies. Approvals have sine~ been obtained from the Federal Energy R~gulatory Commission (FERC), Delaware and Maryland Public Service Commissions, the Virginia State Corporate Commission, the Pennsylvania Publi_c Utilities Commission, the Board of Public Utilities (BPU), and the Nuclear .Regulatory Commission (NRC) . The last and final approval was received from the Securities and Exchange Commission (SEC) on February 25, 1998. The merger became effective March 1, 1998.
Under the terms of the BPU's approval of the merger, approximately 75 percent or $15.75 million of ACE's total average projected annual merger savings will be returned to ACE's customers for an overall merger-related reduction of 1.7 percent.
The total consideration to be paid to the Company's common stockholders, measured by the average daily closing market price of the Company's common stock for the three trading days immediately preceding and the three days immediately following public announcement of the.merger, is $921.0 million. The consideration paid plus estimated acquisition costs and liabilities assumed in connection with the merger are expected to exceed the net book value of the Company's net assets by approximately $200.5 million, which will be recorded as goodwill by Cpnecti v .· The actual amo·unt of goodwill recorded will be based on the Company's net assets as of the merger date and, accordingly, will vary from this estimate which is based on the Company's net assets as of December 31, 1997. The goodwill will be amortized over 40 years.
On June 26, 1997, the Company and DP&L jointly announced an enhanced retirement off er and separation program that will be utilized to achieve workforce reductions as a result of the merger. The Company and DP&L initially anticipated a combined loss of approximately 400 positions to accomplish the mergerrelated rate reductions to customers. This initial level of reductions will be achieved primarily through the DP&L early
4
•
•
•
L
•
, retirem~nt and the Company's enhanced retirement programs. dditional reductions are also anticipated to better align
staffing requirements to skill and work process needs. The combined additional reductions could range between 250 to 350 positions. The total cost to the Company for these programs, as well as the cost of executive severance, employee relocation and facilities integration is estimated to range from $38 million to $43 million. ACE is required to recognize these costs through expense in accordance with GAAP. The actual cost to the Company and ACE will depend on a number of factors related to the employee mix as well as the actual number of employees who will be eligible for the enhanced retirement or_ separation programs.
In the fourth quarter of 1997, the Company recorded an expense of $23.6 million as a result of terminating certain benefit programs of the Company in anticipation of the merger. Termination of the plans resulted in charges of $10.0 million for a supplemental executive retirement plan, $6.3 million due to a pension plan curtailment, $3.8 million from the Equity Incentive Plan (EIP) and $3.5 million from other benefit plans and executive contract terminations. Refer to Note 5. in the Notes to the Consolidated
•
inancial Statements for discussion of the effects on the defined enefit pension plan and the EIP.
Electric Utility Industry Restructuring and Stranded Costs
In April 1997, the BPU issued its Final Report containing findings and recommendations on the electric utility industry restructuring in New Jersey to the Governor and the State Legislature for their consideration. The recommendation for phase-in of retail choice to electric consumers calls for choice to 10~ of all customers beginning October 1, 1998 and to 100~ by July 1, 2000. The Report required each electric utility in the state to file complete restructuring plans, stranded cost filings and unbundled rate filings by July 15, 1997. The Report would allow utilities the opportunitr to recover stranded costs on a case-by-case basis, with no guarantee of 100 percent recovery of eligible stranded costs .
• 5
:·.·:.::·
,· · ... ::·.
.. •)-:
·~~::· :
;'.····.,: .. :
-'
ACE filed its response to the BPU on July 15, 1997. ACE's restructuring plan met the BPU's recommendations for phase-in of retail electric access based on a first-come, first-served basis, proposing choice to 10% of all customers beginning October 1, 1998 and to 100% by July 1, 2000. customers remaining with ACE will be charged a market-based electricity price beginning October 1, 1998. The restructuring plan included a two-phased approach to future rate reductions.
•
In an October 31, 1997 letter to the BPU, ACE added specificity to the framework set out in the restructuring plan with regard to steps ACE anticipates taking to meet the BPU's rate reduction and restructuring goals. First, specific, definable cost reductions of approximately 4% after 1998 were outlined. Further, ACE offered that an appropriate resolution of the merger proceedings will allow ACE to reduce its rates, due to the merger, approximately 1.25% upon consummation of the change in control. In addition, ACE's current estimate showed that, through the use of securitized debt for the full amount.of stranded costs associated with its own generation assets, a further rate decrease of up to 2% was possible based on appropriate - • legislation and orders of the BPU with respect to securitization. Finally, ACE estimates that the results of good-faith negotiations with the nonutility generators could provide a reduction of up to an additional 1.75%. In summary, ACE outlined a total rate reduction of 9% by the end of the transition. On January 28, 1998, the BPU issued its Order establishing the procedural schedule regarding the restructuring plan. Under that order, hearings on the restructuring plan are to be completed by mid-May 1998. It is anticipated that the BPU will issue its final order during the summer of 1998.
Under the stranded cost filing, ACE specified its total stranded cost estimated to be approximately $1.3 billion, of which $911 million is attributable to above-market nonutility generation (NUG} contracts. The remaining amount, approximately $415 million, is related to wholly- and jointly-owned generation investments. The stranded cost filing supports full recovery of stranded costs, which ACE believes is necessary to move to a
6 •
• competitive environment. On February 5, 1998, the Company filed rebuttal testimony in the stranded cost filing. As part of the filing, the Company updated its stranded cost ·estimates for the effects of tax law changes in the State of New Jersey and to modify certain assumptions made in estimating the stranded costs. The total stranded costs in the rebuttal filing are approximately $1.2 billion with $812 million attributable to contracts and $397 million related to wholly- and jointly-owned generation investments. Determination of the stranded cost filing will be heard by the Office of Administrative Law. The Administrative Law Judge is expected to render a decision in May 1998. If ACE is required to recognize amounts as unrecoverable, ACE may be required to write down asset values, and such writedowns could be material.
ACE continues to meet the criteria set forth in SFAS 71 and has presented these financial statements in accordance.therewith. (See Note 1 - Regulation - ACE) . The Financial Accounting Standards Board (FASB), through the Emerging Issue Task Force (EITF) , has recently set forth guidance intended to clarify the accounting treatment of specific issues associated with the restructuring of the electric utility industry through EITF Issue No. 97-4, "Deregulation of the Pricing of Electricity - Issues Related to the Application of FASB Statement~ No. 71, Accounting for the Effects o"f Certain Types of Regulation, and No. 101 Regulated Enterprises-Accounting for the Discontinuation of application of FASB Statement No. 71 11 (EITF No. 97-4) 11
• The consensus reached in EITF No. 97-4 as to when an enterprise should stop applying SFAS 71 to a separable portion of its business_whose pricing is being deregulated, is defined as "when deregulatory legislation or a rate order (whichever is necessary to effect change in the jurisqiction) is issued that contains · sufficient detail for the enterprise to reasonably determine how the transition plan will effect the separable portion of its business" (e.g. generation).
Consensus was also reached "that the regulatory assets and regulatory liabilities that originated in the separable portion of an enterprise to which Statement 101 (SFAS 101," Regulated Enterprises-Accounting for the Discontinuance of Application of
7
FASB Statement No. 71") is being applied should be evaluated on the basis of where (that is, the portion of the business in which) the regulated cash flows to realize and settle them, respectively, will be derived." Additionally, the "source of the cash flow approach adopted in the consensus should be used for recoveries of all costs and settlements of all obligation (not just for regulatory assets and regulatory liabilities that are recorded at the date Statement 101 is applied) for which regulated cash flows are specifically provided in the deregulatory legislation or rate order".
At this time ACE cannot predict, with certainty when it will stop applying SFAS 71 for its generation business. ACE also cannot predict the impacts for its generation business nor can it predict the impacts on its financial condition as a result of applying SFAS 101. The outcome will be dependent upon when a plan is approved and the level of recovery of stranded costs allowed by the BPU. If assets require a write-down as a result of the application of SFAS 101, ACE may need to record an extraordinary noncash charge to operations that could have a material impact on the financial position and results of operations of ACE.
Liquidity and Capital Resources
Atlantic Energy, Inc.
The Company's cash flows are dependent on the cash flows of its subsidiaries, primarily ACE. Principal cash inflows of the Company were dividends from ACE and proceeds from the Company's credit facility. Dividends from ACE were $80.9 million, $82.2 million and $81.2 million for the years 1997, 1996 and 1995, respectively. Cash inflows from the Company's credit facility amounted to $15.9 million, $3.1 million and $34.5 million during the years 1997, 199~ and 19·95, respectively.
The Company has a $75 million revolving credit and term loan facility. The revolver is comprised of a 364-day senior revolving credit facility in the amount of $35 million and a
•
•
8 •
l
•
•
three-year senior revolving credit facility in the amount of $40 million. Interest rates are based on senior debt ratings and on the borrowing option selected by the Company. As of December 31, 1997 and 1996, AEI had $53.5 million and $37.6 million outstanding, respectively, from this credit facility. This facility can be used to fund further reacquisitions of Company Common Stock and other general corporat~ purposes up until the effective date of the merger. At that time, a credit facility under Conectiv will provide financing for general corporate purposes.
Principal cash outflows of the Company are dividends to shareholders and disbursements to subsidiaries and affiliated companies in the form of capital contributions, loans and advances. Dividends to shareholders amounted to $80.9 million in 1997 and $81.2 million in 1996 and 1995. Net Disbursements to subsidiaries and affiliated companies amounted to $12.8 million, $1.2 million and $.5 million for the years ended 1997, 1996 and 1995, respectively.
During 1995, the Company reacquired and cancelled 1,625,000 shares for a total cost of $29.6 million with prices ranging from $17.625 to $18.875 per share. At December 31, 1996 and 1995, the Company has reacquired and cancelled a total of 1,846,700 shares of its common stock at a cost of $33.5 million. The Company did not reacquire and cancel any shares under this program during 1996 and 1997. Th~ Company's program to reacquire up to three million shares of the it's common stock outstanding will expire with the merger.
Agreements between the Company and its subsidiaries provide for allocation of tax liabilities and benefits generated by the respective subsidiaries. Credit support agreements exist between the Company and ATE and AGI.
Atlantic City Electric Company
ACE is a public utility primarily engaged in the generation, purchase, transmission, distribution and sale of electric energy. ~CE's service territory encompasses approximately 2,700 square
9
miles within the southern one-thir_d of New Jersey with the majority of customers being residential and commercial. Cash construction expenditures for 1995-1997 amounted to $268.6 million and included expenditures for upgrades to existing transmission and distribution facilities and compliance with provisions of the Clean Air Act Amendments of 1990. ACE's current estimate of cash construction expenditures for 1998-2000 is $207.6 million. These estimated expenditures reflect necessary improvements to generation, transmission and distribution facilities.
On an interim basis, ACE finances construction costs and other capital requirements in excess of internally generated funds through the issuance of unsecured short term debt, consisting of commercial paper and notes from banks. As of December 31, 1997, ACE had authority to issue $150 million of short term debt, comprised of $100 million of committed lines of credit and $50 million on a when offered basis. At December 31, 1997, ACE had $77.9 million of unused short-term borrowing capacity. Shortterm debt at December 31,_ 19.97 decreased $9. 3 million compared to December 31, 1996 and was used for general corporate purposes . This decrease is net of $16.4 million reclassified to noncurrent long-term debt due to the January 1998 issuance of medium term notes discussed below.
Permanent financing by ACE is undertaken through the issuance of long term debt and preferred stock, and from capital contributions by AEI. ACE's nuclear fuel requirements associated with its jointly-owned units have been financed through arrangements with a third party.
A summary of the issue and sale of ACE's long term debt and preferred securities for 1995-1997· is as follows:
(millions) Medium Term Notes Pollution Control Bonds cumulative Quarterly Income Preferred Securities
1997 $65
22.6
10
$70
1995 $105
•
•
•
•
•
The proceeds from these financings were used to refund higher cost debt, preferred stock, and for construction purposes. ACE may issue up to $150 million in long term debt to be used for construction, refundings and repayment of short term debt up through 2000. The provisions of ACE's charter, mortgage and debenture agreements can limit, in certain cases, the amount and type of additional financing which may be used. At December 31, 1997, ACE estimates additional funding capacities of $264.3 million of First Mortgage Bonds, or $489 million of preferred stock, or $110.8 million of unsecured debt. These amounts are not necessarily additive.
On July 30, 1997, ACE issued $22.6 million aggregate principal amount of variable rate, tax-exempt pollution control bonds in two separate series: $18.2 million Pollution Control Revenue Refunding Bonds, 1997 Series A due April 15, 2014 (Series A) and $4.4 million Pollution Control Revenue Refunding Bonds, 1997 Series B due July 15, 2017 (Series B). The Series A and the Series B bonds paid an initial weekly rate of 3.4% and 3.5%, respectively. Each subsequent rate is determined by the remarketing agent. The proceeds from the sale of the Series A and Series B bonds were applied to the September 2, 1997 redemption of $18.2 million aggregate principal amount of 7 3/8% Pollution Control Revenue Bonds of 1984, Series A and $4.4 million aggregate principal amount of 8 1/4% Pollution Control Revenue Bonds of 1987, Series B. Aggregate premiums paid for the September 2, 1997, redemption were $546,000 and $88,000, respectively.
During 1997, ACE issued and sold $65 million aggregate principal amount of unsecured Medium Term Notes. Primarily, the notes were sold to cover the December 1, 1997, redemption of $20 million principal amount of 7.5% First Mortgage Bonds due April 1, 2002 and $29.976 million principal amount of 7.75% First Mortgage Bonds due June 1, 2003. Aggregate premiums paid for the redemption of these bonds were $240,000 and $440,647, respectively.
11
On January 12, 1998, ACE issued $85 million of Secured Medium Term Notes, Series D maturing at January 2003 and January 2006 . The Notes paid.fixed interest rates of 6.0%, 6.2% and 6.2%. The net proceeds to be received by the· Company from the issuance and sale of the Medium Term Notes will be applied to the repayment of outstanding short-term and long-term indebtedness, including the redemption of certain series of First Mortgage Bonds, Preferred Stock and unsecured short-term debt due in 1998.
Listed below is a schedule of redemptions of Pref erred Stock and long term debt redeemed, acquired .and retired or matured for the period 1995-1997.
September 1997 7-3/8% due $18,200 103.00 September 1997 8-1/4% due 4,400 102.00 December 1997 7-1/2% due 2002 20,000 101.20 December 1997 7-3/4% due 2003 29,976 101.47 February 1996 5-1/8% due 1996 9,980 100.00 February 1996 5-1/4% due 1996 2,267 100.00 October 1995 9-1/4% due 2019 53,857 105.15 October 1995 10-1/2% due 2014 850 101.00
12
•
•
•
·'
•
•
•
On May 1, 1997, ACE satisfied the sinking fund requirements of $100,000 for its 7-1/4% Debentures and on December 1, 1997 satisfied the sinking fund requirement of $75,000 of its 6 3/8% Pollution Control Series due December 1, 2006. Scheduled maturities and sinking fund requirements for long term debt and preferred stock aggregate $199.3 million for 1998-2002.
On April 1, 1997 ACE and other New Jersey utilities were required to pay excise taxes to the State of New Jersey. ACE paid $91.l million funded through the issuance of short term debt with repayment of such debt occurring during the second and third quarters.
Atlantic Energy Enterprises, Inc.
AEE is a holding company which is responsible for the management of the investments in the nonutility companies consisting of: Atlantic Generation, Inc. (AGI); Atlantic Southern Properties, Inc. (ASP); ATE Investment, Inc. (ATE); Atlantic Thermal Systems, Inc. (ATS); CoastalComm, Inc. (CCI) and Atlantic Energy Technology, Inc. (AET). Also, AEE has a 50% equity interest in Enerval, LLC, (Enerval) a company which provides energy management services, including natural gas supply, transportation and marketing. ·
As a service to Enerval, the other 50% owner enters into futures contracts on Enerval's behalf. As of December 31, 1997, this owner entered into natural gas futures contracts on behalf of Enerval for 9.3 million DTH at a price range of $1.90 to $3.20, through March 2000 in the notional amount of $21.2 million. The original contract terms range from one month to two years. Enerval's futures contracts hedge $21.7 million in ~nticipated natural gas sales. The counterparties to the futures contracts are the New York Mercantile Exchange and major over the counter market traders. The Company believes the risk of nonperformance by these counterparties is not significant. If the contracts had been terminated at December 31, 1997, $0.6 million would have been payable by Enerval for the natural gas price fluctuations .
13
AEE obtains funds for its investments and operating needs through advances from AEI and notes payable to ATE. Funds for AEE capital investments will be provided through issu_ance of ATE long term debt and equity investments by AEI up to the effective merger date.
Atlantic Generation, Inc.
AGI is engaged in the development, acquisition, ownership and operation of cogeneration power projects. AGI's activities through its subsidiaries are primarily represented by partnership interests in cogeneration facilities located in New Jersey. At December 31, 1997, total investments in these partnerships amounted to $18.7 million.
Atlantic Southern Properties, Inc.
ASP owns and manages two commercial off ice buildings and a warehouse facility located in Atlantic County, New Jersey with a net book value of $9.2 million at December 31, 1997. In 1996 a write-down of the carrying.value of a facility of $0.8 million, net of tax was recorded to reflect the recognition of the diminished value due to the excess vacancy and a decline in the local commercial real estate market. This investment has been funded by capital contributions from AEI and borrowings under a loan agreement with ATE.
ATE Investment, Inc.
ATE provides financing to affiliates and manages a portfolio of investments in leveraged leases. ATE has invested $80.4 million in leverag~d leases of three commercial aircraft and two containerships. ATE along with an unaffiliat~d company joined together to create an equity limited partnership, EnerTech Capital Partners, L.P., (Enertech). Enertech invests in and support a variety of energy related technology growth companies. At December 31, 1997 ATE had invested $10.2 million in this partnership. Enertech accounts for its investment under the investment method of accounting. ATE obtained funds for its business activities and loans to affiliates through capital contributions from AEI and external borrowings. These borrowings
14
•
•
•
•
•
include $15 million principal amount of 7.44% Senior Notes due 1999 and a revolving credit and term loan facility of up to $25 million. At December 31, 1997, $5.0 million was outstanding under this facility. ATE's cash flows are provided from lease rental receipts and realization of tax benefits generated by the leveraged leases. ATE has notes receivable, including interest, outstanding with ASP which totaled $10.3 million at December 31, 1997. ATE has. established credit arrangements with AEE, of which $8.3 million was a receivable, including interest, at December 31, 1997.
Atlantic Thermal Systems, Inc.
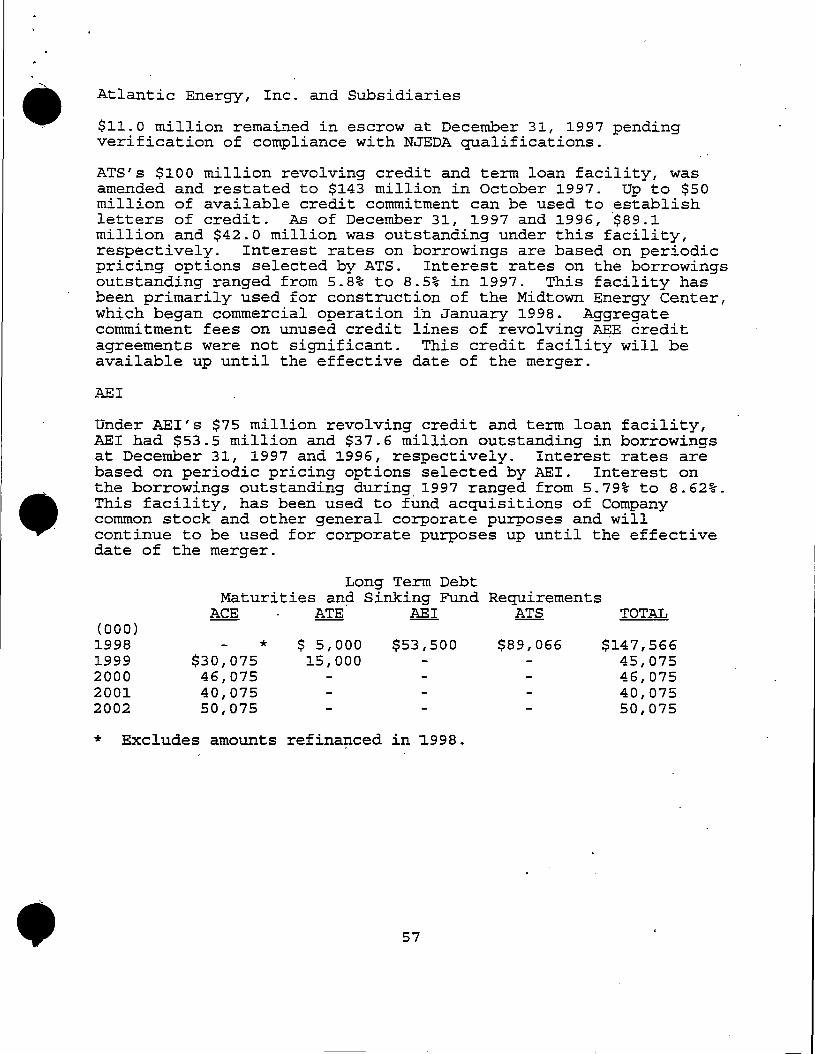
ATS and its wholly-owned subsidiaries are engaged in the development and operation of thermal heating and cooling systems. ATS plans to make $125 million in capital expenditures related to district heating and cooling systems to serve the business and casino district in Atlantic City, New Jersey and has invested $84.8 million as of December 31, 1997. Construction for the Midtown Energy Center is complete and has been in a testing phase since October 1997. Commercial operation began January i, 1998 . ATS has obtained funds for its project development through a revolving credit agreement and term loan. ATS's $100 million credit facility was amended and restated to $143 million in October 1997. Up to $50 million of the available credit commitment can be used to establish letters of credit. As of December 31~ 1997, $89.1 million was outstanding under this facility. Additional funding for the project came from $12.5 million from the proceeds of special, limited obligation bonds issued by the New Jersey Economic Development Authority (NJEDA) . Proceeds from the sale were placed in escrow. The proceeds may be released to the ATS partnership and used to pay certain "qualified costs" subject to satisfaction of certain conditions. In November 1997, ATS satisfied the escrow release conditions and remarketed, through underwriters, $12.5 million principal amount, Series 1995 Thermal Energy Facilit.ies Revenue Bonds due December 1, 2009 at variable rates of interest. Since issuance, the interest rates to the ATS partnership have ranged from 2.5% to 4.1%. In addition, the NJEDA issued an additional $18.5 million in limited obligation bonds which were sold, through · underwriters, as Series 1997 Thermal Energy Facilities Revenue
15·
Bonds due December 1, 2031 at variable rates which have ranged • from 2.5% to 4.1%. ATS applied $20.0 million of bond proceeds to reimburse it for certain qi.J.alifying costs incurred during construction of the M~dtown Energy Center in Atlantic City, New Jersey. Proceeds of $11.0 million remained in escrow at December 31, 1997 pending verification of compliance with NJEDA qualifications.
ATS has agreements with six casinos in Atlantic City, New Jersey to operate their heating and cooling systems~ As part of these agreements, ATS has paid $27.5 million in license fees for the right to operate and service such systems for a period of 20 years. ATS recorded $1.2 million in expense for these "license fees which are recorded on the Consolidated Balance Sheet as License Fees and are being amortized to expense over the life of the contracts.
RESULTS OF OPERATIONS
Operating results of AEI as a consolidated group are dependent upon the performance of its subsidiaries, primarily ACE.
Operating Revenues
Operating revenues increased 10.6% and 4.1% in 1997 and 1996, respectively. Electric revenues increased 8.1% and 3.0% in 1997 and 1996, respectively. Components of the overall operating revenue changes are shown as follows:
(millions) Base Revenues Refund Credits Levelized Energy Clause Kilowatt-hour Sales Unbilled Revenues Wholesale Market Sales Sales for Resale Other Services Other Total
16
$ 1.0
15.3 (4 .1)
11.8
70.2 (16.9) 25.4 2.6
$105.3
$ (8.9) ( 13 . 0) 29.3 32.2
(17.6) 1.9 6.0
10.0 . ( • 9)
$ 39.0
•
•
•
•
The increase in Base Revenues for the current year reflects the $13.0 million refund to customers recorded in 1996 as the result of a stipulation agreement which was off set by the effects of ACE's BPU approved Off-Tariff Rate Agreements (OTRAs). OTRAs are special reduced rates offered by ACE to at-risk customers which aggregated $10.5 million and $3.5 million for the years ended December 31, 1997 and 1996, respectively. At-risk customers are customers who may choose to leave ACE's energy system because they have alternative energy sources available. The Refund Credits are the result of the October 22, 1996 stipulations for the $13.0 million settlement concerning the outages of· the Salem Units and the alleged overrecovery of capacity costs from nonutili ty generation facilities. See Note 3 of ·the consolidated financial statements for further details regarding the stipulations.
LEC revenues increased in 1997 due to a rate increase of $27.6 million in July 1996. Changes in kilowatt-hour sales are discussed under "Billed Sales to Ultimate Utility customers." Overall, the combined effects of changes in rates charged to customers and kilowatt-hour sales resulted in increases of 2.4% and 0.9% in revenues per kilowatt-hour in 1997 and 1996, respectively. The changes in Unbilled Revenues are a result of the amount of kilowatt-hours consumed by, but not yet billed to, ultimate customers at the end of the respective periods, which are affected by weather and economic conditions, and the corresponding pric~ per kilowatt-hour.
Wholesale Market Sales represent bulk power sales, which are not subject to price regulation. ACE began making such sales in July 1996. Wholesale Market Sales and the related expenses were previously included in Other-Net, within Other Income on the Consolidated Statement of Income. (See Note 1 -
Reclassification) . The increase in 1997 sales represent an increase in bulk power sales due to a full year's operation as well as a result of ACE's strategy and development of a business opportunity.
The changes in Sales for Resale are a function of ACE's energy mix strategy, which in turn is dependent upon ACE's needs for energy, the energy needs of other utilities participating in the
17
regional power pool of which prices of energy available. Resale is primarily due to a using Wholesale Market Sales customers.
ACE is a member, and the sources and The decrease in the 1997 Sales for change ~n ACE's energy mix strategy, to service previous Sales for Resale
Other Services Revenues represent non-regulated energy services of ACE and revenues of AEE which were previously included in Other-Net, within Other Income on the Consolidated Statement of Income. Other Services Revenues increased significantly primarily reflecting ATS's casino heating and cooling service contracts and the growth of ACE's energy services programs.
Billed Sales to Ultimate Utility customers
Changes in kilowatt-hour sales are generally due to changes in the average number of customers and average customer use, which is affected by economic and weather conditions. Energy sales statistics, stated as percentage changes from the previous year, are shown as follows:
1997 1996
Avg Avg# Avg Avg # customer Class Sales Use of CUst Sales Use of CUst Residential (3. 7) % (4.6)% 1.0% 3.2% 2.4 % 0.8% Commercial 1.3 (0.5) 1-. 8 3.0 2.0 1.0 Industrial .3 .2 2.6 0.6 7.1 5.5 1.5 Total (0. 6) (1. 7) 1.1 3.6 2.8 0.8
The 1997 decrease in actual billed sales was due to unfavorable weather in 1997 and.a lesser number of billing days in 1997 compared to 1996. The decrease in 1997 Residential ·sales was a result of above normal temperatures in the first qu~rter of 1997 and cooler than normal weather in late August and early September 1997. Casino expansions and .construction around Atlantic City, New Jersey were significant contributors to commercial sales growth in 1997. The increased 1997 Industrial sales were primarily due to the impact of two customers that had previously been supplied by an independent power producer.
l.8
•
•
•
In 1996, the growth rate of actual billed sales increased significantly from 1995 due to an increase in the number of billing days and more favorable weather conditions. Sales growth was offset by cooler than normal summer weather conditions in 1996. Casino expansions and construction around Atlantic City, New Jersey were significant contributors to commercial sales growth in 1996. The increase in 1996 Industrial sales was primarily due to the impact of two customers, which began service in late 1996, that had previously been supplied by an independent power producer.
Costs and Expenses
Total Operating Expenses for the Company increased 8.9% and 9.1% in 1997 and 1996, respectively. Operat~ng expenses for ACE increased 8.5% in both 1997 and 1996. Included in these expenses are the costs of energy, purchased capacity, operations, maintenance, depreciation, state excise taxes and taxes other than income tax.
Operating Expenses
Energy expense reflects.costs incurred for energy needed to meet load requirements, various energy supply sources used, wholesale market purchases and operation of the LEC. Changes in costs reflect the varying availability of low-cost generation from ACEowned and purchased energy sources, and the corresponding unit prices of the energy sources used, as well as changes in the needs of other utilities participating in the Pennsylvania-New Jersey-Maryland Interconnection Power Pool. The cost of energy, except for the nonregulated purchases, is recovered from customers primarily through the operation of the LEC. Generally, earnings are not affected by recoverable energy costs because these costs are adjusted to match the associated LEC revenues. However, ACE had voluntarily foregone recovery of certain amounts of otherwise recoverable fuel costs through its Southern New Jersey Economic Initiative (SNJEI), thereby, reducing earnings through May 1996, as indicated below. Ot~erwise, in any period, the actual amount of LEC revenue recovered from customers may be greater or less than the actual amount of recoverable·energy cost incurred in that period. Such respective overrecovery or
19
·:-..:::
': .: ...
-~
underrecovery of energy costs is recorded on the Consolidated Balance Sheet as a liability or an asset as appropriate. Amounts from the balance sheet are recognized in the Consolidated Statement of Income within Energy expense during the period in which they are subsequently recovered through the LEC. ACE was underrecovered by $27.4 million and by $33.5 million at December 31, 1997 and 1996, respectively.
Energy expense increased 30.3% in 1997 primarily due to expenses associated with the first full year of activity in Wholesale Market Sales. Energy expense increased 17.4% in 1996 primarily due to the changes in the LEC effective July 17, 1996, permitting ACE to begin recovering over $35.3 million in previously deferred energy costs. Production related energy costs for 1996 increased 5.3% due to increased sales. As a result of implementing the SNJEI, after tax net income has been reduced by $2.7 million for 1996.
Purchased Capacity expense reflects entitlement to generating capacity owned by others. Purchased Capacity e~ense increased 2.7% in 1996. The increase reflects additional contract capacity supplied by nonutility power producers.
Operations expenses decreased 3.4% in 1997 and increased 9.9% in 1996. The decrease in 1997 reflects reductions in· operations expense relating to the Salem outages. The 1996 increase reflects additional costs associated with Salem Station restart activities offset in part by a credit for the estimated 1995 Nuclear Performance Penalty.
Maintenance expense decreased 26.2% in 1997. This decrease reflects reductions in maintenance expenses relating to the Salem outage. Maintenance expense ·increased 28.8% in 1996 as a result of additional cost associated with the Salem Station restart activities, and increased maintenance initiatives.
-Termination of Employee Benefits represents amounts recorded in December 1997 for the cost to terminate various pension and compensation plans in anticipation of the merger.
20
l
•
•
•
•
•
Other-Net within Other Income increased 20.6% in 1997, this was primarily due to a gain on the sale of property. Other-net decreased 29.5% in 1996 due to the net after-tax impacts of the write-down of the carrying value of ASP's commercial property of $1.2 million, the contingency loss for the sale of Binghamton Cogeneration facility of $2.5 million. Also included is a loss of $1.6 million from AEE's investment in Enerval due to a combination of unhedged gas sales agreements and higher spot market prices for gas.
Interest expense increased 2.2% in 1997 and 4.6% in 1996 due primarily to increased short-term debt borrowings.
Preferred Securities Dividend Requirements decreased 6.5% and 22.5% in 1997 and 1996, respectively, as a result of mandatory and optional redemptions.
Income Taxes
Federal Income Taxes increased 33.1% in 1997 and decreased 28.5% in 1996 as a result of the level of taxable income during those periods.
Salem. Nuclear Generating Station
ACE is an owner of 7.41% of Salem Units 1 and 2, which are operated by PS. The Salem units represent 164 MWs of ACE's total installed-capacity of 2,415.7 MWs. Salem Unit 1 has been out of service since May 16, 1995. Salem Unit 2, out of service since June 7, 1995 ~eturned to service on August 30, 1997 and reached 100% power on September 23, 1997.
PS has advised ACE that the installation of Salem Unit 1 steam generators has been completed. The cost of purchasing and installing the steam generators, as well as the disposal of the old generators is $186 million, of which ACE's share is $13.8 million. The unit is currently expected to return to service near the end of the first quarter of 1998. Restart of Salem Unit 1 is also subject to NRC approval.
The Salem Station outages has caused ACE to incur replacement power costs of approximately $700 thousand per month per unit. As previously discussed, ACE's replacement power costs for the
21
current and recent outage, up to the agreed-upon return-toservice date of June 30, 1997 for Salem Unit l and December 31, 1996 for Salem Unit 2, will be recoverable in.rates in ACE's 1997 LEC proceeding. Replacement power costs incurred after the • agreed-upon return-to-service date for the Salem Station will not _ be recoverable in rates. ACE has incurred $10.2 million in nonrecoverable replacement power costs to date related to Salem.
ACE entered into an agreement with PS for the purpose of limiting ACE's exposure to Salem's 1997 operation and maintenance (O&M) expenses. Pursuant to the terms of the agreement, ACE was obligated to pay to PS $10 million of O&M expense, as a fixed charge payable in twelve equal installments beginning February l, 1997. ACE's obligation for any contributions, above the $10 million, to Salem 1997 O&M expenses up to ACE's estimated share of $21.8 million, is based on performance and directly related to the timely return and operation of the units. As a result of this Agreement, ACE agreed to dismiss the complaint filed in the Superior Court of New Jersey in March 1996 alleging negligence and breach of contract.
On February 27, 1996, the Salem co-owners filed a Complaint in United States District Court for the District of New Jersey· against Westinghouse Electric Corporation, the designer and manufacturer of the Salem steam generators, under Federal and state statutes alleging fraud, negligent misrepresentation and breach of contract. The litigation is continuing in accordance with the schedule established by the court.
Other
The Energy Policy Act of 1992 permits the Federal government to assess investor-owned electric utilities that have ownership interests in nuclear generating facilities for the decontamination and decommissioning of Federally operated nuclear enrichment facilities. Based on its ownership in five nuclear generating units, ACE has a liability of $4.6 million and $5.3 million at December 31, 1997 and 1996, respectively, for its obligation to be paid over the next 12 years. ACE has an associated regulatory asset of $5.0 million and $5.7 million at December 31, 1997 and 1996, respectively. Amounts are currently being recovered in rates for this liability and the regulatory asset is concurrently being amortized to expense based on the annual assessment billed by the Federal government.
22 •
•
ACE is subject to a performance standard for its five jointlyowned nuclear units. This standard is used by the BPU in determining recovery of replacement energy costs when output from the nuclear units is reduced or not available. Underperformance results in penalties which are not_ permitted to be recovered from customers and are charged against income. According to a December 1996 stipulation agreement, the performance of Salem Units 1 and 2 shall not be included in the calculation of a nuclear performance penalty for the period each unit was taken out of service up to each unit's respective return-to-service date. The parties to the stipulation agreed that for the years 1995 and 1996, there· will be no penalty under the nuclear performance standard. Additionally, ACE will not incur a nuclear performance penalty for 1997.
Year 2000 Disclosure
The Company's Information Technology Department (IT), through a Conectiv project team, has developed a strategy to address and correct the year 2000 problem (Y2K) . An inventory of the Company's computer applications, hardware and system software and infrastructure has been completed. An initial assessment of these systems has been made as they relate to the Y2K. The project team's goal is to resolve Y2K related problems associated with core systems by the close of 1998. The Company has also contacted major vendors to review remediation of their Y2K issues. The Company estimates that approximately $3 million is necessary for IT to complete the scope of their responsibilities. The Company has not estimated the expected cost to complete this project in all other areas. The Company believes that it is taking the necessary steps to minimize the risk of an interruption of service to it's operations and customers.
outlook
With the merger of AEI into a new company known as Conectiv the Company is focusing on the objectives of Conectiv which will be carried out by three strategic business units- Regulated Delivery, Energy Supply and Retail Businesses. The business units will provide services to the competitive regional marketplace aligning Conectiv's organization with the changing needs of its customers and markets. Regulated Delivery will focus on providing high value utility delivery sez-Vice to customers. Energy Supply will maximize the value of generation,
23
~- I
while managing the transition to a competitive generation market. The goal of the Retail businesses is to become a regional fullservice company providing value-added products and services for the retail energy consumer which create customer loyalty and satisfaction.
The utility business will continue to be the primary factor influencing Conectiv's overall financial performance. For ACE, legislative changes in the regulated electric utility industry in New Jersey will have a significant impact on ACE's economic viability and ability to compete in the energy marketplace. ACE's restructuring filing, which proposes customer choice starting October 1998, outlines a plan that could ultimately reduce rates by 9%. Achievement of such goals will depend upon the success of ACE's commitment to good-faith negotiations with independent power producers, as well as legislation to support securitization for the full amount of its stranded costs.
ACE's restructuring filing supports full recovery of stranded costs, which it believes is also necessary to move to a competitive environment. If ACE is required to recognize amounts as unrecoverable, ACE may be required to write down asset values, and such writedowns could be material.
ACE's generation business will be faced with the effects of competition in the very near term. ACE's retail prices are expected to be critical success factors in a competitive marketplace. At this time ACE cannot predict, with certainty when it will stop applying SFAS 71 for its generation business and cannot predict the impacts for its generation business or predict the impacts on its financial condition as a result of applying SFAS 101.
ACE's utility business will continue to be affected by regional economic trends and social initiatives, as well as the impacts of abnormal weather and inflation. Such regional economic trends are favorable and include the growth of Atlantic City and the gaming industry. Ongoing requirements for service reliability, and compliance with existing and new environmental regulations, will continue to cause additional capital investments to be made by ACE. ACE's planned construction budget is $324.8 million for the five year period beginning in 1998. ACE's ability to generate cash flows or access the capital markets may be affected by competitive pressures on revenues and income.
24
•
•
•
•
•
As of January 1, 1998 ATS's Midtown Energy Center began operations servicing casino-hotels within the city of Atlantic City. These operations are for phase 1 of a 5 phase plan to service customers in the 11 Midtown 11 section of the city. As of January l, 1998, 78% of the capitalized costs for the Midtown · Energy Center are in operation. ATS arose out of a business opportunity resulting from the combination of casino growth and expansion and state environmental and regulatory changes. ATS has undertaken additional projects and continues to explore opportunities locally and throughout the United States. All of AEE's businesses will be blended into Conectiv's strategic plans and current businesses and investments will be evaluated to support corporate objectives.
The merger is part of a wider trend in the utility industry toward consolidation and strategic partnerships in order to create larger, stronger companies for the onset of competition. The opportunities which will be derived from increased financial strength, improved management, efficiencies of operations and better utilization and coordination of existing and future facilities will provide Conectiv the strategic and operational opportunities to better meet the coming competitive environment.
Inflation
Inflation affects the level of operating expenses and also the cost of new utility plant placed in service. Traditionally, the rate making practices that have applied to ACE have involved the use of historical test years and the actual cost of utility plant. However, the abil~ty to recover increased costs through rates, whether resulting from inflation or otherwise, depends upon both market circumstances and the frequency, timing and results of rate case decisions.
Other
The Private Securities Litigation Reform Act of 1995 (the Act) provides a new "safe harbor" for forward-looking statements to encourage such disclosures without the threat of litigation providing those statements are identified as forward-looking and are accompanied by meaningful, cautionary statement.s identifying· important factors that could cause the actual results to differ materially from those projected in the statement. Forward-
25
looking statements have been and will be made in written documents and oral presentation of AEI and its subsidiaries. Such statements are based on managements beliefs as well as assumptions made by and inf orrnation currently available to management. When used in AEI and subsidiary documents or oral presentation, the words "anticipate", "estimate", "expect", "objective" and similar expressions are intended to identify such forward-looking statements. In addition to any assumptions and other factors referred to specifically in connection with such forward-looking statements, factors that could cause act.ual results to differ materially from those contemplated in any forward-looking statements include, among others, the following: deregulation, and the unbundling of energy supplies and services; an increasingly competitive energy marketplace; sales retention and growth potential in a mature service territory and a need to coritain costs; ability to obtain adequate and timely rate relief, cost recovery, including the potential impact of stranded costs, and other necessary regulatory approvals; federal and state regulatory actions; costs of construction; operating restrictions, increased cost and construction delays attributable to environmental regulations; controversies regarding electric and magnetic fields; nuclear decommissioning and the availability of reprocessing and storage facilities for spent nuclear fuel; licensing and regulatory approval necessary for nuclear and other operating station; and credit market concerns with these issues. AEI and its subsidiaries undertake no obligation to publicly update or revise any forward-looking statements, whether as a result of new information, future events or otherwise. The foregoing review of factors pursuant to the Act should not be construed as exhaustive or as any admission regarding the adequacy of disclosures made by AEI and its subsidiaries prior to the effective date of the Act.
ATLANTIC CITY ELECTRIC COMPANY AND SUBSIDIARY
The information required by this item is incorporated herein by reference from the following portions of.AEI's Management's Discussion and Analysis of.Financial Condition and Results of Operations, insofar as they relate to ACE and its subsidiary: Financial Summary, Liquidity and Capital Resources - Atlantic City Electric Company, Results of Operations, Salem Nuclear Generating Station, Competition, Outlook, Inflation and Other .
26
•
•
•
•
•
REPORT OF MANAGEMENT-Atlantic Energy, Inc .
The management of Atlantic Energy, Inc. and its subsidiaries (the Company) is responsible for the preparation of the consolidated financial statements presented·in this Annual Report. The financial statements have been prepared in conformity with generally accepted accounting principles. In preparing the consolidated financial statements, management made informed judgments and estimates,· as necessary, relating to events and ~ransactions reported.
Management has established a system of internal .accounting and financial controls and procedures designed to provide reasonable assurance as to the integrity and reliability of financial reporting. In any system of financial reporting controls, inherent limitations exist. Management continually examines the effectiveness and efficiency of this system, and actions are taken when opportunities for improvement are identified. Management believes that, as of December 31, 1997, the system of internal accounting and financial controls over financial reporting is effective. Management also recognizes its responsibility for fostering a strong ethical climate in which the Company's affairs are conducted according to the highest standards of corporate conduct. This responsibility is characterized and reflected in the Company's code of ethics and business conduct policy. ·
The consolidated fi~anciai statements have been audited by Deloitte & Touche LLP, Certified Public Accountants. Deloitte & Touche LLP provides objective, independent audits as to management's discharge of its responsibilities insofar as they relate to the fairness of the financial statements. Their audits are based on procedures believed by them to provide reasonable assurance that the financial statements are free of material misstatement~
The Company's internal auditing function conducts audits and appraisals of the Company's operations. It evaluates the system of internal accounting, financial and operational controls and compliance with established procedures. Both the external auditors and the internal auditors periodically make recommendations concerning the Company's internal control structure to management and the Audit Committee of the Board of Directors. Management responds to such recommendations as appropriate in the circumstances. None of the recommendations made for the year ended December 31, 1997 represented significant deficiencies in the design or operation of the Company's internal control structure.
Isl J. L. Jacobs J. L. Jacobs
Chairman and Chief Executive Officer
Isl M. J. Barron M. J. Barron
Senior Vice President and Chief Financial Officer February 2, 1998
27
REPORT OF THE AUDIT COMMITTEE ~
The Audit Committee of the Board of Directors is comprised solely o~ independent directors. The members of the Committee are: Matthew Holden, Jr., Kathleen MacDonnell, Bernard J. Morgan and Harold J. Raveche. The Committee held four meetings during 1997.
The Committee oversees the Company's financial reporting process on behalf of the Board of Directors. In fulfilling its responsibility, the Committee recommended to the Board of Directors, subject to shareholder ratification, the selection of the Company's independent auditors, Deloitte & Touche LLP. The Committee discussed with the Company's internal auditors and Deloitte & Touche LLP, the overall scope of and specific plans for their respective activities concerning the Company. The Committee meets regularly with the internal and external auditors, without management present, to discuss the results of their activities, the adequacy of the Company's system of accounting, financial and operational controls and the overall quality of the Company's financial reporting. The meetings are designed to facilitate any private communication with the Committee desired by the internal and external auditors. No significant actions by the Committee were required during the year ended December 31, 1997 as a result of any communications· conducted.
Isl Matthew Holden, Jr. Matthew Holden, Jr.
Chairman, Audit Committee
February 2, 1998
• 28
• INDEPENDENT AUDITORS' REPORT
To the Shareholders and the Board of Directors of Atlantic Energy, Inc.:
We have audited the accompanying consolidated balance sheets of Atlantic Energy, Inc. and subsidiaries as of December 31, 1997 and 1996 and the related consolidated statements of income, changes in common shareholders' equity, and cash flows for each of the three years in the period ended December 31, 1997. These financial statements are the responsibility of the Company's management. Our responsibility is to express an opinion on these financial statements based on our audits.
We conducted our audits in accordance with generally accepted auditing standards. Those standards require that we plan and perform the audits to obtain reasonable assurance about whether the financial statements are free of material misstatement. An audit includes examining, on a test basis, evidence supporting the amounts and disclosures in ·the financial statements. An audit also includes assessing the accounting principles used and significant estimates made by management, as well as evaluating the overall financial statement presentation. We believe that our audits provide a reasonable basis for our opinion. .
In our opinion, such consolidated financial statements present fairly, in all material respects, the financial position of Atlantic Energy, Inc. and subsidiaries at December 31, 1997 and 1996 and the results of their operations and their cash flows for each of the three years in the period ended December 31, 1997· in conformity with generally accepted accounting principles.
/s/ Deloitte & Touche LLP Deloitte & Touche LLP
February 2, 1998 (March 1, 1998 as to Note 4) Parsippany, New Jersey
29
... ...
~· : .
.·:
··:··: .•
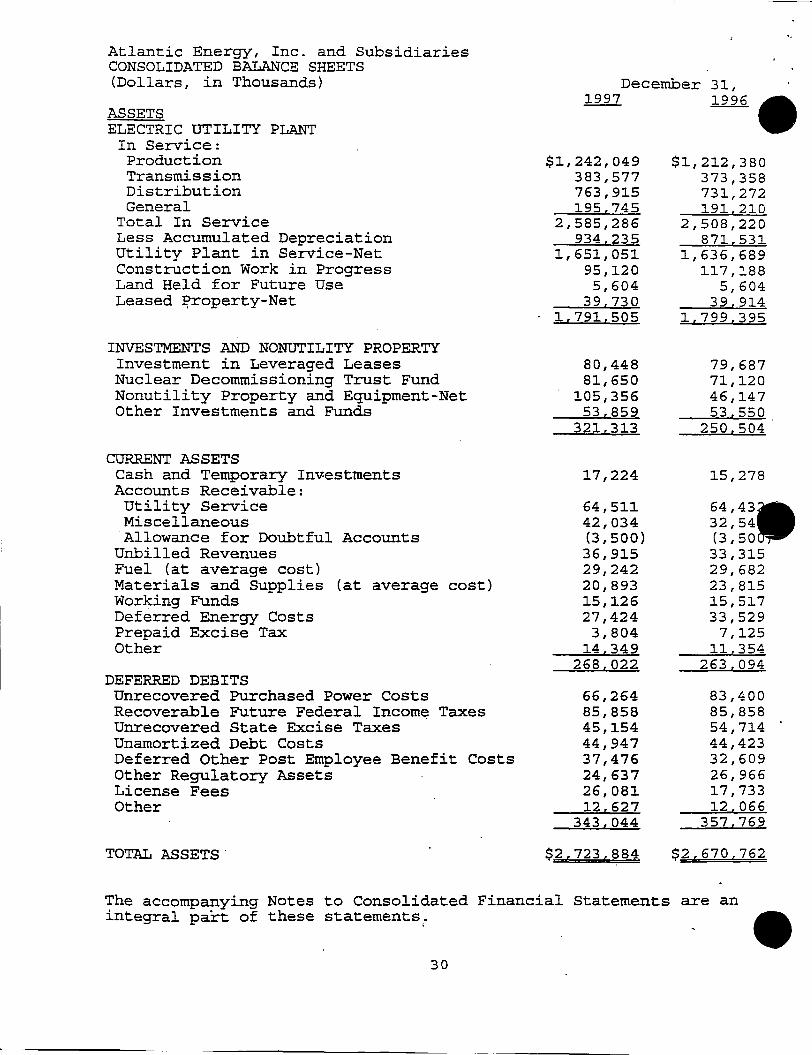
Atlantic Energy, Inc. and Subsidiaries CONSOLIDATED BALANCE SHEETS (Dollars, in Thousands)
ASSETS ELECTRIC UTILITY PLANT
In Service: Production Transmission Distribution General
Total In Service Less Accumulated Depreciation Utility Plant in Service-Net Construction Work in Progress Land Held for Future Use Leased ~roperty-Net
INVESTMENTS AND NONUTILITY PROPERTY Investment in Leveraged Leases Nuclear Decommissioning Trust Fund Nonutility Property and Equipment-Net Other Investments and Funds
CURRENT ASSETS Cash and Temporary Inv.estments Accounts Receivable: Utility Service Miscellaneous Allowance for Doubtful Accounts
Unbilled Revenues Fuel (at average cost) Materials and Supplies (at average cost) Working Funds Def erred Energy Costs Prepaid Excise Tax Other
DEFERRED DEBITS Unrecovered Purchased Power Costs Recoverable Future Federal Incom~ Taxes Unrecovered State Excise Taxes Unamortized Debt Costs Deferred Other Post Employee Benefit Costs Other Regulatory Assets License Fees Other
The accompanying Notes to Consolidated Financial Statements are an integral part of these statements.
' • 30
• Atlantic Energy, Inc. and Subsidiaries CONSOLIDATED BALANCE SHEETS (Dollars, in Thousands)
LIABILITIES AND CAPITALIZATION CAPITALIZATION COMivION SHAREHOLDERS' EQUITY
Common Stock, no par value; 75,000,000 shares authorized; issued and outstanding: 1997 - 52,504,479; 1996 - 52,502,479
Retained Earnings Unearned Compensation Total Common Shareholders' Equity Preferred Securities of ACE:
Not Subject to Mandatory Redemption Subject to Mandatory Redemption ACE-Obligated Mandatorily Redeemable
Preferred Securities of Subsidiary Trust Holding Solely Junior Subordinated Debentures of ACE
Long Term Debt
CURRENT LIABILITIES Pref erred Stock Redemption Requirement Capital Lease Obligation-Current Portion Long Term Debt-Current Portion Short Term Debt Accounts Payable Taxes Accrued Interest Accrued Dividends Declared Def erred Income Taxes Provision for Rate Refunds Other
DEFERRED CREDITS AND OTHER LIABILITIES Def erred Income Taxes Deferred Investment Tax Credits Capital Lease Obligations Accrued Other Post Retirement Employee
The accompanying Notes to Consolidated Financial Statements are an integral part of these statements.
31
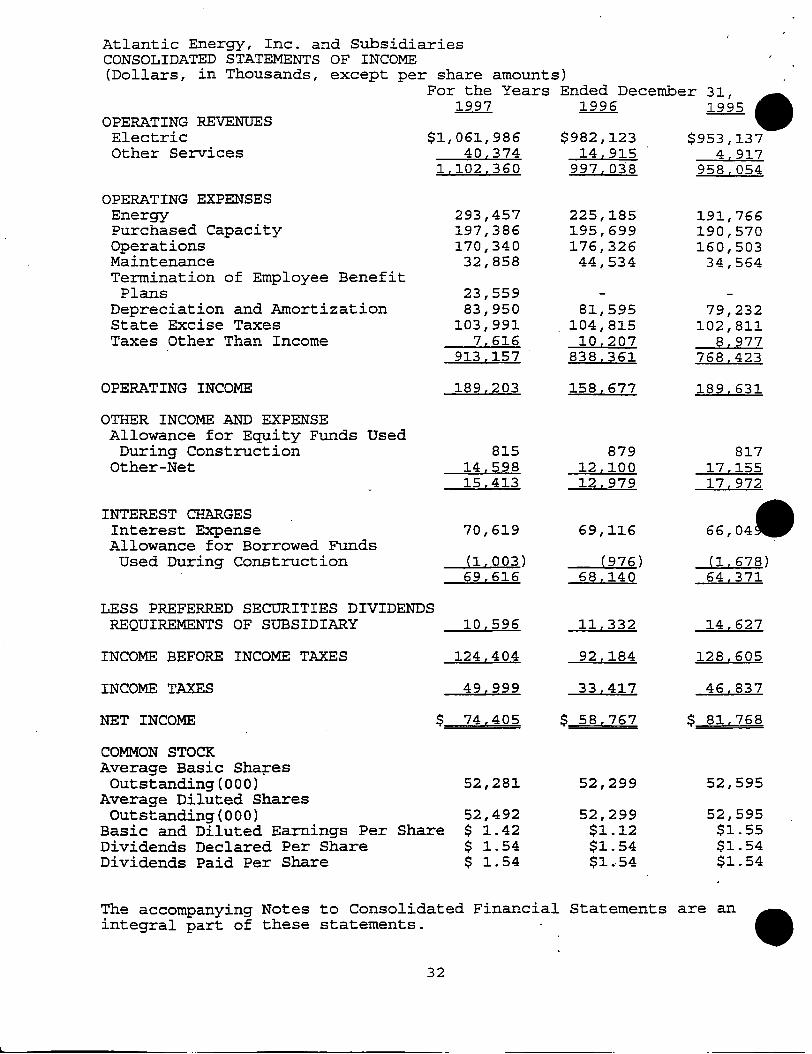
Atlantic Energy, Inc. and Subsidiaries CONSOLIDATED STATEMENTS OF INCOME (Dollars, in Thousands, except per share amounts)
For the Years Ended December 31,
• 1997 1996 1995 OPERATING REVENUES Electric $1,061,986 Other Services 40,374
1.102,360
OPERATING EXPENSES Energy Purchased Capacity Operations Maintenance Termination of Employee Benefit
Plans Depreciation and Amortization State Excise Taxes Taxes Other Than Income
OPERATING INCOME
OTHER INCOME AND EXPENSE Allowance for Equity Funds Used
During Construction Other-Net
INTEREST CHARGES Interest Expense Allowance for Borrowed Funds
Used During Construction
LESS PREFERRED SECURITIES DIVIDENDS REQUIREMENTS OF SUBSIDIARY
INCOME BEFORE INCOME TAXES
INCOME TAXES
NET INCOME
COMMON STOCK Average Basic Sha~es
Outstanding(OOO) Average Diluted Shares
Outstanding ( 000)
$
Basic and Diluted Earnings Per Share Dividends Declared Per Share Dividends Paid Per Share
293,457 197,386 170,340 32,858
23,559 83,950
103,991 7,616
913,157
189,203
815 14,598 15,413
70,619
{1,003) 69,616
10,596
124,404
49,999
74,405
52,281
52,492 $ 1.42 $ 1.54 $ 1.54
$982,123
$
14,915 997' 03'8
225,1.85 1.95,699 176,326
44,534
81,595 1.04,815 10,207
838,361.
158,677
879 12,100 12,979
69,11.6
{976) 68,140
11.332
92,184
33.417
58,767
52,299
52,299 $1.1.2 $1.54 $1. .. 54
$953,137
$
4,917 958,054
191,766 190,570 160,503
34,564
79,232 102,811
8,977 768,423
189,631
817 17,155 17,972
66,04
{1,678) 64,371
14,627
128.605
46,837
81,768
52,595
52,595 $1.55 $1.54 $1.54
The accompanying Notes to Consolidated Financial Statements are an • integral part of these statements.
32
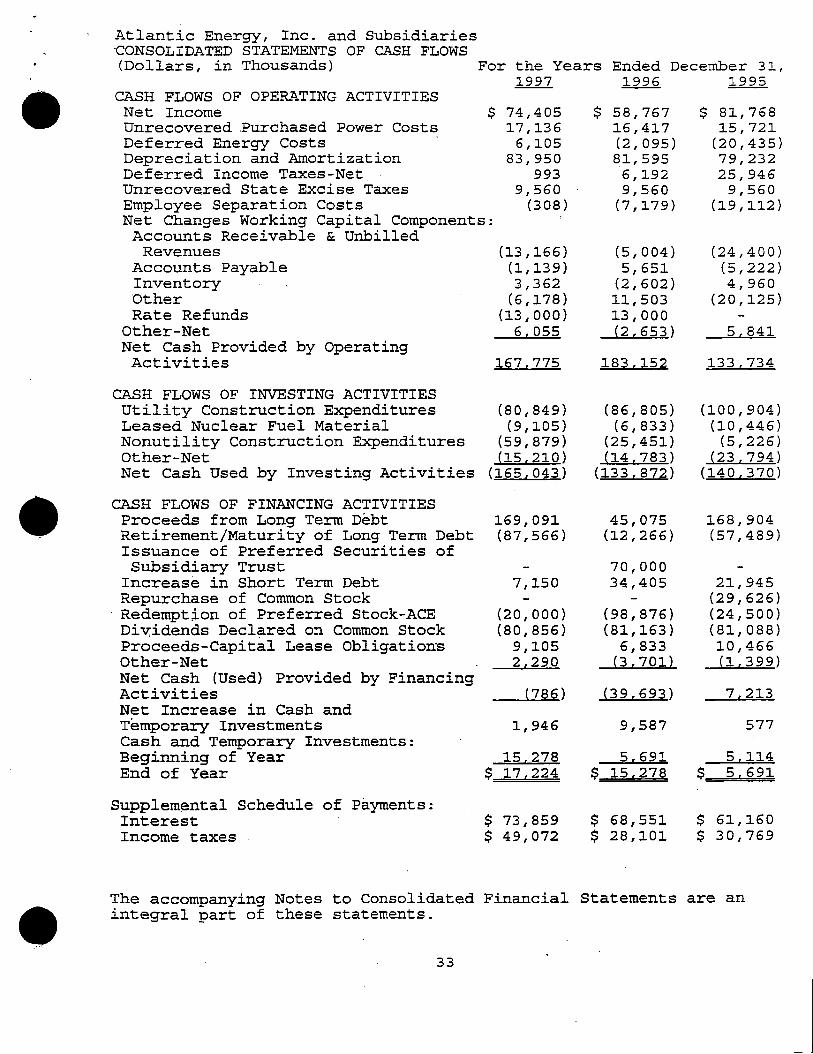
• Atlantic Energy, Inc. and Subsidiaries ·CONSOLIDATED STATEMENTS OF CASH FLOWS (Dollars, in Thousands) For the Years Ended December 31,
1997 1996 1995 CASH FLOWS OF OPERATING ACTIVITIES Net Income $ 74,405 Unrecovered Purchased Power Costs Def erred Energy Costs · Depreciation and Amortization Deferred Income Taxes-Net Unrecovered State Excise Taxes Employee Separation Costs Net Changes Working Capital Components: Accounts Receivable & Unbilled
Revenues Accounts Payable Inventory Other Rate Refunds
Other-Net Net Cash Provided by Operating Activities
CASH FLOWS OF INVESTING ACTIVITIES Utility Construction Expenditures Leased Nuclear Fuel Material Nonutility Construction Expenditures Other-Net
17,136 6,105
83,950 993
9,560 (308)
(13,166) (1,139) 3,362
(6,178) (13,000)
6,055
167,775
(80,849) (9,105)
(59,879) (15,210)
Net Cash Used by Investing Activities (165,043)
CASH FLOWS OF FINANCING ACTIVITIES Proceeds from Long Term Debt Retirement/Maturity of Long Term Debt Issuance of Preferred Securities of Subsidiary Trust
Increase in Short Term Debt Repurchase of Common Stock Redempt~on of Pref erred Stock-ACE Dividends Declared on Common Stock Pr~ceeds-Capital Lease Obligations Other-Net Net Cash (Used) Provided by Financing Activities Net Increase in Cash and Temporary Investments Cash and Temporary Investments: Beginning of Year End of Year
Supplern~ntal Schedule of Payments: Interest Income taxes
The accompanying Notes to Consolidated Financial Statements are an integral part of these statements.
33
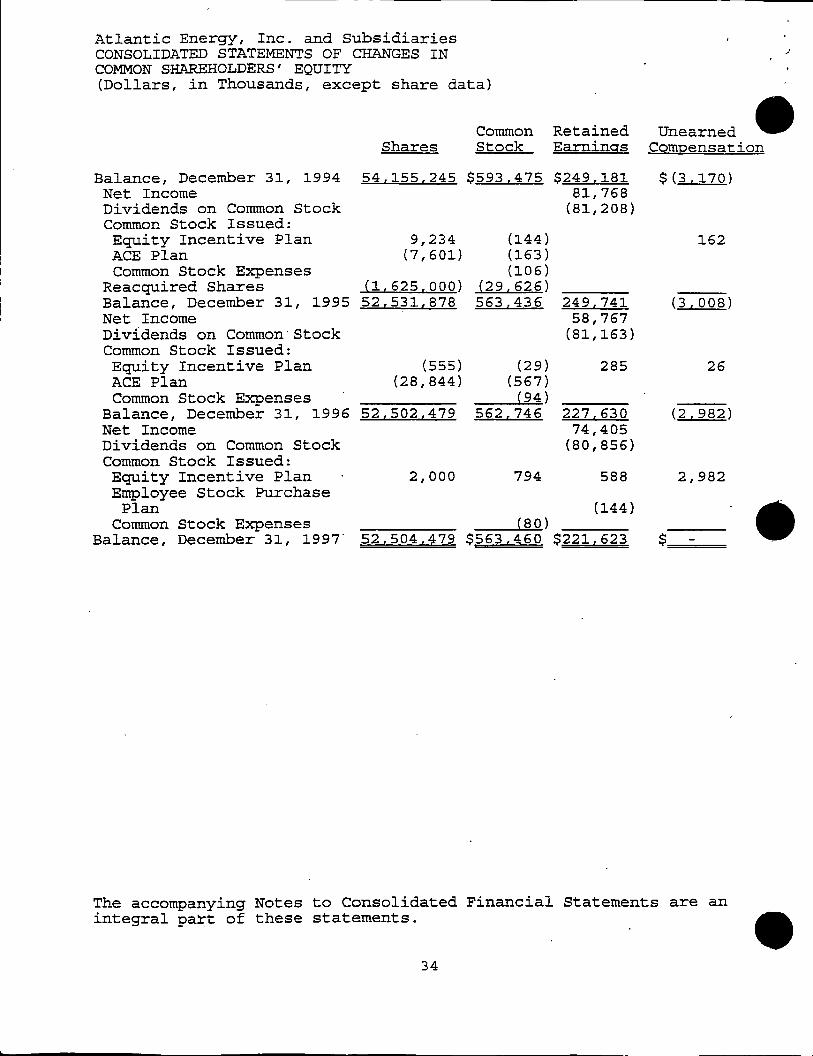
Atlantic Energy, Inc. and Subsidiaries CONSOLIDATED STATEMENTS OF CHANGES IN COMMON SHAREHOLDERS' EQUITY (Dollars, in Thousands, except share data)
Common Retained Unearned • Shares Stock Earnings Compensation
Balance, December 31, 1994 54,155,245 $593,475 $249,181 $(3,170) Net Income 81,768 Dividends on Common Stock (81,208) Common Stock Issued: Equity Incentive Plan 9,234 (144) 162 ACE Plan (7,601) (163) Common Stock Expenses (106)
Reacquired Shares (1,625,000) (29 I 626) Balance, December 31, 1995 52,531,878 563,436 249,741 (3,008) Net Income 58,767 Dividends on Common· stock (81,163) Common Stock Issued: Equity Incentive Plan (SSS) (29) 285 26 ACE Plan (28,844) (567) Common Stock Expenses {94)
Balance, December 31, 1996 52,502,479 562,746 227,630 (2,982) Net Income 74,405 Dividends on Common Stock (80,856) Common Stock Issued: Equity Incentive Plan 2,000 794 588 2,982 Employee Stock Purchase
Plan (144) Common Stock Expenses { 80)
Balance, December 31, 1997" 52,504,479 $563,460 $221,623 $
The accompanying Notes to Consolidated Financial Statements are an integral part of these statements.
34
e
•
•
Atlantic Energy, Inc. and Subsidiaries
NOTES TO THE CONSOLIDATED, FINANCIAL STATEMENTS
NOTE 1. ORGANIZATION AND SIGNIFICANT ACCOUNTING POLICIES
Organization Atlantic Energy, Inc. (the Company, AEI or parent) plans to merge with Delmarva Power & Light Company (DP&L) into a new company named Conectiv, Inc. (Conectiv) effective March 1, 1998. The Company is the parent of Atlantic City Electric Company (ACE), Atlantic Energy Enterprises, Inc. (AEE) and Atlantic Energy International, Inc. (AEII), which are wholly-owned subsidiaries. In October 1997, the Company and DP&L entered into an agreement to form Conectiv Solutions, LLC, a limited liability corporation to market and sell offerings of energy and energy-related and other value-added services to large energy users.
ACE is a public utility primarily engaged in the generation, purchase, transmission, distribution and sale of electric energy. Sales of electric energy include sales at regulated retail and unregulated wholesale levels. ACE's service territory encompasses approximately 2,700 square miles within the southern one-third of New Jersey with the majority of customers being residential and commercial. ACE is the principal subsidiary within the consolidated group.
AEE is a holding company which is responsible for the management of the investments in the fo~lowing nonutility companies: Atlantic Generation, Inc. (AGI) is engaged in the development, acquisition, ownership and operation of cogeneration power projects. AGI's activities are represented by partnership interests in· cogeneration facilities in New Jersey. Atlantic Southern Properties, Inc. (ASP) owns and manages commercial offices and warehouse facilities located in Atlantic County, New Jersey. ATE Investment, Inc. (ATE) provides financing to affiliates and manages a portfolio of investments in leveraged leases for equipment used in the airline and shipping industries. ATE joined with an unaffiliated company to create EnerTech Capital Partners, L.P. (Enertech), a limited partnership that invests in a variety of energy-related technology growth companies. Atlantic Thermal Systems, Inc. {ATS) is engaged in the development and operation of thermal heating and cooling systems. CoastalComm, Inc. (CCI) is engaged in fiberoptic network development, construction, and site services. AEE also has a 50% equity interest in Enerval, LLC {Enerval) which provides energy management services, including natural gas supply, transportation and marketing.
AEII was organized to pursue utility consulting services and equipment sales to international markets. The Company is in the process of dissolving AEII.
Principles of Consolidation . The consolidated financial statements include the accGunts of the Company and its subsidiaries. All significant intercompany
35
Atlantic Energy, Inc. and Subsidiaries
accounts and transactions have been eliminated in consolidation. ACE, and AEE consolidate their respective subsidiaries. Ownership interests in other entities, between 20% and 50%, where control is evident, are accounted for using the equity method of accounting.
Use of Estimates The preparation of financial statements in conformity with GAAP requires management at times to make certain judgments, estimates and assumptions that affect amounts and matters reported at the year end dates and for the annual periods presented. Actual results could differ from those estimates. Any change in the judgments, estimates and assumptions used, which in management's opinion would have a significant effect on the financial statements, will be reported when management becomes aware of such changes.
Reclassification Certain prior year amounts have been reclassified to conform to the current year reporting of these items. The most notable reclassification, with no effect on net income, pertains to the Company's nonutility activities previously reported in the Other Income line on the Consolidated Statement of Income. The revenues, operating expenses and income taxes from those operations are now reflected on the appropriate line items.
Regulation - ACE The accounting policies and rates of service for ACE are subject to the regulations of the New Jersey Board of Public Utilities (BPU) and in certain respects to the Federal Energy Regulatory Commission (FERC) . ACE follows generally accepted accounting principles (GAA and financial reporting requirements employed by all industries as specified by the Financial Accounting Standards Board (FASB) and the Securities and Exchange Commission (SEC). However, accounting for rate regulated industries may depart from GAAP as permitted by Statement of Financial Accounting Standards No. 71 "Accounting for the Effects of Certai~ Types of Regulation" (SFAS No. 71) . SFAS No. 71 provides guidance on circumstances where the economic effect of a regulator's decision warrants different applications of GAAP as a result of the rate making process. In setting rates, a regulator may provide recovery of an incurred cost in a year or years other than the year the cost was incurred. As permitted by SFAS No. 71, costs ordered by a regulator to be def erred or capitalized for future recovery are recorded as a regulatory asset because the regulator's rate action provides reasonable assurance of future economic benefits attributable to these costs. In a non-rate regulated industry, such costs are charged to expense in the year incurred. SFAS No. 71 further specifies that a regulatory liability is recorded when a regulator orders a refund to customers of revenues previously collected, or when existing rates provide for recovery of future costs not yet incurred. Such treatment is not afforded to non-rate regulated companies. When collection of regulatory assets or relief of regulatory liabi~ities is no longer probable, the assets and liabilities are applied to income in the year that the assessment is made. (See Note 12-Electric Utility Industry Restructuring and Stranded Costs for further discussion about the effects of regulation in a • competitive environment). Specific regulatory assets and liabilit' that have been recorded are discussed in Note 13. .
36
•
•
Atlantic Energy, Inc. and Subsidiaries
Operating Revenues ACE'S electric operating revenues are recognized when electric energy services are r~ndered, and include estimates for amounts unbilled at the end of the period for energy used by customers subsequent to the last bill rendered for the calendar year. ACE also records revenues for non-regulated wholesale energy market sales transactions as they occur.
Other services revenues primarily represent revenues of ATS which are recognized when heating and cooling services are rendered and include estimates for amounts consumed by but not yet billed to customers at the end of the period.
Nuclear Fuel - ACE Fuel costs associated with ACE's participation in jointly-owned nuclear generating stations, including spent nuclear fuel disposal costs, are charged to Energy expense based on the units of thermal energy produced.
Electric Utility Plant Property is stated at original cost. Generally, Utility Plant is subject to a first mortgage lien. The cost of property additions, including replacement of units of property and betterments, are capitalized. Included in certain property additions is an Allowance for Funds Used During Construction (AFDC), which is defined in the applicable regulatory system of accounts as the cost, during the period of construction, of· borrowed funds used for construction purposes and a reasonable rate on other funds when so used. AFDC has been calculated using a semi-annually compounded rate of 8.25% for all periods.
Nonutility Property and Equipment Nonutility Property and Equipment are generally stated at cost and includes project development costs· and construction work in progress, including capitalized interest, relate~ to the development and construction of thermal heating and cooling systems of ATS. ASP's commercial sites, including the cost of improvements and certain preacguisition costs are stated at the lower of cost or fair market value. Capitalized interest related to nonutility expenditures was $3.7 million for 1997.
Depreciation ACE provides for straight-line depreciation based on the following: transmission and distribution property - estimated remaining life; nuclear property - remaining life of the related plant operating license in existence at the time of the last base rate case; other depreciable property - estimated average service life. ACE's overall
.composite rate of depreciation was 3.3% for the last three years. Accumulated depreciation is charged with the cost of depreciable property retired together with removal costs less salvage and other recoveries.
ASP's facilities are being depreciated over a thirty-one and one-half year life using the straight-line method. Land improvements are being depreciated using an accelerated method over a fifteen year life. Furniture and equipment are depreciated over lives ranging from three
37
Atlantic Energy, Inc. and Subsidiaries
to seven years. ATS's Midtown Energy Center and its components will be depreciated on a straight-line basis over their respective useful lives starting in January 1998.
Nuclear Plant Decommissioning Reserve - ACE • A reserve for decommissioning costs is presented as a component of accumulated depreciation and amounted to $80.7 million and $70.2 million at December 31, 1997 and 1996, respectively. The Securities and Exchange Commission (SEC) has questioned certain accounting practices employed by the electric utility industry concerning decommissioning costs for nuclear generating facilities. In 1996, the FASB issued a Proposed Statement of Financial Accounting Standard 11 Accounting for Certain Liabilities Related to Closure or Removal of Long-lived Assets 11 which would establish accounting standards for certain obligations that are incurred for the closure and· removal of long-lived assets. In January 1998, the FASB changed the title of its project to 11 Accounting for Obligations Related to the Retirement of Long-Lived Assets", which continues to include nuclear plant decommissioning costs. Under the original proposed statement a regulated utility would recognize a regulatory asset or liability for differences, if any, in the timing of recognition of the costs of closure and removal of assets for financial reporting purposes and rate making treatment. The Company cannot predict when the FASB will issue a final accounting standard or the outcome of this matter at this time.
Def erred Energy Costs - ACE As approved by the BPU, ~CE -has a Levelized Energy Clause (LEC) through which energy and energy-related costs (energy costs) are charged to customers. LEC rates are based on projected energy cos·· and prior period underrecoveries or overrecoveries. Generally, en costs are recovered through levelized rates over the period of . projection, which is usually a 12-month period. In any period, the actual amount of LEC revenues recovered from customers may be greater or less than the recoverable amount of energy costs incurred in that period. Energy expense is adjusted to match the associated LEC revenues. Any underrecovery (an asset representing energy costs incurred that are to be collectea from customers) or overrecovery (a liability representing previously collected energy costs to be returned to customers} of costs is deferred on the Consolidated Balance Sheet as Deferred Energy Costs. These deferrals are recognized in the Consolidated Statement of Income as Energy expense during the period in which they are subsequently included in the LEC.
License Fees ATS has entered into agreements with six hotel casino's in Atlantic City, New Jersey to operate their heating and cooling systems. As part of these agreements, ATS has paid $27.5 million in fees to date, for the right to operate and service such systems for a period of 20 years. These fees are recorded on the balance sheet as License Fees and are being amortized over the life of the agreements.
Income Taxes Deferred Federal and state income taxes are provided on all significant temporary differences between book bases and t~ base~·· ·· assets and liabilities, transactions that reflect taxable income 1 ·
38
• ~tlantic Energy, Inc. and Subsidiaries
year different than book income and tax carryforwards. Investment tax credits previously used for income tax purposes have been deferred on the Consolidated Balance Sheet and are recognized in book income over the life of the related property. The Company and its subsidiaries file a consolidated Federal income tax return. Income taxes are allocated to each of the companies within the consolidated group based on the separate return method.
Cash & Temporary Investments AEI and ACE consider all highly liquid investments and debt securities purchased with a maturity of three months or less to be cash equivalents.
Earnings Per Comm.on Share The FASB issued Statement No. 128, "Earnings Per Share"(SFAS No.128) which specifies the computation, presentation and disclosure requirements of earnings per share for entities with publicly held common stock and potential common stock. Earnings per share (EPS) presented on the face on the consolidated income statement has been calculated to reflect the adoption of SFAS No. 128 by the Company. Basic EPS is computed based upon the weighted average number of common shares, excluding contingently issuable shares, outstanding during the year. Diluted EPS is computed based upon the weighted average number of common shares including contingently issuable shares and other dilutive items. The difference between the 1997 basic and diluted EPS reflects the effects of the EIP shares which are considered to be outstanding throughout 1997 for the diluted EPS calculation. Contingently issuable shares existed for all periods but were not included in the diluted EPS computation for 1996 and 1995 because the restrictions were determined to not be met at the end of the period. Options existed for 1996 and 1995 but were not included as common stock equivalents in the dilutive calculation because they were antidulitve. See Note 5 - Benefits for further discussion of the EIP.
Other Debt premium, discount and expense of ACE are amortized over the life of the related debt. Premiums associated with the 1996 Pref erred Stock redemptions are being deferred and amortized over the life of the related ACE Obligated Mandatorily Redeemable Preferred Securities of Subsidiary Trust Holding Solely Junior Subordinated Debentures of ACE in accordance with BPU approval.
In June 1997, the FASB issued Statement No. 130 "Reporting Comprehensive Income" and Statement No. 131 "Disclosure About Segments of an Enterprise and Related Information". These statements are effective for fiscal years beginning after December 15, 1997. Since these statements are primarily disclosure related, the Company currently believes that they will not have a significant effect on the Consolidated Financial Statements.
NOTE 2 • INCOME TAXES
The components of Federal income tax expense for the years ended December 31 are as follows:
on Leveraged Leases (136) (78) (28) Total Federal Income Tax Expense $49,820 $33,570 $46,448
A reconciliation of the expected Federal income taxes compared to the reported Federal income tax expense computed by applying the statutory rate for the years ended December 31 follows:
Statutory Federal Income Tax Rate (000) Income Tax Computed at the Statutory Rate
Plant Basis Differences Amortization of Investment Tax
Credits Other-Net Total Federal Income Tax Expense Effective Federal Income Tax Rate
1997 35%
$45,166 4,952
(2,670) 2,372
$49,820 39%
1996 35%
$36,058 3,096
(2,612) (2,972)
$33,570 33%
1995 35%
$49,995 1,307
(2,562) (2' 292)
$46,448 33%
The increase in the effective Federal income tax expense rate is due primarily to permanently non-deductible merger and merger related expenses. State income tax expense is not significant.
Items comprising def erred tax balances as of December 31 are as follows: (000) 1997 1996
Deferred Tax Liabilities: Plant Basis Differences $332,288 $326,673 Leveraged Leases 76,362 76,671 Unrecovered Purchased Power Costs 16,813 22,630 State Excise Taxes .16' 326 20,141 Other 38,481 33,192
Total Def erred Tax Liabilities 480,270 479,307 Deferred Tax Assets: Deferred Investment Tax Credits 23,775 25,143 Other 15,797 16,866
Total Def erred Tax Assets 39,572 42,009 Total Deferred Taxes-Net $440,698 $437,298
At December 31, 1997 and 1996, deferred tax assets exist for cumulative state income tax net operating loss (NOL's) carryforwards. At December 31, 1997 unexpired state NOL's amount to approximately $60.6 million, with expiration dates from 1998 through 2004. As of December 31, 1997, deferred state tax assets of $5.5 million offset by a valuation allowance of $4.0 million have been recorded. ·
On July 14, 1997 the Governor signed a bill into law eliminating· the Gross Receipts and Franchise Tax {GR & FT) paid by the
•
electric, natural gas and telecommunication public utilities. In • its place, utilities will be subject to the state's corporate
40
• Atlantic Energy, Inc. and Subsidia·ries
business tax. In addition, the state's existing sales and use tax will be expanded to include retail sales of electric power and natural gas, and a transitional energy facility assessment tax (TEFA) will be applied for a limited time on electric and natural gas utilities and will be phased-out over a five year period. The law took effect January 1, 1998 and on January 1 of each of the years thereafter, the TEFA will be reduced by 20%. By the year 2003, the TEFA will be fully phased-out and the savings will be passed through to ACE's customers. As a result of this law, ACE will record deferred state taxes beginning in 1998 for state tax basis versus book basis differences.
NOTE 3. RATE MATTERS OF ACE
Energy Clause Proceedings
Changes in Levelized Energy Clause Rates 1995 - 1997
Amount Amount Date Requested Granted Filed (millions) (millions)
4/95 $37.0 $37.0 3/96 49.7 27.6 2/97 20.0
ACE's LEC is subject to annual review by the BPU.
Date Effective
7/95 7/96
In July 1995, the BPU approved a provisional increase of $37 million in annual LEC revenues for the period June 1, 1995 through May 31, 1996. The BPU approved a continuance of the provisional increase in March 1996.
In March 1996, ACE requested a $49.7 million increase in 1996-1997 annual revenues effective June 1, 1996. Through a stipulation reached and approved in July 1996 among ACE, the New Jersey Division of the Ratepayer Advocate (Ratepayer Advocate) and the Staff of the BPU (collectively, the parties), ACE implemented provisional rates reflecting an increase of annual LEC revenues of $27.6 million. The BPU approved a continuance of the provisional rates in December 1996 when the Salem Station replacement power issues, ~mong others,· were resolved.
In December 1996, the BPU issued an Order approving a stipulation of settlement reached among the parties settling the issues regarding replacement power costs related to an extended Salem Nuclear Generating station (Salem) outage and a 1994 Salem Unit 1 outage. The stipulations provided that ACE's replacement power costs for.the Salem Station outage, up to each Unit's agreed-upon return-to-service date (June 30, 1997 for Unit 1 and.December 31, 1996 for Unit 2), and the 1994 Salem Unit 1 oµtage would be recoverable in LEC rates implemented in ACE's next LEC filing.
In February 1997, ACE filed a petition with the BPU requesting an increase in 1997-1998 annual LEC revenues of $20.0 million to be
41
Atlantic Energy, Inc. and Subsidiaries
made effective for service rendered on and after June 1, 1997. The increase requested is primarily the result of ACE seeking recovery of previously deferred costs, which includes recovery of the Salem Station replacement power costs in accordance with the Orders issued in December 1996. In April 1997, ACE's filing was transferred to the Office of Administrative Law and evidentiary hearings have been completed. The administrative Law Judge's (ALJ) initial decision is expected in the first quarter of 1998.
ACE expects to file a petition with the BPU during the first quarter of 1998 requesting an increase in 1998-1999 annual LEC revenues.
Other Rate Proceedings
On July 15, 1997, ACE filed its electric industry restructuring plan with the BPU, as required by the Energy Master Plan, proposing ACE's plans to move to retail access and the possible effect on rates. (See Not~ 12 - ACE's Electric Utility Restructuring and Stranded Costs) .
In 1996, the BPU declared base rates associated with ACE's 7.41~ ownership in Salem interim and subject to refund. In December 1996, the BPU issued an Order approving a stipulation of settlement reached among the parties regarding the issue of base rates. In January and February 1997, in accordance with the stipulation, ACE provided credits to customers totaling $12 million. An additional credit of $1 million resolved an allegation previously made.by the Ratepayer Advocate that ACE, along with other New Jersey electric utility companies, were recovering cogeneration capacity costs concurrently in base rates and LEC rates.
In December 1997, the BPU approved an increase in annual base rate revenues of $5.0 million for recovery of expenses associated with post-retirement benefits other than pensions {OPEB). Also in a related action to this matter, the BPU approved the request for a change in ownership to merge AEI into Conectiv and found that an annual rate decrease of $15.8 million should be provided to ACE's customers effective with the merger. The BPU ordered a pre-merger credit of $5.0 million to offset the increase in rates associated with OPEB. This increase was effective on January 1,
· 1998. See Notes 5 and 13 for further information regarding OPEB expenses and the corresponding regulatory asset and Note 4 for further information regarding the merger.
42
~ I
•
•
.. Atlantic Energy, Inc. and Subsidiaries
NOTE 4. MERGER
On August 12, 1996, the Boards of Directors of AEI and Delmarva Power & Light Company (DP&L) jointly announced an agreement to merge the companies into a new company named Conectiv, Inc. (Conectiv). Conectiv, a newly formed Delaware corporation, became the parent of AEI's subsidiaries and the parent of DP&L and its subsidiaries effective March 1, 1998. See discussions on approvals below ..
DP&L is predominately a public utility engaged in electric and gas service. DP&L provides retail and wholesale electric service to customers located in about a 6,000 square mile territory located in Delaware, eastern shore counties in Maryland and the eastern shore area of Virginia. DP&L provides gas service to retail and transportation customers in an area consisting of about 275 square miles in Northern Delaware, including the City of Wilmington.
The merger is to be a tax-free, stock-for-stock transaction accounted for under the purchase method of accounting with DP&L as· the acquirer. Under the terms of the agreement, DP&L shareholders will receive one share of Conectiv's common stock for each share of DP&L common stock held. AEI shareholders will receive 0.75 shares of Conectiv's common stock and 0.125 shares of Conectiv's Class A common stock for each share of AEI common stock held.
On January 30, 1997, the merger was approved by the shareholders of both companies. Approvals have since· been obtained from the FERC, Delaware and Maryland Public Service Commissions, the Virginia State Corporate Commission, the Pennsylvania Public Utilities Commission, the BPU and the Nuclear Regulatory Commission (NRC) . The last and final approval was received from the SEC on February 25, 1998. The merger became effective March 1, 1998.
Under the terms of the BPU's approval of the merger, approximately 75 percent or $15.75 million of ACE's total average projected annual merger savings will be returned to ACE's customers for an overall merger-related reduction of 1.7 percent.
The total consideration to be paid to the Company's common stockholders, measured by the average daily.closing market price of the Company's common stock for the three trading days immediately preceding and the three trading days immediately following the public announcement of the merger, is $921.0 million. The consideration paid plus estimated acquisition costs and liabilities assumed in connection with the merger are expected to exceed the net book value of the Company's net assets by approximately $200.5 million, which wili be recorded as goodwill by Conectiv. The actual amount of goodwill.recorded will be based on the Company's net assets as of the merger date and, accordingly, will vary from this estimate which is based on the Company's net assets as of December 31, 1997. The goodwill will be amorti·zed over 40 years. Selected information on each company at December 31, 1997 and the
43
Atlantic Energy, Inc. and Subsidiaries
year then ended is shown below (in thousands, ex~ept for number of customers) :
Operating Revenues Net Income Assets Electric Customers Gas Customers
AEI
$1,102,360 $ 74,405 $2,723,884
480,960
DP&L (Unaudited) $1,423,502 $ 105,709 $3,015,481
448,323 103,248
Combination of the above amounts would not necessarily be reflective of the amounts that wou~d result from a consolidation of the companies.
On June 26, 1997, the Company and DP&L jointly announced an enhanced retirement off er and separation program that will be utilized to achieve workforce reductions as a result of the merger. The Company and DP&L initially anticipated a combined loss of approximately 400 positions to accomplish the mergerrelated rate reductions to customers. This initial level of reductions will be achieved primarily through the DP&L early retirement and the Company's enhanced retirement programs. Additional reductions are also anticipated to better align staffing requirements to skill and work process needs. The combined additional reductions could range between 250 to 350 positions. The total cost to the Company for these programs, as well as the cost of executive severance, employee relocation and facilities integration is estimated to range from $38 million to $43 million. ACE is required to recognize these costs through expense in accordance with GAAP. The actual cost to the Company and ACE will depend on a number of factors related to the employee mix as well as the actual number of ~mployees who will be eligible for the enhanced retirement or separation programs.
In the fourth quarter of 1997, the Company recorded an expense of $23.6 million as a result of terminating certain benefit programs of the Company in anticipation of the merger. Termination of the plans resulted in charges of $10.0 million for a supplemental executive retirement plan, $6.3 million due to a pension plan curtailment, $3.8 million from the EIP and $3.5 million from other benefit plans and executive contract terminations. See Note 5. below for discussion of the effects on the defined pension plan and the EIP.
NOTE 5. BENEF~TS
Retirement Benefits - ACE
Pension
ACE has a noncontributory defined benefit pension plan covering substantially all of its employees. Benefits are based on an employee's years of service and average final pay. ACE's policy· is to fund pension costs within the range of the minimum required • by the Employee Retirement Income Security Act and the maximum allowable as a tax deduction.
44
Atlantic Energy, Inc. and Subsidiaries
Net periodi.c pension costs include: ( 000) ~ 1996 1995 Service cost-benefits earned
during the period $ 6,763 $ 6,870 $ 6 I 363 Interest cost on projected benefit obligation 15,840 14,569 14,794
Actual return on plan assets (39 I 394) (36,443) (44 I 067) Other-net 251611 191123 281379 Net periodic pension costs $ 81820 $ 4,119 $ 5,469
Of these costs for 1997, $6.3 million was due to a curtailment as a result of the lump-sum payments to certain plan participants who will terminate employment effective with the consummation of the merger or shortly then after. This amount is included in the Termination of Employee Benefit Plans line item of the Consolidated Statement of Income. Of the remaining net periodic payment costs, $1.9 million was charged to operating expense in 1997. In 1996 and 1995 $3.0 million annually was charged to operating expense. The remaining costs, which are associated with construction labor, were charged to the cost of new utility plant. Actual return on plan assets and Other-net for 1997 and 1996 primarily reflect the favorable market conditions from the investment of plan assets and expe~ted returns.
A reconciliation of the funded status of the plan as of December 31 is as follows:
( 000) Fair value of plan assets Projected benefit obligation Plan assets in excess of projected benefit obligation
Unrecognized net transition asset Unrecognized prior service cost Unrecognized net gain Prepaid pension cost Accumulated benefit obligation: Vested benefits Nonvested benefits Total
1997 $259,500
2391000
20,500 (1,532)
232 (10,810)
$ 8,390
$207,102 1"487
$2081589
1996 $236,000
2071340
28,660 (1,377)
259 (18,958)
$ 81584
$170,751 21023
$1721774
At December 31, 1997, appr9ximately 66% of plan assets were invested in equity securities, 27% in fixed income sec~rities and 7% in other investments. The assumed rates used in determining the actuarial present value of the projected benefit obligation at December 31 were as follows:
Weighted average discount Anticipated increase in compensation Assumed long term rate of return
1997 7.0% 3.5% 9.0%
Other Postretirement Employee Benefits (OPEB)
1996 1995 7.5% 7.0% 3.5% 3.5% 8.5% 8.5%
ACE provides certain health care and life insurance benefits for retired employees ·and their eligible dependents.. Substantially
45
Atlantic Energy, Inc. and Subsidiaries
all employees may become eligible for these benefits if they reach retirement age while working for ACE. Benefits are provided through insurance companies and other plan providers whose premiums and related plan costs are based on the benefits paid during the year. ACE has a tax-qualified trust to fund these benefits.
Net periodic other postretirement benefit costs include: (ODO) 1997 1996 1995 Service cost-benefits attributed to service during the period
Interest cost on accumulated postretirement benefits obligation
Actual return on plan assets Amortization of unrecognized transition obligation
Other-net
$ 2,531
6,843 (800)
2,768 (475)
$ 2,688
7,482 (771)
2,768 215
Net periodic other postretirement costs $10,867 $12,382
These costs were allocated as follows: (millions) Operating expense New utility plant-associated with construction labor
Regulatory asset
1997 $3.0
3.0 4.9
1996 $3.6
2.4 6.4
$ 2,891
8,107 (1,437)
3,893 404
$13 '"858
1995 $3.1
2.5 8.3
The regulatory asset represents the amount of annual costs in excess of the amount of cost currently recovered in rates. These excess costs were def erred as authorized by an accounting order of the BPU pending future recovery through rates. ACE will begin to recover these costs over a 15 year period beginning in 1998. See Note 3 and Note 13 for additional information.
A reconciliation_ of the funded status of the plan as of December 31 is as follows: (ODO) Accumulated benefits obligation: Retirees Fully eligible active plan participants Other active plan participants Total accumulated benefits obligation Less fair value of plan assets Accumulated benefits obligation in excess of plan assets
Unrecognized net loss Unamortized unrecognized transition obligation
Accrued other postretirement benefits cost obligation
1997
$ 51,786 6,075
45,963 103,824 20,100.
"83,724 (4,727)
(41. 521)
$ 37,476
1996
$ 63,095 4,038
39,972 107,105
18,000
89,105 (12 I 207)
(44,289)
$ 32,609
At December 31, 1997, approximately 73% of "plan assets were invested in fixed income securities and 27% in other investments .
The assumed health care costs trend rate for 1998 is 7% and is assumed to evenly decline to an ultimate constant rate of 5% in
46 •
Atlantic Energy, Inc. and Subsidiaries
the year 2001 and thereafter. If the assumed health care costs trend rate was increased by 1% in each future year, the aggregate service and interest costs of the 1997 net periodic benefits cost would ·increase by $1.2 million, and the accumulated postretirement benefits obligation at December 31, 1997 would increase by $10.8 million. The weighted average discount rate assumed in determining the accumulated benefits obligation was 7.0%, 7.5% and 7.0% for 1997, 1996 and 1995, respectively. The assumed long term return rate on plan assets was 7% for each of the three year periods.
Other
Savings and Investment Plans A and B (401(k))
ACE has two 401(k) plans one for union and another for non-union employees that match plan contributions up to 6% of a participating employee's base pay. The rate at which Company contributions are made is 50%. All full and part-time employees are eligible to participate.· The cost of the plans for 1997, 1996 and 1995 was $2.0 million, $1.9 million and $1.9 million, respectively.
Equity Incentive Plan(EIP) - AEI
E~igible participants of the EIP are officers, general managers and nonemployee directors of the Company and its subsidiaries. Under the EIP, nonemployee-director participants are entitled to receive a grant of 1,000 shares of restricted stock. Restrictions on these grants expire over a five-year period. Employee participants may be awarded shares of restricted common stock, stock options and other common stock-based awards. Actual awards of restricted shares are based on attainment of certain Company performance criteria within a three-year period. Restrictions lapse upon actual award at the end of the three-year performance period. Shares not awarded are forfeited. Dividends earned on restricted stock-issued through the EIP are invested in additional restricted stock under the EIP which is subject to the same award criteria.
Restricted stock activity of the EIP was as
Balance, December 31, 1994 Issued/Granted Forfeited -Balance, December 31, 1995 Issued/Granted Forfeited Balance, December 31, 1996 Issued/Granted Awarded Balance, December 31, 1997
Restricted Shares
175,712 24,435 (7,587)
192,560 237,782
(207,805) 222,537
22,255 (244, 792)
-0-
follows: Weighted Average
Fair Value Grant Date
20.975
20.697
19.160 17.376
The 1997, 1996 and 1995 restricted shares granted include 20,255 shares, 13,786 shares and 7,614 shares, respectively, purchased on the open market from reinvestment of dividen~s on EIP shares outstanding. On November 13, 1997, the Board of Directors of the
47
Atlantic Energy, Inc. and Subsidiaries
Company in accordance with the EIP provisions with respect to a potential change in control declared that the restrictions applicable to any of the Restricted Stock removed and shares deemed fully vested. Distribution of the awards could be either in cash or common stock, based on the election of the participant. The change in control price was established at $19.50 per share. In the fourth quarter the Company recognized $3.7 million in expense due to the termination of the plan with respect to the restricted shares. Compensation expense for 1996 and 1995 for the restricted stock has been measured based on the intrinsic value of the stock. The total compensation expense for the years 1996 through 1995 amounted to less than $.7 million and reflect an adjustment for the restricted shares associated with the first three-year period that were not awarded and were forfeited.
In addition, the Board took appropriate action with respect to the Stock Options issued pursuant to the EIP. The Company recognized $.1 million in expense due to the termination of the plan with respect to the options forfeited under phase II of the EIP. The options associated with phase 1 of the EIP Plan were forfeited because grant price exceeded the established change in control price.
The combined effects of accounting for restricted shares and options under the EIP plans consistent with the fair value disclosure requirements of SFAS No.· 123 upon the net income of the Company would have been a reduction in expense of $.4 million in 1997 and an increase in expense of less than $.2 million in
48
•
/
Atlantic Energy, Inc. and Subsidiaries
1996. The effect of the application of SFAS No. 123 on basic and diluted earnings per share for both 1997 and 1996 is less than one cent.
NOTE 6. JOINTLY-OWNED GENERATING STATIONS - ACE
ACE owns jointly with other utilities several electric generating facilities. ACE is responsible for its pro-rata share of the costs of construction, operation and maintenance of each facility.
The amounts shown represent ACE's share of each facility at, or for the year ended, December 31, including AFDC as appropriate.
ACE provides financing during the construction period for its share of the jointly-owned facilities and includes i~s share of direct operations and maintenance expenses in the Consolidated Statement of Income. Additionally, ACE proviaes an amount of working funds to the operators of the facilities to fund
Atlantic Energy, Inc. and Subsidiaries
operational needs. The decrease in Operations and Maintenance for Salem reflects the effects of the December 31, 1996 agreement ACE entered into with Public Service Electric & Gas (PS) in its capacity as operator of Salem for the purpose of limiting ACE's exposure to operation and maintenance expenses to be incurred during calendar year 1997. See Note 11 for further information concerning Salem Nuclear Generating .Station.
NOTE 7. NONUT:IL:ITY COMPANIES
Principal assets of each of the subsidiary companies of AEE at December 31, 1997 were: AGI - investments of approximately $18.7 million in cogeneration facilities; ASP - commercial real estate properties with a net book value of $9.2 million; ATE -leveraged lease investments of $80.4 million and $10.2 million invested in EnerTech Capital Partners, L.P.; ATS - construction costs in thermal heating and cooling projects of $84.8 million.
Other financial information regarding the subsidiary companies is as follows:
Net Worth Company 1997 1996 (000)
AGI $22,000 $21,361 ASP (99) S61 ATE 17,010 11,139 ATS 10,394 2,498 CCI 948 S44
AGI's results in each year primarily reflect the equity in earnings of cogeneration facilities in which AGI has an ownership interest. AGI's 1996 results reflect the contingency of a $1.6 million net of tax loss from the sale of a cogeneration facility located in New York.
ASP's results in eac~ year reflect the vacancy in its commercial site due to generally poor market conditions in commercial real estate. Additionally, 1996 includes ·a net after tax write-down the carrying value of the commercial site of $0.8 million.
so
of
Atlantic Energy, Inc. and Subsidiaries
ATE's 1997 net income reflects reductions in interest expense and an income tax benefit offset in-part by a $0.9 million after tax loss in ATE's investment in Enertech Capital Partners, L.P.
ATS's 1997 results reflect earnings generated from the operation and maintenance of customer heating and cooling facilities, offset in-part by increased amortization and interest expense related to the license fees. ATS's 1996 results primarily reflect administrative and general costs for business development and construction of heating and cooling systems. See Note 1 - License Fees for further discussion.
AEI and AEE parent-only operations, excluding equity in the results of subsidiary companies, generally reflect administrative and general expenses for management of their respective · subsidiaries.
AEI incurred losses of $4.1 million and $3.6 million in 1997 and 1996, respectively. AEI's 1997 results reflect increased interest expense in addition to a $.5 million after tax loss from the investment in Conectiv Solutions, LLC. AEI's 1996 results reflect the impact of merger-related costs and interest charges. The interest charges which affect. all three years of operation are associated with a line of .credit established to fund certain affiliated capital needs, the repurchase of common stock and general corporate purposes.
AEE incurred losses of $4.9 million and $1.7 million in 1997 and 1996, respectively. AEE's 1997 results include an after-tax loss of $2.2 million from its equity investment in Enerval and a $0.9 million charge for the Termination of Employee Benefit Plans. AEE's 1996 activity reflects an after tax loss of $1.1 million from its investment in Enerval due to a combination of unhedged gas sales agreements and higher spot market prices.
NOTE 8. CUMULATIVE PREFERRED SECURITIES OF ACE
The embedded cost of ACE Preferred Securities as of December 31, 1997, 1996 and 1995 was 7.5%, 7.4% and 7.4%.
At December 31, 1997, the minimum annual sinking fund requirements of the cumulative Preferred Stock Subject to Mandatory Redemption over the next five years are~$10 million for 1998 and $11.5 million for 2001 and 2002.
51
Atlantic Energy, Inc. and Subsidiaries
Cumu1ative Preferred Stock ACE has authorized 799,979 shares of Cumulative Preferred Stock, $100 Par Value, two million shares of No Par Preferred Stock and three million shares of Preference Stock, No Par Value. Information relating to outstanding shares at December 31 is shown in the table below.
Current Optional
Par 1997 1996 / Redemption Series Value Shares ( 000 l Shares ( 000 l Price Not Subject to Mandatory Redemption: 4% $100 77,000 $ 7,700 77,000 $ 7,700 $105.50 4.10% 100 72,009 7,200 72,000 7,200 101.00 4.35% 100 15,000 1;500 15,000 1,500 101.00 4.35% 100 36,000 3,600 36,000 3,600 101.00 4.75% 100 50,000 5,000 50,000 5,000 101.00 5% 100 50,000 5,000 50,000 5,000 100.00 Total $30,000 $30,000 Subject to Mandatory Redemption: $8.20 None 100,000 10,000 300,000 30,000 $7.80 None 239,500 23,950 239,500 23,950 Total 33,950 53,950 current Portion 10,000 Total $33,950 $43,950
cumulative Preferred Stock Not Subject to Mandatory Redemption is redeemable solely at the option of ACE. If preferred dividends are in arrears for at least a full year, preferred stockholders have the right to elect a majority of directors to the Board of Directors until all dividends in arrears have been paid.
On August 1, 1997 ACE redeemed 200,000 shares of its $8.20 Series No Par Preferred Stock. Under a mandatory sinking fund requirement 100,000 shares were required to be redeemed and ACE elected to redeem an optional 100,000 additional shares for a total of $20.0 million using short term debt.
Beginning May 1, 2001, 115,000 shares of the remaining $7.80 No Par Pref erred Stock must be redeemed annually through the operation of a sinking fund at a redemption price of $100 per share. ACE has the option to redeem up to an additional 115,000 shares·without premium on any annual sinking fund date.
ACE reclassified to long term $10.0 million of preferred stock due in 1998 due to the January 12, 1998 issuance of Medium Term Notes that- will, in part, be used to redeem the balance of it's $8.20 Series No Par Preferred Stock in May 1998. (See Note 9)
52 -'
•
• ./
Atlantic Energy, Inc. and Subsidiaries
ACE Obligated Mandatorily Redeemable Preferred Securities of Subsidiary Trust Holding Solely Junior Subordinated Debentures of ACE.
Atlantic Capital I, a grantor trust, is the issuer of $70 million (2,800,000 shares) of 8.25% Cumulative Quarterly Income ACE Obligated Mandatorily Redeemable Preferred Securities with a stated liquidation preference of $25 each outstanding at December 31, 1997 and 1996. Atlantic Capital's sole investment is ACE's 8.25% Junior Subordinated Deferrable Interest Debentures (Junior Debentures) . ACE reserves the right to defer payment of interest on the debentures for up to 20 consecutive quarters. During such a deferral period, certain dividend restrictions would apply to ACE's Common and Preferred stock. The transactions of the trust are consolidated into the financial statements of ACE, the Junior Debentures are eliminated in consolidation .
53
Atlantic Energy, Inc. and Subsidiaries
NOTE 9. DEBT
Series ( 0 00)
SECURED DEBT: Medium Term Notes Series B (6.28%) Medium Term Notes Series A (7.52%) Medium Term Notes Series B (6.83%) Medium Term Notes Series C (6.86%) 7-1/2% First Mortgage Bond Medium Term Notes Series C (7.02%) Medium Term Notes Series B (7.18%) 7-3/4% First Mortgage Bonds Medium Term Notes Series A (7.98%) Medium Term Notes Series B (7.125%) Medium Term Notes Series C (7 .15%.) Medium Term Notes Series B (6.45%) 6-3/8% Pollution Control Series Medium Term Notes Series C (7.15%) Medium Term Notes Series B (6.76%) Medium Term Notes Series C (7.25%) 6-5/8% First Mortgage Bonds 7-3/8% Pollution Control Series A Variable Rate Pollution Control Series A
Medium Term Notes Series C (7.63%) Medium Term Notes Series C (7.68%) Medium Term Notes Series C (7.68%) 8-1/4% Pollution Control Series A Variable Rate Pollution Control Series B
6.80% Pollution Control Series A 7% First Mortgage Bonds 5.60% Pollution Control Series A 7% First Mortgage Bonds 6.15% Pollution Control Series A 7.20% Pollution Control Series A 7% Pollution Control Series B
UNSECURED DEBT: 6.46% Medium Term Notes Series A 6.63% Medium Term Notes Series A 7.52% Medium Term Notes Series A 7.50% Medium Term Notes Series A
DEBENTURES: 7-1/4%
Amortized Premium and Discount-Net Total Long Term Debt-ACE Add Short Term Debt to be Refinanced Less Current Portion Long Term Debt-ACE
Long Term Debt-ACE $833,744 $802,245 Long Term Debt-AEI 53,500 37,575 Long Term Debt-ATE 20,000 33,500 Long Term Debt-ATS l2QEQ66 54t500 Less Portion Due within One Year l47E566 98E075
Total AEI Noncurrent Long-Term Debt $879E744 $829,745
Secured Medium Term Notes have varying maturity dates and are shown with the weighted average interest rate of the related issues within the year of maturity. Substantially all of ACE's utility plant is subject to the lien of the Mortgage and Deed of Trust dated January 15, 1937, as amended and supplemented, collateralizing ACE's First Mortgage Bonds.
ACE
ACE had authority to issue $150 million in short term debt, comprised of $100 million of committed lines of credit and $50 million on a when offered basis. At December 31, 1997 ACE had $77.9 million of unused short-term borrowing capacity. ACE's weighted daily average interest rate on short term debt was 5.8% for 1997 and 5.6% for 1996.
On May l, 1997, ACE satisfied the sinking fund requirements of $100,000 for its 7-l/4% Debentures and on December 1, 1997 satisfied the sinking fund requirement of $75,000 for its 6 3/8% Pollution Control Series due December l, 2006.
On July 3 O, 1997, ACE issued $22. 6 million aggregate principal amount of variable rate, tax-exempt pollution control bonds in two separate series: $18.2 million Pollution Control Revenue Refunding Bonds, 1997 Series A due April 15, 2014 (Series A) and $4.4 million Pollution Control Revenue Refunding Bonds, 1997 Series B.due July 15, 2017 (Series B). The Series A and the Series B bonds paid an initial weekly rate of 3.4% and 3.5%, respectively. Each subsequent rate is determined by the remarketing agent. The proceeds from the sale of the Series A and Series B bonds were applied to the September 2, 1997 redemption of $18.2 million aggregate principal amount of 7 3/8% Pollution Control Revenue Bonds of 1984, Series A and $4.4 million aggregate principal amount of 8 1/4% Pollution Control Revenue Bonds of 1987, Series B. Aggregate premiums paid for the September 2, 1997 redemption were $546, 000 and $88, 0.00, respectively.
During 1997, ACE issued and sold $65 million aggrega~e principal amount of Unsecured Medium Term Notes. Primarily, the notes were sold to cover the December l, 1997 redemption of $20 million principal amount of 7.5% First Mortgage Bonds due April 1, 2002
55
I
_j
Atlantic Energy, Inc. and Subsidiaries
and $29.976 million principal amount of 7.75% First Mortgage Bonds due June 1, 2006. Aggregate premiums paid for the redemption of these bonds were $240,000 and $440,647 respectively.
On January 12, 1998, ACE issued $85 million of Secured Medium Term Notes, Series D maturing in January 2003 and January 2006. The Bonds paid a fixed interest rate of 6.0%, 6.2% and 6.2%. The net proceeds to be received by the Company from the issuance and sale of the Medium Term Notes will be applied to the repayment of outstanding short-term and long-term indebtedness, including the redemption of certain series of First Mortgage Bonds and Debentures ($58.575 million), Preferred Stock ($10 .rnillfon) and unsecured short-term debt ($16.425 million) due in 1998.
At December 31, 1997, 1996 and 1995, ACE's embedded cost of long term debt was· 7.3%, 7.5% and 7.5%, respectively.
AEE
Long term debt of ATE includes $15 million of 7.44% Senior Notes due 1999. ATE also has a revolving credit and term loan agreement which provides for borrowings of up to $25 million during successive revolving credit ·and term loan periods through June 1998. There were $5 million and $18.5 million in borrowings outstanding under this agreement at December 31, 1997 and 1996, respectively. Interest rates on borrowings are determined by reference to periodic pricing options available under the facility. Interest on the borrowings outstanding during 1997 ranged from 5.9% to 6.5%. This credit facility will be available up until the effective date of the merger.
In December 1995, ATS through a partnership, arranged for the issuance of $12.5 million of special, limited obligation bonds of the New Jersey Economic Development Authority (NJEDA) . Proceeds from the sale of the bonds were placed in escrow. The proceeds may be released to the ATS partnership and used to pay certain "qualified costs" subject to satisfaction of certain conditions. In November 1997, ATS satisfied the escrow release conditions and remarketed, through underwriters, $12.5 million principal amount, Series 1995 Thermal Energy Facilities Revenue Bonds due December 1, 2009 at variable rates of interest. Since issuance, the interest rates to the ATS partnership have ranged from 2.5% to 4.1%. In addition, the NJEDA issued an additional $18.5 million in limited obligation bonds which were sold, through underwriters, as Series 1997 Thermal Energy Facilities Revenue Bonds due December 1, 2031 at variable rates which have ranged from 2.5% to 4.1%. ATS applied $20.0 million of bond proceeds to reimburse it_ for certain qualifying costs incurred during construction of the Midtown Energy Center in Atlantic City, New Jersey. Proceeds of ·
56
Atlantic Energy, Inc. and Subsidiaries
$11.0 million remained in escrow at December 31, 1997 pending verification of compliance with NJEDA qualifications.
ATS's $100 million revolving credit and term loan facility, was amended and restated to $143 million in October 1997. Up to $50 million of available credit commitment can be used to establish letters of credit. As of December 31, 1997 and 1996, ·$89.1 million and $42.0 million was outstanding under this facility, respectively. Interest rates on borrowings are based on periodic pricing options selected by ATS. Interest rates on the borrowings outstanding ranged from 5. 8% to 8. 5% in 1997. This fac-ility has been primarily used for construction of the Midtown Energy Center, which began commercial operation in January 1998. Aggregate commitment fees on unused credit lines of revolving AEE credit agreements were not significant. This credit facility will be available up until the effective date of the merger.
AEI
Under AEI's $75 million revolving credit and term loan facility, AEI had $53.5 million and $37.6 million outstanding in borrowings at December 31, 1997 and 1996, respectively. Interest rates are based on periodic pricing options selected by AEI. Interest on the borrowings outstanding during 1997 ranged from 5.79% to 8.62%. This facility, has been used to fl.ind acquisitions of Company common stock and other general corporate purposes and will continue to be used for corporate purposes up until the effective date of the merger.
( 000) 1998 1999 2000 2001 2002
Long Term Debt Maturities and Sinking Fund Requirements
In addition to public offerings, Common Stock may be issued through the Dividend Reinvestment and Stock Purchase Plan (DRP), ACE benefit plans (ACE plans), the EIP and the Employee Stock Purchase Plan (ESPP). The number of shares of Common Stock issued (forfeited) during the year ended December 31, and the number of shares reserved for issuance at December 31, 1997, were as follows:
In April 1996, the shareholders of AEI approved the ESPP. Under this plan, eligible employees can purchase shares of common stock at a 15% discount. The offering periods begin on August 15 in each of the years 1996-!999 and end August 14 of the following year. The maximum number of shares that shall be issued under this plan shall be 100,000 in each of the offering periods plus unissued shares from the prior offering period up to a total- of 400,000 shares. On August 14, 1997 in lieu of issuing shares the Company bought 51,133 shares at a market price ranging from $17.625 to $18.00 per share, for $.9 million. This plan will terminate at the effective date of the merger.
The Company's program to reacquire up to three million shares of it's common stock outstanding will expire with the merger. During 1995, the Company reacquired and cancelled 1,625,000 shares for a total cost of $29.6 million with prices ranging from $17.625 to $18.875 per share. As of December 31, 1997, the Company has reacquired and cancelled 1,846,700 shares of its common stock at a total cost of $33.5 million. The Company did not reacquire and cancel any shares under this program during 1997 or 1996.
Pursuant to ACE's certificate of incorporation, ACE is subject to certain limitations on the payment of dividends to the Company, which is the holder of all of ACE's common stock. When full dividends have been paid on the Preferred Stock Securities of ACE for all past quarterly-yearly dividend periods, dividends may be declared and paid by ACE on its comm.on stock, as determined by the Board of Directors of ACE, out of funds legally available for the payment of dividends.
58
• ,_
Atlantic Energy, Inc. and Subsidiaries
NOTE 11. COMMITMENTS AND CONTINGENCIES
Construction Program
ACE cash construction expenditures for 1998 are estimated to be approximately $68 million. Nonutility capital expenditures for 1998 are estimated to be $49 milli_on.
Purchased Capacity and Energy Arrangements - ACE
ACE arranges with various providers of bulk energy to obtain sufficient supplies of energy to satisfy current and future energy requirements of the Company. Arrangements may be for generating capacity and ass9ciated energy or for energy only. Terms of the arrangements vary in length to enable ACE to optimally manage its supply portfolio in response to c~anging market conditions. At December 31, 1997, ACE has contracted for 2,416 megawatts {MWs) of purchased capacity with terms remaining of 1 to 27 years and additionally, 125 MWs commencing in 1998 for 2 years and 175 MWs commencing in 1999 for 10 years. Information regarding these arrangements relative to ACE was as follows:
As a % of Capacity {year end) As a % of Generation Capacity charges {millions) Energy charges {millions)
1997 1996 1995 29% 54%
$197.4 $136.8
30% 55%
$195.7 $145.1
30% 52%
$190.6 $135.4
Amounts for purchased capacity are shown on the Consolidated Statement of Income as Purchased Capacity. Of these amounts, charges of certain nonutility providers are recoverable through the LEC, which amounted to $165 million, $165.3 million and $162.7 million in 1997, 1996 and 1995, respectively. Minimum future payments for purchased capacity and energy under contract for the years 1998 through 2002 are performance driven and cannot be reasonably estimated.
Enviromnental Matters - ACE
The provisions of Title IV of the Clean Air Act Amendments of 1990 (CAAA) require, among other things, phased reductions of sulfur dioxide {S02 ) emissions by 10 million tons per year, a limit on S02 emissions nationwide by the year 2000 and reductions in emissions of nitrogen oxides {NOx) by approximately 2 million tons per year. ACE's wholly-owned B.L~ England Units 1 and 2 and its jointlyowned Conemaugh Units 1 and 2 are in compl·iance with Phase I requirements as the result of installation of scrubb~rs at each station. All of ACE's fossil-fuel steam generating units are affected by Phase II (2000) of the CAAA. A compliance plan for
59
Atlantic Energy, Inc. and Subsidiaries
these units currently reflects capital expenditures of approximately $8.5 million in 1998 through 2002. The jointlyowned Keystone Station is impacted by the 802 and NOx provisions of Title IV of the CAAA during Phase II. The Keystone owners plan to primarily rely on emission allowances to comply with the CAAA through the year 2000.
On August 1, 1997, the New Jersey Department of Environmental Protection (NJDEP) announced that it intended to introduce rules to reduce NOx emissions by 90% from the 1990 levels by the year 2003. On September 15, 1997 the NJDEP filed its proposal with the Office of Administrative Law. In its proposal, entitled "NOx Budget Program", the NJDEP prescribed participation of New Jersey's large combustion sources in a regional cap and trade program designed to significantly reduce emissions of NOx. In effect, the proposed regulation would require New Jersey to become. the first northeastern state to require NOx reductions of 90% from the 1990 levels, by the year 2003. Both ACE's B.L. England and Deepwater generating stations wil~ be affected by the NJDEP's proposal. On October 24, 1997 ACE testified in opposition to the proposal. ACE cannot predict the ultimate outcome of this matter or the costs of compliance.
Other
AEE provides payment guarantees to certain natural gas suppliers and transporters of Enerval. These payment guarantee notifications provide that if Enerval does not make timely payment as specified in an agreement with the supplier or transporter, the Guarantor (AEE) will pay the amount due. The amounts due vary from month to month with respect to purchases from and payments to these suppliers and transporters. The exposure to AEE at December 31, 1997 was approximately $5.5 million.
The Company is party to various other claims, legal actions and complaints arising in the ordinary course of business. In management's opinion, the ultimate disposition of these matters will not have a material adverse effect on its financial condition or. results of operations.
Nuclear - ACE
Nuclear Plant Decommissioning - ACE
ACE has a trust to fund the future costs of decommissioning each of the five nuclear units in which it has an ownership interest. The current annual funding amount, as authorized by the BPU, totals $6.4 million and is provided for in rates charged to customers. The funding amount is based on estimates of the future cost of decommissioning each of the units, the dates that
60
Atlantic Energy, Inc. and Subsidiaries
decommissioning activities are expected to begin and return to be earned by the assets of the fund. The present value of ACE's nuclear decommissioning obligation, based on costs adopted by the BPU in 1991 and restated in 1997 dollars, is $164.8 million. Decommissioning activities as approved by the BPU are expected to begin in 2006 and continue through 2032. The total estimated value of the trust at December 31, 1997, inclusive of the present value of future funding, based on current annual funding amounts and expected decommissioning dates approved by the BPU, is approximately $147 million, without earnings on or appreciation of the fund assets. In accordance with BPU regulations, updated site-specific studies based on 1995 costs were completed in September 1996 and submitted to the BPU for review by the Staff of the BPU and the Ratepayer Advocate. The updated site specific studies support that the current level of funding is sufficient. As such, ACE will not seek to increase the recovery of decommissioning in its rates.
Salem Nuclear Generating Station
ACE is an owner of 7.41% of Salem Units 1 and 2, which are operated by PS. The Salem units represent 164 MWs of ACE's total installed capacity of 2,415.7 MWs. Salem Unit 1 has been out of service since May 16, 1995. Salem Unit 2, out of service since June 7, 1995 returned to service on August 30, 1997 and reached 100% power on September 23, 1997.
PS has advised ACE that the installation of Salem Unit 1 steam generators has been completed. The cost of .purchasing and installing the steam generators, as well as the disposal of the old generators is $186 million, of which ACE's share is $13.8 million. The unit is currently expected to return to service near the end of the first quarter of 1998. Restart of Salem Unit 1 is also subject to NRC approval.·
The Salem Station outages has caused ACE to incur replacement power costs of approximately $700 thousand per month per unit. As previously discussed, ACE's replacement power costs for the current and recent outage, up to the agreed-upon return-to-service date of June 30, 1997 for Salem Unit 1 and December 31, 1996 for Salem Unit 2, will be recoverable in rates in ACE's 1997 LEC proceeding. Replacement power costs incurred after the agreedupon return-to-service date for the ~alem Station will not be recoverable in rates. ·ACE has incurred $10.2 million in nonrecoverable replacement power costs to date related to Salem.
ACE entered into an agreement with PS for the pur-Pos~ of limiting ACE's exposure to Salem's 1997 operation and maintenance (O&M) expenses. Pursuant to the terms of the agreement, ACE was obligated to pay to PS $10 million of O&M expense, as a fixed
61
Atlantic Energy, Inc. and Subsidiaries
charge payable in twelve equal installments beginning February 1, 1997. ACE's obligation for any contributions, above the $10 million, to Salem 1997 O&M expenses up to ACE's estimated share of $21.8 million, is based on performance ·and directly related to the timely return and operation of the units. As a result of this Agreement, ACE agreed to dismiss the complaint filed in the Superior Court of New Jersey in March 1996 alleging negligence and breach of contract.
On February 27, 1996, the Salem co-owners filed a Complaint in United States District Court for the District of New Jersey against Westinghouse Electric Corporation, the designer and manufacturer of the Salem steam generators, under Federal and state statutes alleging fraud, negligent misrepresentation and breach of contract. The litigation is continuing in accordance with the schedule established by the court.
Other
The Energy Policy Act of 1992 permits the Federal government to assess investor-owned electric utilities that have ownership interests in nuclear generating facilities for the decontamination and decommissioning of Federally operated nuclear enrichment , facilities. Based on its ownership in five nuclear generating units, ACE has a liability of $4.6 million and $5.3 million at December 31, 1997 and 1996, respectively, for its obligation to be paid over the next 12 years. ACE has an associated regulatory asset of $5.0 million and $5.7 million at December 3·1, 1997 and 1996, respectively. Amounts are currently being recovered in rates for this liability and the regulatory asset is concurrently being amortized to expense based on the annual assessment billed by the Federal government.
ACE is subject to a performance standard for its five jointlyowned nuclear units. This standard is used by the BPU in determining recovery of replacement energy costs when output from the nuclear units is reduced or not available. Underperformance results in penalties which are not permitted to be recovered from customers and are charged against income. According to a December 1996 stipulation agreement, the performance of Salem Units 1 and 2 shall not be included in the calculation of a nuclear performance penalty for the period each unit was taken out of service up to each unit's respective return-to-service date. The parties to the stipulation agreed that for the years 1995 and 1996, there will be no penalty under the nuclear performance standard. Additionally, ACE will not incur a nuclear performance penalty for 1997.
62
Atlantic Energy, Inc. and Subsidiaries
Insurance Programs - ACE
Nuclear
ACE is a member of certain insurance programs that provide coverage for contamination and property damage to members' nuclear generating plants. Facilities at the Peach Bottom, Salem and Hope Creek stations are insured against property damage losses up to $2.75 billion per site under these programs.
In addition, ACE is a member of an insurance program which provides coverage for the cost of replacement power during prolonged outages of nuclear units caused by certain specific conditions. The insurer for nuclear extra expense insurance provides stated value coverage for replacement power costs incurred in the event of an outage at a nuclear unit resulting from physical damage to the nuclear unit. The stated value coverage is subject to a deductible period of the first 21 weeks of any outage. Limitations of coverage include, but are not limited to, outages 1) not resulting from physical damag~ to the unit, 2) resulting from any government mandated shutdown of the unit, 3) resulting from any gradual deterioration, corrosion, wear and tear, etc. of the unit, 4) resulting from any intentional acts committed by an insured and 5) resulting from certain war risk conditions. Under the property and replacement power insurance programs, ACE could be assessed retrospective premiums in the event the insurers' losses exceed their reserves. As of December 31, 1997, the maximum amount of retro~pective premiums ACE could be assessed for losses during the current policy year was $4.4 million under these programs.
The Price-Anderson provisions of the Atomic Energy Act of 1954, as amended by the Price-Anderson Amendments Act of 1988, govern liability and indemnification for nuclear incidents. All nuclear facilities could be assessed, after exhaustion of private insurance, up to $79.275 million each reactor per incident, payable at $10 million per year. Based on its ownership share of nuclear facilities, ACE could be assessed up to an aggregate of $27.6 million per incident. This amount would be payable at an aggregate of $3.48 million per year, per incident.
Other
ACE's comprehensive general liability insurance provides-pollution liability coverage, subject to certain terms and limitations for environmental costs incurred in the event of bodily injury or property damage resulting from the discharge or release of pollutants into or upon the land, atmosphere or water. Limitations of coverage· include any pollution liability 1) resulting subsequent to the disposal of such pollutants, 2)
63
Atlantic Energy, Inc. and Subsidiaries
• resulting from the operation of a storage facility of such pollutants, 3) resulting in the formation of acid rain, 4) to property owned by an insured and 5) resulting from any intentional acts committed by an insured.
caused "·
NOTE 12. ACE'S ELECTRIC UTILITY INDUSTRY RESTRUCTURING AND STRANDED COSTS
In April 1997, the BPU issued its Final Report c.ontaining findings and recommendations on the electric utility industry.restructuring in New Jersey to the Governor and the State Legislature for their consideration. The recommendation for phase-in of retail choice to electric consumers calls for choice to 10%.of all customers beginning October 1, 1998 and to 100% by July 1, 2000. The Report required each electric utility in the state to file complete restructuring plans, stranded cost filings and unbundled rate filings by July 15, 1997. The Report would allow utilities the opportunity to recover stranded costs on a case-by-case basis, with no guarantee of 100 percent recovery of eligible stranded costs.
ACE filed its response to the BPU on July 15, 1997 .. ACE's restructuring plan met the BPU's recommendations for phase-in of retail electric access based on a first-come, first-served basis, proposing choice to 10% of all customers beginning October 1, 1998 and to 100% by July 1, 2000. customers remaining with ACE will be charged a market-based electricity price beginning October 1, 1998. The restructuring plan included a two-phased approach to future rate reductions.
In an October 31~ 1997 letter to the BPU, ACE added specificity to the framework set out in the restructuring plan with regard to steps ACE anticipates taking to meet the BPU's rate reduction and restructuring goals. First, specific, definable cost reductions of approximately 4% after 1998 were outlined. Further, ACE offered that an appropriate resolution of the merger proceedings will allow ACE to reduce its rates, due to the merger, approximately 1.25% upon consummation of the change in control. In addition, ACE's ·current estimate showed that, through the use of securitized debt for the full amount of stranded costs associated with its own generation assets, a further rate decrease of up to 2% was possible based on appropriate legislation and orders of the BPU with respect to securitization. Finally, ACE estimates that the results of good-faith negotiations with the nonutility generators could provide a reduction of up to an additional 1.75%. In summary, ACE outlined a tota~ rate reduction of 9% by the end of the transition. On January 28, 1~98, the BPU issued its Order establishing the procedur~l schedule regarding the restructuring plan. Under that order, hearings on the
64
Atlantic Energy, Inc. and Subsidiaries
restructuring plan are to be completed by mid-May 1998. It is anticipated that the BPU will issue its final order during the summer of 1998.
Under the stranded cost filing, ACE specified its total stranded cost estimated to be approximately $1.3 billion, of which $911 million is attributable to above-market nonutility generation (NUG) contracts. The remaining amount, approximately $415 million, is related to wholly- and jointly-owned generation investments. The stranded cost f i"ling supports full recovery of stranded costs, which ACE believes is necessary to mov~ to a competitive environment. On February 5, 1998, the Company filed' rebuttal testimony in the stranded cost filing. As part of the filing, the Company updated its stranded cost estimates for the effects of tax law changes in the State of New Jersey and to modify certain assumptions made in estimating the stranded costs. The total stranded costs in the rebuttal filing are approximately $1.2 billion with $812 million attributable to NUG contracts and $397 million related to wholly- and jointly-owned generation investments. Determination of the stranded cost filing will be heard by the Office of Administrative Law. The ALJ is expected to render a decision in May 1998. If ACE is required to recognize amounts as unrecoverable, ACE may be required to write down asset values, and such writedowns could be material.
ACE continues to meet the criteria set forth in SFAS 71 and has presented these financial statements in accordance therewith. (See Note 1 - Regulation - ACE}. The FASB, through the Emerging Issue Task Force (EITF), has recently set forth guidance intended to clarify the accounting treatment of specific issues associated with the restructuring of the electric utility industry through EITF Issue No. 97-4_, 11 Deregulation of the Pricing of Electricity -Issues Related to the Application of FASB Statements No. 71, Accounting for the Effects of Certain Types of Regulation, and No. 101, Regulated Enterprises-Accounting for the Discontinuation of application of FASB Statement No. 71" (EITF No. 97.:..4) 11
• The consensus reached in EITF No. 97-4 as to when an enterprise should stop applying SFAS 71 to a separable portion of its business whose pricing is being deregulated, is defined as "when deregulatory legislation or a rate order (whichever is necessary to effect change in the jurisdiction) is issued that contains sufficient detail for the enterprise to reasonably determine how the transition plan will effect the separable portion of its business 11
(e.g. generation).
65
Atlantic Energy, Inc. and Subsidiaries
Consensus was also reached "that the regulatory assets and regulatory liabilities that originated in the separable portion of an enterprise to which Statement 101 (SFAS 101, "Regulatory Enterprises - Accounting for the Discontinuation of Application of FASB Statement No. 71.") is being applied should be evaluated on the basis of where (that is, the portion of the business in which) the regulated cash flows to realize and settle them, respectively, will be derived." Additionally, the "source of the cash flow approach adopted in the consensus should be used for recoveries of all costs and settlements of all obligation (not just for regulatory assets and regulatory liabilities that are recorded at the date Statement 1.01 is applied) for which regulated cash flows are specifically provided in the deregulatory legislation or rate order".
At this time ACE cannot predict, with certainty when it will stop applying SFAS 71. for its generation business. ACE also cannot predict the impacts for its generation business nor can it predict the impacts on its financial condition as a result of applying SFAS 101.. The outcome will be dependent upon when a plan is approved and the level of recovery of stranded costs allowed by the BPU. If assets require a write-down as a result of the application of SFAS 1.01, ACE may need to record an extraordinary noncash charge to operations that could have a material impact on the financial position and results of operations of ACE.
ACE has entered into BPU approved Off-Tariff Rate Agreements (OTRA's) with at-risk customers which provide for special rates for customers who may choose to leave ACE's energy system because they have alternative energy sources available. The aggregate amount of such reduced rate agreements has been a reduction to revenues of $1.0.5 million for 1.997 and $3.5 million for 1996.
66
Atlantic Energy, Inc. and Subsidiaries
NOTE 13. REGULATORY ASSET~ AND LIABILITIES - ACE
, Costs incurred by ACE that have been permitted, or are expected to be permitted, by the BPU to be deferred for recovery in rates in more than one year, or for which future recovery is probable, are recorded as regulatory assets. Regulatory assets are amortized to expense over the period of recovery. Total regulatory assets at December 3i are as follows:
( 000) Recoverable Future Federal
Income Taxes Unrecovered Purchased Power Costs: Capacity Cost Contract Renegotiation Costs
Unrecovered State Excise Taxes Unamortized Debt Costs-Refundings Deferred Energy Costs (S.ee Note 1) Other Regulatory Assets: Postretirement Benefits Other
Than Pensions (See Notes 3&5) Asbestos Removal Costs Decommissioning/Decontaminating
Federally-owned Nuclear Units (See Note 11)
Other
*From December 31, 1997 (A) Pending future recovery
$85,858
48,038 18,226 45,154 30,002 27,424
37,476 8,816
5,032 10.789
$316.815
· (B) Recovered over annual LEC period
$85,858
64,658 18,742 54,714 29,878 33,529
32,609 9,086
5,726 12.154
$346·. 954
Remaining Recovery Period*
(A)
3 years 17 years
5 years 1-29 years
(B)
15 years 32 years
11 years
Recoverable Future Federal Income Taxes is the amount of revenue expected to be collected from ratepayers for def erred tax costs to be paid in future years. Unrecovered Purchased Power Capacity Costs represent deferrals of prior capacity costs then in excess of levelized revenues associated with a certain long term capacity arrangement. Levelized revenues have since been greater than costs, permitting the deferred costs to be amortized to expense. Contract Renegotiation Costs were incurred through renegotiation of a long term capacity and energy contract with a certain independent power prod~cer. Unrecovered State Excise Taxes represent additional amounts paid as a result of prior legislative changes in the computation of state excise taxes. Unamortized Debt Costs associated with debt reacquired by refundings are amortized over the life of the related new debt. FASB Statement of Financial Accounting Standard No. 106 -"Employers Accounting for Post-retirement Benefits Other Than Pensions" (SFAS 106) required companies to recognize an obligation composed of the present value of OPEB obligations for retirees and current e:mP.loyees incurred as of the date ·of adoption. In December 1992, ACE adopted SFAS 106, applied deferred accounting to these .OPEB costs and began to record a regulatory asset consistent with SFAS 71. In December 1997, the BPU approved an increase in annual base rate revenues of $5.0 million for recovery of expenses associated with OPEB costs. This amount included recovery of the regulatory asset over a 15 year period beginning in January 1998. Asbestos Removal Costs were incurred to remove asbestos insulation from a wholly-owned generating
67
Atlantic Energy, Inc. and Subsidiaries •
station. Included in Other are certain amounts being recovered over period of one-to five years. \
NOTE 14. LEASES
ACE leases from others various types of property and equipment for use in its operations. Certain of these lease agreements are capital leases consisting of the following at December 31:
( 000) Production plant Less accumulated amortization Net Nuclear fuel Leased property-net
1997 $ 6,642
5,707 935
38,795 $39.730
1996 $ 6,642
5.005 1,637
38.277 $39.914
ACE has a contractual obligation to obtain nuclear fuel for the Salem, Hope Creek and Peach Bottom stations. The asset and related obligation for the leased fuel are reduced as the fuel is burned and are increased as additional fuel purchases are made. No commitments for future payments beyond satisfaction of the outstanding obligation exist. Operating expenses for 1997, 1996 and 1995 include leased nuclear fuel costs of $9.8 million, $8.7 million and $11.2 million, respectively, and rentals and lease payments for all other capital and operating leases of $2. 7 million, ·$2. 6 million and $3. 9 million, respectively. Future minimum rental payments for all noncancellable lease agreements are less than $2.5 million per year for each of the next 5 years.
ATE is the lessor in five leveraged lease transactions consisting of three aircraft and two containerships with total respective costs of approximately $168 million and $76 million. Remaining lease terms for all leases approximate 13 to 14 years. The Company's equity participation in the leases range from 22% to 32%. Funding of the investment in the leveraged lease transactions is comprised of equity participation by ATE and financing provided by third parties as long term debt without recourse to ATE. The lease transactions provide collateral for such third parties, including a security interest in the leased equipment.
Net investment in leveraged leases at December 31 was as follows:
(000) Rentals receivable (net of principal
and interest on nonrecourse debt) Estimated residual values Unearned and def erred income Investment in leveraged leases Deferred taxes arising from leveraged leases
Net investment in leveraged leases
68
1997
$50,841 53,435
(23 I 828) 80,448
(76,362) $ 4,086
1996
$50,898 53,435
{24 r 646) -79,687
(76 I 671) $ 3,016 •
I
__ j
,,
Atlantic Energy, Inc. and Subsidiaries
NOTE 15. FINANCIAL INSTRUMENTS AND RISK MANAGEMENT
The Company does not use derivative financial instruments in its investment portfolio or for trading purposes. ACE and AEE are exposed to market changes in certain energy commodity prices (natural gas and electricity) . To minimize the risk of market fluctuations associated with the purchase and sale of energy commodities both ACE and Enerval enter into various transactions involving derivative financial instruments for hedging purposes.
ACE enters into agreements to buy and sell electricity at a predetermined price for future periods. ACE utilizes purchased and written options to purchase or sell a predetermined amount of electricity at a predetermined price in an effort to limit ACE's risk· related to those agreements. Gains or losses associated with derivative transactions are recognized in operations in the period the derivative instrument is terminated or extinguished or ceases to be qualified as a hedge. ACE has established risk management policies and procedures to minimize the level of risk associated with electric marketing transactions. At December 31, 1997, ACE's unhedged outstanding commitments to sell energy were immaterial.
AEE through Enerval enters into fixed-priced contracts which commit the company to sell, up to a predetermined volume, natural gas at a fixed price. To meet the physical gas supply delivery requirements under these gas sales contracts, Enerval enters into natural gas physical purchase contracts based on market price. In order to hedge its price risk relative to its fixed price sales commitments, Enerval utilizes natural gas futures contracts to reduce its exposure relative to the volatility of market prices. Enerval records the gain or loss resulting from changes in the market value of the futures contract as an increase or decrease to fuel costs when the corresponding sale is made.
As a service to Enerval, the other 50% owner enters into futures contracts on Enerval's behalf. As of December 31, 1997, this owner entered into natural gas futures contracts on behalf of Enerval for 9.3 million DTH at a price range of $1.90 to $3.20, through March 2000 in the notional amount of $21.2 million. The original contract terms range from one month to two years. Enerval's futures contracts hedge $21.7 million in anticipated natural gas sales. The counterparties to the futures contracts are the New York Mercantile Exchange and major over the counter market traders. The Company believes the risk of nonperformance by these counterparties is not significant. If the contracts had been terminated at December 31, 1997, $0.6 million would have been payable by Enerval for the natural gas price fluctuations.
A number of items within Current Assets and current Liabilities on the Consolidated Balance Sheet are considered to be financial instruments because they are cash or are to be settled in cash. Due to their
69
Atlantic Energy, Inc. and Subsidiaries
short-term nature, the carrying values of these items approximate their fair market values. Account·s Receivable - Utility Service and\ Unbilled Revenues are subject to concentration of credit risk because they pertain to utility service conducted within a fixed geographic region. Investments in Leveraged Leases are subject to concentration of credit risk because they are exclusive to a small number of parties within two industries. The Company has recourse to the affected assets under lease. These leased assets are of general use within their respective industries.
ACE's long term debt and preferred securities and ATE's long term debt securities are not widely held and generally trade infrequently. The estimated aggregate fair value of debt securities has been.determined based on quoted market prices for the same or similar debt issues or on securities of companies with similar credit quality, coupon rates and maturities. The aggregate fair value of preferred securities has been determined using market information available from actual trades
70
·-
Atlantic Energy, Inc. and Subsidiaries
or of trades of similar instruments of companies with similar credit quality. At December 31 the amounts are as follows:
Long Term
ACE Long Term Debt ACE Pref erred Stock ~referred Securities* AEI Long Term Debt ATS Long Term Debt ATE Long Term Debt
Debt and Pref erred (in millions)
1997 Carrying
Value $833.7
64.0 70.0 53.5
120.1 20.0
Fair Value
$859.5 60.1 72.3 53.5
120.1 20.3
Securities
1996 Carrying
Value $802.4
74.0 70.0 37.6 54.5 33.5
Fair Value
$828.8 77.1 69.3 37.6 54.5 34.0
* ACE Obligated Mandatorily Redeemable Preferred Securities of Subsidiary Trust Holding Solely Junior Subordinated Debentures of ACE
Certain prior year amounts have been reclassified to conform to the current year reporting of these i~ems. The most notable reclassification, with no effect on net income, pertains to the Company's nonutility activities previously reported in the Other Income line on the Consolidated Statement of Income .. The revenues, operating expenses and income taxes from those operations are now reflected on the appropriate line items.
71
Atlantic Energy, Inc. and Subsidiaries
Third quarter results generally exceed those of other quarters due increased sales and higher residential rates for ACE. Individual quarters may not add to the total due to rounding.
The fourth quarter 1997 Net Income reflects a charge of $16.5 million, after tax of $7.1 million recorded in December 1997 for the termination of various pension and compensation plans in anticipation of the merger. (See Note 4. - Merger). These expenses are included in operations expense and are classified as Termination of Employee Benefit Plans on the consolidated income statement.
The fourth quarter 1996 Net Income reflects an increase in ACE's electric sales offset in part by the increase in energy expense due to increased sales, recovery of previously deferred energy costs and an increase in operations and maintenance expense related to Salem. During the fourth quarter of 1996 nonutility operations recorded a $1.6 million net of tax loss contingency for the sale of the Binghamton Cogeneration Facility by AGI, $0.8 million net of tax write-down of the carrying value of ASP's commercial building and $1.1 million net of tax loss for AEE's investment in Enerval.
72
/
Atlantic Energy, Inc. and Subsidiaries
REPORT OF MANAGEMENT-Atlantic City Electric Company
The management of Atlantic City Electric Company and its subsidiary (the Company) is responsible for the preparation of the consolidated financial statements presented in this Annual Report. The financial statements have been prepared in conformity with generally accepted accounting principles. In preparing the consolidated financial statements, management made informed judgments and estimates, as necessary, relating to events and transactions reported.
Management has established a system of internal accounting and financial controls and procedures designed to provide reasonable assurance as to the integrity and reliability of financial reporting. In any system of financial reporting controls, inherent limitations exist. Management continually examines the effectiveness and efficiency of this system, and actions are taken when opportunities for improvement are identified. Management believes that, as of December 31, 1997, the system of internal accounting and financial controls over financial reporting is effective. Management also recognizes its responsibility for fostering a strong ethical climate in which the Company's affairs are conducted according to the highest standards of corporate conduct. This responsibility is characterized and reflected in the Company's code of ethics and business conduct policy.
The consolidated financial statements have been audited by Deloitte & Touche LLP, Certified Public Accountants. Deloitte & Touche LLP provides objective, independent audits as to management's discharge of its responsibilities insofar as they relate to the fairness of the financial statements. Their audits are based on procedures believed by them to provide reasonable assurance that the financial statements are free of material misstatement.
The Company's internal auditing function conducts audits and appraisals of the Company's operations. It evaluates the system of internal accounting, financial and operational controls and compliance with established procedures. Both the external auditors and the internal auditors periodically make recommendations concerning the Company's internal control structure to management and the Audit Committee of the Board of Directors. Management responds to such recommendations as appropriate in the circumstances. None of .the recommendations made for the year ended December 31, 1997 represented significant deficiencies in the design or operation of the Company's internal control structure.
Isl M. J. Chesser M. J. Chesser
President and Chief Operating Officer
Isl M. J. Barron M. J. Barron
Senior Vice President and Chief Financial Officer February 2, 1998
73
Atlantic Energy, Inc. and Subsidiaries
INDEPENDENT ~UDITORS' REPORT
To Atlantic City Electric Company:
We have audited the accompanying consolidated balance sheets of Atlantic City Electric Company and subsidiary as of December 31, 1997 and 1996 and the related consolidated statements of income, changes in common shareholder's equity, and cash flows for each of the three years in the period ended December 31, 1997. These financial statements are the responsibility of the Company's management. Our responsibility is to express an opinion on these financial statements based on our audits.
We conducted our audits in accordance with generally accepted auditing 1 standards. Those standards require that we plan and perform the · audits to obtain reasonable assurance about whether the financial statements are free of material misstatement. An audit includes examining, on a test basis, evidence supporting the amounts and disclosures in the financial statements. An audit also includes assessing the accounting principles used and significant estimates made by management, as well as evaluating the overall financial statement presentation. We believe that our audits provide a reasonable basis for our opinion.
In our opinion, such consolidated financial statements present fairly, in all material respects, the financial position of Atlantic City Electric Company and subsidiary at December 31, 1997 and 1996 and t results of their operations and their cash flows for each of the th years in ~he period ended December 31, 1997 in conformity with generally accepted accounting principles. ·
Isl Deloitte & Touche LLP Deloitte & Touche LLP
February 2, 1998 (March 1, 1998 as to Note 4) Parsippany, New Jersey
74
Atlantic Energy, Inc. and Subsidiaries
THIS PAGE INTENTIONALLY LEFT BLANK
• j
75
Atlantic Energy, Inc. and Subsidiaries
Atlantic City .Electric Company and Subsidiary CONSOLIDATED BALANCE SHEETS (Dollars, in Thousands)
December 31, 1997 1996
ASSETS ELECTRIC UTILITY PLANT
In Service: Production Transmission Distribution General
Total In Service Less Accumulated Depreciation Utility Plant in Service-Net Construction Work in Progress Land Held for Future Use Leased Property-Net
INVESTMENTS AND NONUTILITY PROPERTY Nuclear Decommissioning Trust Fund Other
CURRENT ASSETS Cash and Temporary Investments Accounts Receivable: Utility Service Miscellaneous Allowance for Doubtful Accounts
Unbilled Revenues Fuel (at average cost)
$1,242,049 383,577 763,915 195,745
2,585,286 934,235
1,651,051 95,120 5,604
39,730 1, 791, 505
81,650 10,853 92,503
5,640
Materials and Supplies (at average cost) Working Funds
DEFERRED DEBITS Unrecovered Purchased Power Costs Recoverable Future Federal Income Taxes Unrecovered State Excise Taxes Unamortized Debt Costs Def erred Other Post Retirement Employee Benefit Costs
The accompanying Notes to Consolidated Financial Statements are a integral part of these statements.
76
Atlantic Energy, Inc. and Subsidiaries
Atlantic City Electric Company and Subsidiary CONSOLIDATED BALANCE SHEETS (Dollars, in Thousands)
LIABILITIES AND CAPITALIZATION CAPITALIZATION
Common Shareholder's Equity: Common Stock Premium on Capital Stock Contributed Capital Capital Stock Expense Retained Earnings Total Common Shareholder's Equity Preferred Securities:
Not Subject to Mandatory Redemption Subject to Mandatory Redemption Company-Obligated Mandatorily
Redeemable Preferred Securities of Subsidiary Trust Holding Solely Junior Subordinated Debentures of the Company
Long Term Debt
CURRENT LIABILITIES Pref erred Stock Redemption Requir.ement Capital Lease Obligations-current
/ Long Term Debt-current Short Term Debt Accounts Payable Federal Income Taxes Payable-Affiliate Other Taxes Accrued Interest Accrued Dividends Declared Def erred Income Taxes Provision for Rate Refunds Other
DEFERRED CREDITS AND OTHER LIABILITIES Def erred Income Taxes Deferred Investment Tax Credits Capital Lease Obligations Accrued Other Post Retirement Employee
Benefit Costs Other
Commitments and Contingencies (Note 11) TOTAL LIABILITIES AND CAPITALIZATION
December 31, 1997 1996
$ 54,963 $ 54,963 231,081 231,081 263,617 259,078
(l,537) (1,645) 2341909 2341948 7831033 7781425
30,000 30,000 33,950 43,950
70,000 70,000 833 1744 802 1245
L 750 1727 L 724 1 620
10,000 653 702
175 55,675 64,950 56,672 63,644
7,398 5,922 7,494
19,562 19,619 21,215 21,701 1,888 3,190
13,000 20 1293 19,137
181 1880 2311010
362,213 357,580 44,043 46,577 39,077 39,212
37,476 32,609 21,339 291133
504.148 5051111
$214361755 $214601741
The accompanying Notes to Consolidated Financial Statements are an integral part of these statements.
77
Atlantic Energy, Inc. and Subsidiaries
Atlantic City Electric Company and Subsidiary CONSOLIDATED STATEMENTS OF INCOME (Dollars, in Thousands)
For the Years Ended December 31,
OPERATING REVENUES Electric Other Services
OPERATING EXPENSES Energy Purchased Capacity Operations Maintenance Termination of Employee Benefit Plans
Depreciation and Amortization State Excise Taxes Taxes Other Than Income
OPERATING INCOME
OTHER INCOME Allowance for Equity Funds Used
During Construction Other-Net
INTEREST CHARGES Interest Expense Allowance for Borrowed Funds Used
CASH FLOWS OF INVESTING ACTIVITIES Construction Expenditures ( 80 t 849) (86,805) (100,904) Leased Nuclear Fuel Material (9,105) (6., 833) (10,446) Plant Removal Costs (47) (2,109) (4, 525) Other-Net (3 I 508) (15,707) 892 Net Cash Used by Investing Activities (93,509) (111,454) (114 I 983)
CASH FLOWS OF FINANCING ACTIVITIES Issuance of Preferred Securities 70,000 Proceeds from Long Term Debt 87,600 104,404 Retirement and Maturity of Long~Term Debt (74,066) (12,266) (57,489)
Increase in Short Term Debt 7,150 34,405 21,945 Proceeds from Nuclear Fuel Capital Lease Obligations 9,105 6,833 10,446
Redemption of Pref erred Stock (20,000) (98,876) (24, 500) Capital Stock Dividends Declared (85, 678) (92,066) (95, 866) Preferred Securities of Trust (5, 775) (1,428) Capital Contributions from Parent(net) 4,539 (567) (223) Other-Net (1,923) (3,313) (869) Net Cash Used by Financing Activities (79,048) (97,278) (42, 152) Net Increase in Cash and
Temporary Investments (2 t 287) 3,940 528 Cash and Temporary Investments: Beginning of Year 7,927 3,987 3,459 End of Year $ 5,640 $ 7,927 $ 3,987
Supplemental Schedule of Payments: Interest $ 64,966 $ 65', 269 $ 58,274 Federal Income Taxes $ 48,400 $ 36,937 $ 31,999
The accompanying Notes to Consolidated Financial Statement.s are an integral part of these statements.
79
Atlantic Energy, Inc. and Subsidiaries
Atlantic City Electric Company and Subsidiary CONSOLIDATED STATEMENTS OF CHANGES IN COMMON SHAREHOLDER'S EQUITY (Dollars, in Thousands)
Balance,
Premium Common On Capital Stock Stock
December 31, 1994 $54,963 $231,081 Net Income Capital Stock Expense
Capital Contrib. from Parent (net)
Less Dividends Declared:
Pref erred Common
Balance, December 31, 1995 54,963 231,081
Net Income Capital Stock Expense Capital Contrib ..
from Parent (net) Less Dividends Declared:
Pref erred Common
Balance, December 31, 1996 54,963 231,081
Net Income Capital Stock Expense Capital Contrib.
from Parent (net) ·Less Dividends
Declared: Pref erred Common
Balance, December 31, 1997 $54,963 $231.081
Contrib. Capital
Capital Stock Retained Expense Earnings
$259,868 $(2,300) $249,767 98,752
(223)
169 (169)
(14 I 627) (81r239)
259,645 (2,131) 252,484 75,017
(567)
486 (486)
(9,904) (82,163)
259,078 (l,645) 234,948 85,747
4,539
108 (108)
(4 I 821) (80.857)
$263,617 $(1,537) $234,909
As of December 31, 1997, the Company had 25 million authorized shares of Common Stock at $3 par value. Shares outstanding at December 31, 1997, 1996 and 1995 were 18,320,937.
The accompanying Notes to Consolidated Financial Statements are an integral part of these statements.
80
l
Atlantic Energy, Inc. and Subsidiaries
ATLANTIC CITY ELECTRIC COMPANY AND SUBSIDIARY Notes to Consolidated Financial Statements
Except as modified below, Notes 1 through 16, excluding Note 7 and Note 10, to the Consolidated Financial Statements of Atlantic Energy Inc. (AEI) are incorporated herein by reference insofar as they relate to Atlantic City Electric Company (ACE) and its subsidiary:
Note 1. Principles of Consolidation The consolidated financial statements include the accounts of ACE. and Deepwater Operating Company (Deepwater) its wholly-owned subsidiary. On January 1, 1998, Deepwater was merged into ACE with no financial effect on financial position or results of operations of ACE. All significant intercompany accounts and transactions have been eliminated in consolidation.
Reclassification Certain prior year amounts have been reclassified to conform to the current year reporting of these items. The most notable reclassification, with no effect on net income, pertains to the Company's nonutility activities previously reported in the Other Income line on the Consolidated Statement of Income. The revenues, operating expenses and income taxes from those operations are now reflected on the appropriate line items.
Related Party Transactions - ACE has a contract for a total of 116 megawatts of capacity and related energy from a cogeneration facility that is 50% owned by a wholly-owned subsidiary of Atlantic Energy Enterprises, Inc. (AEE) . Capacity costs totaled $28.6 million in 1997, $27.8 million in 1996 and $23.8 million in 1995. ACE sells electricity to subsidiaries of AEE. The electric sales totaled $6.5 million for 1997, $2.2 million for 1996 and $0.6 million for 1995. ACE also rents office space from a wholly-owned subsidiary of AEE which amounts are not significant. The amounts receivable from and payable to affiliates were not significant at December 31, 1997 and 1996.
81
Atlantic Energy, Inc. and Subsidiaries
Note 2. Income Taxes The components of Federal income tax expense for the years ended December 31 are as follows:
( 000) current Def erred Total Federal Income Tax Expense
1997 $49,646
796 $50,442
1996 $35,510
1.448 $36.958
1995 $32,457 15,820
$48,277
A reconciliation of the expected Federal income taxes compared to the reported Federal income tax expense computed by applying the statutory rate for the years ended December 31 follows:
1997 1996 1995 Statutory Federal Income Tax Rate 35% 35% 35% ( 000) Income Tax Computed at the Statutory Rate $47,666 $39,191 $51,417 Plant Basis Differences 4,952 3,096 1,307 Amortization of Investment Tax
Credits (2,534) (2,534) (2,534) Other-Net 358 {2 I 795) {1,913) Total Federal Income Tax Expense $50c442 $36,958 $48,277 Effective Federal Income Tax Rate 37% 33% 33%
The increase in the effective Federal income tax expense rate is due primarily to permanently non-deductible merger and merger related expenses. State income tax expense is not significant.
Items comprising def erred tax balances as of December 31 are as follows: ( 000) 1997 1996 Deferred Tax Liabilities: Plant Basis Differences $332,288 $326,673 Unrecovered Purchased .
Power Costs 16,813 22,630 State Excise Taxes 16,326 20, 141 Other 34,190 29,344 Total Def erred Tax Liabilities 399,617 398,788
Deferred Tax Assets: Def erred Investment
Tax Credits 23,775 25,143 Other 11,741 12,875 Total Def erred Tax Assets 35,516 38,018 Total Def erred Taxes-Net $364,101 $360,770
82
1 ,_
L
Atlantic Energy, Inc. and Subsidiaries
On July_ 14, 1997 the Governor signed a bill into law eliminating the Gross Receipts and Franchise Tax (GR & FT) paid by the electric, natural gas and telecommunication public utilities .. In its place, utilities will be subject to the state's corporate business tax. In addition, the state's existing sales and use tax will be expanded to include retail sales of electric power and natural gas, and a transitional energy facility assessment tax (TEFA) will be applied for a limited time on electric and natural gas utilities and will be phased-out over a five year period. The law took effect January 1, 1998 and on January 1 of each of the years thereafter, the TEFA.will be reduced by 20%. By the year 2003, the TEFA will be fully phased-out and the savings will be passed through to ACE's Customers. As a result of this law, ACE will record deferred state taxes beginning in 1998 for state tax basis versus book basis differences.
Note 16. Quarterly Financial Results (Unaudited). Quarterly financial data of ACE, reflecting all adjustments necessary in the opinion of management for a fair presentation of such amounts, are as follows:
Operating . Operating Net Earnings for Quarter Revenues Income Income Common Stock 1997 ( 000) (000) ( 000) ( 000) 1st $ 243,443 $ 47,350 $20,371 $18,961 2nd 242,567 45,028 18,676 17,266 3rd 338,070 89,123 47,541. 46,541 4th 260,810 8,551 { 841.) {1,842) Annual $1,084,890 $190,052 $85,747 $80,926
Individual quarters may not add to the total due to rounding.
Certain prior year amounts have been reclassified to conform to the current year reporting of these items. The most notable reclassification, with no effect on net income, pertains to the Company's nonutility activities previously reported in the Other Income line on the Consolidated Statement of Income. The revenues, operating expenses and income taxes from-those operations are now reflected on the appropriate line items.
Third quarter results generally exceed those of other quarters due to increased sales and higher residential rates for ACE.
83
L
Atlantic Energy, Inc. and Subsidiaries
The fourth quarter 1997 Net Income reflects a charge of $15.6 million, after tax of $6.6 million recorded in December 1997 for the termination of various pension and compensation plans in anticipation of the merger. (See AEI Note 4. - Merger). These expenses are included in operations expense and are classified as Termination of Employee Benefit Plans on the consolidated income statement.
The fourth quarter 1996 Net Income reflects an increase in ACE's electric sales .offset in part by the increase in energy expense due to the increased sales, recovery of previously deferred energy costs and an increase in operations and maintenance expense related to Salem.
84
''
Atlantic Energy, Inc. and Subsidiaries
ITEM 7. FINANCIAL STATEMENTS AND EXHIBITS
See Exhibit Index Attached.
85
• J
Atlantic Energy, Inc. and Subsidiaries
***********************************
SIGNATURE
Pursuant to the requirements of the Securities Exchange Act of 1934, the Registrant has duly caused this report to be signed on its behalf by the undersigned hereunto duly authorized.
Date: March 3, 1998
Atlantic Energy, Inc. Atlantic City Electric Company
(Registrant)
By: /s/J. E. Franklin II J. E. Franklin II
Vice President, Secretary and General Counsel of Atlantic Energy, Inc. Senior Vice President, Secretary and General Counsel of Atlantic City Electric Company
86
·.''I.
L
Atlantic Energy, Inc. and Subsidiaries
23
27
EXHIBIT INDEX
Independent Auditors' Consent
Financial Data Schedules for Atlantic Energy, Inc. and Atlantic City Electric Company for periods ended December 31, 1997.
87
1
• L
SECURITIES AND EXCHANGE COMMISSION WASHINGTON, D.C. 20549
FORM 10-K ~ ANNUAL REPORT PURSUANT TO SECTION 13 OR 15(d) of
THE SECURITIES EXCHANGE ACT OF 1934 For the fiscal year ended December 31, 1997
Commission file number 1-1405
Delmarva Power & Light Company (Exact name of registrant as specified in its charter)
Delaware & Virginia (States or other jurisdictions of incorporation or organization)
800 King Street, P. 0. Box 231 Wilmington, Delaware
(Address of principal executive offices)
51-0084283 (I.R.S. Employer Identification No.)
19899 (Zip Code)
Registrant's telephone number, including area code: 302-429-3114
Securities registered pursuant to Section 12(b) of the Act:
Title of each class
First Mortgage Bonds (Series issued prior to 1968)
Preferred Stock, Cumulative, Par Value $100.00 (Series issued prior to 1978)
8.125 % Cumulative Trust Preferred Capital Securities of Delmarva Financing I (Liquidation Value of $25.00)
Name of each exchange on which registered
New York Stock Exchange and Philadelphia Stock Exchange
Philadelphia Stock Exchange
New York Stock Exchange
Securities registered pursuant to Section 12(g) of the Act: None
Indicate by check mark whether the registrant (1) has filed all reports required to be filed by Section 13 or 15(d) of the Securities Exchange Act of 1934 during the preceding 12 months (or for such shorter period that the registrant was required to file such reports), and (2) has been subject to such filing requirements for the past 90 days. Yes X No_
Indicate by check mark if disclosure of delinquent filers pursuant to Item 405 of Regulation S-K is not contained herein, and will not be contained, to the best of the registrant's knowledge, in definitive proxy or information statements incorporated by reference in Part ID of this Form 10-K or any amendment to this Form 10-K. ~
The aggregate market value of the voting stock held by non-affiliates of the registrant as of March 1, 1998 was $0 .
As of March 1, 1998, there were issued and outstanding 1,000 shares of the registrant's common stock, Par Value $2.25.
Capital Spending and Financing Program............................................ I-15
Item 2. Item 3. Item 4.
PART II Item 5. Item 6. Item 7. Item 8. Item 9.
Environmental Matters ........................................................... . Construction Expenditures ........................................... : .......... . Air Quality Regulations ........................................................ . Water Quality Regulations ...................................................... . Hazardous Substances .......................................................... . Other Environmental Matters .................................................... .
Retail Franchises ................................................................ . Number of Employees ........................................................... . Executive Officers of the Registrant ................................................ . Properties ...................................................................... . Legal Proceedings ............................................................... . Submission of Matters to a Vote of Security Holders .................................. .
Market for Registrant's Common Equity and Related Stockholder Matters ................ . Selected Financial Data .......................................................... . Management's Discussion and Analysis of Financial Condition and Results of Operations .. . Financial Statements and Supplementary Data ....................................... . Changes in and Disagreements with Accountants on Accounting and Financial Disclosure .. .
PART III Item 10. Directors and Executive Officers of the Registrant .................................... . Item 11. Executive Compensation ......................................................... . Item 12. Security Ownership of Certain Beneficial. Owners and Management ..................... . Item 13. Certain Relationships and Related Transactions ...................................... .
PART IV Item 14. Exhibits, Financial Statement Schedules, and Reports on Form 8-K ..................... . Signatures .............................................................................. .
Atlantic City Electric Company Telecommunications Act of 1996 Atlantic Energy Enterprises, Inc. Allowance For Funds Used During Construction Accounting Principles Board Accumulated Postretirement Benefit Obligation Atlantic Energy, Inc. Atlantic Thermal Systems Billion Cubic Feet Board of Public Utilities Cost Accounting Manual Conectiv Communications, Inc. Competitive Local Exchange Carrier Code of Conduct Delmarva Power & Light Company Pennsylvania Electricity Generation Consumer Choice and Competition
Act Conectiv Solutions LLC Conowingo Power Company Conectiv Services, Inc . Combustion Turbine Conectiv Thermal Systems, Inc. Decontamination & Decommissioning Fund Delaware Association of Alternative Energy Providers Inc. Delmarva Capital Investments, Inc. 8.125% Junior Subordinated Debentures United States Department of Energy Delaware Public Service Commission Dividend Reinvestment and Common Share Purchase Plan Demand-Side Management Public Service Enterprise Group, Inc. Enhanced Retirement Offers Financial Accounting Standards Board Federal Energy Regulatory Commission Flue Gas Desulfurization Heating, ventilation, and air conditioning Incumbent Local Exchange Carrier Independent System Operator Investment Tax Credits Kilowatt-hour The Private Securities Litigation Reform Act of 1995 Low Level Radioactive Waste Long-Term Incentive Plan Thousand Cubic Feet Managements Discussion and Analysis of Financial Condition and
Results of Operations The merger of the Company and Atlantic Mortgage and Deed of Trust
Maryland Public Service Commission Megawatt Megawatt-hour National Ambient Air Quality Standards Northeast Ozone Transport Region Oxides of Nitrogen Nuclear Regulatory Commission Nuclear Waste Policy Act of 1982 Old Dominion Electric Cooperative Peach Bottom Atomic Power Station PECO Energy Company Pennsylvania-New Jersey-Maryland Interconnection Association Power Plant Performance Program Potentially Responsible Party Public Service Electric and Gas Company Reasonably Available Control Technology Readiness Assessment Team Inspection Real Time Pricing Salem Nuclear Generating Station Systematic Assessment of Licensee Performance Securities and Exchange Commission Statement of Financial Accounting Standards Sulfur Dioxide Star Enterprise United States Environmental Protection Agency Variable Rate Demand Bonds Virginia State Corporation Commission Westinghouse Electric Corporation Public Utility Holding Company Act of 1935
IV
~. PART I
Item 1. Business
The Company
Overview
Delmarva Power & Light Company (the Company) was incorporated in Delaware in 1909 and in Virginia in 1979. The Company's primary businesses include producing, purchasing, delivering, and selling electricity; purchasing, transporting, and selling natural gas; and providing other services which are primarily energy-related. In 1997, the Company's revenues were earned from the following sources: 77% from electricity sales and delivery; 14% from the sale and transportation of natural gas; and 9% from other services.
The Company provides regulated electric service (supply and delivery) to approximately 448,300 customers located on the Delmarva Peninsula and also sells electricity off-system in markets which are not subject to price regulation. The Company's traditional electric service territory on the Delmarva Peninsula, which includes Delaware, ten primarily Eastern Shore counties in Maryland, and the Eastern Shore of Virginia, encompasses an area consisting of about 6,000 square miles with a population of approximately 1.2 million. The Company provides regulated gas service (supply and/or delivery) to approximately 103,200 customers located in an area consisting of about 275 square miles with a population of approximately 480,000 in northern Delaware, including the City of Wilmington. The Company also sells gas off-system in markets which are not subject to price regulation.
In addition to selling competitive electricity and natural gas, the Company also sells other nonregulated/nonutility products and services which include the following: local and long-distance telephone service; heating, ventilation, and air-conditioning (HV AC) products, installation and services; power plant operating services; and certain other services. For additional information on nonutility businesses, see "Business Plans" on page I-2 and "Nonutility Businesses" on page I-13.
For information concerning the Company's business segments, see Note 21 to the Company's 1997 Consolidated Financial Statements included in Item 8 of Part II.
Atlantic Merger
On August 12, 1996, the Company announced plans for a merger with Atlantic Energy, Inc. (Atlantic), an investor-owned holding company located in southern New Jersey, which owned Atlantic City Electric Company (ACE) and nonutility subsidiaries. The final required regulatory merger approval was received from the Securities and Exchange Commission (SEC) on February 27, 1998. On March 1, 1998, a series of merger transactions were consummated. These merger transactions (the Merger) formed Conectiv, a new holding company, and merged Atlantic out of existence. As a result of the Merger, Conectiv owns the Company, the Company's subsidiaries, ACE, and the nonutility subsidiaries formerly held by Atlantic. ACE serves approximately 481,000 customers in a 2,700 square mile area in southern New Jersey. Atlantic's 1997 operating revenues and net income were $1,102.4 million and $74.4 million, respectively, and its total assets were $2,723.9 million as of December 31, 1997.
Conectiv is a registered holding company under the Public Utility Holding Company Act of 1935, as amended (1935 Act). The 1935 Act imposes certain restrictions on the operations of registered holding company systems. In particular, new lines of businesses not otherwise approved under generally applicable regulations cannot be undertaken without prior approval from the SEC.
For additional information about the Merger, refer to Management's Discussion and Analysis of Financial Condition and Results of Operations (MD&A) in Item 7 of Part II, Note 4 to the Company's 1997 Consolidated Financial Statements included in Item 8 of Part II, and the registration statement on Form S-4 dated December 26, 1996.
I-1
Utility Regulation and Industry Restructuring
To date, the Company's regulated electric and gas public utility operations have provided the predominant share of the Company's net earnings. Delaware, Maryland, and Virginia regulate the Company's retail electric sales within areas for which the Company holds retail franchises (see "Retail Franchises" on page I-18). Delaware also regulates the Company's retail gas sales within the State. The Federal Energy Regulatory Commission (FERC) regulates the transmission of electricity, the wholesale sale of electricity, and interchange and other purchases and sales of electricity involving other utilities.
Prices charged to electric utility customers have historically been a "bundled" price which includes the electricity production (supply) cost and the delivery cost (transmission and distribution). State regulatory commissions and legislatures throughout the country are considering or have approved changes to laws and regulations governing the sale and pricing of electricity. Generally, the supply component of the price charged to a customer for electricity would be deregulated, and electric suppliers would compete to supply electricity to customers. Competition is expected to reduce gross margins earned from the supply of electricity. Customers would continue to pay the local utility a regulated price for the delivery of the electricity over the transmission and distribution system.
In Delaware, the Delaware Public Service Commission (DPSC) submitted a report to the Delaware House of Representatives on January 27, 1998, recommending that Delaware customers be able to choose their electricity supplier beginning twelve months after restructuring legislation is enacted. On March 13, 1998, the DPSC sent draft legislation to the Delaware legislature which would provide all Delaware electric retail customers the ability to choose their electric supplier beginning on August 1, 1999. The draft legislation also includes a provision that would allow the DPSC to delay the start date of electric retail competition by up to 12 months. In Maryland, the Maryland Public Service Commission (MPSC) issued an order on December 31, 1997, providing for the phase-in of electric retail competition over a three-year period beginning July 1, 2000.
In Virginia, the Virginia State Corporation Commission (VSCC) Staff advised lawmakers that electric competition should be studied and tested over a five-year period before deciding if retail competition should be implemented. Under restructuring plans in New Jersey and Pennsylvania, all retail customers in those states will be able to choose their electric suppliers by July 1, 2000 and January 1, 2001, respectively. See the MD&A in Item 7 of Part II for additional information about the status of deregulation of the electric utility industry in Delaware, Maryland, Virginia, New Jersey (which regulates ACE's retail electric utility business), and Pennsy I vania.
The electric resale (wholesale) market is highly competitive due to federal legislation enacted in 1992 which provided electric resale customers with a choice of electric suppliers and gave the FERC the authority to order local utilities to provide transmission service to other resale electricity suppliers. In 1996, the FERC issued Order No. 888 which required electric utilities to provide open access to their transmission systems under nondiscriminatory tariffs available to all wholesale sellers and buyers of electricity. For information on the Company's resale business, refer to the MD&A in Item 7 of Part II.
For a discussion of deregulation of the Company's gas business, refer to "Gas Business" on page I-10.
Business Plans
As deregulation of the electric utility industry continues to unfold, the Company is moving ahead with its plan to become a prominent regional player by being first into new markets that complement its utility business and by enhancing its ability to serve additional customers outside of its traditional borders. The Company is growing its businesses by building long-term customer relationships, establishing the Conectiv brand name, marketing products and services that complement the Company's core energy business, and serving more customers in a larger geographic area. To accomplish these goals, the Company has increased investments in marketing/branding programs, new businesses, and infrastructure systems.
I-2
••
•
••
~-I
I
I
On June 30, 1997, the Company launched a campaign to introduce the new Conectiv brand and Conectiv's products and services. The campaign explained that Conectiv is offering energy, telecommunications, heating and cooling, and related services for homes and businesses. Customer response to the new Conectiv brand name has been positive, as evidenced by name recognitio;n and the Company's success in gaining new customers in retail energy pilot programs. The Company is marketing an array of products and services-energy, local and long-distance telephone serviee, HV AC services, and other services-under the Conectiv name. The Company plans to continue its advertising campaigns and other support of the Conectiv brand name.
Over the next year or two, the Company's earnings are expected to be constrained by on-going start-up costs for new businesses, including telecommunications and HV AC. After this start-up period, these investments are expected to contribute to long-term consolidated earnings growth exceeding the utility industry average.
Conectiv's business plans will be carried .out by its three business groups; Conectiv Energy Delivery, Conectiv Energy Supply, and Conectiv Enterprises. The business groups are aligned with customers' needs, markets, and the future structure of the utility industry. The business groups are discussed below.
Conectiv Energy Delivery
Conectiv Energy Delivery will deliver electricity and gas to retail and wholesale customers within its service territory. These delivery services are structured into various forms of price-regulated offers, some including energy supply, so that customers may choose the combination that provides the best value. Customer satisfaction and loyalty is expected to remain high due to the Company's reliable delivery systems, superior customer service, and competitive cost and pricing structures.
Conectiv Energy Supply
Conectiv Energy Supply will manage the generating assets, bulk energy marketing and trading activities, and the transitiol! of those assets and activities from a regulated to a competitive environment. Its principal products are electric power and natural gas, supplemented by other fuels and related energy management services. Its customers are bulk energy users and retail aggregators in the region stretching from the Delmarva peninsula north through New England and west to Ohio. ·
Conectiv Enterprises
Conectiv Enterprises is comprised of the following five start-up businesses: Conectiv Communications, Inc. (CCI)-provides local and long distance telephone services; Conectiv Energy-primarily sells energy in competitive retail markets; Conectiv Services, Inc. (CSI)-provides a full range of HV AC services; Conectiv SolutionsLLC-provides customized solutions to customers' energy needs; and Conectiv Thermal Systems, Inc. (currently Atlantic Thermal Systems, Inc.)-provides custom thermal heating and cooling systems. These businesses provide an opportunity to grow Conectiv's customer base throughout the Mid-Atlantic region and strengthen its relationship with customers in its traditional service territory. Conectiv Enterprises expects to incur operating losses for the first year or two after the Merger due to start-up costs.
For more detailed information about Conectiv Enterprises' businesses and other nonutility businesses, refer to "Nonutility Businesses" on page 1-13.
1-3
Electric Business
Installed Capacity
The megawatts (MW) of net installed summer electric generating capacity available to the Company to serve its peak load as of December 31, 1997 is presented below.
Total ........................................................ . 3,328 100 -
The net generating capacity available for operations at any time may be less than the total net installed generating capacity due to generating units being temporarily out of service for inspection, maintenance, repairs, or unforeseen circumstances. See "Item 2-Properties" on page I-20 for a listing of net installed generating capacity by station.
Energy Supply Plan
The objective of the Company's energy supply plan is to provide an adequate, reliable, and competitively priced supply of electricity to customers, in compliance with environmental laws and regulations. This plan, which is updated annually, is based on forecasts of customers' demand for electricity and reserve requirements of the Pennsylvania-New Jersey-Maryland Interconnection Association (PJM Interconnection). (See page I-5 for information on the PJM Interconnection.) The plan emphasizes balance and flexibility, and may be accelerated, slowed, or altered in response to changing energy demands, fluctuating fuel prices, and emerging technologies. The current plan closely matches customers' electricity requirements and relies primarily on short-term power purchases to satisfy incremental needs. Customer-oriented load management and conservation programs and new or renovated power plants are also evaluated as incremental energy supply sources.
Reserve Margin
The Company's peak load in 1997 was 2,852 MW on July 15th, compared to the Company's previous historical peak demand of 2,602 MW which occurred on August 4, 1995. Because adequate generation was available at the time, these peaks do not reflect full implementation of the Company's demand-side programs, including the curtailment of large interruptible customers. The Company's PJM Interconnection capacity obligation, including a reserve margin, is based on normal weather conditions and full implementation of its demand-side programs, which the Company estimates would have resulted in a peak of 2,706 MW in 1997. Based upon this estimated peak and the Company's installed generating capacity of 3,162 MW at the time of the peak, the Company's reserve margin would have been 17%. The Company's reserve obligation varies from year to year, but typically is around 18%. As discussed under "Purchased Power," the Company uses short-term capacity-only purchases to satisfy any temporary capacity deficiencies related to obligations under the PJM • ~ Interconnection agreement. ~
I-4
••
~.
Pennsylvania-New Jersey-Maryland Interconnection Association
As a member of the PJM Interconnection, the Company's generation and transmission facilities are operated on an integrated basis with other electricity suppliers in Pennsylvania, New Jersey, Maryland, and the District of Columbia. This power pool improves the reliability and operating economies of the systems in the group and provides capital economies by permitting shared reserve requirements on a group basis. The PJM Interconnection's installed capacity as of December 31, 1997 was 57,216 MW. The PJM Interconnection peak demand during 1997 was 49,408 MW on August 15th, which resulted in a summer reserve margin of 14.8% (based on installed capacity of 56,731 MW on that date).
On November 25, 1997, the FERC approved a restructuring plan for the PJM Interconnection. The approved restructuring plan recognizes the PJM Interconnection as an Independent System Operator (ISO) and provides open access transmission service on a pool-wide basis.
The FERC generally was satisfied that the PJM Interconnection restructuring proposal met the governing and operational standards concerning formation of an ISO, which were established by FERC in Order No. 888. The ISO will be responsible for the system operations and regional transmission planning. In addition, the FERC also approved operation of the PJM Interconnection's Power Exchange by the PJM Interconnection.
The FERC Order approved the plan's use of single transmission rates based on the costs of the transmission system where the point of delivery is located. There are eight such transmission systems within the PJM Interconnection system. The FERC Order also approved locational marginal pricing for transmission congestion costs. The price of transmission constrained interfaces will be based on price differences on opposite sides of the constraint.
The PJM Interconnection ISO went into operation as of January 1, 1998. Changes to the PJM Interconnection Open Access Transmission Tariff become effective April 1, 1998.
Purchased Power
The Company makes economic short-term electricity purchases from several sources in an effort to replace higher-cost generation. During 1997, purchases were made from 46 utilities and power marketers.
Long-term purchased power contracts also provide a portion of the Company's electric capacity and energy. The Company has a contract to purchase 48 MW of peaking capacity through May 2018 from the Delaware City Power Plant owned by Star Enterprise (Star). The capacity obligations of Star and the Company under the contract were suspended from October 1, 1996 until June 1, 2000. Delmarva continues to purchase energy under the Star contract. In conjunction with its acquisition of Conowingo Power Company (COPCO) in 1995, the Company is purchasing from PECO Energy Company (PECO) 212 MW of base-load capacity and associated energy, which increases to 279 MW by 2006 when the contract expires. The Company is currently purchasing 155 MW of capacity under one-year contracts from various suppliers. In addition, capacity-only purchases with a term of less than one-year (135 MW as of December 31, 1997) are also made from time-to-time to meet continuing PJM Interconnection capacity obligations.
Demand Side Management Programs
As of the end of 1997, the Company had enrolled in its demand-side programs about 103,400 residential customers and about 1,800 commercial and industrial customers who, in the aggregate, provide the Company with the ability to reduce its peak by approximately 272 MW. The Company's portfolio of demand-side management (DSM) programs has been restructured to address concerns about the cost effectiveness and appropriateness of demand-side management resources given the availability and cost of supply-side options and the various uncertainties surrounding restructuring of the electric industry. The DPSC, the MPSC, and the VSCC have all addressed the Company's concerns by approving modifications to the Company's existing DSM programs.
I-5
Nuclear Power Plants
The Company's nuclear capacity is provided by Peach Bottom Atomic Power Station (Peach Bottom) Units 2 and 3 and by Salem Nuclear Generating Station (Salem) Units 1 and 2. The Company jointly owns these units, as tenants in common, with PECO, ACE and Public Service Electric and Gas Company (PSE&G). The Peach Bottom units are operated by PECO and have a combin~d summer capacity of 2, 186 MW, of which the Company is entitled to 164 MW (7.51 %). The Salem units are operated by PSE&G and have a combined summer capacity of 2,212 MW, of which the Company is entitled to 164 MW (7.41 %).
The operation of nuclear generating units is regulated by the Nuclear Regulatory Commission (NRC). Such regulation requires that all aspects of plant operation be conducted in accordance with NRC safety and environmental requirements and that continuous demonstrations be made to the NRC that plant operations meet applicable requirements. The NRC has the ultimate authority to determine whether any nuclear generating unit may operate.
For a discussion of the cycle of production, use and disposal of nuclear fuel, see ''Fuel Supply for Electric Generation" on page I-7.
For a discussion of the Company's funding of its share of the estimated future cost of decommissioning the Peach Bottom and Salem nuclear reactors, see Note 7 to the Company's 1997 Consolidated Financial Statements included in Part II, Item 8.
As by-products of their operations, nuclear generating units, including the Peach Bottom and Salem units, produce low level radioactive waste (LLRW). LLRW is accumulated at on-site interim storage facilities with five-year storage capacities and then shipped to a federally licensed disposal facility. Peach Bottom and Salem are currently shipping LLRW to the disposal site located in Barnwell, South Carolina.
PECO has informed the Company that Pennsylvania is pursuing development of its own LLRW disposal site via a volunteer plan option. PSE&G also has informed the Company that New Jersey has introduced a volunteer siting process to establish a LLRW disposal facility by the year 2000. To date, no volunteers have been identified in either state. In New Jersey, the state agency responsible for the volunteer siting program recommended to the Governor that this effort be abandoned due to the lack of volunteer sites.
Peach Bottom Units
PECO has informed the Company that on July 17, 1997, the NRC issued its periodic Systematic Assessment of Licensee Performance (SALP) Report on the performance of activities at Peach Bottom for the period October 15, 1995 to June 7, 1997. SALP reports rate licensee performance in four assessment areas: Operations, Maintenance, Engineering and Plant Support. Ratings range from a high of "l" to a low of "3". Peach Bottom received a rating of "1" in the areas of Operations, Maintenance, and Plant Support, and "2" in Engineering. PECO has informed the Company that the NRC observed excellent performance at Peach Bottom during the assessment period. The NRC noted that station management provided excellent oversight and control of engineering activities throughout the period. The NRC also noted that while overall engineering performance was good, there were several instances where operating procedures, surveillances, and tests were not consistent with the design and licensing bases.
On October 3, 1997, Peach Bottom Station completed an all-time record 206 days of continuous dual unit operation.
The Company was informed by PECO of crack indications that were found in certain reactor vessel internal piping during the Fall 1997 refueling outage for Peach Bottom Unit 3. PECO further advised that Unit 3 is being limited to 94% of normal electric output until permanent repairs are made during a March 1998 outage.
I-6
Salem Units
Salem Units 1 and 2 were removed from operation by PSE&G in the second quarter of 1995 due to operational problems, and maintenance and safety concerns. After receiving NRC authorization, PSE&G returned Unit 2 to service on August 30, 1997. Due to degradation of a significant number of tubes in the Unit 1 steam generators, PSE&G replaced the Unit 1 steam generators. The Company has been informed by PSE&G that the NRC's Readiness Assessment Team Inspection (RATI) of Salem Unit No. 1 was completed on February 20, 1998. The inspection team concluded that Salem Unit 1 was ready to return to operation. PSE&G expects Unit 1 will return to service in the second quarter of 1998, subject to final NRC approval.
On June 25, 1997, the NRC met to discuss, and update, its "Watch List" plants. Salem Units 1 and 2 remained on the Watch List as a Category 2 plant. A Category 2 plant is identified as having weaknesses that warrant increased NRC attention until the licensee demonstrates a period of improved performance.
See Note 18 to the Company's 1997 Consolidated Financial Statements included in Part II, Item 8, for information concerning (i) the Company's lawsuit against Westinghouse Electric Corporation, the designer and manufacturer of the Salem steam generators, (ii) settlement of the Company's lawsuit against PSE&G with respect to Salem operations, (iii) the ratemaking treatment of the PSE&G lawsuit settlement proceeds and replacement power costs incurred during the outage, and (iv) the financial impact of the outages. Also see Item 3, Legal Proceedings, for additional information concerning settlement of the Company's lawsuit against PSE&G with respect to Salem operations.
PSE&G has informed the Company that it is implementing the 1994 New Jersey Pollutant Discharge Elimination System permit issued for Salem which requires, among other things, water intake screen modifications and wetlands restoration. In 1999, PSE&G must apply to renew the permit.
Cost of Output for Load
The following table sets forth the Company's annual generation output, fuel cost per megawatt hour (MWh), and generation mix by unit fuel type for all Company-owned facilities. Coal is the Company's predominant fuel. Corresponding values for purchased power and for net interchange (purchases less sales) as a member of the PJM Interconnection are also listed.
The Company's electric generating capacity by fuel type is shown under "Electric Business-Installed Summer Capacity,'' on page I-4. To facilitate the purchase of adequate amounts of fuel at reasonable prices, the
I-7
Company contracts with various suppliers of coal, oil, and natural gas on both a long- and short-term basis. The Company's long-term coal contracts generally contain provisions for periodic and limited price adjustments, which are based on current market prices. Oil and natural gas contracts generally are of shorter term with prices determined by market-based indices.
Coal
Edge Moor Units 3 and 4, and the Indian River, Keystone and Conemaugh generating stations are coal-fired. During 1997, 10% of the Company's coal supply was purchased under short-term contracts (less than three years), 78% under long-term contracts (up to ten years), and the balance on the spot market. As of December 31, 1997, a maximum of 74% of the Company's coal requirements were under supply contracts. The Company does not anticipate any difficulty in obtaining adequate amounts of coal at reasonable prices.
Oil
Currently, 80% to 100% of the residual oil used in Edge Moor Unit 5 is supplied under a two-year contract which expires in 1998. Any amount over 80% of requirements may be purchased in the spot market. Natural gas is utilized when economically feasible. The residual oil supply contract for the Vienna Generating Station provides 90% to 100% of that station's requirements under a two year contract that expires in 1999. Any amount over 90% of requirements may be purchased in the spot market.
Gas
Natural gas, which is the primary fuel for the three combustion turbines (CTs) at the Company's Hay Road site and a secondary fuel at Edge Moor Unit 5, is supplied partly through contracts described under ''Gas Operations" on page I-11. Additional natural gas is purchased on a firm or interruptible basis from suppliers such as marketers, producers, and utilities. The secondary fuel for the Hay Road CTs is kerosene, which is purchased on the spot market.
Nuclear
The supply of fuel for nuclear generating units involves the mining and milling of uranium ore to uranium concentrate, conversion of the uranium concentrate to uranium hexafiouride gas, enrichment of the uranium hexafiouride gas, conversion of the enriched gas to fuel pellets, and fabrication of fuel assemblies. After spent fuel is removed from a nuclear reactor, it is placed in temporary storage for cooling in a spent fuel pool at the nuclear station site. The federal government has an obligation for the transportation and ultimate disposal of the spent fuel, as discussed below.
PSE&G has informed the Company that it has several long-term contracts with uranium ore operators, converters, enrichers and fabricators to process uranium ore to uranium concentrate to meet the currently projected requirements for Salem. The Company has also been advised by PECO that it has similar contracts to satisfy the fuel requirements of Peach Bottom 2 and 3. Currently, there is an adequate supply of nuclear fuel for Salem and Peach Bottom.
In conformity with the Nuclear Waste Policy Act of 1982 (NWPA), PECO and PSE&G have entered into contracts with the United States Department of Energy (DOE) on behalf of the joint owners providing that the federal government shall for a fee take title to, transport, and dispose of spent nuclear fuel and high level radioactive waste from the Peach Bottom and Salem reactors. In accordance with the NWPA, the Company pays the DOE one-tenth of one cent per kWh of nuclear generation (net of station use) for the future cost of spent nuclear fuel disposal. Under the NWPA, the DOE was to begin accepting spent fuel for permanent off-site storage no later than January 1998. However, no such repositories are in service or under construction. The DOE has stated that it would not be able to open a permanent, high level nuclear waste storage facility until 2010, at • ~, the earliest. On November 14, 1997, the U.S. Court of Appeals ruled that the plaintiffs in Northern States Power ~
I-8
Co., et al vs. U.S. Department of Energy and the United States of America ''have a clear right to relief, and the Department has a clear duty to act." The plaintiffs include 42 nuclear utilities and 61 states, state agencies and municipal governments. The U.S. House of Representatives and the U.S. Senate passed separate bills in 1997 authorizing construction of a temporary storage facility which could accept spent nuclear fuel from utilities beginning in 2003. The Company cannot predict when or if the DOE will accept nuclear fuel as no repository or other storage facility currently exists or is under construction.
In 1990, the NRC determined that spent nuclear fuel generated in any reactor can be stored safely and without significant environmental impact in reactor facility storage pools or in independent spent nuclear fuel storage installations located at or away from reactor sites for at least 30 years beyond the licensed life for operation (which may include the term of a revised or renewed license). PECO has advised the Company that Peach Bottom has adequate on-site temporary spent fuel storage capability until 2000 for Peach Bottom Unit 2 and 2001 for Unit 3. PECO has also advised the Company that it is constructing an on-site dry storage facility which is expected to be operational in 2000 to provide additional storage capacity. PSE&G also has advised the Company that, as a result of replacing the existing high density racks in the spent fuel storage pools of Salem Units 1 and 2 with maximum density racks, the availability of adequate spent fuel storage capacity is conservatively estimated through 2012 for Unit 1 and 2016 for Unit 2.
The Energy Policy Act of 1992 provided for creation of a Decontamination & Decommissioning (D&D) Fund to pay for the future clean-up of DOE gaseous diffusion enrichment facilities. Domestic utilities and the federal government are required to make payments to the D&D Fund until 2008 or $2.25 billion, adjusted annually for inflation, is collected. The liability accrued for the Company's share of the D&D Fund was $5.9 million as of December 31, 1997. The Company is recovering this cost through fuel adjustment clause revenues which are discussed below.
Electric Regulatory Matters
There were no electric or gas base rate increases in 1997. See Note 4 to the Company's 1997 Consolidated Financial Statements included in Part II, Item 8, for information concerning expected base rate decreases related to the Company's Merger with Atlantic.
For information concerning regulatory matters associated with restructuring of the electric utility industry, refer to the MD&A in Item 7 of Part II.
Delaware Depreciation Filing
On December 15, 1995, the Company filed an electric depreciation study in Delaware based on 1994 plant balances. The Company requested an increase in depreciation rates of $868,499 or a 0.18% revenue increase on a Delaware retail basis. On April 28, 1997, the DPSC approved a settlement, which had a de minimis effect on depreciation in the aggregate, but shifted $1 million of Delaware retail electric depreciation expense from transmission and distribution to production. Comparable treatment was obtained from the MPSC in 1996. A filing was made late in 1997 and is pending before the FERC to obtain a comparable result for FERC wholesale electric depreciation expense.
Electric Fuel Adjustment Clauses
The Company's electric tariffs generally include fuel adjustment clauses that permit the collection of the costs of fuel burned in generating stations and the variable (energy) costs of purchased and net interchange power from the Company's retail and resale electric customers. Fuel and energy costs are deferred and charged to operations based on costs billed to customers under the Company's electric tariffs. For the Delaware, Virginia, and FERC jurisdictional customers, the clauses are based upon estimated annual fuel costs. For the Maryland jurisdictional customers, the clause is based on historical average costs. Supporting data is filed with and audited by the various commissions and formal hearings are held at periodic intervals as required by law. Fixed costs
1-9
(capacity or demand charges) associated with purchased power transactions entered into for reliability reasons generally are subject to base rate recovery. The present status or results of significant fuel rate issues are discussed below. As of December 31, 1997, the Company had accrued fuel disallowance reserves that adequately provide for disallowances of fuel costs and penalties related to the issues discussed below.
Both Delaware and Maryland have programs that assess the overall performance of the Company's 15 major generating units. Under the DPSC's Power Plant Performance Program (PPPP), the Company can receive financial rewards or penalties, which will not exceed an estimated cap of $1.7 million in 1998. The 1996 and 1997 PPPP results are not material to the Company's financial position or results of operations. If the Company does not meet an overall system performance standard set by Maryland's Generating Unit Performance Program, the MPSC can disallow certain fuel costs of units that operated below their individual performance standards. The Company did not meet the 1996 or 1997 overall system standards due principally to the Salem outage.
In May 1996 and May 1997, the Company filed applications with the VSCC for revised fuel rates to be effective July 1996 and July 1997, respectively. Similarly, the Company filed applications with the MPSC in June 1996, May 1997, and November 1997 for revised fuel rates to become effective in August 1996, July 1997, and January 1998. In all five filings, the Company proposed that 50% of the replacement power costs associated with the Salem outage be permitted on an interim basis until a full review of the outage occurs at a future time. For all five filings the Company has received commission approvals to collect the proposed interim rates. The rates are collected subject to refund. The November 1997 MPSC filing is still progressing through the standard Maryland fuel rate hearing process.
In August 1997, the DPSC approved a settlement regarding the ratemaking treatment of replacement power costs attributable to the Salem outages and $12 million of proceeds received from PSE&G for settlement of the Company's lawsuit concerning Salem operations. The DPSC settlement provided for recovery of approximately one-half of the replacement power costs and retention of two-thirds of the PSE&G settlement payment by the Company's stockholders. The Company's results of operations and financial position reflect the financial impact of the Delaware settlement and comparable future settlements anticipated in the Company's other jurisdictions. Under the terms of the Delaware settlement, the Company will credit Delaware jurisdictional customers' fuel rates by approximately $15.6 million. Comparable settlements in the Company's other jurisdictions would result in an additional credit to customer fuel rates of approximately $9.6 million. Deferred energy costs on the Company's balance sheet were reduced by these anticipated credits to customer fuel rates. In 1998, the Company expects approximately $25,000 per day (total of all jurisdictions) of additional fuel expense disallowances for each day Salem Unit 1 remains out of service. The Company currently expects Salem Unit 1 to return to service in the second quarter of 1998.
As the utility industry is restructured, fuel adjustment clauses are expected to be eliminated, and any differences between energy costs and related revenues will impact future earnings. To manage the price risk associated with its unregulated, off-system energy sales, the Company is currently engaging in commodity hedging activities, through both physical transactions and energy derivatives. When energy sales are deregulated in the Company's service territory, price risk is expected to be managed similarly for these sales. As discussed, under "Gas Regulatory Matters" the Company has proposed to the DPSC a gas price hedging/risk management program with respect to gas supply for regulated customers.
Gas Business
Deregulation
Effective April 1, 1996, natural gas pricing and service options offered to customers within the Company's service territory were restructured under a DPSC-approved settlement. The settlement unbundled and separately priced several services, enabling large and medium volume commercial and industrial customers to purchase only the services that they need. These customers may purchase gas from the Company, or directly from other • suppliers and make arrangements for transportation to their facilities. The Company's transportation customers
1-10
~.
~.
pay a fee, which may be either fixed or negotiated, for the use of the Company's gas transmission and distribution facilities.
The settlement mentioned above also authorized off-system gas sales and other ''non jurisdictional merchant sales services." Earnings from gas sales which are off the Delmarva Peninsula and do not use the Company's gas system assets benefit the Company's stockholders. For other off-system gas sales and nonjurisdictional merchant sales services, the Company's stockholders retain 20% of the margin (revenues net of fuel costs) earned, and the remaining 80% reduces fuel rates charged to firm customers.
On July 18, 1997, the Delaware Association of Alternative Energy Providers, Inc. ("DAAEP") filed a complaint with the DPSC seeking to require the Company to open the balance of its retail natural gas supply market to competition. The Company has entered into discussions with the parties to the complaint case, and anticipates that such discussions may result in a proposal to begin the availability of gas supplier choice to the Company's residential customers and the balance of its commercial and industrial customers.
Gas Operations
The Company purchases gas supplies from marketers and producers under spot market, short-term, and long-term agreements. As shown in the table below, the Company's maximum 24-hour system capability, including natural gas purchases, storage deliveries, and the emergency sendout capability of its peak shaving plant, is 206,960 thousand cubic feet (Mcf).
Total ............................................... . 206,960
The Company experienced an all-time daily peak in combined firm sales and transportation sendout of 158,810 Mcf on January 17, 1997 during milder weather than system design weather conditions of 0° Fahrenheit. The Company's peak shaving plant liquefies, stores, and re-gasifies natural gas in order to provide supplemental gas in the event of pipeline supply shortfalls or system emergencies.
During 1997, the average production cost of all gas sold to on-system customers was $4.30 per Mcf, compared with $3.59 and $2.95 per Mcf in 1996 and 1995, respectively.
Gas Regulatory Matters
Similar to the Company's Delaware electric fuel adjustment clause, a gas cost rate clause provides for the billing of gas costs to the Company's regulated gas customers based on estimated annual gas costs. Gas costs for regulated, on-system customers are deferred and charged to operations based on costs billed to customers under the gas cost rate clause.
In accordance with the terms of a settlement agreement with the DPSC, the Company has proposed a gas price hedging/risk management program with respect to gas supply for regulated customers. The program would seek to limit regulated customers exposure to commodity price uncertainty. The Company expects the DPSC will approve its proposal, or modified version thereof, during the second quarter of 1998. The Company proposed that any costs or benefits of the program be included in the gas cost rate clause, resulting in no effect on the Company's earnings.
1-11
:,
Other Regulatory Matters
Special Contract Rate Tariffs
As previously reported, the Company has the ability to enter into negotiated contracts with retail electric customers in Maryland, and retail electric and natural gas customers in Delaware. In addition, in late 1996 and early 1997, the Company received approval of "Real Time Pricing" (RTP) tariffs in Maryland and in Delaware, respectively. The Company currently has an approved experimental RTP tariff in Virginia. Such RTP tariffs provide additional flexibility in providing pricing and service to certain large customers.
Cost Accounting Manual/Code of Conduct
The Company has cost allocation and direct charging mechanisms in place to ensure that there is no crosssubsidization of its competitive activities by regulated utility activities. At the end of February 1997, the Company filed an application requesting the DPSC to approve a Cost Accounting Manual (CAM), which describes these accounting procedures. The Company's CAM filing also included a proposed Code of Conduct (Code) governing the Company's regulated utility activities and its competitive activities.
In response to Joint Resolutions passed by the General Assembly in mid-1997, the DPSC issued an order on January 27, 1998 in the CAM and Code proceeding. The DPSC adopted both the CAM and Code, with certain modifications, conditioned upon the parties agreeing to auditing procedures and submitting them to the DPSC by March 16, 1998. The major recommendations of the DPSC were as follows: no structural or operational separation required; no ban on shared resources; no ban of, or fees on, employee transfers at this time; no capital restrictions; no prohibition on use of a common brand name or on disclosures of affiliation with the utility; and no prohibition on sales leads, joint offerings and promotions (all of which will be accompanied by proper • disclosures and recordkeeping to monitor compliance with proper disclosures). No utility customer information may be used for any nonutility purpose by the Company's competitive businesses or by third parties without the customer's express written consent. Telephone numbers for regulated and competitive activities must be separate and, starting July 1, 1998, competitive businesses cannot include charges in the utility bill unless access is also provided to third parties. Extensive reporting and compliance procedures were adopted and additional internal and external auditing will be required. The issuance of this order also terminates the prior limitation imposed by the General Assembly on the growth in new employees in the energy services businesses.
In response to a claim brought by the Delaware Alliance for Fair Competition during the pendency of that proceeding, on November 18, 1997 the DPSC issued an order finding that the Company was in violation of the Code filed in February 1997 (the interim Code the Company was operating under until the proceeding was completed). The DPSC directed the Company to require employees to notify customers of the existence of thirdparty competitors regardless of how the interaction between the customer and employee arose. This meant that even when in contact with a customer on nonutility business, employees had to inform customers that other competitors could provide the same service. The Company filed an appeal and request to stay the order with Kent County Superior Court on November 25, 1997. The Court denied the motion for a stay on December 22, 1997. The appeal is proceeding in the normal course. The interim Code has been superseded by the Code adopted in the DPSC's January 27, 1998 order, and the third-party competitor notification requirement imposed by the Commission in its November 1997 order has been eliminated. The outcome of the appeal is not expected to have a material effect on the Company's results of operations or financial position.
On January 24, 1997, the MPSC instituted an investigation, in the form of a quasi-legislative proceeding, into ''affiliated transactions and affiliated standards of conduct'' for all companies providing gas or electric service in Maryland, including the Company. On February 23, 1998, the MPSC issued an order, the implications of which have not yet been fully analyzed. The order provides for two sets of Code of Conduct provisions • ~ applying to Maryland utilities and their competitive businesses: one applying to energy merchant activities, and ~
I-12
one applying to all other competitive activities. For affiliated companies that are not selling electricity or natural gas, the Code provisions adopted by the MPSC impose few requirements, primarily involving non-discriminatory and non-preferential provision of utility services to the competitive business affiliated with the utility and that business's customers. For affiliated companies that are selling electricity or natural gas on a competitive basis to customers (i.e., the energy merchant function), the Code adopted by the MPSC imposes additional requirements, including restricting joint sales calls to circumstances where the customer has made a request for a joint call; prohibiting joint promotions unless such promotions are offered to other competitors on the same terms and conditions; prohibiting the provision of sales leads from the utility to the merchant affiliate, and prohibiting the use of utility customer information without the informed written consent of the customer (although the MPSC order does seem to allow the use of mailing lists obtained from the utility information database). While the MPSC found that full structural separation between a utility and its competitive businesses is not necessary, the order requires separation of the utility's and its affiliates' operational and managerial employees, and prior MPSC approval of other types of employees which will provide services to both utility and competitive businesses. Furthermore, the MPSC order did not prohibit the use of a common name or logo, but requires a prominent disclaimer anytime a common name or logo is used, stating that the affiliate and utility are separate entities.
The full financial implications of this MPSC order are uncertain. However, some general observations about its potential consequences can be made. The requirement that separate operational and managerial employees be maintained could have several impacts, including implications about the way the Company and the Conectiv system of companies are organized, and the ability of the Company to capture economies of common management and efficient deployment of personnel without needlessly duplicating personnel functions to meet a "separation" requirement. The prohibition on joint promotions may impact the Company's one-stop-shopping Conectiv brand campaign. Moreover, the Company is trying to determine the implications of the Order regarding the Conectiv brand campaign and the use of the Conectiv logo on utility vehicles arising from the requirement that a disclaimer be prominently displayed any time a common name or logo are used.
One or more parties to the case may request rehearing or appeal the order and the ultimate outcome cannot be predicted. The Company has not yet determined what, if any, such action to take.
Virginia Affiliates Act
In Virginia, certain types of transactions between the Company and its affiliates may require the prior approval of the VSCC under the Virginia Affiliates Act. Exemptions from this approval requirement are available pursuant to a recently-enacted Affiliates Act amendment, but none, to the Company's knowledge, have yet been granted by the VSCC. The Company has filed applications with the VSCC under the Affiliates Act for exemption from the approval requirement, or approval of transactions between the Company and its affiliates, and, except for applications covering the service company for Conectiv, post-Merger and certain past transactions, all of these applications have been approved.
Nonutility Businesses
The Company's principal current and planned nonutility businesses are discussed below. These nonutility businesses are conducted through wholly owned subsidiaries, a joint venture, and operating divisions of the Company.
Conectiv Communications, Inc.
Enactment of the Telecommunications Act of 1996 (the Act) provided an opportunity for CCI to become a full service telecommunications company, marketing local and long distance services as well as carrier, network, and data services. The Act was designed to bring the benefits of competition to the local telephone market that residential and business customers already enjoyed for long distance service. In effect, the law is intended to put an end to the long history of monopoly service in the local telephone market. The law requires an incumbent local exchange carrier (ILEC), such as Bell Atlantic, to interconnect its local network with the equipment of a
I-13
competitive local exchange carrier (CLEC) such as CCI; provide CLECs access to any elements of the ILEC network that a CLEC needs to provide service; resell retail ILEC services to CLECs at a wholesale rate; and permit CLECs to locate telecommunications equipment on the ILEC's premises.
During 1997, CCI took a variety of steps toward becoming a full-service telecommunications provider in the region which includes the State of Delaware, Southeastern Pennsylvania, Southern New Jersey and the Eastern Shore of Maryland. The Company negotiated an interconnection agreement with Bell Atlantic and applied for necessary regulatory approvals. To fulfill its business plan of being a facilities-based telecommunications provider, CCI began construction of telecommunications facilities to connect the existing fiber optic network (acquired from Delmarva Power & Light Company) with Bell Atlantic central offices. To date CCI has built to eight Bell Atlantic central offices in Delaware, and has physically collocated its own telecommunications equipment in those Bell Atlantic facilities. On November 17, 1997, CCI began providing local, regional, and long distance service to business and residential customers in Delaware and Southeastern Pennsylvania. This service is provided initially by reselling Bell Atlantic service obtained at a wholesale discount. These customers will migrate to facilities-based CCI service as soon as facilities are constructed. Service in Southern New Jersey and the Eastern Shore of Maryland will commence in 1998.
CCI's strategy of providing facilities-based telecommunications service will require capital expenditures to further expand CCI' s existing fiber optic network over the next several years. For information concerning the assets owned by CCI as of December 31, 1997, see Item 2, Properties.
CCI currently operates in a duopoly local service environment with Bell Atlantic. Competition may increase from other telecommunications companies seeking to establish a local service presence in the region.
The regulations within each state under which CCI operates requires the filing of a general tariff detailing the pricing and descriptions of each service offering. These tariffs are based on a market pricing system rather than the traditional cost-of-service based regulation model. Telecommunications tariff filings have been made in and approved by the states of Delaware and Pennsylvania for the provision of local telephone services. Tariff filings have also been made with the Federal Communications Commission for the provision of domestic and international long distance services. These tariff filings have been approved, authorizing CCI to provide retail local and long distance phone services. In the first quarter of 1998, the Company will file tariffs for similar local retail authority in the states of New Jersey and Maryland. The New Jersey filing is considered an informational filing and does not require any action prior to offering service in the state.
Conectiv Energy
Conectiv Energy currently sells competitive natural gas, electricity, and energy related products and services to residential and commercial customers in the Mid~Atlantic region. (Conectiv Energy was operated as a division of the Company as of December 31, 1997.) Retail customers' favorable response to the Conectiv brand has been a key to acquiring new retail customers in competitive markets. In 1997, Conectiv Energy obtained approximately 7 ,700 gas customers and 32,200 electric customers. The costs associated with acquiring new customers, timing of market entry, gross margins on sales, and regulations governing the transition to competition are factors critical to this business.
Conectiv!CNE Energy Services, LLC
In September 1997, the Company announced that through its Conectiv Energy Supply group it formed a joint venture with Connecticut Energy Corporation to sell natural gas, electricity, fuel oil, and other energyrelated products and services in New York and New England. The new energy marketing and sales company is operating under the name Conectiv/CNE Energy Services, LLC.
Conectiv Services, Inc.
CSI is a full-service HVAC business operating in the Mid-Atlantic region. CSI provides commercial • ~ customers with mechanical HV AC/piping construction and installation, design services, sheet metal fabrication, ~
1-14
~.
preventative maintenance and repair services. Residential offerings include HV AC installation, maintenance, repair and related plumbing services. The regional HV AC and plumbing industry is highly competitive, fragmented, and rapidly consolidating. The sales and earnings of HV AC businesses are affected by weather conditions. CSI originated through acquisitions of established businesses, and its future growth will be impacted by the availability of acquisition candidates and any regulatory limits imposed on market access.
Conectiv Solutions LLC
The Company and Atlantic established Conectiv Solutions LLC (Conectiv Solutions), in order to jointly conduct the business activities described herein. Conectiv Solutions is building close customer relationships by understanding individual customers' energy-related needs, and meeting those needs with customized, turnkey solutions. Conectiv Solutions provides large cominercial and industrial customers, primarily within the Delaware Valley region, with energy and energy-related products and services. These products and services are built around occupant comfort, reliability of systems, and cost containment and reduction. Conectiv Solutions provides energy efficiency services, power systems consulting, custom on-site energy systems' services and construction, telecommunication services, and energy procurement. In addition, Conectiv Solutions offers the HV AC and telecommunications services provided by CSI and CCL
Conectiv Thermal Systems, Inc.
Atlantic Thermal Systems (ATS), owned by Atlantic prior to the Merger, will become Conectiv Them1al Systems, Inc. (CTS) shortly after ~e Merger. CTS will provide products and services offered by ATS prior to the Merger, including heating, cooling and related energy services to large commercial and industrial customers. In conjunction with these services, ATS develops, finances, constructs, owns and operates thermal energy production and distribution plants. Targeted customer groups include gaming/hotel resort complexes, colleges and universities, health care facilities and industrial complexes. ATS offers a highly customized service tailored to meet each customer's specific energy needs. Through ATS' energy outsourcing programs, customers are able to reduce their capital expenditures on non-strategic assets, realize energy cost savings, and free themselves from energy matters, which are incidental to their principal business activities.
Delmarva Capital Investments, Inc.
Delmarva Capital Investments, Inc. (DCI) is primarily involved in power plant operating services, real estate activities, and leveraged equipment leases. As part of the Company's intent to divest of non-strategic assets, a subsidiary of DCI sold its landfill and waste-hauling operations in 1997, as discussed in Note 5 to the Consolidated Financial Statements included in Item 8 of Part II.
Atlantic Energy Enterprises, Inc.
The nonutility businesses owned before the Merger by Atlantic Energy Enterprises, Inc. (AEE-previously a nonutility subsidiary of Atlantic) are now held by Conectiv. These nonutility businesses include cogeneration power projects, real estate, leveraged leases, investments in energy-related technology growth companies, telecommunications, and gas marketing.
Capital Spending and Financing Program
For financial information concerning the Company's capital spending and financing program, refer to "Liquidity and Capital Resources" in the MD&A included in Item 7 of Part II and Notes 10 to 13 to the Company's 1997 Consolidated Financial Statements, included in Item 8 of Part IL
The issuance of First Mortgage Bonds by the Company is limited by a covenant in its Mortgage and Deed of Trust dated October 1, 1943, as supplemented and amended (the Mortgage), with The Chase Manhattan Bank, as successor Trustee, requiring the pro forma ratio of consolidated earnings to interest on First Mortgage Bonds
I-15
for any twelve consecutive months within the fifteen months preceding such issuance to be not less than 2.00. • This ratio for the twelve months ended December 31, 1997 was 6.02. The issuance of First Mortgage Bonds also is limited by the Mortgage to 60% of the bondable value of property additions.
Certain provisions in the Company's Restated Certificate and Articles of Incorporation limit the issuance of preferred stock. The most restrictive of these provisions requires that the pro forma ratio of consolidated earnings to fixed charges and preferred stock dividend requirements combined for any twelve consecutive months within the fifteen months preceding such issuance of preferred stock be 1.50 or greater. This ratio was 2.03 for the twelve months ended December 31, 1997.
The Company's ratios of earnings to fixed charges and earnings to fixed charges and preferred stock dividends under the SEC Methods for 1993-1997 are shown below.
Year Ended December 31,
1997 1996 1995 1994 1993
Ratio of Earnings to Fixed Charges (SEC Method)............... 2.83 3.33 3.54 3.49 3.47 Ratio of Earnings to Fixed Charges and Preferred Stock Dividends
Under the SEC Method, earnings, including AFUDC, have been computed by adding income taxes and fixed charges to net income. Fixed charges include gross interest expense, the estimated interest component of rentals, and dividends on preferred securities of a subsidiary trust. For the ratio of earnings to fixed charges and preferred stock dividends, preferred stock dividends represent annualized preferred stock dividend requirements multiplied by the ratio that pre-tax income bears to net income.
Environmental Matters
The Company and its subsidiaries are subject to various federal, regional, state, and local environmental regulations, including air and water quality control, oil pollution control, solid and hazardous waste disposal, and limitation on land use. Permits are required for the Company's construction projects and existing facilities. The Company and its subsidiaries have incurred, and expect to continue to incur, capital expenditures and operating costs because of environmental considerations and requirements. The Company and its subsidiaries are engaged in a continuing program to assure compliance with the environmental standards adopted by various regulatory authorities.
Construction Expenditures
During the years 1998-2002, construction expenditures for compliance with environmental regulations, primarily air quality regulations, are estimated at $116 million for Conectiv, of which $105 million pertains to the Company. These amounts are included in the estimated capital requirements shown in ''Liquidity and Capital Resources'' of the MD&A included in Item 7 of Part II.
Air Quality Regulations
The federal Clean Air Act requires utilities and other industries to significantly reduce emissions of air pollutants such as sulfur dioxide (S02) and oxides of nitrogen (NOx). Title IV of the Clean Air Act, the acid rain provisions, established a two-phase program which mandated reductions of S02 and NOx emissions from certain utility units by 1995 (Phase I) and required other utility units to begin reducing S02 and NOx emissions in the year 2000 (Phase II). Emission reductions at the jointly-owned Conemaugh Power Plant (a Phase 1 unit), have been achieved through installation and operation of flue gas desulfurization (FGD) systems and low-NOx burners. The remainder of the Company's wholly- and jointly-owned fossil-fuel units are expected to meet phase II • emission limits through a combination of fuel switching, and S02 allowance trading.
I-16
~.
~-
In addition to complying with Title IV, as major sources of NOx emissions, Company facilities must comply with Title I of the Clean Air Act, the ozone nonattainment provisions, which require states to promulgate Reasonably Available Technology (RACT) regulations for existing sources located within ozone nonattainment areas or within the Northeast Ozone Transport Region (NOTR). The Company's facilities in Delaware and Maryland are in the NOTR. As part of the Company's original RACT Proposals submitted to Delaware and Maryland in 1993 and 1994, low NOx burner technology on four major generating units have been installed. In December 1996, the Company amended its Delaware NOx control plans to include installation of low NOx burner technology in 1998 and 1999 on two additional units (Indian River Units 1 and 2) to meet both Title I and Title IV NOx control requirements. The Company's RACT proposals have yet to receive final regulatory approval by Delaware ·and Maryland. Consequently, costs in addition to those already expended and budgeted, may be incurred in order to comply with the RACT Regulations.
Additional ''post-RACT'' NOx emission limitation regulations are being pursued by states in the NOTR. On February 1, 1998, Delaware promulgated post-RACT NOx control regulations on certain sources, including the Company's major generating facilities. Attainment of summer seasonal emission reductions of up to 65% below 1990 levels is required by May 1999 through reduced emissions (e.g. through the installation of control technology, operating changes, or fuel switches) or the procurement of NOx emission allowances. Primarily due to the short time period in which compliance is required, the Company has appealed the final Delaware regulations. The Company is preparing a compliance plan which is expected to include the procurement of NOx allowances and/or installation of control technology on certain generating units. The Company has budgeted anticipated capital costs of approximately $14 million for installing such technology. Maryland has yet to adopt a post-RACT regulation, but it is anticipated that the imposition of controls on the Company's Delaware units, and the availability of an allowance trading program, will provide relief to ensure compliance at the Company's Maryland facilities.
In addition to the implementation of RACT and post-RACT controls, additional summer seasonal NOx controls, co:mrilensurate with reductions up to 85% below baseline years, are presently being considered by the NOTR states and the United States Environmental Protection Agency (USEPA), for implementation in the 2003 time frame. As draft regulations have yet to be considered for these proposals, the Company cannot predict the additional potential operating and capital cost impacts that may be associated with these initiatives.
On July 16, 1997, the USEPA promulgated final regulations which would amend the National Ambient Air Quality Standards (NAAQS) for particulate matter and ozone. The proposal calls for changing the concentration limits, averaging times, and form of the health-based and welfare-based ozone standards as well as the establishment of a new fine particulate matter standard (PM2sparticulate matter with a mean particle diameter of 2.5 microns). Following a period of several years to measure and gather air quality monitoring data, the USEPA may need to reclassify certain air quality control regions. Existing sources that cause or contribute to nonattainment regions will likely be subject to additional regulatory requirements, including possible emission reductions. New sources in nonattainment areas will also be subject to additional control requirements and will be required to offset their emissions. Because power plants emit certain air pollutants which could contribute to the formation of ambient ozone and PM2.5, the Company's power plants may be required to be retrofitted with additional air pollution controls in the future. A number of affected parties, including several that represent the Company's interests, are litigating the standards. It is not presently possible to predict the potential impacts associated with implementation of these standards on the Company's facilities.
Water Quality Regulations
The federal Clean Water Act requires that the cooling water intake and discharge systems at the Edge Moor and Indian River Power Plants minimize adverse environmental impact. In addition, in 1993, DNREC promulgated increased restrictions on thermal discharge. Between 1976 and 1979 the Company submitted to DNREC the results of environmental impact studies which demonstrated compliance with the Clean Water Act. DNREC is in the process of requiring the Company to update these studies to determine if the intake and
I-17
discharge systems continue to be in compliance. The studies are expected to take one to two years and begin in • 4 spring 1998 and 1999 for the Indian River and Edgemoor plants, respectively. If it should be determined that the systems are not in compliance with the Clean Water Act and/or the revised Delaware thermal limits, construction expenditures to modify the systems could cost up to approximately $46 million.
Hazardous Substances
The disposal of Company-generated hazardous substances can result in costs to clean up facilities found to be contaminated due to past disposal practices. Federal and state statutes authorize governmental agencies to compel responsible parties to clean up certain abandoned or uncontrolled hazardous waste sites. The Company's exposure is minimized by adherence to environmental standards for Company-owned facilities and through a waste disposal contractor screening and audit process.
As of December 31, 1997, the Company's other accrued liabilities included $2 million for clean-up and other potential costs related to federal and state superfund sites. The Company does not expect future costs to have a material effect on the Company's financial position or results of operations.
Other Environmental Matters
Another environmental issue with potential impact on the electric utility industry is the em1ss1on of "greenhouse gases" such as carbon dioxide, released as a byproduct of the combustion of fossil fuels in the electric generating process. The release of such substances has been associated with the potential for global warming. In December 1997, delegates from more 160 countries adopted a treaty that commits industrialized countries to binding targets for greenhouse gas reductions (Kyoto Protocol). According to the terms of the Kyoto Protocol, the U.S. would reduce emissions by 7% relative to 1990 levels by the 2008 to 2012 time period. The Kyoto Protocol is only binding on individual countries after it is ratified by their governments. The Company cannot predict whether or not the U.S. will ratify the Kyoto Protocol, or if related regulations affecting the utility industry will be written and implemented.
Retail Franchises
The franchises discussed below could be impacted by legislation restructuring the electric utility industry. For information concerning restructuring of the electric utility industry see ''Utility Regulation and Industry Restructuring'' in Part I and the MD&A in Item 7 of Part IL
The Company holds franchises, which for the most part are perpetual, for providing retail electric and gas service in certain designated areas and municipalities in the State of Delaware, pursuant to legislative enactments of the General Assembly and to consents, orders, and permits from various public bodies and municipal authorities.
The Company holds franchises, which for the most part are perpetual, for providing retail electric service in all of its assigned territories in the State of Maryland, pursuant to Maryland law and appropriate orders of the MPSC.
The Company holds perpetual franchises for providing retail electric service in certain designated areas of the Commonwealth of Virginia, pursuant to appropriate orders of the VSCC under the Virginia Public Utility Facilities Act. It also has franchises for the rendition of retail electric service within other municipalities which are not perpetual, but which are expected to be renewed at their expiration dates.
In Pennsylvania, the Company holds limited certificates of public convenience from the Pennsylvania Public Utility Commission to own and exercise rights with respect to its interests in certain electric generating stations and transmission lines located in the state.
I-18
••
~-
Number of Employees
The number of full time employees of the Company at December 31, 1997 was 3,196.
A total of 1,373 employees are represented by the International Brotherhood of Electrical Workers Locals 1238 (Northern) and 1307 (Southern) whose contracts with the Company expire on February 1, 2000 and June 25, 1998, respectively.
Executive Officers of the Registrant
The names, ages, and positions of all of the executive officers of the Company as of December 31, 1997, are listed below, along with their business experiences during the past five years. Officers are elected annually by the Board of Directors at the meeting of directors immediately following the Annual Meeting of Stockholders. There are no family relationships among these officers, nor any arrangement or understanding between any officer and any other person pursuant to which the officer was selected.
Executive Officers of the Registrant (As of December 31, 1997)
Business Experience Name, Age and Position During Past 5 Years
Howard E. Cosgrove, 54, Elected 1992. . . . . . . . . Elected 1992 Chairman of the Board, President, and Chief Executive Officer and Director
Barry R. Elson, 56 ......................... . Executive Vice President
Elected 1997. Executive Vice President, Cox Communications, Inc., Atlanta, Georgia, from 1995 to 1996. Senior Vice President, Cox Enterprises/Cox Communications, Inc., Atlanta Georgia, from 1984 to 1995.
Thomas S. Shaw, 50......................... Elected 1997. Senior Vice President from 1992 to 1997. Executive Vice President
Joseph W. Ford, 52 ......................... . Senior Vice President
Barbara S. Graham, 49 ...................... . Senior Vice President and Chief Financial Officer
Ralph E. Klesius, 55 ........................ . Senior Vice President
James P. Lavin, 50 ......................... . Comptroller and Chief Accounting Officer
Elected 1995. Director Corporate Re-Engineering, Sales & Marketing Worldwide, Digital Corporation.
Boston Massachusetts, from 1993 to 1994. Director Business Development United States, Digital Corporation, Boston, Massachusetts from 1992 to 1993.
Elected 1996. Senior Vice President, Treasurer and Chief Financial Officer from 1994 to 1997. Vice President and Chief Financial Officer from 1992 to 1994.
Elected 1992.
Elected 1993. Comptroller-Corporate and Chief Accounting Officer from 1989 to 1993.
1-19
Item 2. Properties
Substantially all utility plants and properties of the Company are subject to the lien of the Mortgage under which the Company's First Mortgage Bonds are issued.
The Company's electric properties are located in Delaware, Maryland, Virginia, Pennsylvania, and New Jersey. The following table sets forth the net installed summer electric generating capacity available to the Company to serve its peak load as of December 31, 1997.
Station Location
Coal-Fired Edge Moor ........................... . Wilmington, DE .............. . Indian River .......................... . Millsboro, DE ................ . Conemaugh ........................... . New Florence, PA ............ . Keystone ............................. . Shelocta, PA ................. .
Combustion Turbines/Combined Cycle Hay Road ............................ . Wilmington, DE .............. .
Nuclear Peach Bottom ......................... . Salem ............................... .
Peach Bottom Twp., PA ....... . Lower Alloways Creek Twp., NJ.
Peaking Units Christiana ............................ . Edge Moor ........................... . Madison Street ........................ .
Wilmington, DE .............. . Wilmington, DE .............. . Wilmington, DE .............. .
West ................................ . Marshallton, DE .............. . Delaware City ........................ . Indian River .......................... .
Delaware City, DE ............ . Millsboro, DE ................ .
Vienna ............................... . Vienna, MD ................. . Tasley ............................... . Tasley, VA .................. . Salem ............................... . Crisfield .............................. .
Lower Alloways Creek Twp., NJ. Crisfield, MD ................ .
Bayview ............................. . Bayview, VA ................ . Keystone ............................. . Shelocta, PA ................. . Conemaugh ........................... . New Florence, PA ............ .
Customer-Owned Capacity . . . . . . . . . . . . . Delaware City, DE ............ . Capacity Purchased From PECO ........................................ .
(B) Represents capacity owned by a refinery customer which is available to the Company to serve its peak load.
I-20
~.
The Company's electric transmission and distribution system includes 1,391 transmission poleline miles of overhead lines, 5 transmission cable miles of underground cables, 6,931 distribution poleline miles of overhead lines, and 5,540 distribution cable miles of underground cables.
The Company has a liquefied natural gas plant located in Wilmington, Delaware with a storage capacity of 3.045 million gallons and an emergency sendout capability of 45,000 Mcf per day.
The Company also owns four natural gas city gate stations at various locations in its gas service territory. These stations have a total sendout capacity of 125,000 Mcf per day.
The following table sets forth the Company's gas pipeline miles:
Transmission Mains ......................................... . Distribution Mains .......................................... . Service Lines ...... · ......... : ............................... .
114* 1,492 1,104
* Includes 11 miles of joint-use gas pipeline that is used 10% for gas and 90% for electric.
As of December 31, 1997, CCI, the Company's telecommunications subsidiary, owned the assets listed and described below.
($ in millions)
Central office equipment ..................................... . Cable, wiring and conduit .................................... . Other equipment ............................................ . Leasehold improvements and other ............................ .
$11.7 25.0
5.8 4.0
$46.5
''Central office equipment'' consists of switching equipment, transmission equipment and related facilities. ''Cable, wiring and conduit'' consists primarily of aerial cable, underground cable, conduit and wiring. ''Other equipment'' consists of circuit equipment and radio systems.
The Company owns and occupies office buildings in Wilmington and Christiana, Delaware and Salisbury, Maryland, and also owns elsewhere in its service area a number of properties that are used for office, service, and other purposes.
Item 3. Legal Proceedings
On February 6, 1997, a major customer of the Company filed a lawsuit in the Delaware Superior Court alleging negligence and breach of contract against the Company 1n relation to the electric system outages that occurred on March 28, 1996, and May 14, 1996. The complaint asked for actual damages in excess of $41 million and for special and punitive damages in unspecified amounts. This lawsuit was settled before trial. The result of the settlement was not material to the Company's financial position or results of operations.
See Note 18 to the Company's 1997 Consolidated Financial Statements included in Part II, Item 8 for information concerning the Company's lawsuit against Westinghouse Electric Corporation, the designer and manufacturer of the Salem steam generators.
In March 1996, the Company and PECO filed a complaint in the United States District Court for the Eastern District of Pennsylvania against Public Service Enterprise Group, Inc. (Enterpnse) and PSE&G seeking damages for breach of contract and negligence concerning Salem operations. The suit asked for compensatory damages for breach of contract and negligence and unspecified punitive damages. On May 12, 1997, it was announced that PSE&G settled the suit with the Company and PECO. Under the settlement, PSE&G paid the Company approximately $12 million on December 31, 1997, in settlement of all claims related to the lawsuit.
I-21
The parties to the settlement also agreed to operating performance standards through December 31, 2011 for Salem, and similar standards through December 31, 2007 for the Peach Bottom Atomic Power Station operated by PECO. Under these standards, the Company is entitled to receive payments from the nuclear plant operator as follows: (a) if the three-year capacity factor determined annually falls below 40 percent but is equal to or above 20 percent, the operator will pay the Company $1.5 million for each year that the historical capacity factor is below 40 percent; and (b) if the historical capacity factor is below 20 percent, the operator will pay the Company $3.7 to $3.8 million for each such year. The initial three-year period will begin on the date Unit 1 returns to service, which is expected to be in the second quarter of 1998.
The parties have further agreed to forego litigation in the future, except for very limited cases in which the operator would be responsible for no more than $5 million per year.
Item 4. Submission of Matters to a Vote of Security Holders
No matter was submitted during the fourth quarter of the fiscal year covered by this report to a vote of security holders, through the solicitation of proxies or otherwise.
I-22
PART II
Item 5. Market for Registrant's Common Equity and Related Stockholder Matters
The Company's common stock was listed on the New York and Philadelphia Stock Exchanges and had unlisted trading privileges on the Cincinnati, Midwest, and Pacific Stock Exchanges and had the following dividends declared and high/low prices by quarter for the years 1997 and 1996.
1997 1996
Dividend Price Dividend Price
Declared High Low Declared High Low
First Quarter .............................. $.38~ $20% $18% $.38~ $23% $21
Second Quarter ............................ .38~ 19% 16"Vs .38~ 21~ 19Ys
Third Quarter ............................. .38~ 19 17¥16 .38~ 21Y4 20
The Company had 47,187 registered holders of common stock as of December 31, 1997.
For information concerning common dividends, see the MD&A in Item 7 of Part II.
II-1
ITEM. 6 Selected Financial Data
Year Ended December 31,
1997 1996 1995 1994 1993
(Dollars in Thousands, Except Per Share Amounts) Operating Results and Data
Operating Revenues (1) ............................... $ 1,423,502 $ 1,175,575 $ 1,055,725 $ 1,033,442 $1,007,851 Operating Income (1) ................................. $ 234,429 $ 257,300 $ 254,425 $ 233,244(2)$ 233,091 Net Income ......................................... $ 105,709 $ 116,187 $ 117,488 $ 108,310(2)$ 111,076 Basic and Diluted Earnings Applicable to Common Stock .. $ 101,218 $ 107,251 $ 107,546 $ 98,940(2)$ 101,074 On System Electric Sales (kWh 000) (3) ................. 13,231,766 12,925,716 12,310,921 12,505,082 12,280,230 On System Gas Sold and Transported (mcf 000) .......... 22,855 22,424 21,371 20,342 19,605
Common Stock Information Basic and Diluted Earnings Per Share of Common Stock ... $ 1.66 $ 1.77 $ 1.79 $ 1.67(2)$ 1.76 Dividends Declared Per Share of Common Stock ......... $ 1.54 $ 1.54 $ 1.54 $ 1.54 $ 1.54 Average Shares Outstanding (000) ...................... 61,122 60,698 60,217 59,377 57,557 Year-End Common Stock Price ........................ 23Y16 20% 22¥1 18%4 235h Book Value Per Common Share ........................ $ 15.59 $ 15.41 $ 15.20 $ 14.85 $ 14.66 Return on Average Common Equity .................... 10.6% 11.4% 11.7% 11.1 % 12.0%
Total Capitalization with VRDB ........................ $ 2,169,371 $ 2,083,649 $ 2,031,929 $ 1,898,312 $1,808,148
Other Information Total Assets ......................................... $ 3,015,481 $ 2,931,855 $ 2,868,685 $ 2,669,785 $2,592,479 Long-Term Capital Lease Obligation .................... $ 19,877 $ 20,552 $ 20,766 $ 19,660 $ 23,335 Capital Expenditures ································· $ 173,008 $ 169,012 $ 142,833 $ 166,938 $ 166,222
(1) Beginning in 1997 operating revenues and operating income include the results of non regulated with prior years reclassified for comparative purposes.
(2) An early retirement offer decreased earnings net of income taxes and earnings per share by $10.7 million and $0.18, respectively.
(3) Excludes interchange deliveries. (4) Although Variable Rate Demand Bonds are classified as current liabilities, the Company intends to use the
bonds as a source of long-term financing as discussed in Note 13 to the Consolidated Financial Statements.
II-2
• ~
Item 7. Management's Discussion and Analysis of Financial Condition and Results of Operations
Merger With Atlantic
Effective March 1, 1998, Delmarva Power & Light Company (the Company) and Atlantic Energy, Inc. (Atlantic) consummated merger transactions (the Merger) which formed a new company named Conectiv and merged Atlantic out of existence. Additional information about the Merger is included in Note 4 to the Consolidated Financial Statements and in the registration statement on Form S-4 dated December 26, 1996.
Prior to the Merger, Atlantic owned Atlantic City Electric Company (ACE), an electric utility, and subsidiaries engaged in nonutility businesses. As a result of the Merger, Conectiv owns ACE, nonutility subsidiaries formerly held by Atlantic, the Company, and the Company's subsidiaries. ACE serves approximately 481,000 customers in a 2,700 square mile area in southern New Jersey. Atlantic's 1997 operating revenues and net income were $1,102.4 million and $74.4 million, respectively, and its total assets were $2,723.9 million as of December 31, 1997.
The benefits expected from the Merger include increased scale, cost savings, competitive prices and services, a more balanced customer base, and increased financial flexibility. The companies expect cost savings from Merger synergies of approximately $500 million over 10 years.
Approximately 50% to 75% of estimated cost savings from the Merger with Atlantic will serve to reduce customers' rates and the balance of the cost savings realized will benefit Conectiv stockholders. Pursuant to settlement agreements approving the Merger, the Company will decrease retail customer non-fuel (base) rates by an aggregate total of $13 million in Delaware, Maryland, and Virginia. In New Jersey, ACE will share approximately 75% of the Merger savings with its customers through a $15.75 million electric rate reduction.
Concurrent with the Merger, the Company and Atlantic plan to achieve workforce reductions through enhanced retirement offers (ERO) and other employee separation programs. The cost of the Company's employee separation programs. and other Merger related costs are currently estimated to be $55 million to $60 million before income taxes ($33 million to $36 million after income taxes).
Each outstanding share of the Company's common stock, par value $2.25 per share, is being exchanged for one share of Conectiv's common stock, par value $0.01 per share. Each share of Atlantic's common stock, no par value per share, is being exchanged for 0.75 of one share of Conectiv's common stock and 0.125 of one share of Conectiv's Class A common stock, par value $0.01 per share. Class A common stock gives holders of Atlantic common stock a proportionately greater opportunity to share in the growth prospects of, and a proportionately greater exposure to the uncertainties associated with the electric utility business of ACE. Earnings applicable to Class A common stock will be equal to 30% of the net of (1) earnings attributable to ACE's regulated electric utility business, as the business existed on August 9, 1996, less (2) $40 million per year. Earnings applicable to Conectiv common stock will be the consolidated earnings of Conectiv less earnings applicable to Class A common stock.
Earnings Results Summary
The Company's earnings per share for 1997 were $1.66 compared to $1.77 for 1996. Earnings from the Company's traditional, regulated utility operations were relatively flat, and the $0.11 per share earnings decrease was primarily attributed to expenses of non-regulated activities, as discussed below. For the utility business, the positive effects of higher net electric revenues and lower outage expenses for the Salem nuclear generating units were offset by anticipated higher capital costs. Net electric revenues grew despite milder weather due to customer growth and a strong economy.
The earnings decrease from non-regulated activities resulted from planned cost increases associated with investments in new businesses, branding, and other expenditures which are positioning the Company to compete in deregulated energy markets. Part of the Company's strategy for competition (in deregulated markets) involves
II-3
the divestiture of non-strategic assets. A $0.22 per share gain from the Company's sale of Pine Grove, Inc., which owned a landfill and related waste-hauling company, mitigated the earnings decrease. This sale freed up capital invested in a non-strategic asset and enabled the Company to absorb additional investments to grow new businesses.
Earnings per share for 1996 were $1.77, a $0.02 decrease from 1995. Excluding the adverse impact of the Salem outages, earnings rose $0.08 per share in 1996, primarily due to additional revenues from customer growth, partly offset by higher depreciation and other expenses, including marketing expenses for new valueadded (energy-related) services.
Dividends
On December 11, 1997, the Board of Directors declared a dividend on common stock of $0.381h per share for the fourth quarter or $1.54 on an annualized basis. The Company's growth strategy will require increased reinvestment of earnings into new businesses. The business growth from these investments and the payment of dividends on common stock are expected to maximize stockholder value on a long-term basis. Following the Merger, dividends on Conectiv common stock are expected to be paid at the rate of $1.54 per year, subject to periodic evaluation of Conectiv's results of operations, financial condition, capital requirements and other relevant considerations. Dividends on Class A common stock are expected to be paid at the rate of $3.20 per share for three years following the Merger subject to periodic evaluation of Conectiv's results of operations, financial condition, capital requirements and other relevant considerations. After the three-year period, dividends on Class A common stock are expected to be equal to approximately 90% of earnings available for Class A common stock. However, if dividends on Class A common stock exceed earnings available for Class A common stock during the three year period, that may influence the Board's determination of the amount of Class A common stock dividends to be paid after the three-year period.
Electric Utility Industry Restructuring
Prices charged to electric utility customers have historically been a ''bundled'' price which includes the electricity production (supply) cost and the delivery cost (transmission and distribution). State regulatory commissions and legislatures throughout the country are considering or have approved changes to laws and regulations governing the sale and pricing of electricity. Generally, the supply component of the price charged to a customer for electricity would be deregulated, and electric suppliers would compete to supply electricity to customers. Competition is expected to reduce gross margins earned from the supply of electricity. Customers would continue to pay the local utility a regulated price for the delivery of the electricity over the transmission and distribution system. Discussed below are proposals concerning deregulation of the electric utility industry in Delaware, Maryland, and Virginia (which have jurisdiction over the Company's retail electric utility business), New Jersey (which regulates ACE's retail electric utility business), and Pennsylvania. ·
Delaware
In response to a request from the Delaware House of Representatives, on January 27, 1998, the Delaware Public Service Commission (DPSC) submitted its report on electric utility industry restructuring to the Delaware General Assembly. The report included the following recommendations:
• All customers in Delaware would be able to choose their electricity supplier beginning twelve months after the restructuring legislation is signed into law.
• The incumbent utility would serve as the default electricity supplier during a DPSC-deterrnined transition period. During this period, the retail generation rates for default customers would be marketbased, but would continue to be regulated.
• Each utility would have an opportunity to recover all DPSC-approved non-mitigated stranded costs (or costs which would not be recovered under competitive pricing). Stranded cost recovery would occur through a separate, non-bypassable charge, which would be applied to all transmission and distribution
II-4
I
~
customers. A "true-up" process would be established to adjust for fluctuations in stranded cost recovery due to sales volumes.
• Utilities would file their estimates of potential, non-mitigated stranded costs with the DPSC approximately three months after the restructuring was enacted. The estimates would be reviewed in a proceeding before the DPSC to determine the level of stranded cost recovery.
• A legal divestiture of generation assets would not be required; however, the generation business would have to be functionally separated from the remaining regulated utility business.
• The distribution and transmission services provided to retail customers by utilities, as well as some customer service functions, would continue to be regulated by the DPSC. Distribution services would continue to be priced based on cost-of-service. The DPSC also recommends that it oversee pricing of retail transmission services for some period; however, the Federal Regulatory Energy Commission (FERC) has indicated that it has jurisdiction over pricing of such transmission services.
• The DPSC recognized that alternative plans should be considered without necessitating changes to the restructuring legislation. Accordingly, the DPSC recommended that it be authorized to consider such alternatives and implement them, if they achieve the same customer choice goals and are in the public interest.
On March 13, 1998, the DPSC sent draft legislation to the Delaware legislature which would provide all Delaware electric retail customers the ability to choose their electric supplier beginning on August 1, 1999. The draft legislation also includes a provision that would allow the DPSC to delay the start date of electric retail competition by up to 12 months. Restructuring legislation may be considered by the Delaware legislature during this session, which ends on June 30, 1998.
Maryland
On December 3, 1997, the Maryland Public Service Commission (MPSC) issued an order concluding that retail electric competition is in the public interest and should be phased-in over a three-year period, one-third of the customers per year, beginning April 1, 1999. The order established a schedule for filing of additional information, roundtables, and proceedings. Enabling legislation and resolution of complex issues such as stranded costs and utility taxation will be necessary for implementation of retail electric competition in Maryland.
On December 31, 1997, the MPSC ordered a delay in the start of the three-year phase in period from April 1, 1999 to July 1, 2000 and also suspended all mandated filing dates. The MPSC subsequently adopted a revised schedule for this proceeding. The Company and other Maryland utilities supported the adoption of this schedule.
Certain key provisions of the MPSC's order are as follows:
• A price cap would be in effect during the three-year phase-in period.
• Utilities would be given the opportunity to recover their verifiable and prudently incurred stranded costs subject to full mitigation. Securitization of stranded costs would be permitted. Utilities are to file with the MPSC their estimates of stranded costs and proposed recovery mechanisms.
• Cost-of-service regulation of electric generation would be discontinued at the end of the three-year period, while distribution service would remain subject to cost-of-service regulation.
• The local utility will supply customers who do not select alternate suppliers during the three-year period.
• Reciprocity from out-of-state suppliers will not be required.
Restructuring legislation is being considered by the Maryland legislature.
II-5
Virginia
On November 7, 1997, the Virginia State Corporation Commission (VSCC) Staff report recommended that electric competition should be studied and tested over a five-year period before determining if retail competition should be implemented.
Restructuring legislation is being considered by the Virginia legislature.
New Jersey
In New Jersey, the Board of Public Utilities (BPU) has recommended that retail choice begin with 10% of customers on October 1, 1998 and be available to 100% of the customers by July 1, 2000. New Jersey electric utilities, as directed by the BPU, have filed complete restructuring plans, stranded cost estimates and unbundled rates. Proceedings are currently underway to address restructuring issues.
Pennsylvania
In December 1996, the Pennsylvania legislature enacted the Pennsylvania Electricity Generation Customer Choice and Competition Act (Competition Act) which provides for the restructuring of the electric industry in Pennsylvania, including retail competition beginning in 1999. The Competition Act requires that all customers be allowed to choose their suppliers by January 1, 2001. In accordance with the Competition Act, pilot programs, open to 5% of each customer class, began on November 1, 1997. The Company is currently selling electricity under the Conectiv Energy brand name in the pilot programs and has acquired approximately 32,200 new customers. The Company plans to continue to evaluate market opportunities in Pennsylvania.
In December 1997, the Pennsylvania Public Utility Commission approved a restructuring plan for PECO Energy Company (PECO) under which two-thirds of PECO's customers can choose their energy supplier on January 2, 1999, and the remaining PECO customers can choose as of January 1, 2000. Starting in 1999, PECO's residential customers who purchase electricity from another supplier will receive a credit of 5.2 cents per kilowatt hour. This credit will allow electricity suppliers, such as the Company, a better opportunity than under previous terms to earn a profit from electricity sales to PECO's existing customers.
Stranded Costs
The transition to a competitive market could result in "stranded costs" for a utility. Stranded costs are generally costs which may not be recoverable in a competitive market due to market-based pricing or customers choosing different energy suppliers. Potential stranded costs could include (i) above-market costs associated with generation facilities or long-term power purchase agreements and (ii) regulatory assets (see Note 9 to the Consolidated Financial Statements) if cost recovery does not continue under a transition plan.
Authoritative accounting guidance issued in 1997 prescribes that a utility should cease to apply Statement of Financial Accounting Standards (SF AS) No. 71, ''Accounting for the Effects of Certain Types of Regulation,'' for any separable portion of the business, such as the electricity production (supply) portion of its business, no later than the date that a specific deregulation plan is finalized. Stranded costs and regulatory assets attributed to electricity supply would continue to be recognized to the extent that a transition plan provides for their recovery through cash flows from the regulated transmission and distribution business.
As previously discussed, proposals concerning deregulation of the electric utility industry are being considered in Delaware, Maryland, and Virginia, but no deregulation plan has yet been finalized. Due to the uncertainty surrounding the outcome of the restructuring plans, the Company cannot currently predict if or when it would cease applying SFAS No. 71. To the extent stranded cost recovery is not provided for, the Company would be required to write down asset values, and such write-downs could be material.
11-6
Business Plans
As deregulation of the electric utility industry continues to unfold, the Company is moving ahead with its plan to become a prominent regional player by being first into new markets that complement its utility business and by enhancing its ability to serve additional customers outside of its traditional borders. The Company is growing its businesses by building long-term customer relationships, establishing the Conectiv brand name, marketing products and services that complement the Company's core energy business, and serving more customers in a larger geographic area. To accomplish these goals, the Company has increased investments in marketing/branding programs, new businesses, and infrastructure systems.
On June 30, 1997, the Company launched a campaign to introduce the new Conectiv brand and Conectiv's products and services. The campaign explained that Conectiv is offering energy, telecommunications, heating and cooling, and related services for homes and businesses. Customer response to the new Conectiv brand name has been positive, as evidenced by name recognition and the Company's success in gaining new customers in retail energy pilot programs. The Company is marketing an array of products and services-energy, local and long-distance telephone service, heating, ventilation, and cooling (HV AC) services, and other services-under the Conectiv name. The Company plans to continue its advertising campaigns and other support of the Conectiv brand name.
Over the next year or two, the Company's earnings are expected to be constrained by on-going start-up costs for new businesses, including telecommunications and HV AC. After this start-up period, these investments are expected to contribute to long-term consolidated earnings growth which exceeds the utility industry average.
Conectiv's business plans will be carried out by its three business groups: Conectiv Energy Delivery; Conectiv Energy Supply; and Conectiv Enterprises. The business groups are aligned with customers' needs, markets, and the future structure of the utility industry. The business groups are discussed below. For financial information concerning the Company's business segments and the expected impact of SFAS No. 131, "Disclosure About Segments of an Enterprise and Related Information", see Note 21 to the Consolidated Financial Statements.
Conectiv Energy Delivery
Conectiv Energy Delivery will deliver electricity and gas to retail and wholesale customers within its service territory. These delivery services are structured into various forms of price-regulated offers, some including energy supply, so that customers may choose the combination that provides the best value. Customer satisfaction and loyalty is expected to remain high due to the Company's reliable delivery systems, superior customer service, and competitive cost and pricing structures.
Conectiv Energy Supply
Conectiv Energy Supply will manage the generating assets, bulk energy marketing and trading activities, and the transition of those assets and activities from a regulated to a competitive environment. Its principal products are electric power and natural gas, supplemented by other fuels and related energy management services. Its customers are bulk energy users and retail aggregators in the region stretching from the Delmarva peninsula north through New England and west to Ohio.
Conectiv Enterprises
Conectiv Enterprises is comprised of the following five start-up businesses: Conectiv Communications, Inc. (CCI)-provides local and long distance telephone services; Conectiv Energy-primarily sells energy in competitive retail markets; Conectiv Services, Inc. (CSI)-provides a full range of HV AC services; Conectiv Solutions LLC-provides customized solutions to customers' energy needs, and Conectiv Thermal Systems, Inc. (currently Atlantic Thermal Systems, Inc.)-provides custom thermal heating and cooling systems. These businesses provide an opportunity to grow Conectiv's customer base throughout the Mid-Atlantic region and
II-7
strengthen its relationship with customers in its traditional service territory. Conectiv Enterprises expects to incur operating losses for the first year or two after the Merger due to start-up costs.
Conectiv Communications, Inc.
CCI is a full range facilities based telecommunications company initially operating in the region that includes Delaware, Southeastern Pennsylvania, Southern New Jersey, and Eastern Maryland. CCI's product and service offerings include all local and long distance services as well as carrier, network, and data services. CCI is marketing its products and services to business, residential, and carrier customers. CCI will focus on providing a facilities-based solution to its customers, and will also resell Bell Atlantic service. This strategy requires capital expenditures for further expansion of CCI' s existing fiber optic network over the next several years. CCI currently operates in a duopoly local service environment with Bell Atlantic. Competition may increase from other telecommunications companies seeking to establish a local service presence in the region.
Conectiv Energy
Conectiv Energy currently sells competitive natural gas, electricity, and energy related products and services to residential and commercial customers in the Mid-Atlantic region. Retail customers' favorable response to the Conectiv brand has been a key to acquiring new retail customers in competitive markets. In 1997, Conectiv Energy obtained approximately 7,700 gas customers and 32,200 electric customers. The costs associated with acquiring new customers, timing of market entry, gross margins on sales, and regulations governing the transition to competition are factors critical to this business.
Conectiv Services, Inc.
CSI is a full-service HVAC business operating in the Mid-Atlantic region. CSI provides commercial customers with mechanical HV AC/piping construction and installation, design services, sheet metal fabrication, preventative maintenance and repair services. Residential offerings include HV AC installation, maintenance, repair and related plumbing services. The regional HV AC and plumbing industry is highly competitive, fragmented, and rapidly consolidating. The sales and earnings of HV AC businesses are affected by weather conditions. CSI originated through acquisitions of established businesses, and its future growth will be impacted by the availability of acquisition candidates and any regulatory limits imposed on market access.
Conectiv Solutions LLC
Conectiv Solutions LLC (Conectiv Solutions) is building close customer relationships by understanding individual customers' energy-related needs, and meeting those needs with customized, turnkey solutions. Conectiv Solutions provides large commercial and industrial customers, primarily within the Delaware Valley region, with energy and energy-related products and services. These products and services are built around occupant comfort, reliability of systems, and cost containment and reduction. Conectiv Solutions provides energy efficiency services, power systems consulting, custom on-site energy systems' services and construction, telecommunication services, and energy procurement. In addition, Conectiv Solutions offers the HV AC and telecommunications services provided by CSI and CCL
Conectiv Thermal Systems, Inc.
Atlantic Thermal Systems, Inc. (ATS), owned by Atlantic prior to the Merger, will become Conectiv Thermal Systems, Inc. (CTS) shortly after the Merger. CTS will provide products and services offered by ATS prior to the Merger, including heating, cooling and related energy services to large commercial and industrial customers. In conjunction with these services, ATS develops, finances, constructs, owns and operates thermal energy production and distribution plants. Targeted customer groups include gaming/hotel resort complexes, • colleges and universities, health care facilities and industrial complexes. ATS offers a highly customized service .
II-8
• tailored to meet each customer's specific energy needs. Through ATS' energy outsourcing programs, customers are able to. reduce their capital expenditures on non-strategic assets, realize energy cost savings, and free themselves from energy matters, which are incidental to their principal business activities.
Price Regulation of Energy Revenues
Through 1997, customer rates for non-fuel costs represented a "bundled" price, including production costs and delivery costs, and have been set in past base rate proceedings before utility regulatory commissions. Changes in non-fuel (or base rate) revenues due to volume, or rate changes, generally affect the earnings of the Company.
Energy costs, including fuel and purchased energy, are currently billed to customers located within the Company's service territory under regulated fuel adjustment clause rates. These rates are adjusted periodically for cost changes and are subject to review by utility regulatory commissions. "Fuel revenues", or energy costs billed to customers, do not generally affect net income, because the amount of under- or over-recovered fuel costs is generally deferred until it is subsequently recovered from or returned to utility customers.
As the utility industry is restructured, fuel adjustment clauses are expected to be eliminated, and any differences between energy costs and related revenues will impact future earnings. The Company is currently managing the price risk associated with its unregulated, off-system energy sales through commodity hedging activities as discussed in Note 6 to the Consolidated Financial Statements. When energy sales are deregulated in the Company's service territory, price risk is expected to be managed similarly for these sales.
Electric revenues also include interchange delivery revenues, which result primarily from the sale of electricity to other electricity suppliers in the Pennsylvania-New Jersey-Maryland (PJM) Interconnection, which is an electric power pool. Interchange delivery revenues are currently reflected in the calculation of rates charged to customers under fuel adjustment clauses and, thus, do not affect net income. The future deregulation of the generation function will cause the margins from interchange delivery revenues to impact earnings.
Merchant revenues result from off-system energy sales in competitive markets outside the Company's traditional service territory. These sales are not subject to price regulation and include retail competition pilot programs and bulk commodity sales.
Electric Revenues And Sales
The Company's sources of electric revenues as a percentage of total electric revenues are shown below.
Electric retail revenues provide the highest gross margin (revenues less fuel and purchased energy costs) of the revenue categories shown above and are currently subject to price regulation. The electric resale and electric merchant businesses' gross margins, as a percent of revenue, are lower due to product differences, greater volume per customer, and competitive/unregulated pricing. However, the Company's new electric merchant business contributed an incremental amount of gross margin in 1997, which enhanced the Company's overall profitability.
In 1997, the percentage of electric retail revenues contributed by the various retail customer classes were as follows: residential-42.6%; commercial-33.9%; industrial-19.6%; and other-3.9%.
II-9
Details of the changes in the various components of electric revenues are shown below.
Comparative Increase (Decrease) from Prior Year in Electric Revenues
For 1997 compared to 1996, electric non-fuel revenues increased $8.9 million mainly due to a 2.6% increase in total retail kilowatt-hour (kWh) sales. The sales increase was due to a 1.4% increase in the number of regulated retail customers and favorable economic conditions, partly offset by milder weather's unfavorable effect on sales. For 1996 compared to 1995, electric non-fuel revenues increased $27.2 million due to a 4.5% increase in total retail kWh sales which was attributed primarily to a full year of Conowingo District sales in 1996 versus a half year in 1995. As discussed in Note 4 to the Consolidated Financial Statements, the Company acquired Conowingo Power Company (COPCO) in June 1995.
In 1997 and 1996, electric fuel revenues increased $32.7 million and $26.8 million, respectively, due to higher average fuel rates and increased kWh sales.
In 1997, more output was sold off-system through the Company's merchant program (discussed below), ~
reducing kWh deliveries to and revenues from the PJM Interconnection. In 1996, interchange delivery revenues • ~ increased $28.0 million principally due to increased energy purchases which enabled the Company to sell more • of its higher-cost peaking unit" output to utilities in the PJM Interconnection.
Electric merchant revenues, which are not subject to price regulation, increased $102.4 million due to the start-up of the Company's new merchant group which sells power in competitive markets outside the Company's traditional service territory.
Electric Resale Business
With electric resale customers free to choose their electric supplier, the electric resale business continues to be highly competitive. If a supplier other than the local utility is selected, then the local utility receives a fee for delivering the electricity to the resale customer. The status of the Company's contract with its largest electric resale customer, Old Dominion Electric Cooperative (ODEC), is discussed below. Other electric resale customers of the Company have electricity supply contracts with the Company which expire in 2001 to 2004.
Under notice provisions in its electricity supply contract, ODEC informed the Company in August 1996 that it will reduce its load of approximately 200 megawatts (MW) by 60 MW on September 1, 1998, and will further reduce its load to zero on September 1, 2001. The Company and ODEC have signed a new contract under which the Company will supply part of the 60 MW. Due to lower pricing and capacity supplied under this new contract beginning September 1, 1998, annualized earnings per share will decrease by $0.04 to $0.05 based on historical common shares outstanding, which equates to about $0.03 based on pro forma Conectiv common shares outstanding. If ODEC further reduces its load to zero on September 1, 2001, then annualized earnings per share would decrease by an additional $0.04 to $0.05 based on historical common shares outstanding, or about $0.03 to $0.04 based on pro forma Conectiv common shares outstanding. These projected earnings decreases are net of the expected savings from avoided capacity costs, which are expected to rise in price substantially during 1998-2000.
11-10
~.
Gas Revenues, Sales And Transportation
The Company earns gas revenues from gas sales on-system and off-system (merchant sales) and from the transportation of gas for customers~ Transportation customers may purchase gas from the Company or other suppliers.
Details of the changes in the various components of gas revenues are shown below.
Comparative Increase (Decrease) from Prior Year in Gas Revenues 1997 1996
The total number of on-system gas customers served by the Company increased by 2.3% in 1997 and 2.5% in 1996.
Gas non-fuel revenues decreased $1.2 million in 1997 principally due to a 9.8% decline in residential gas sales from milder winter weather, partly offset by sales to new customers. In 1996, gas non-fuel revenues increased $3.7 million mainly due to customer growth and a colder heating season.
Gas fuel revenues increased $8.8 .million in 1997 primarily due to higher fuel rates. In 1996, gas fuel revenues increased $10.5 million due to a prior year refund of over-recovered fuel costs, higher sales, and higher average rates.
The Company launched its gas merchant business in 1996 and ramped-up operations in 1997. Gas merchant revenues increased $82.2 million in 1997 primarily due to higher off-system gas sales. Similar to electric merchant revenues, the margin provided by gas merchant revenues in excess of related purchased gas costs is relatively small due to the competitive nature of bulk commodity sales.
Other Services Revenues
Other service revenues were comprised of the following:
1997 1996 1995
(Dollars in millions)
HVAC .................................................... . $ 62.8 $ 7.1 $-Operation of power plants (1) ................................. . 23.5 21.5 26.6 Landfill and waste hauling ................................... . 12.7 14.1 13.5 Other (2) .................................................. . 28.3 31.7 15.3
Total .................................................. . $127.3 $74.4 $55.4
(1) Primarily the Company's operation of the Delaware City power plant which supplies power to Star Enterprises' oil refinery.
(2) Other includes real estate activities, value-added (energy-related) services, leveraged leasing, telecommunications and other miscellaneous services.
HVAC revenues increased $55.7 million and $7.1 million in 1997 and 1996, respectively, due to acquisitions by CSI of companies which provide HV AC and plumbing services. (For information concerning CSI, see "Business Plans.") Revenues classified above as "Landfill and waste hauling" were earned by Pine
II-11
Grove, Inc. which was sold in the fourth quarter of 1997, as discussed in Note 5, to the Consolidated Financial • Statements. In 1996, "Other" revenues increased $16.4 million due to increased revenues from real estate activities and value-added (energy-related) services.
Electric Fuel and Purchased Energy Expenses
In 1997, electric fuel and purchased energy expenses increased $89.2 million compared to 1996 primarily due to greater volumes of energy sold and lower amounts of energy expenses deferred under fuel adjustment clauses.
In 1996, electric fuel and purchased energy expenses increased $59.6 million mainly due to higher kWh sales and interchange deliveries, and higher fuel and purchased energy prices. Lower energy expense recognition due to higher amounts deferred under fuel adjustment clauses mitigated the increase.
For information concerning the Salem outage's impact on electric fuel and purchased energy expenses, see Note 18 to the Consolidated Financial Statements.
The kWh output required to serve load within the Company's service territory is substantially equivalent to total output less interchange deliveries and off-system sales. In 1997, the Company's output for load within its service territory was provided by 35% coal generation, 35% net purchased power, 20% oil and gas generation, and 10% nuclear generation.
Gas Purchased
In 1997, gas purchased increased $91.8 million due primarily to larger volumes of gas purchased for resale off-system. In 1996, gas purchased increased $12.6 million principally due to higher prices for purchased gas and less purchased gas costs deferred under the fuel adjustment clause.
Other Services' Cost Of Sales
Other services' cost of sales increased to $85.2 million in 1997 from $55.3 million in 1996 due to acquisitions of HV AC service companies, partly offset by decreased volume in real estate activities and landfill/ waste hauling operations. In 1996, other services' cost of sales increased by $16.3 million primarily due to acquisitions of HVAC service companies and higher volume of real estate activities and value-added (energyrelated) services.
Operation And Maintenance Expenses
Operation and maintenance expenses increased to $331.8 million in 1997 from $277.9 million in 1996. The $53.9 million increase was mainly due to the start-up of the HVAC, telecommunications, retail energy, and merchant businesses, and costs associated with establishing the Conectiv brand name and gaining new customers. Lower pension cost and Salem outage expenses partly reduced the total increase in operation and maintenance expenses.
In 1996, operation and maintenance expenses increased $12.5 million primarily due to marketing expenses for value-added (energy-related) services, increased costs associated with the Salem outages, and a full year's operation of the Conowingo District.
Year 2000
A Conectiv project team has been formed to address the issue of computer programs not properly recognizing the Year 2000. The project team is identifying, analyzing, correcting and reporting on all systems, equipment, and processes suspected of putting Conectiv' s businesses or customers at risk. The Year 2000 project • team has developed a detailed plan to address the problem. The project team's goal is to resolve Year 2000
II-12
•
related problems associated with all core systems by the close of 1998. The recent implementation of a new management information system has resolved a substantial portion of the ''Year 2000'' problem. The Company has also contacted major vendors to review remediation of their Year 2000 issues. The Company believes it will successfully resolve its Year 2000 issues in a timely manner and does not expect related costs to be material to the Company's results of operations or financial position.
Depreciation Expense
Depreciation expense increased $7.8 million in 1997 due to completion of on-going construction projects and installation of new systems. Depreciation expense increased $9.2 million in 1996 due to the completion of on-going construction projects and the acquisition of COPCO in mid-1995.
Other Income
In 1997, other income increased to $28.2 million from $7.6 million in 1996 primarily due to a $22.9 million pre-tax gain on the sale of the Pine Grove landfill and waste-hauling operations. On an after-tax basis, the gain was $13.7 million or $0.22 per common share.
Financing Costs
Financing costs reflected in the consolidated income statement include interest charges, allowance for funds used during construction (AFUDC), dividends on preferred securities of a subsidiary trust, and dividends on preferred stock. In 1997, financing costs increased $9.9 million primarily due to higher interest charges from the issuance of $124.2 million of Medium-Term Notes in February 1997 and $42.0 million of Medium-Term Notes in the fourth quarter of 1997, partly offset by savings from the refinancing of $78.4 million of preferred stock in the fourth quarter of 1996. In 1996, financing costs increased $3.2 million primarily due to debt issued in mid-1995 to finance the acquisition of COPCO.
Liquidity And Capital Resources
The Company's primary capital resources are internally generated funds (net cash provided by operating activities less common and preferred dividends) and external financings. These resources provide capital for utility construction expenditures, expansion of new business lines and other capital requirements, such as repayment of maturing debt and capital lease obligations. Utility construction expenditures are the Company's largest on-going capital requirement and are affected by many factors including growth in demand for electricity. In the foreseeable future, the Company expects that incremental demand for electricity will be supplied with purchased power. This expectation, and the Company's strategy to grow new businesses, has shifted a larger proportion of the Company's capital resources into new businesses.
Capital expenditures increased $4.0 million in 1997 and $26.2 million in 1996. The 1997 increase was principally due to $35 million of capital expenditures to expand CCl's fiber optic network, partially offset by a $30 million decrease in utility construction expenditures, including deferred Merger-related costs. In 1996, capital expenditures increased $26.2 million primarily due to higher utility construction.
The Company's cash expenditures for business acquisitions of $17.6 million and $4.9 million in 1997 and 1996, respectively, were due to CSl's acquisition of HVAC and related businesses. In 1995, the Company acquired COPCO for $157.0 million, net of cash acquired, with $125.8 million of long-term debt and the balance with short-term debt.
Operating activities provided net cash inflows of $221.3 million in 1997, $222.7 million in 1996, and $239.4 million in 1995. In 1997, increased cash flows from higher regulated fuel revenues, net of amounts paid for fuel and purchased energy, were offset by planned cost increases associated with investments in new businesses. In 1996, net cash flow from operating activities decreased $16.7 million due to lower electric fuel revenues, net of amounts paid for electric fuel and purchased energy.
II-13
After deducting common and preferred dividend payments of $98.0 million in 1997, $102.4 million in 1996, • 4 and $102.0 million in 1995, internally generated funds were $123.2 million in 1997, $120.3 million in 1996, and $137.4 million in 1995. Internally generated funds provided 110%, 79%, and 101 % of the cash required for utility construction in 1997, 1996, and 1995, respectively.
"Sales of nonutility assets" under cash flows from investing activities includes $33.4 million of pre-tax proceeds from the 1997 sale of Pine Grove Inc.'s landfill and waste-hauling operations. The principal effects of the sale on the consolidated balance sheet were a $23. 7 million decrease in non utility property and an $11. 7 million decrease in variable rate demand bonds.
Long-term financings during 1995-1997, net of long-term refinancings and redemptions, raised $292.8 million of net capital. Sources of cash from long-term financings, net of refinancings and redemptions, included the following: $28.9 million of common stock; $260.6 million of long-term debt; $11.7 million of variable rate demand bonds; and $70.0 million of Company obligated mandatorily redeemable preferred securities issued by the Company's subsidiary trust (as discussed below). Preferred stock outstanding was reduced by $78.4 million during this period.
Depending on its financing needs, the Company periodically raises cash by issuing common stock through its Dividend Reinvestment and Common Share Purchase Plan (DRIP). Alternatively, the Company at times provides DRIP shares to investing stockholders by purchasing its common shares in the open market.
In February 1997, the Company issued $124.2 million of unsecured Medium-Term Notes with maturities of 10 to 30 years and interest rates of 7.06% to 7.72%. The proceeds were used to repay short-term debt. On the consolidated balance sheet as of December 31, 1996, $77.0 million of short-term debt was reclassified to longterm debt to recognize the amount of short-term debt refinanced with the Medium-Term Notes.
In September 1997, $25.0 million of 63/so/o First Mortgage Bonds were redeemed at maturity. In June 1998, $25 million of 5.69%, Medium-Term Notes are scheduled to mature. ·
In the fourth quarter of 1997, the Company repaid short-term debt with proceeds from the issuance of $42 million of unsecured Medium-Term Notes with maturities of 5 to 9 years and interest rates of 6.6% to 6.8%.
In January 1998, the Company issued $33.0 million of 6.81 % Medium-Term Notes, which mature in 20 years, and used $25.4 million of the proceeds to repay short-term debt. In recognition of this refinancing, $25.4 million of short-term debt was reclassified to long-term debt on the consolidated balance sheet as of December 31, 1997.
In October 1996, a subsidiary trust of the Company issued $70 million of 8.125% Company obligated mandatorily redeemable preferred securities and loaned the proceeds to the Company. On a consolidated basis, this financing vehicle results in a tax benefit which is equivalent to the tax effect of a deduction for distributions on the preferred securities. The proceeds from the issuance of the preferred securities and additional short-term debt were used to retire $78.4 million of the Company's preferred stock, which had an average dividend rate of 6.9%. On an after-tax basis, the refinancing lowers financing costs by approximately $1.5 million annually.
The Company's capital structure as of December 31, 1997 and 1996, expressed as a percentage of total capitalization, is shown below.
Over the five-year forecast period, Conectiv's capital requirements, exclusive of maturing debt, are expected to be funded by internally generated funds. External financing, during the five-year period, is anticipated only for the refunding of maturing debt.
Nonutility Subsidiaries
For summarized financial information on the Company's nonutility subsidiaries, please refer to Note 20 to the Consolidated Financial Statements.
Forward-looking Statements
The Private Securities Litigation Reform Act of 1995 (Litigation Reform Act) provides a "safe harbor" for forward-looking statements to encourage such disclosures without the threat of litigation, provided those statements are identified as forward-looking and are accompanied by meaningful, cautionary statements identifying important factors that could cause the actual results to differ materially from those projected in the statement. Forward-looking statements have been made in this report. Such statements are based on management's beliefs as well as assumptions made by and information currently available to management. When used herein, the words "will," "anticipate," "estimate," "expect," "objective," and similar expressions are intended to identify forward-looking statements. In addition to any assumptions and other factors referred to specifically in connection with such forward-looking statements, factors that could cause actual results to differ materially from those contemplated in any forward-looking statements include, among others, the following: deregulation and the unbundling of energy supplies and services; an increasingly competitive energy marketplace; sales retention and growth; federal and state regulatory actions; future litigation results; costs of construction; operating restrictions; increased costs and construction delays attributable to environmental regulations; nuclear decommissioning and the availability of reprocessing and storage facilities for spent nuclear fuel; and credit market concerns. The Company undertakes no obligation to publicly update or revise any forward-looking statements, whether as a result of new information, future events or otherwise. The foregoing review of factors pursuant to the Litigation Reform Act should not be construed as exhaustive or as any admission regarding the adequacy of disclosures made by the Company prior to the effective date of the Litigation Reform Act.
II-15
Item 8. Financial Statements and Supplementary Data
Report of Management
Management is responsible for the information and representations contained in the Company's financial statements. Our financial statements have been prepared in conformity with generally accepted accounting principles, based upon currently available facts and circumstances and management's best estimates and judgments of the expected effects of events and transactions.
Delmarva Power & Light Company maintains a system of internal controls designed to provide reasonable, but not absolute, assurance of the reliability of the financial records and the protection of assets. The internal control system is supported by written administrative policies, a program of internal audits, and procedures to assure the selection and training of qualified personnel.
Coopers & Lybrand L.L.P., independent accountants, are engaged to audit the financial statements and express their opinion thereon. Their audits are conducted in accordance with generally accepted auditing standards which include a review of selected internal controls to determine the nature, timing, and extent of audit tests to be applied.
The Audit Committee of the Board of Directors, composed of outside directors only, meets with management, internal auditors, and independent accountants to review accounting, auditing, and financial reporting matters. The independent accountants are appointed by the Board on recommendation of the Audit Committee, subject to stockholder approval.
Isl How ARD E. CosGROVE
Howard E. Cosgrove Chairman of the Board, President and Chief Executive Officer
March 1, 1998
II-16
Isl BARBARA S. GRAHAM
Barbara S. Graham Senior Vice President and Chief Financial Officer
.~
••
-~
~.
~-
REPORT OF INDEPENDENT ACCOUNTANTS
To the Board of Directors and Stockholders Delmarva Power & Light Company Wilmington, Delaware
We have audited the accompanying consolidated balance sheets of Delmarva Power & Light Company and Subsidiary Companies as of December 31, 1997 and 1996, and the related consolidated statements of income, changes in common stockholders' equity, and cash flows for each of the three years in the period ended December 31, 1997. These financial statements are the responsibility of the Company's management. Our responsibility is to express an_ opinion on these financial statements based on our audits.
We conducted our audits in accordance with generally accepted auditing standards. Those standards require that we plan and perform the audit to obtain reasonable assurance about whether the financial statements are free of material misstatement. An audit includes examining, on a test basis, evidence supporting the amounts and disclosures in the financial statements. An audit also includes assessing the accounting principles used and significant estimates made by management, as well as evaluating the overall financial statement presentation. We believe that our audits provide a reasonable basis for our opinion.
In our opinion, the financial statements referred to above present fairly, in all material respects, the consolidated financial position of Delmarva Power & Light Company and Subsidiary Companies as of December 31, 1997 and 1996, and the consolidated results of their operations and their cash flows for each of the three years in the period ended December 31, 1997, in conformity with generally accepted accounting principles.
Isl COOPERS & LYBRAND L.L.P.
Coopers & Lybrand L.L.P. 2400 Eleven Penn Center Philadelphia, Pennsylvania February 6, 1998, except as to the information presented in Note 4 under Merger with Atlantic Energy, Inc., for which the effective date of the merger is March 1, 1998
II-17
DELMARVA POWER & LIGHT COMPANY
CONSOLIDATED STATEMENTS OF INCOME
Year Ended December 31,
1997 1996 1995 (Dollars in Thousands)
OPERATING REVENUES Electric ................................................. . $1,092,144 $ 986,921 $ 904,904 Gas .................................................... . Other services ........................................... .
204,057 114,284 95,441 127,301 74,370 55,380
1,423,502 1,175,575 1,055,725 OPERATING EXPENSES
Electric fuel and purchased power .......................... . Gas purchased ........................................... . Other services' cost of sales ............................... . Purchased electric capacity ................................ . Operation and maintenance ................................ . Depreciation ............................................ . Taxes other than income taxes ............................. .
1,189,073 918,275 801,300 OPERATING INCOME ..................................... . 234,429 257,300 254,425 OTHER INCOME
Allowance for equity funds used during construction .......... . 1,337 1,338 708 Other income ............................................ . 28,187 7,595 4,716
29,524 8,933 5,424 INTEREST EXPENSE
Interest charges ........................................... . Allowance for borrowed funds used during construction and
INCOME BEFORE INCOME TAXES ........................ . INCOME TAXES ........................................... .
177,864 194,527 193,028 72,155 78,340 75,540
NETINCOME .............................................. . DIVIDENDS ON PREFERRED STOCK ...................... .
105,709 116,187 117,488 4,491 8,936 9,942
EARNINGS APPLICABLE TO COMMON STOCK ............ . $ 101,218 $ 107,251 $ 107,546
Common Stock Average Shares of Common Stock Outstanding (000) .......... . 61,122 60,698 60,217 Basic and Diluted Earnings Per Average Share of Common
Stock ................................................ . $ 1.66 $ 1.77 $ 1.79 Dividends Declared Per Share of Common Stock ............. . $ 1.54 $ 1.54 $ 1.54
See accompanying Notes to Consolidated Financial Statements.
II-18
.~
•
~.
~-
ASSETS Current Assets
DELMARVA POWER & LIGHT COMPANY
CONSOLIDATED BALANCE SHEETS
Cash and cash equivalents .......................................... . Accounts receivable ............................................... . Inventories, at average cost
Fuel (coal, oil and gas) ........................................ . Materials and supplies ......................................... .
Prepayments ..................................................... . Deferred energy costs .............................................. . Deferred income taxes, net ......................................... .
Investments Investment in leveraged leases ...................................... . Funds held by trustee .............................................. . Other investments ................................................. .
Property, Plant and Equipment Electric utility plant ............................................... . Gas utility plant .................................................. . Common utility plant .............................................. .
Net utility plant in service .......................................... . Utility construction work-in-progress ................................. . Leased nuclear fuel, at amortized cost ................................ . Nonutility property, net ............................................ . Goodwill, net .......................................... · ........... .
Deferred Charges and Other Assets Prepaid employee benefits costs ..................................... . Unamortized debt expense .......................................... . Deferred debt refinancing costs ...................................... . Deferred recoverable income taxes ................................... . Other ................ · ........................................... .
See accompanying Notes to Consolidated Financial Statements.
II-19
DELMARVA POWER & LIGHT COMPANY
CONSOLIDATED BALANCE SHEETS
CAPITALIZATION AND LIABILITIES Current Liabilities
Short-term debt ..................................................... . Long-term debt due within one year .................................... . Variable rate demand bonds ........................................... . Accounts payable .................................................... . Taxes accrued ............................................... -~ ....... . Interest accrued .......... · ........................................... . Dividends payable ................................................... . Current capital lease obligation ........................................ . Deferred income taxes, net ............................................ . Other .............................................................. .
Deferred Credits and Other Liabilities Deferred income taxes, net ............................................ . Deferred investment tax credits ........................................ . Long-term capital lease obligation ...................................... . Other .............................................................. .
Capitalization Common stock, $2.25 par value; 90,000,000 shares authorized; shares
Total common stockholders' equity ..................................... . Cumulative preferred stock ............................................ . Company obligated mandatorily redeemable preferred securities of subsidiary
Total Capitalization and Liabilities ....................................... . $3,015,481 $2,931,855
See accompanying Notes to Consolidated Financial Statements.
II-20
•
•
•
••
DELMARVA POWER & LIGHT COMPANY
CONSOLIDATED STATEMENTS OF CASH FLOWS
Year Ended December 31,
1997 1996 1995 (Dollars in Thousands)
Cash Flows From Operating Activities Net income ................................................................ . Adjustments to reconcile net income to net cash provided by operating activities
Depreciation and amortization .............................................. . Allowance for equity funds used during construction ........................... . Investment tax credit adjustments, net ........................................ . Deferred income taxes, net ................................................. .
Net change in: Accounts receivable ..................................................... . Inventories ............................................................. . Accounts payable ....................................................... . Other current assets & liabilities(!) ........................................ .
Gains on sales of nonutility assets ........................................... . Other, net ................................................................ .
Net cash provided by operating activities ......................................... .
Cash Flows From Investing Activities Acquisition of businesses, net of cash acquired .................................. . Capital expenditures ......................................................... . Change in working capital for construction ...................................... . Sales of nonutility assets ..................................................... . Decrease in bond proceeds held in trust funds ................................... . Deposits to nuclear decommissioning trust funds ................................. . Other, net .................................................................. .
Net cash used by investing activities ............................................. .
Cash Flows From Financing Activities Dividends: Common ..................................................... .
Principal portion of capital lease payments ...................................... . Net change in term loan(4) ................................................... . Net change in short-term debt ................................................. . Cost of issuances and refinancings ............................................. .
Net cash used by financing activities ............................................. .
Net change in cash and cash equivalents .......................................... . Beginning of year cash and cash equivalents ...................................... .
End of year cash and cash equivalents ............................................ .
(1) Other than debt and deferred income taxes classified as current. (2) Excluding net change in term loan.
$ 105,709
142,734 (1,337) (2,560) 7,169
(53,911) 4,763
16,394 43,450
(22,896) (18,250)
221,265
(17,594) (173,008)
55 34,880
2,002 (4,240) 1,132
(156,773)
(93,811) (4,233)
166,200
17,807
(28,540) (1,800) (7,323)
(6,813)
(102,671) (4,502)
(65,686)
(1,194) 36,533
$ 35,339
$ 116,187
134,109 (1,338) (2,560) 33,218
(5,030) (4,489) 18,418
(48,383) (380)
(17,100)
222,652
(4,884) (169,012)
(4,880) 793
7,163 (4,238) 1,195
(173,863)
(93,290) (9,102)
486 70,000 (1,504) (1,500) (5,466)
(78,383) (5,538)
86,498 (3,408)
(41,207)
7,582 28,951
$ 36,533
(3) Company obligated mandatorily redeemable preferred securities of subsidiary trust holding solely Company debentures. (4) As of December 31, 1994, the Company had a $45.0 million term loan which was classified as long-term debt.
See accompanying Notes to Consolidated Financial Statements.
II-21
$ 117,488
127,268 (708)
(2,516) 15,992
(14,022) 18,590 3,269
(14,349) (3,420) (8,164)
239,428
(157,014) (142,833)
1,102 4,970 2,658
(3,612) (351)
(295,080)
(92,221) (9,813)
125,800 15,000 24,693
(1,388)
(1,253)
(7,875) (45,000) 53,154 (1,523)
59,574
3,922 25,029
$ 28,951
DELMARVA POWER & LIGHT COMPANY • 4 CONSOLIDATED STATEMENTS OF CHANGES IN COMMON STOCKHOLDERS' EQUITY
Common Additional Unearned Shares Par Paid-in Retained Treasury Compen-
Outstanding Value(l) Capital Earnings Stock sation Total (Dollars in Thousands}
Balance as of January 1, 1995 ............ 59,542,006 $133,970 $484,377 $267,002 $ $(1,180) $884,169 Net income ............................. 117,488 117,488 Cash dividends declared
Common stock ($1.54 per share) ......... (92,686) (92,686) Preferred stock ........................ (9,942) (9,942)
Issuance of common stock DRIP(2) ............................. 1,210,048 2,723 21,806 24,529 Stock options ......................... 3,900 9 63 72 Other issuance ........................ 4,731 11 82 93
Reacquired common shares ............... (63,370) (1,253) 19 (1,234) LTI'P(3) ............................... 62,050 1,223 (1,223) Amortization of unearned compensation ..... 951 951 Balance as of December 31, 1995 ......... 60,759,365 136,713 506,328 281,862 (30) (1,433) 923,440 Net income ............................. 116,187 116,187 Cash dividends declared
Common stock ($1.54 per share) ......... (93,294) (93,294) Preferred stock ........................ (8,936) (8,936)
Issuance of common stock Business acquisitions ................... 212,350 4,396 4,396 DRIP(2) ····························· 21,465 47 388 435 Stock options ......................... 2,400 5 45 50 Expenses ............................. (72) (72)
Reacquired common stock ................ (312,861) 532 (6,504) 363 (5,609). 4 Amortization of unearned compensation ..... 687 (548) 139 Refinancing of preferred stock ............. 392 (2,215) (1,823)
Balance as of December 31, 1996 ......... 60,682,719 136,765 508,300 293,604 (2,138) (1,618) 934,913 Net income ............................. 105,709 105,709 Cash dividends declared
Common stock ($1.54 per share) ......... (94,065) (94,065) Preferred stock ........................ (4,491) (4,491)
Issuance of common stock DRIP(2) ............................. 965,655 2,173 15,485 17,658 LTIP(3) .............................. 71,103 160 1,200 (1,360) Stock options ......................... 5,450 12 88 100 Other issuance ........................ 2,741 6 47 53
Reacquired common stock ................ (517,406) 230 (9,549) 2,162 (7,157) Amortization of unearned compensation ..... 1,462 314 1,776 --- ---Balance as of December 31, 1997 ......... 61,210,262 $139,116 $526,812 $300,757 $(11,687) $ (502) $954,496
--- --- --- --
(1) The Company's common stock has a par value of $2.25 per share and 90,000,000 shares are authorized. (2) Dividend Reinvestment and Common Share Purchase Plan (DRIP)-As of December 31, 1997, 3,742,677 shares remained available
(3) under the Company's registration statement filed with the Securities and Exchange Commission for issuance of shares through the DRIP. Shares of restricted common stock granted under the Company's Long-Term Incentive Plan.
See accompanying Notes to Consolidated Financial Statements.
II-22
DELMARVA POWER & LIGHT COMPANY
NOTES TO CONSOLIDATED FINANCIAL STATEMENTS
1. Significant Accounting Policies
Nature of Business
As discussed in Note 4 to the Consolidated Financial Statements, effective March 1, 1998, Delmarva Power & Light Company (the Company) and Atlantic Energy, Inc. (Atlantic) consummated a series of merger transactions (the Merger) which formed a new company named Conectiv, and merged Atlantic out of existence.
In 1997, the Company's revenues were earned from the following sources: 77% from the sale and delivery of electricity, 14% from the sale and transportation of gas, and 9% from other services.
The Company provides regulated electric service (supply and delivery) to approximately 448,300 customers located on the Delmarva Peninsula and also sells electricity off-system in markets which are not subject to price regulation. The Company's traditional electric service territory on the Delmarva Peninsula, which includes Delaware, ten primarily Eastern Shore counties in Maryland, and the Eastern Shore of Virginia, encompasses an area consisting of about 6,000 square miles with a population of approximately 1.2 million.
The Company provides regulated gas service (supply and/or transportation) to approximately 103,200 customers located in an area consisting of about 275 square miles with a population of approximately 480,000 in northern Delaware, including the City of Wilmington. The Company also sells gas off-system in markets which are not subject to price regulation.
"Other services," which are not subject to utility regulation, are sold by the Company and its wholly owned subsidiaries. As of December 31, 1997, other services' business activities were conducted primarily by three subsidiaries: Conectiv Services, Inc., which provides heating, ventilation, and air-conditioning (HV AC) sales, installation and services; Conectiv Communications, Inc., which provides local and long-distance phone service; and Delmarva Capital Investments, Inc., which is involved in power plant operating services, real estate activities, and leveraged equipment leases. Delmarva Capital Investments, Inc. sold its landfill and waste-hauling operations in 1997 as discussed in Note 5 to the Consolidated Financial Statements.
Regulation of Utility Operations
The Company is subject to regulation with respect to its retail utility sales by the Delaware and Maryland Public Service Commissions (DPSC and MPSC, respectively) and the Virginia State Corporation Commission (VSCC), which have powers over rate matters, accounting, and terms of service. Gas sale,s are subject to regulation by the DPSC. The Federal Energy Regulatory Commission (FERC) exercises jurisdiction with respect to the Company's accounting systems and policies, the transmission of electricity, the wholesale sale of electricity, and interchange and other purchases and sales of electricity involving other utilities. The FERC also regulates the price and other terms of transpo1tation of natural gas purchased by the Company. Excluding offsystem sales not subject to price regulation, the percentage of electric and gas utility operating revenues regulated by each Commission for the year ended December 31, 1997, was as follows: DPSC, 64.0%; MPSC, 27.0%; VSCC, 2.7%; and FERC, 6.3%.
Refer to Note 9 to the Consolidated Financial Statements for a discussion of regulatory assets arising from the financial effects of rate regulation.
Consolidation Policy
The consolidated financial statements include the accounts of the Company's wholly owned subsidiaries. All significant intercompany accounts and transactions are eliminated in consolidation. Certain reclassifications, not affecting net income, have been made to conform amounts previously reported to the current presentation.
II-23
DELMARVA POWER & LIGHT COMPANY
NOTES TO CONSOLIDATED FINANCIAL STATEMENTS-(Continued)
Primarily, the operating results of nonutility subsidiaries were reclassified from "Other income" into other classifications within the income statement.
Use of Estimates
The preparation of financial statements in conformity with generally accepted accounting principles requires management to make certain estimates and assumptions that affect the reported amounts of assets and liabilities and disclosure of contingent assets and liabilities at the date of the financial statements and the reported amounts of revenues and expenses during the reporting period. Actual results could differ from those estimates.
Utility Revenues
At the end of each month, there is an amount of electric and gas service rendered from the last meter reading to the month-end which has not yet been billed to customers. The non-fuel (base rate) revenues associated with such unbilled services are accrued by the Company.
When interim rates are placed in effect subject to refund, the Company recognizes revenues based on expected final rates.
Fuel Expense
Fuel costs charged to the Company's results of operations generally are adjusted to match fuel costs included in customer billings (fuel revenues). The difference between fuel revenues and actual fuel costs incurred is reported on the Consolidated Balance Sheets as ''Deferred energy costs.'' The deferred balance is subsequently recovered from or returned to utility customers.
The Company's share of nuclear fuel at the Peach Bottom Atomic Power Station (Peach Bottom) and the Salem Nuclear Generating Station (Salem) is financed through a contract which is accounted for as a capital lease. Nuclear fuel costs, including a provision for the future disposal of spent nuclear fuel, are charged to fuel expense on a unit-of-production basis.
Financial Instruments
The Company's Energy Supply business group (currently known as Conectiv Energy Supply) uses futures, options and swap agreements to hedge firm commitments or anticipated transactions of commodities associated with the energy sector (natural gas and electricity). In order to qualify for hedge accounting a derivative, at its inception and on an ongoing basis, must be expected to substantially offset adverse price movements in the firm commitment or anticipated transaction that it is hedging. Gains and losses related to qualifying hedges are deferred and are recognized in income when the underlying transaction occurs. If subsequent to being hedged, underlying transactions are no longer likely to occur or the hedge is no longer effective, the related derivatives gains or losses are recognized currently in income. Gains and losses on derivatives that do not qualify as hedges are recognized currently in revenues. Premiums paid for options are included as current assets in the consolidated balance sheet until they are exercised or expire. Margin requirements for futures contracts are also recorded as current assets. Unrealized gains and losses on all futures contracts are deferred on the consolidated balance sheet as either current assets or deferred credits. The cash flows from derivatives are included in the cash flows from operations section of the cash flow statement.
Depreciation Expense
The annual provision for depreciation on utility property is computed on the straight-line basis using composite rates by classes of depreciable property. The relationship of the annual provision for depreciation for
II-24
•
~ I
DELMARVA POWER & LIGHT COMPANY
NOTES TO CONSOLIDATED FINANCIAL STATEMENTS-(Continued)
financial accounting purposes to average depreciable property was 3.7% for 1997 and 3.6% for 1996 and 1995. Depreciation expense includes a provision for the Company's share of the estimated cost of decommissioning nuclear power plant reactors based on amounts billed to customers for such costs. Refer to Note 7 to the Consolidated Financial Statements for additional information on nuclear decommissioning.
Income Taxes
Refer to Note 3, for the Company's accounting policy on income taxes and investment tax credits.
Debt Refinancing Costs
Costs of refinancing debt are deferred and amortized over the period during which the refinancing costs are recovered in utility rates.
Interest Expense
The amortization of debt discount, premium, and expense, including refinancing expenses, is included in interest expense.
Allowance for Funds Used During Construction
Allowance for Funds Used During Construction (AFUDC) is included in the cost of utility plant and represents the cost of borrowed and equity funds used to finance construction of new utility facilities. In the Consolidated Statements of Income, the borrowed funds component of AFUDC is reported as a reduction of interest expense and the equity funds component of AFUDC is reported as other income. AFUDC was capitalized on utility plant construction at the rates of 7.5% in 1997, 6.7% in 1996, and 7.1 % in 1995.
Stock-based Employee Compensation
Refer to Note 10 to the Consolidated Financial Statements for the Company's accounting policy on stockbased employee compensation.
Goodwill
The Company amortizes goodwill arising from business acquisitions over the shorter of the estimated useful life or 40 years.
Leveraged Leases
As of December 31, 1997, the Company's portfolio of leveraged leases, held by a nonutility subsidiary, consisted of five aircraft leased to three separate airlines. The Company's investment in leveraged leases includes the aggregate of rentals receivable (net of principal and interest on nonrecourse indebtedness) and estimated residual values of the leased equipment less unearned and deferred income (including investment tax credits). Unearned and deferred income is recognized at a level rate of return during the periods in which the net investment is positive.
Funds Held By Trustee
Funds held by trustee are stated at fair market value and generally include deposits in the Company's external nuclear decommissioning trusts and unexpended, restricted, tax-exempt bond proceeds.
II-25
DELMARVA POWER & LIGHT COMPANY
NOTES TO CONSOLIDATED FINANCIAL STATEMENTS-(Continued)
Earnings Per Share
Earnings per share has been computed in accordance with Statement of Financial Accounting Standards (SFAS) No. 128, "Earnings Per Share." Under SFAS No. 128, basic earnings per share is computed based on earnings applicable to common stock (net income less preferred dividends) divided by the weighted average number of common shares outstanding for the period. Diluted earnings per share is computed based on earnings applicable to common stock divided by the weighted average number of shares of common stock outstanding during the period after giving effect to securities considered to be dilutive common stock equivalents. The effect of dilutive common stock equivalents was not significant, consequently for 1997, 1996, and 1995, the Company's basic and diluted earnings per share were the same amounts.
Cash Equivalents
In the consolidated financial statements, the Company considers highly liquid marketable securities and debt instruments purchased with a maturity of three months or less to be cash equivalents.
2. Supplemental Cash Flow Information
Cash Paid During the Year 1997 1996 1995
(Dollars in Thousands)
Interest, net of capitalized amount ........................... . $73,211 $67,596 $62,660 Income taxes, net of refunds ................................ . $53,550 $56,582 $66,764
3. Income Taxes
The Company files a consolidated federal income tax return which includes its wholly owned subsidiaries. Income taxes are allocated to the Company's subsidiaries based upon the taxable income or loss of each subsidiary.
Deferred income tax assets and liabilities represent the tax effects of temporary differences between the financial statement and tax bases of existing assets and liabilities and are measured using presently enacted tax rates. The portion of the Company's deferred tax liability applicable to utility operations that has not been reflected in current customer rates represents income taxes recoverable through future rates and is reflected on the Consolidated Balance Sheets as "Deferred recoverable income taxes." Deferred recoverable income taxes were $88.7 million and $90.3 million as of December 31, 1997 and 1996, respectively.
Deferred income tax expense represents the net change during the reporting period in the net deferred tax liability and deferred recoverable income taxes.
Investment tax credits (ITC) from regulated operations are being amortized over the useful lives of the related utility plant. ITC associated with leveraged leases are being amortized over the lives of the related leases during the periods in which the net investment is positive.
II-26
•
~-
DELMARVA POWER & LIGHT COMPANY
NOTES TO CONSOLIDATED FINANCIAL STATEMENTS-(Continued)
Components of Consolidated Income Tax Expense 1997 1996 1995
Total deferred tax assets ..................................... .
Total deferred taxes, net ......................................... .
As of December 31,
1997 1996 (Dollars in Thousands)
$300,558 109,303 38,288 41,061
7,054 81,482
577,746
14,815 70,915
85,730
$492,016
$275,230 111,891 41,604 42,556 13,240 75,332
559;853
15,902 57,524
73,426
$486,427
Valuation allowances for deferred tax assets were not material as of December 31, 1997 and 1996.
II-27
DELMARVA POWER & LIGHT COMPANY
NOTES TO CONSOLIDATED FINANCIAL STATEMENTS-(Continued)
4. Mergers and Acquisitions
Merger with Atlantic Energy, Inc.
On August 12, 1996, the Company announced plans to merge with Atlantic Energy, Inc. (Atlantic). On March 1, 1998, the two companies consummated merger transactions (the Merger) which formed a new company named Conectiv, and merged Atlantic out of existence. Prior to the Merger, Atlantic owned Atlantic City Electric Company (ACE), an electric utility, and subsidiaries engaged in nonutility businesses. ACE serves approximately 481,000 customers in a 2,700 square mile area in southern New Jersey. For financial information about Atlantic and ACE, see the tables presented at the end of this note.
Under the Merger approval settlement agreements with the DPSC, MPSC, and VSCC, the Company will reduce retail base rates in order to share with utility customers a portion (ranging from approximately 50% to 60%) of the net cost savings expected to result from the Merger. The annualized amounts of the retail base rate decreases are as follows:
Jurisdiction
Delaware retail electric ......................... . Delaware retail electric ......................... . Delaware retail electric ......................... . Delaware gas ................................. . Maryland retail electric ......................... . Virginia retail electric .......................... .
Annualized Base Rate Decrease
$7.5 million (1.5%) $0.6 million (0.1 % ) $0.4 million (0.1%) $0.5 million (0.5%) $3.5 million (1.3%) $0.5 million (l.5%)
Effective Date
March 1, 1998 March 1, 1999 March 1, 2000 March 1, 1999 March 1, 1998 March 1, 1998
Under the Merger order of the Board of Public Utilities (BPU) in New Jersey, ACE will share approximately 75% of the estimated Merger savings with its customers through a $15.75 million (on an annualized basis) electric rate reduction.
On June 26, 1997, the Company and Atlantic announced that enhanced retirement offers (ERO) and other employee separation programs were expected to be utilized to achieve workforce reductions concurrent with the Merger of the two companies. As of December 31, 1997, the ERO and other employee separation programs were contingent on consummation of the Merger. Employee separation costs and other Merger costs related to Delmarva will be expensed and are estimated to be approximately $55 million to $60 million before taxes ($33 million to $36 million after taxes).
Conectiv, a corporation formed to accomplish the Merger, holds the common stock of the Company and ACE and is a registered holding company under the Public Utility Holding Company Act of 1935. Each outstanding share of the Company's common stock, par value $2.25 per share, is being exchanged for one share of Conectiv's common stock, par value $0.01 per share. Each share of Atlantic's common stock, no par value per share, is being exchanged for 0.75 of one share of Conectiv's common stock and 0.125 of one share of Co.nectiv's Class A common stock, par value $0.01 per share. Class A common stock gives holders of Atlantic common stock a proportionately greater opportunity to share in the growth prospects of, and a proportionately greater exposure to the uncertainties associated with the electric utility business of ACE. Earnings applicable to Class A common stock will be equal to 30% of the net of (1) earnings attributable to ACE's regulated electric utility business, as the business existed on August 9, 1996, less (2) $40 million per year. Earnings applicable to Conectiv common stock will be the consolidated earnings of Conectiv less earnings applicable to Class A common stock.
The Merger is being accounted for under the purchase method of accounting, with the Company as the • acquirer. The total consideration to be paid to Atlantic's common stockholders, measured by the average daily
II-28
~-
DELMARVA POWER & LIGHT COMPANY
NOTES TO CONSOLIDATED FINANCIAL STATEMENTS-(Continued)
closing market price of Atlantic's common stock for the three trading days immediately preceding and the three trading days immediately following the public announcement of the Merger, is $921.0 million. The consideration paid plus estimated acquisition costs and liabilities assumed in connection with the Merger are expected to exceed the net book value of Atlantic's net assets by approximately $200.5 million, which will be recorded as goodwill. The actual amount of goodwill recorded will be based on Atlantic's net assets as of the Merger date and, accordingly, will vary from the preceding estimate which is based on Atlantic's net assets as of December 31, 1997. The goodwill will be amortized over 40 years.
Proforma unaudited financial information for Conectiv on a consolidated basis, giving effect to the Merger as if it had occurred on January 1, 1997, and actual reported financial information for Atlantic and ACE is presented below. The pro forma information excludes expected one-time charges related to the Merger such as the ERO and other employee separation costs. The pro forma information is not necessarily indicative of the results that would have occurred in 1997, or that will occur in the future.
Summarized Income Statement Information (unaudited) Year Ended December 31, 1997
ProForma Conectiv Atlantic ACE
(Dollars in Thousands except per share amounts)
Operating Revenues .......................................... . $2,525,862 $1,102,360 $1,084,890 Net Income ................................................. . $ 185,923 $ 74,405 $ 85,747 Earnings Applicable to Common Stock:
Common stock .......................................... . $ 170,005 $ 74,405 $ 80,926 Class A common stock(l) ................................. . $ 15,918
Average common shares outstanding (000) Common stock .......................................... . 100,500 52,281 Class A common stock .................................... . 6,563
Basic and Diluted Earnings per average share outstanding of: Common stock .......................................... . $ 1.69 $ 1.42 Class A common stock .................................... . $ 2.43
(1) The calculation of proforma 1997 earnings applicable to Class A common stock is shown below.
ACE earnings applicable to common stock ............................... . Add: Termination of employee benefit plans due to Merger ................. . Less: Net earnings of nonutility activities specifically excluded .............. . Less: Fixed amount of $40 million per year .............................. .
Subtotal ............................................................ . Percentage applicable to Class A common stock .......................... .
Earnings applicable to Class A common stock ............................ .
II-29
(Dollars in Thousands)
$ 80,926 15,600 (3,466)
(40,000)
53,060 30%
$ 15,918
DELMARVA POWER & LIGHT COMPANY
NOTES TO CONSOLIDATED FINANCIAL STATEMENTS-(Continued)
Summarized Balance Sheet Information (unaudited)
Current assets ................................... . Noncurrent assets ................................ .
Total assets ..................................... .
Current liabilities ................................ . Noncurrent liabilities ............................. . Preferred stock and securities ...................... . Common shareholders' equity ...................... .
Total capitalization and liabilities ................... .
Acquisition of Conowingo Power Company
As of December 31, 1997
ProForma Conectiv Atlantic ACE
(Dollars in Thousands except per share amounts)
$ 599,747 5,329,687
$5,929,434
$ 774,458 3,033,099
283,653 1,838,224
$5,929,434
$ 268,022 2,455,862
$2,723,884
$ 342,526 1,472,325
123,950 785,083
$2,723,884
$ 239,751 2,197,004
$2,436,755
$ 181,880 1,347,892
123,950 783,033
$2,436,755
On June 19, 1995, the Company acquired Conowingo Power Company (COPCO), the Maryland retail electric subsidiary of PECO Energy Company (PECO), for $158.2 million ($157.0 million net of cash acquired). The Company financed the acquisition with $125.8 million of long-term debt and the balance with short-term debt. COPCO was merged into the Company and is operated as the Conowingo District. Approximately 37,500 electric retail customers were added to the Company's customer base. The acquisition was accounted for as a purchase and, accordingly, the operating results of the Conowingo District since June 19, 1995 are included in the Consolidated Statements of Income. The purchase price included $76 million of goodwill which is being amortized on a straight-line basis over 40 years.
Assuming that the COPCO acquisition had occurred at the beginning of 1995, the Company's pro forma operating results for 1995 would not have been materially different from the operating results reported.
Acquisition of Other Service Companies
The Company's expenditures for HVAC and other service companies acquired in 1997 and 1996 were $17.6 million and $9.3 million (including non-cash consideration), respectively.
5. Sale of Pine Grove Landfill and Waste Hauling Companies
In the fourth quarter 1997, a subsidiary of the Company sold the Pine Grove Landfill and its related wastehauling company. The subsidiaries which were sold had a net book value of approximately $11.3 million and reported revenues in 1997 of approximately $12.7 million. Pre-tax proceeds received from the sale were $34.2 million ($33.4 million net of cash sold), resulting in a pre-tax gain of $22.9 million ($13.7 million after income taxes) or $0.22 per common share.
6. Commodity Hedging Activities
The Company's Energy Supply business group (currently known as Conectiv Energy Supply) engages in commodity hedging activities to minimize the risk of market fluctuations associated with the purchase and sale of energy commodities (natural gas and electricity). Some hedging activities are conducted using energy derivatives. Most of the Company's hedging activity is conducted by backing physical transactions with offsetting physical positions. Currently, commodity hedging activities using derivatives are only conducted in
II-30
DELMARVA POWER & LIGHT COMPANY
NOTES TO CONSOLIDATED FINANCIAL STATEMENTS-(Continued)
conjunction with transactions that are not subject to price regulation. The hedging objectives include the assurance of stable and known minimum cash flows and the fixing of favorable prices and margins when they become available. Under internal guidelines, risk exposure is mitigated to acceptable risk tolerance levels.
Energy Supply utilizes futures, options and swap agreements to manage risk. Futures help manage commodity price risk by fixing purchase or sales prices. Options provide a floor or ceiling on future purchases or sales prices while allowing the Company to benefit from favorable price movements. Swaps are structured to provide the same risk protection as futures and options. Basis swaps are used to manage risk by fixing the basis differential that exists between a delivery location index and the commodity futures price.
At December 31, 1997, there were 220 open futures contracts and 30 open options contracts to purchase natural gas, representing a notional quantity of 2.5 billion cubic feet (Bet) through October of 1999, at an average price of $2.35 per thousand cubic feet (Met), and 60 open options contracts, to sell natural gas, representing a notional quantity of 0.6 Bcf through July of 1998 at an average price of $2.38 per Mcf. At December 31, 1997, there was 1 swap contract to sell electricity, representing a notional quantity of 68,000 megawatt-hours (MWh), through August of 1998 at an average price of $31.91 per MWh. These open contracts were entered into to hedge the gas and electric marketing activities of the Energy Supply business group through October 1999. A total of $0.3 million of unrealized losses were deferred on the consolidated balance sheet as of December 31, 1997.
The Company is exposed to credit losses in the event of nonperformance by counterparties to its various hedging contracts. Management has evaluated and implemented policies and procedures to monitor such risk and believes that the overall business risk is minimized as a result.
7. Nuclear Decommissioning
The Company records a liability for its share of the estimated cost of decommissioning the Peach Bottom and Salem nuclear reactors over the remaining lives of the plants based on amounts collected in rates charged to electric customers. For utility rate-setting purposes, the Company estimates its share of future nuclear decommissioning costs based on Nuclear Regulatory Commission (NRC) regulations concerning the minimum financial assurance amount for nuclear decommissioning. The Company is presently recovering, through electric rates in the Delaware and Virginia jurisdictions, nuclear decommissioning costs based on the current NRC minimum financial assurance amount of approximately $130 million. In the Maryland and FERC jurisdictions, the Company is presently recovering nuclear decommissioning costs based on the 1990 NRC minimum financial assurance amount of approximately $50 million.
The Company's accrued nuclear decommissioning liability, which is reflected in the accumulated reserve for depreciation, was $48.8 million as of December 31, 1997. The provision reflected in depreciation expense for nuclear decommissioning was $4.2 million in 1997, $4.2 million in 1996, and $3.6 million in 1995. External trust funds established by the Company for the purpose of funding nuclear decommissioning costs had an aggregate book balance of $46.5 as of December 31, 1997. Earnings on the trust funds are recorded as an increase to the accrued nuclear decommissioning liability, which, in effect, reduces the expense recorded for nuclear decommissioning.
The ultimate cost of nuclear decommissioning for the Peach Bottom and Salem reactors may exceed the NRC minimum financiai assurance amount, which is updated annually under a NRC prescribed formula.
The staff of the Securities and Exchange Commission has questioned certain of the current accounting practices of the electric utility industry, including the Company, regarding the recognition, measurement and
• • classification of decommissioning costs for nuclear generating stations in the financial statements of electric , utilities. In February 1996, the Financial Accounting Standards Board (FASB) issued the Exposure Draft,
II-31
DELMARVA POWER & LIGHT COMPANY
NOTES TO CONSOLIDATED FINANCIAL STATEMENTS-(Continued)
"Accounting for Certain Liabilities Related to Closure or Removal of Long-Lived Assets," which proposed changes in the accounting for closure and removal costs of long-lived assets, including the recognition, measurement, and classification of decommissioning costs for nuclear generating stations. If the proposed changes were adopted: (1) annual provisions for decommissioning would increase, (2) the estimated cost for decommissioning would be recorded as a liability rather than as accumulated depreciation, and (3) trust fund income from the external decommissioning trusts would be reported as investment income rather than as a reduction of decommissioning expense. The F ASB is uncertain when it will issue a final Statement or a revised Exposure Draft.
8. Jointly Owned Plant
The Company's Consolidated Balance Sheets include its proportionate share of assets and liabilities related to jointly owned plant. The Company's share of operating and maintenance expenses of the jointly owned plant is included in the corresponding expenses in the Consolidated Statements of Income. The Company is responsible for providing its share of financing for the jointly owned facilities. Information with respect to the Company's share of jointly owned plant as of December 31, 1997 was as follows:
Nuclear Peach Bottom ......................... . Salem ................................ .
In conformity with generally accepted accounting principles, the Company's accounting policies reflect the financial effects of rate regulation and decisions issued by regulatory commissions having jurisdiction over the Company's utility business. In accordance with the provisions of SPAS No. 71, "Accounting for the Effects of Certain Types of Regulation,'' the Company defers expense recognition of certain costs and records an asset, a result of the effects of rate regulation. Except for deferred energy costs, which are classified as a current asset, these "regulatory assets" are included on the Company's Consolidated Balance Sheets under "Deferred Charges and Other Assets." As of December 31, 1997, the Company had $156.5 million of regulatory assets, which included the following: deferred energy costs-$18.0 million; deferred debt refinancing costs-$18.8 million; deferred recoverable income taxes-$88.7 million (refer to Note 3, to the Consolidated Financial Statements); deferred recoverable plant costs-$7.8 million; deferred costs for decontamination and decommissioning of United States Department of Energy gaseous diffusion enrichment facilities-$6.3 million; deferred demand-side management costs-$6.2 million; and other regulatory assets-$10.7 million. The costs of these assets are either being recovered or are probable of being recovered through customer rates. Generally, the costs of these assets are recognized in operating expenses over the period the cost is recovered from customers.
Prices charged to electric utility customers have historically been a ''bundled'' price which includes the electricity production (supply) cost and the delivery cost (transmission and distribution). Various state regulatory
II-32
•
DELMARVA POWER & LIGHT COMPANY
NOTES TO CONSOLIDATED FINANCIAL STATEMENTS-(Continued)
commissions and legislatures, as well as federal legislators, are considering or have approved chang~s to laws and regulations governing the pricing of electricity. These changes would generally deregulate the supply component of the price charged to a customer for electricity. Under existing plans, the transmission and distribution of electricity would continue to be regulated. Authoritative accounting guidance issued in 1997 prescribes that a utility should cease to apply SFAS No. 71 for any separable portion of the business, such as the electricity supply portion of the business no later than the date that a specific deregulation plan is finalized. Stranded costs and regulatory assets attributed to electricity supply would continue to be recognized to the extent that a transition plan provides for their recovery through. cash flows from the regulated transmission and distribution business.
Proposals concerning deregulation of the electric utility industry are being considered in Delaware, Maryland, and Virginia (the states which have jurisdiction over the Company's retail electric utility business), but no deregulation plan has yet been finalized. Thus, at. this time, the Company cannot predict if or when it would cease applying SFAS No. 71, and the related financial impacts of discontinuing SFAS No. 71.
10. Common Stock
For information concerning issuances and redemptions of common stock during 1995-1997, please refer to the Consolidated Statements of Changes in Common Stockholders' Equity.
Through the effective date of the Company's Merger with Atlantic (March 1, 1998), the Company's LongTerm Incentive Plan (LTIP) provided long-term incentives to key employees through contingent awards of performance-based restricted stock. The restricted stock is earned over a four-year period to the extent that performance targets are satisfied. Restrictions on shares contingently granted in 1994-1996 will lapse upon the earlier of March 1, 1998 or the end of the four-year vesting period. Restrictions on shares contingently granted in 1997 do not lapse on March 1, 1998. During 1997, 1996, and 1995, the number of restricted shares contingently granted and their fair values as of grant date was as follows: 1997-110,670 shares, $19~ per share fair value; 1996-48,750 shares, $22¥4 per share fair value; 1995--62,050 shares, $18%4 per share fair value.
Changes in stock options granted under the LTIP are summarized below.
1997 1996 1995
Number Weighted Number Weighted Number Weighted of Shares Average Price of Shares Average Price of Shares Average Price
For options outstanding as of December 31, 1997, the range of exercise prices was $17 .50 to $21.25 and the weighted average remaining contractual life was 2.8 years.
The Company recognizes compensation costs for its stock-based employee compensation plans based on the accounting prescribed by Accounting Principles Board (APB) Opinion No. 25, "Accounting for Stock Issued to Employees." Stock-based employee compensation costs charged to expense were $2.2 million in 1997, $0.3 million in 1996, and $1.3 million in 1995. Pro forma net income, based on the application of SFAS No. 123, "Accounting for Stock-Based Compensation," would have changed by $0.5 million or less in 1997, 1996, and 1995, and earnings per share would have changed by less than $0.01 per share in each year.
II-33
DELMARVA POWER & LIGHT COMPANY
NOTES TO CONSOLIDATED FINANCIAL STATEMENTS-(Continued)
11. Company Obligated Mandatorily Redeemable Preferred Securities of Subsidiary Trust Holding Solely Company Debentures
A wholly owned subsidiary trust (Delmarva Power Financing I) was established in 1996 as a financing subsidiary of the Company for the purposes of issuing common and preferred trust securities and holding 8.125% Junior Subordinated Debentures (the Debentures). The Debentures held by the trust are its only assets. The trust uses interest payments received on the Debentures it holds to make cash distributions on the trust securities.
The combination of the obligations of the Company pursuant to the Debentures, agreements to pay the expenses of the trust and the Company's guarantee of distributions with respect to trust securities, to the extent the trust has funds available therefor, constitute a full and unconditional guarantee by the Company of the obligations of the trust under the trust securities the trust has issued. The Company is the owner of all of the common securities of the trust, which constitute approximately 3% of the liquidation amount of all of the trust securities issued by the trust. ·
In October 1996, the trust issued $70 million in aggregate liquidation amount of 8.125% Cumulative Trust Preferred Capital Securities (representing 2,800,000 preferred securities at $25 per security). At the same time, $72,165,000 in aggregate principal amount of 8.125% Junior Subordinated Debentures, Series I, due 2036 were issued to the trust. For consolidated financial reporting purposes, the Debentures are eliminated in consolidation against the trust's investment in the Debentures. The preferred trust securities are subject to mandatory redemption upon payment of the Debentures at maturity or upon redemption. The Debentures are subject to redemption, in whole or in part at the option of the Company, at 100% of their principal amount plus accrued interest, after an initial period during which they may not be redeemed and at any time upon the occurrence of certain events.
In October 1996, the Company used part of the proceeds received from the trust to purchase and retire $32,087,500 of its $25 par value, 7.75% series preferred stock, and $31,295,200 of various series of its $100 par value preferred stock which had an average dividend rate of 5.68%. In December 1996, the Company used the balance of the proceeds and cash from short-term debt to fund the redemption of its entire 7.52% preferred stock series which had a total par value of $15,000,000.
II-34 •
DELMARVA POWER & LIGHT COMPANY
NOTES TO CONSOLIDATED FINANCIAL STATEMENTS-(Continued)
12. Cumulative Preferred Stock
The Company has $1, $25, and $100 par value per share preferred stock for which 10,000,000; 3,000,000; and 1,800,000 shares are authorized, respectively. No shares of the $1 par value per share preferred stock are outstanding. Shares outstanding for each series of the $25 and $100 par value per share preferred stock are listed below. Redemptions of preferred stock in 1996 are discussed in Note 11 to the Consolidated Financial Statements.
Current Redemption
Series Price
$25 per share par value 7% % ................. . (1) $100 per share par value
(1) Redeemable beginning September 30, 2002, at $25 per share. (2) Redeemable beginning November 1, 2003, at $100 per share. (3) Average rates were 5.5% during 1997 and 1996. (4) Average rates were 4.1 % during 1997 and 1996.
Substantially all utility plant of the Company is subject to the lien of the Mortgage and Deed of Trust collateralizing the Company's First Mortgage Bonds.
As of December 31, 1997, the Company had $200 million of bank lines of credit available for borrowing except for amounts supporting outstanding short-term debt. Two separate revolving credit facilities _aggregating to $500 million have been arranged for Conectiv effective on March 1, 1998. The Conectiv credit facilities are comprised of a $300 million credit facility which expires five years after becoming effective and a $200 million credit facility which expires one year after becoming effective. The Conectiv revolving credit facilities will replace the Company's and Atlantic's credit lines and certain other short-term credit facilities which existed as of December 31, 1997.
The weighted average interest rates on short-term debt outstanding as of December 31, 1997 and 1996 were 6.6% and 5.6%, respectively.
Maturities of long-term debt and sinking fund requirements during the next five years are as follows: 1998-$33.3 million; 1999-$35.7 million; 2000-$2.7 million; 2001-$3.6 million; 2002-$49.2 million.
In February 1997, the Company issued $124.2 million of unsecured Medium-Term Notes with maturities of 10 to 30 years and interest rates of 7.06% to 7.72%. The proceeds were used to refinance short-term debt. On the consolidated balance sheet as of December 31, 1996, $77.0 million of short-term debt was reclassified to
~ • long-term debt in order to recognize the amount of short-term debt which had been refinanced with Medium-, Term Notes.
II-35
DELMARVA POWER & LIGHT COMPANY
NOTES TO CONSOLIDATED FINANCIAL STATEMENTS-(Continued)
In September 1997, the Company redeemed $25 million of 63/s% First Mortgage Bonds at maturity through the issuance of short-term debt.
In October 1997, the Company initiated a public offering of up to $75 million of unsecured Medium-Term Notes. Through December 31, 1997, the Company had issued $42 million of unsecured Medium-Term Notes with maturities of 5 to 9 years and interest rates of 6.6% to 6.8%. The proceeds were used to refinance short-term debt.
In January 1998, the Company issued $33.0 million of 6.81 % unsecured Medium-Term Notes which mature in 20 years. The Company used $25.4 million of the proceeds to refinance short-term debt. In recognition of this refinancing $25.4 million of short-term debt has been reclassified to long-term debt on the consolidated balance sheet as of December 31, 1997.
Il-36
~.
~·
DELMARVA POWER & LIGHT COMPANY
NOTES TO CONSOLIDATED FINANCIAL STATEMENTS-(Continued)
Long-term debt outstanding as of December 31, 1997 and 1996 is presented below: Interest Rates Due 1997 1996
Total long-term debt and Variable Rate Demand Bonds $1,055,172 $989,033
(1) Repaid through monthly payments of principal and interest using a 15-year principal amortization, with the unpaid balance due in September 1999.
(2) Repaid through monthly payments of principal and interest over 15 years ending November 2002. (3) The Company's debt obligations included Variable Rate Demand Bonds (VRDB) in the amounts of $71.5
million as of December 31, 1997 and $85.0 million as of December 31, 1996. The VRDB are classified as current liabilities because the VRDB are due on demand by the bondholder. However, bonds submitted to the Company for purchase are remarketed by a remarketing agent on a best efforts basis. The Company expects that bonds submitted for purchase will continue to be remarketed successfully due to the Company's credit worthiness and the bonds' interest rates being set at market. The Company also may utilize one of the fixed rate/fixed term conversion options of the bonds. Thus, the Company considers the VRDB to be a source of long-term financing. The $71.5 million balance of VRDB outstanding as of December 31, 1997, matures in 2017 ($26 million), 2028 ($15.5 million), and 2029 ($30 million). Average annual interest rates on the VRDB were 3.8% in 1997 and 3.6% in 1996.
11-37
DELMARVA POWER & LIGHT COMPANY
NOTES TO CONSOLIDATED FINANCIAL STATEMENTS-(Continued)
14. Fair Value of Financial Instruments
The year-end fair values of certain financial instruments are listed below. The fair values were based on quoted market prices of the Company's securities or securities with similar characteristics.
Funds held by trustee .................................. . Company Obligated Mandatorily Redeemable Preferred
Securities of Subsidiary Trust Holding Solely Company Debentures ......................................... .
Long~ Term Debt ...................................... .
The Company's expected capital and acquisition expenditures are estimated to be approximately $187 million in 1998.
The Company has a 26-year agreement with Star Enterprise effective through May 2018, to purchase 48 MW of capacity supplied by the Delaware City Power Plant. By mutual agreement, the capacity portion of the contract has been suspended from October 1, 1996 until June 1, 2000. In conjunction with the COPCO acquisition, the Company agreed to purchase capacity and energy from PECO effective June 19, 1995, through May 31, 2006. The base amount of the capacity purchase, which is subject to certain possible adjustments, started at 205 MW, is currently 212 MW, and increases annually to 279 MW in 2006. The Company also has a contract with Electric Clearinghouse to purchase 100 MW of energy from January 1, 1998 to December 31, 2005. Under the terms of these agreements, the Company's expected cornrnitments for capacity and energy charges are as follows: 1998-$79.5 million; 1999-$87.4 million; 2000-$95.7 million; 2001-$99.2 million; 2002-$103.1 million; after 2002-$410.3 million; total-$875.2 million.
The Company's share of nuclear fuel at Peach Bottom and Salem is financed through a nuclear fuel energy contract, which is accounted for as a capital lease. Payments under the contract are based on the quantity of nuclear fuel burned by the plants. The Company's obligation under the contract is generally the net book value of the nuclear fuel financed, which was $31.0 million as of December 31, 1997.
The Company leases an 11.9% interest in the Merrill Creek Reservoir. The lease is considered an operating lease and payments over the remaining lease term, which ends in 2032, are $150.5 million in aggregate. The Company also has long-term leases for certain other facilities and equipment. Minimum cornrnitments as of December 31, 1997 under the Merrill Creek Reservoir lease _and all other noncancelable lease agreements (excluding payments under the nuclear fuel energy contract which cannot be reasonably estimated) are as follows: 1998-$6.7 million; 1999-$6.6 million; 2000-$5.4 million; 2001-$5.3 million; 2002-$4.6 million; after 2002-$133.9 million; total-$162.5 million. Approximately 93% of the minimum lease cornrnitments shown above are payments due under the Merrill Creek Reservoir lease.
II-38 • ----··
~·
DELMARVA POWER & LIGHT COMPANY
NOTES TO CONSOLIDATED FINANCIAL STATEMENTS-(Continued)
Rentals Charged To Operating Expenses
The following amounts were charged to operating expenses for rental payments under both capital and operating leases.
1997 1996 1995
(Dollars in Thousands)
Interest on capital leases ........................................ . $ 1,548 $ 1,628 $ 1,773 Amortization of capital leases .................................... . 6,499 5,653 8,044 Operating leases ............................................... . 11,590 13,795 13,619
$19,637 $21,076 $23,436
16. Pension Plan
The Company currently has a defined benefit pension plan covering all regular employees. The benefits are based on years of service and the employee's compensation. The Company's funding policy is to contribute each year the net periodic pension cost for that year; however, contributions have not been necessary during 1995-1997 due to the pension expense credit and the plans' funding status.
Based on fair values as of December 31, 1997, pension plan assets were comprised of the following: publicly traded equity securities ($466.5 million or 60%), U.S. government obligations ($121.5 million or 16%), and primarily investment grade corporate and other fixed income obligations ($183.3 million or 24%).
The following schedules show the funded status of the plan, the components of pension cost, and assumptions.
Effect of estimated future compensation increases .......................... .
Projected benefit obligation ............................................. . Plan assets at fair value ................................................ .
Excess of plan assets over projected benefit obligation ...................... . Unrecognized prior service cost ......................................... . Unrecognized net gain ................................................. . Unrecognized net transition asset ........................................ .
NOTES TO CONSOLIDATED FINANCIAL STATEMENTS-(Continued)
Components of Net Pension Cost 1997 1996 1995
(Dollars in Thousands)
Service cost-benefits earned during period ..................... . $ 12,779 $ 13,172 $ 9,719 30,654
(135,850) 83,981
Interest cost on projected benefit obligation .................... . Actual return on plan assets ................................. . Net amortization and deferral ................................ .
Net pension cost ........................................... .
Assumptions
Discount rates used to determine projected benefit obligation as of December 31 ............................................ .
Rates of increase in compensation levels ...................... . Expected long-term rates of return on assets ................... .
34,173 32,531 (115,982) (82,488)
46,869 22,164
$ (22,161) $ (14,621)
1997
7.00% 5.00% 9.00%
1996
7.50% 5.00% 9.00%
$ (11,496)
1995
7.00% 5.00% 8.75%
The Company maintains a 401(k) savings plan for its employees. The plan provides for employee contributions up to 15% of pay and for $0.50 in matching contributions by the Company for each dollar contributed up to 5% of employee pay. The Company's matching contributions charged to expense were $3.0 million in 1997, $2.4 million in 1996, and $2.3 million in 1995.
17. Postretirement Benefits Other Than Pensions •
The Company provides health-care and life insurance benefits to its retired employees and substantially all of the Company's employees may become eligible for these benefits upon retirement. The Company's policy is to fund its obligation to the extent that costs are reflected in customer rates, including amounts which are capitalized. Based on fair values as of December 31, 1997, the plan's assets consisted of $35.7 million (73%) of equity securities, including mutual funds and directly owned publicly traded securities, and $12.9 million (27%) of intermediate term investment grade bond mutual funds.
The following schedules show the funded status of the plan, the components of the cost of postretirement benefits other than pensions, and assumptions.
Reconciliation of Funded Status of the Plan
Accumulated postretirement benefit obligation (APBO) Active employees fully eligible for benefits ................................ . Other active employees ................................................ . Current retirees ....................................................... .
Plan assets at fair value ..................................................... .
APBO in excess of plan assets ............................................... . Unrecognized prior service cost .............................................. . Unrecognized net gain ..................................................... . Unrecognized transition obligation ........................................... .
Discount rates used to determine APBO as of December 31 7.00% 7.50% 7.00% Rates of increase in compensation levels ........................... . 5.00% 5.00% 5.00% Expected long-term rates of return on assets ........................ . 9.00% 9.00% 8.75% Health-care cost trend rate ....................................... . 7.50% 8.00% 10.50%
The health-care cost trend rate, or the expected rate of increase in health-care costs, is assumed to decrease to 7.0% in 1998 and gradually decrease to 5.4% by 2002. Increasing the health-care cost trend rates of future years by one percentage point would increase the accumulated postretirement benefit obligation by $5.1 million and would increase annual aggregate service and interest costs by $0.5 million.
18. Salem Nuclear Generating Station
The Company owns 7.41 % of the Salem Nuclear Generating Station (Salem), which consists of two pressurized water nuclear reactors operated by Public Service Electric & Gas Company (PSE&G). Salem Units 1 and 2 were removed from operation by PSE&G in the second quarter of 1995 due to operational problems, and maintenance and safety concerns. After receiving NRC authorization, PSE&G returned Unit 2 to service on August 30, 1997. Due to degradation of a significant number of tubes in the Unit 1 steam generators, PSE&G replaced the Unit 1 steam generators. The Company has been informed by PSE&G that the NRC's Readiness Assessment Team has concluded that Unit 1 is ready to return to operation. PSE&G expects Unit 1 will return to service in the second quarter of 1998, subject to final NRC approval.
In May 1997, the Company settled its lawsuit against PSE&G concerning Salem operations. Under the settlement's primary provision, PSE&G paid the Company $12 million in settlement of all claims related to the lawsuit. In August 1997, the DPSC approved a settlement regarding the ratemaking treatment of the PSE&G settlement payment and the replacement power costs attributable to the Salem outages. The DPSC settlement provided for recovery of approximately one-half of the replacement power costs from electric customers and retention of two-thirds of the PSE&G settlement payment by the Company's stockholders. Based on expected similar ratemaking treatment in other regulatory jurisdictions and the terms of these settlements, the Company charged $3 .1 million, net of the stockholder portion of the PSE&G settlement payment, to fuel expenses in 1997. In1996 and 1995, approximately $10.1 million and $4.l million, respectively, were charged to fuel expenses for replacement power costs and capacity deficiency charges owed to the Pennsylvania-New Jersey-Maryland (PJM) Interconnection. (Utilities which are parties to the PJM Interconnection agreement are required to pay capacity deficiency charges if capacity levels are lower than the level committed to by the PJM utility.) The aforementioned fuel-related expenses decreased earnings for 1997, 1996, and 1995 because these amounts were not expected to be recovered through customers' fuel rates. The Company also estimates that operation and
~ •. maintenance costs were higher than normal by $4 million, $9 million, and $5 million in 1997, 1996, and 1995, ~ respectively, because of the Salem outages.
11-41
DELMARVA POWER & LIGHT COMPANY
NOTES TO CONSOLIDATED FINANCIAL STATEMENTS-(Continued)
As previously reported, on February 27, 1996, the co-owners of Salem, including the Company, filed a complaint in the United States District Court for New Jersey against Westinghouse Electric Corporation (Westinghouse), the designer and manufacturer of the Salem steam generators. The complaint, which seeks to recover from Westinghouse the costs associated with and resulting from the cracks discovered in Salem's steam generators and with replacing such steam generators, alleges violations of federal and New Jersey Racketeer Influenced and Corrupt Organizations Acts, fraud, negligent misrepresentation and breach of contract. The estimated replacement cost of such generators is between $150 million and $170 million. On October 1, 1997, Westinghouse filed a motion for summary judgment. The parties argued the summary judgment motion and a decision on the motion is expected after March 1, 1998. No t1ial date has been set. The Company cannot predict the outcome of this lawsuit.
19. Contingencies
Environmental Matters
The Company is subject to regulation with respect to the environmental effects of its operations, including air and water quality control, solid and hazardous waste disposal, and limitation on land use by various federal, regional, state, and local authorities. The disposal of Company-generated hazardous substances can result in costs to clean up facilities found to be contaminated due to past disposal practices. Federal and state statutes authorize governmental agencies to compel responsible parties to clean up certain abandoned or uncontrolled hazardous waste sites. The Company is currently a potentially responsible party (PRP) at three federal superfund sites and is alleged to be a third-party contributor at three other federal superfund sites. The Company also has two former coal gasification sites in Delaware and one former coal gasification site in Maryland, each of which is a state superfund site. The Company's current liabilities included $2 million as of December 31, 1997 and 1996, respectively, for clean-up and other potential costs related to the federal and state superfund sites. The Company does not expect such future costs to have a material effect on the Company's financial position or results of operations.
Nuclear Insurance
In the event of an incident at any commercial nuclear power plant in the United States, the Company could be assessed for a portion of any third-party claims associated with the incident. Under the provisions of the Price Anderson Act, if third-party claims relating to such an incident exceed $200 million (the amount of primary insurance), the Company could be assessed up to $23.7 million for such third-party claims. In addition, Congress could impose a revenue-raising measure on the nuclear industry to pay such claims.
The co-owners of Peach Bottom and Salem maintain property insurance coverage in the aggregate amount of $2.8 billion for each unit for loss or damage to the units, including coverage for decontamination expense and premature decommissioning. The Company is self-insured, to the extent of its ownership interest, for its share of property losses in excess of insurance coverages. Under the terms of the various insurance agreements, the Company could be assessed up to $3.2 million in any policy year for losses incurred at nuclear plants insured by the insurance companies.
The Company is a member of an industry mutual insurance company, which provides replacement power cost coverage in the event of a major accidental outage at a nuclear power plant. The premium for this coverage is subject to retrospective assessment for adverse loss experience. The Company's present maximum share of any assessment is $1.3 million per year.
II-42
~·
DELMARVA POWER & LIGHT COMPANY
NOTES TO CONSOLIDATED FINANCIAL STATEMENTS-(Continued)
20. Nonutility Subsidiaries
The following presents summarized financial information about the Company's nonutility wholly owned subsidiaries. Common general and administrative costs are allocated to the Company's nonutility subsidiaries on the basis of cost causative factors. The Company's management believes the cost allocations are reasonable.
Excluding non-regulated energy sales conducted by operating divisions of the Company, as of December 31, 1997, the following three subsidiaries conducted substantially all of the Company's nonutility business: Conectiv Services, Inc., which provides HV AC sales, installation and services; Conectiv Communications, Inc., which provides local and long-distance phone service; and Delmarva Capital Investments, Inc. (DCI), which is involved in power plant operating services, real estate activities, and leveraged equipment leases. Delmarva Capital Investments, Inc. sold its landfill and waste-hauling operations in 1997 as discussed in Note 5 to the Consolidated Financial Statements.
Conectiv Services, Inc. . ............................... . Conectiv Communications, Inc. . ........................ . Delmarva Capital Investments, Inc. . ..................... .
1997 As of December 31, 1997
Operating Net Total Stockholders Revenues Income/(loss) Assets Equity
DCI's net income was $6.3 million in 1996 and $4.1 million in 1995. DCI's total assets were $101.1 million and $117.l million at December 31, 1996 and 1995, respectively. Conectiv Services, Inc. and Conectiv Communications, Inc. started operations in late 1996.
21. Segment Information
In 1997, the FASB issued SFAS No. 131, "Disclosure About Segments of an Enterprise and Related Information." SFAS No. 131 will supersede SFAS No. 14, "Financial Reporting for Segments of a Business Enterprise," and become effective for the Company's annual financial statements in 1998. Under SFAS No. 131, operating segments will be based on the manner in which management operates the business. The Company expects that its operating segments will be Conectiv Energy Delivery, Conectiv Energy Supply, and Conectiv Enterprises, as described in Management's Discussion and Analysis of Financial Condition and Results of Operations. In brief, the businesses of these operating segments are as follows: Conectiv Energy Supplyproduces and purchases energy, and sells bulk energy in competitive markets; Conectiv Energy Deliverydelivers energy to customers at regulated prices over transmission and distribution systems; Conectiv Enterprises-sells retail energy, HVAC services, local and long distance telephone service, and other services in competitive markets.
The operating segments presented below are based on the criteria of SFAS No. 14. For a description of the Electric, Gas, and Other Services' businesses, refer to Note 1 to the Consolidated Financial Statements. Under SFAS No. 131, the energy and delivery businesses embedded within both the Electric and Gas businesses will be unbundled and reported under Conectiv Energy Supply and Conectiv Energy Delivery, respectively. Unregulated retail electric and gas sales will be reported within Conectiv Enterprises. The businesses in Other Services will primarily be included in Conectiv Enterprises.
II-43
DELMARVA POWER & LIGHT COMPANY
NOTES TO CONSOLIDATED FINANCIAL STATEMENTS-(Continued)
Identifiable assets, net Electric ................................................... . $2,537,796 Gas ...................................................... . 250,596 Other Services ............................................. . 161,432 Unallocated ............................................... . 65,657
Total ................................................... . $3,015,481
II-44
$ 137,886 20,874 10,252
$ 169,012
$2,490,212 217,586 135,482
88,575
$2,931,855
$ 120,535 17,145 5,153
$ 142,833
$2,493,797 189,339 119,098 64,451
$2,866,685
••
DELMARVA POWER & LIGHT COMPANY
NOTES TO CONSOLIDATED FINANCIAL STATEMENTS-(Continued)
22. Quarterly Financial Information (Unaudited)
The quarterly data presented below reflect all adjustments necessary in the opinion of the Company for a fair presentation of the interim results. Quarterly data normally vary seasonally because of . temperature variations, differences between summer and winter rates, the timing of rate orders, and the scheduled downtime and maintenance of electric generating units.
As discussed in Note 5 to the Consolidated Financial Statements, in the fourth quarter of 1997, net income was increased by $13.7 million ($0.22 per average common share) due to the sale of the Pine Grove Landfill and its related waste-hauling company.
Applicable Average Quarter Operating Operating Net to Common Shares Ended Revenue Income Income Stock Outstanding
(Dollars in Thousands) (In Thousands)
1997 March 31 ....................... $ 346,079 $ 63,150 $ 25,793 $ 24,578 60,856 June 30 ......................... 310,968 51,376 17,997 16,913 61,177 September 30 .................... 400,502 85,509 39,411 38,319 61,247 December 31 .................... 365,953 34,394 22,508 21,408 61,207
$1,423,502 $234,429 $105,709 $101,218 61,122 --
1996 March 31 ....................... $ 308,619 $ 75,620 $ 35,143 $ 32,703 60,759 June 30 ......................... 267,783 52,316 22,325 19,902 60,703 September 30 .................... 308,340 77,536 37,035 34,605 60,667 December 31 .................... 290,833 51,828 21,684 20,041 60,665
$1,175,575 $257,300 $116,187 $107,251 60,698 --
Item 9. Changes in and Disagreements with Accountants on Accounting and Financial Disclosure
None .
Il-45
Earnings per
Average Share
$0.40 0.28 0.63 0.35 --$1.66
$0.54 0.33 0.57 0.33 --$1.77
[THIS PAGE INTENTIONALLY LEFT BLANK]
PART III
Item 10. Directors and Executive Officers of the Registrant
Directors
The following were the Directors of the Company on February 28, 1998, prior to consummation of the Merger:
Class I Directors with Terms Expiring in 2000-
R. Franklin Balotti, age 55. Director since 1995. Member of the law firm of Richards Layton & Finger, Wilmington, Delaware. Mr. Balotti is a past President of the Delaware Bar Association and serves as a member of the Board of Overseers of Widener University School of Law.
Michael B. Emery, age 59. Director since 1994. Retired, Former Senior Vice President of E.I. duPont deNemours & Company (a diversified chemical, energy, and specialty products company), Wilmington, Delaware. Mr. Emery serves as Chairperson of the Development Council of Delaware Technical and Community College.
Sarah I. Gore, age 62. Director since 1990. Human Resources Associate, W. L. Gore & Associates, Inc. (a high technology manufacturing company), Newark, Delaware. Member of the Delaware Advisory Board of CoreStates Bank, Wilmington, Delaware. Mrs. Gore and her family created the I Have a Dream Foundation of Delaware for which she serves as a director.
Class II Directors with Terms Expiring in 1998-
Howard E. Cosgrove, age 54. Director since 1986. Chairman, President and Chief Executive Officer of the Company. Mr. Cosgrove also is a director of the Federal Reserve Bank of Philadelphia and is a Trustee of The University of Delaware.
Audrey K. Doberstein, age 65. Director since 1992. President of Wilmington College, New Castle, Delaware. Director of Mellon Bank Delaware (N.A.), Wilmington, Delaware. Dr. Doberstein also serves as a member of the Board of Directors of Blue Cross/Blue Shield of Delaware.
James C. Johnson, age 62. Director since 1992. Retired, Former President and Chief Executive Officer of Loyola Federal Savings Bank, Baltimore, Maryland. Mr. Johnson is a member of the Board of Directors of the Chesapeake Bay Trust.
Weston E. Nellius, age 61. Director since 1995. President, Nellius Management Associates, Inc. (an information technology, financial, management and government relations consulting firm), Dover, Delaware. Director of Nations Bank of Delaware (N.A.), Dover, Delaware. Mr. Nellius also serves as a member of the Board of Directors of The Delaware Family Foundation and the Board of the Delaware Region of the National Conference of Christians and Jews.
Class HI Directors with Terms Expiring in 1999-
Michael G. Abercrombie, age 58. Director since 1993. President of Cato, Inc. (a petroleum distributorship), Salisbury, Maryland. Mr. Abercrombie is a past President of The Community Foundation of the Eastern Shore and is a past Chairman of the Greater Salisbury Committee.
Robert D. Burris, age 53. Director since 1993. President of Burris Foods, Inc. (a refrigerated food ~ • distribution company), Milford, Delaware. Mr. Burris also is a director of the Federal Reserve Bank of , Philadelphia and is a member of the Board of BayHealth, Inc.
III-1
Executives
Information about the executive officers of the registrant is included under Item 1.
Item 11. Executive Compensation
The summary compensation table below (along with important explanatory notes on the next page) provides information about salary and other compensation. Following the summary compensation table are tables about long-term incentive plan awards and pension benefits, a performance graph that compares the Company's common stockholder return to both the S&P 500 Index and the Dow Jones Electric Utilities Index, and a report by the Compensation Committee about executive compensation.
SUMMARY COMPENSATION TABLE
Long Term Compensation
Annual Compensation Awards Payouts
Other All Annual Restricted Securities Other Comp- Stock Underlying LTIP Comp-
ensation Award(s) Options Payouts ensation Name and Principal Position Year Salary($) Bonus($) $ $(1) (#) ($) ($)(2)
H. E. Cosgrove Chairman of the Board, 1997 400,000 0 0 0 0 0 18,981 President and Chief 1996 400,000 0 0 0 0 0 18,115 Executive Officer 1995 345,000 73,500 0 0 0 0 19,498
T. S. Shaw Executive Vice President 1997 219,249 27,100 0 0 0 0 6,563 1996 180,000 52,300 0 0 0 0 6,333 1995 165,000 34,400 0 0 0 0 8,179
B. S. Graham Senior Vice President and 1997 184,000 27,100 0 0 0 0 3,390 Chief Financial Officer 1996 180,000 92,300 0 0 0 0 5,529
1995 165,000 33,500 0 0 0 0 6,793 J. W. Ford (3) Senior Vice President 1997 184,000 23,400 0 0 0 0 3,960
R. E. Klesius Senior Vice President 1997 168,000 24,700 0 0 0 0 4,792 1996 165,000 24,600 0 0 0 0 5,994 1995 157,000 31,100 0 0 0 0 7,978
# Number of units $-Dollar amounts (1) Dividends on shares of performance-based restricted stock are accrued at the same rate as that paid to all holders of Common Stock.
Restricted stock awards are reported in the Long-Term Incentive Plan Table on page III-4. As of December 31, 1997: Mr. Cosgrove held 62,750 shares of restricted stock with a value of $1,275,606.25 (6,070, 11,570, 9,590, and 35,520 shares with a grant-date market price of $22.00, $19.50, $22.875, and $19.625 per share respectively); Mr. Shaw held 14,810 shares of restricted stock with a value of $301,878.75 (1,350, 2,870, 2,580, and 8,010 shares with a grant-date market price of $22.00, $19.50, $22.875, and $19.625 per share respectively); Mrs. Graham held 14,530 shares of restricted stock with a value of $295,718.75 (1,070, 2,870, 2,580, and 8,010 with a grant-date market price of $22.00, $19.50, $22.875, and $19.625 respectively); Mr. Ford held 13,460 shares of restricted stock with a value of $272,178.75 (2,870, 2,580 and 8,010 shares with a grant-date market price of $19.50, $22.785, and $19.625 per share respectively); and Mr. Klesius held 14,070 shares of restricted stock with a value of $287,356.25 (1,350, 2,870, 2,580, and 7,270 shares with a grant-date market price of $22.00, $19.50, $22.875, and $19.625 per share respectively). During 1997, all the shares granted in 1993 were forfeited because the Company's Total Stockholder Return was 65th out of 87 companies in its Peer Group over the four-year performance period.
(2) The amounts of All Other Compensation for each of the named executive officers for fiscal year 1997 include the following: for Mr. Cosgrove, $2,083 in Company matching contributions to the Company's Savings & Thrift Plan, and $16,688 in Company matching contributions under the Company's Deferred Compensation Plan Thrift Fund; for Mr. Shaw, $2,458 in Company matching contributions to the Company's Savings & Thrift Plan, and $3,895 in Company matching contributions under the Company's Deferred Compensation Plan Thrift Fund; for Mrs. Graham, $2,483 in Company matching contributions to the Company's Savings & Thrift Plan, and $697 in Company matching contributions under the Company's Deferred Compensation Plan Thrift Fund; for Mr. Ford, $3,750 in Company matching contributions to the Company's Savings & Thrift Plan; and for Mr. Klesius, $2,444 in Company matching contributions to the Company's Savings & Thrift Plan, and $2,138 in Company matching contributions under the Company's Deferred Compensation Plan Thrift Fund. In addition, the amounts of All Other Compensation for each of the five named executive officers includes $210 in term life insurance premiums paid by the Company on such officer's behalf (which insurance is provided on an equal basis to all employees of the Company).
(3) Mr. Ford joined the Company on March 13, 1995.
III-2
• --
Option Exercises During 1997 and Year-End Option Values
The following table provides information related to options held by the named executive officers at fiscal year-end 1997. The Board of Directors, at its January 1993 meeting, approved an amendment to the Company's Long-Term Incentive Plan eliminating awards of Common Stock options and dividend rights effective fiscal year 1993. The Company does not grant stock appreciation rights.
AGGREGATED OPTION EXERCISES IN LAST FISCAL YEAR AND FY-END OPTION VALUES
Name
H. E. Cosgrove ............... ~ .......... . T. S. Shaw .............................. . B. S. Graham ........................... . J. W. Ford .............................. . R. E. Klesius ............................ .
Shares Acquired on Exercise (#)
Value Realized ($)(*)
Number of Securities
Underlying Unexercised Options at FY-End(#)
Exercisable
14,400
4,400
Value of tJnexercised
In-the-Money Options at FY-End($)
Exercisable(*)
$30,525
8,950
(*) The closing price for the Company's Common Stock as reported by the New York Stock Exchange on December 31, 1997, was $23.0625. The value is calculated on the basis of the difference between the exercise price of the options and $23.0625, which difference is multiplied by the number of options. For Mr. Cosgrove, 8,500 of the exercisable options have an exercise price of $21.25, and 5,900 have an exercise price of $20.50. For Mr. Klesius, 3,100 of the exercisable options have an exercise price of $21.25, and 1,300 have an exercise price of $20.50. The options all are exercisable currently. No options were exercised in 1997 by the named executive officers .
III-3
Performance-based Restricted Stock Grants Chart
The following table shows the number of shares of performance-based restricted stock that were granted to the named executive officers as part of the Company's Long-Term Incentive Plan in 1997. It also shows the number of shares of Common Stock that would be awarded if the threshold, target or maximum performance is achieved at the end of the four-year performance period.
LONG-TERM INCENTIVE PLANS AWARDS IN LAST FISCAL YEAR
Estimated Future
Number of Payouts under Non-Stock
Shares, Units or Performance or Price-Based Plans
Other Rights Other Period Until Threshold Target Maximum Name (#)(*) Maturation or Payout (#) (#) (#)
H. E. Cosgrove . . . . . . . . . . . . . . . . . 35,520 4 yrs . 8,880 35,520 53,280 T. S. Shaw ..................... 8,010 4 yrs. 2,003 8,010 12,015 B. S. Graham ................... 8,010 4 yrs. 2,003 8,010 12,015 J. W. Ford ..................... 8,010 4 yrs. 2,003 8,010 12,015 R. E. Klesius ................... 7,270 4 yrs. 1,818 7,270 10,905
(*) Shares of performance-based restricted stock were granted as a part of the Company's Long-Term Incentive Plan. Actual awards are made after the end of a four-year performance cycle and are based on a comparison of the combination of the Company's performance prior to the Merger, and Conectiv's performance after the Merger, as measured by Total Stockholder Return (stock appreciation and dividends paid), to the Peer Group. The target number of shares (100% of the shares originally granted) will be awarded if the Total Stockholder Return (four year cumulative as compared to the Peer Group) is in the 55th percentile (up to 149.9% to be awarded for Total Stockholder Return up to the 84.9th percentile). The threshold number of shares (25% of the shares originally granted) will be awarded if the Total Stockholder Return (four year cumulative as compared to the Peer Group) is in the 40th percentile (up to 99.9% to be awarded for Total Stockholder Return up to the 54.9th percentile). The maximum number of shares (150% of the shares originally granted) will be awarded if the Total Stockholder Return (four year cumulative as compared to the Peer Group) is in the 85th percentile or greater. The actual percentage of the originally granted shares to be awarded will be determined by interpolation of a straight line within the percentile ranges.
III-4
;. Retirement Plan
Average Annual Earnings for the 5
PENSION PLAN TABLE
Annual Retirement Benefits to Persons in Specified Remuneration and Years of Service Classifications
Consecutive Years Credited Years of Service of Earnings that result in the 15 20 25 30
(1) Represents reduced early retirement benefit payable at age 55.
35 Yrs.
$ 66,732 108,732 164,732(3) 220,732(3) 276,732(3)
(2) Effective January 1, 1998, annual compensation recognized in computing Average Annual Earnings under the Retirement Plan may not exceed $160,000 as limited by Section 401(a)(17) of the Internal Revenue Code of 1986, as amended (the "Internal Revenue Code"). With the exception of this limitation, and the exclusion of compensation paid under the Company's Long-Term Incentive Plan and Company contributions under the Savings & Thrift Plan and Supplemental Executive Retirement Plan ("SERP"), Average Annual Earnings include substantially all cash compensation shown in the Summary Compensation Table on page III-2. Compensation in excess of the limitation of Section 401(a)(l 7) is recognized in computing the benefit payable under the SERP.
(3) For 1998, the limit on annual benefits payable under qualified, defined benefit plans is $130,000. The amount in excess of $130,000 in the above table would be payable under the Company's SERP.
The Company has a trusteed, noncontributory Retirement Plan covering all regular employees. Directors who are not employees of the Company do not participate in the Plan. Subject to the maximum limitation on benefits imposed by Section 415(b) of the Internal Revenue Code, the Retirement Plan provides management employees, including all officers, a retirement income equal to years of service times the sum of (1) plus (2) where (1) is 1.30% of the Average Annual Earnings (for the five consecutive years of earnings that result in the highest annual average) up to the Average Social Security Earnings Base ($31,128 in 1998), and where (2) is 1.60% of such Average Annual Earnings above the Average Social Security Earnings Base. Effective January 1, 1996, a second formula was added (i.e., 1.50% of Average Annual Earnings times years of service). Management employees will receive a pension computed under this second formula if it results in a greater pension amount. Normal retirement is age 65; however, employees may retire as early as age 55 with an actuarial reduction in benefits and also at age 60 without such reduction, provided they have completed the requisite number of years of service with the Company. Aside from the integration feature of the above-described benefit formula, retirement benefits are not subject to any reduction for Social Security benefits or other offset amounts.
Annual benefits payable upon retirement will be in the form of a joint and 50% survivor annuity for married individuals and a straight life annuity for single individuals. Both the straight life and joint and survivor forms are paid to management employees in specified remuneration and years of service classifications, as illustrated in the Pension Plan Table.
Mr. Cosgrove, Mrs. Graham, and Messrs. Shaw, Ford and Klesius have, respectively, 31, 14, 26, 3 and ·32 credited years of service under the Company's Retirement Plan.
III-5
In the event of a change in control of the Company, as defined in the Retirement Plan, the Plan's surplus assets are to be allocated to the extent available to (1) satisfy all Plan liabilities, (2) fund certain post-retirement medical benefits and death benefits and (3) subject to certain limitations, increase the benefits payable to employees who were active participants on the date of such change in control by crediting each such participant with an additional five years of deemed credited service and five years of deemed salary increases at 5% per year. If the Plan is terminated or merged or benefits are reduced within five years of such change in control, any remaining surplus assets would be allocated to the extent available to (1) provide a 2% cost of living increase for retirees for each year of retirement and (2) subject to certain limitations, increase the benefits payable to employees who were active participants on the date of such termination, merger or benefit curtailment by crediting each such participant with additional years of deemed credited service for the ten-year period following such change in control together with salary increases at 5% per year for such period. The Retirement Plan requires that the obligations described above that are assumed following such a change in control must be funded by the purchase of a guaranteed annuity contract.
Directors' Compensation
Directors who are not officers of the Company receive an annual retainer of $12,000, plus $700 for each Board meeting attended and $600 for each Committee of the Board meeting attended. Chairpersons of the Audit, Compensation, and Nuclear Oversight Committees receive an additional annual retainer of $1,000. There have been no changes in the amounts of Directors' compensation since May 1, 1992. Beginning on June 1, 1997, the $12,000 annual retainer paid to each Director and the $1,000 annual retainer paid to Chairpersons of the Committees previously mentioned were paid in Common Stock of the Company.
Severance Agreements and Other Provisions Relating to Possible Change of Control
The Company has entered into severance agreements with each of the five named executive officers. The severance agreements are intended to encourage the continued dedication of members of the Company's management. These agreements provide potential benefits for such persons upon actual or constructive termination of employment (other than for cause) following a change of control of the Company, as defined in such agreements. Each affected employee would receive a severance payment equal to 2.99 times base salary (as defined in Section 280G of the Internal Revenue Code), and entitlement to Company-paid life, disability, medical and dental benefits for 24 months following termination, as well as an amount in cash equal to the actuarial equivalent value of accrued retirement pension credits equal to 24 months following termination; provided, however, that if any payments under such agreements would not be deductible by the Company as a result of Section 280G of the Internal Revenue Code, the amounts payable under such agreements will be reduced until the entire payment is deductible. The Merger comes within the definition of "change of control" under the severance agreements. Mr. Ford has terminated employment in connection with the Merger, and has received the severance payment and will receive the other benefits under the severance agreement. Although Mr. Klesius will remain with Conectiv for a transition period, he also has terminated employment in connection with the Merger, and will receive both the severance payment and the other benefits under the severance agreement.
The Company has the following additional benefit plans containing ''change in control'' provisions. These plans, for which the five named executive officers are eligible, were established by the Board of Directors. In the event of a change in control: The SERP provides for the Company to satisfy the liabilities accrued under the SERP through the purchase of fully-paid annuity or life insurance contracts; the Company's Management Incentive Compensation Plan provides that, at the option of the participant, the Company will pay all Incentive Awards earned but not distributed; the Company's Management Life Insurance Plan provides for the Company to prepay all premiums to any life insurance policy under this Insurance Plan; and the Company's Long-Term Incentive Plan provides that all restrictions on shares of performance-based restricted stock will lapse immediately, without regard to performance criterion, and shares will be issued to all participants, and all dividends in each Dividend Rights Account will be paid or, at the employee's option, the ongoing obligation to make such payments will continue. Mr. Ford has terminated employment in connection with the Merger, and has received the severance payment. He also will receive the other benefits under his severance agreement and the
III-6
-------
I
•
benefit plans described above. Although Mr. K.lesius will remain with Conectiv for a transition period, he also has terminated employment in connection with the Merger, and will receive the severance payment, the other benefits under his severance agreement and the benefit plans mentioned above.
Board Compensation Committee Report
DELMARVA POWER & LIGHT COMPANY BOARD COMPENSATION COMMITTEE REPORT
PRINCIPLES OF EXECUTIVE COMPENSATION PROGRAM
Overall Objectives
This will be the last Board Compensation Committee Report for the Company. Effective March 1, 1998, a series of merger transactions were consummated, involving the Company and Atlantic Energy, Inc. (the "Merger"). A new holding company, named Conectiv, was formed as a result of the Merger, and the shares of the Company's Common Stock were exchanged for shares of Conectiv common stock. The next Compensation Committee Report will be contained in the 1999 proxy statement for Conectiv.
The Company's executive compensation program was designed to motivate its senior executives to achieve the Company's goals of providing the Company's stockholders with a competitive return on their investment and its customers with high quality service at a competitive price.
Toward that end, the Company's program was designed to provide total compensation that emphasizes long-term performance which increases stockholder value and reflects market conditions for executive talent. This program has included the following elements:
• Long-term incentive compensation based on long-term performance which increases stockholder value;
• Annual incentive compensation that varies based on corporate and individual performance; and
• Base salary levels related to position and individual performance.
In its role as administrator of the executive compensation program, the Compensation Committee has placed particular emphasis on long-term compensation as a critical element of total compensation. The Compensation Committee's objective has always been to provide incentives which have a direct link to increased stockholder value.
Total Compensation
Total compensation (base salary, annual incentive, and long-term incentive) opportunities were developed for Company executives utilizing the Edison Electric Institute ("EEi") Executive Compensation Survey Report and other general competitive industry surveys, as well as counsel with the Company's outside consulting firm, Towers Perrin. In general, the total compensation structure for executives was targeted to the median of a blend of utility and general competitive industry peers contained in the EEi Executive Compensation Survey Report (the "Peer Group")1 and other general competitive industry surveys with individual reward levels varying based on contribution and performance. The targets for each component of the executive compensation program have been reviewed on an annual basis to ensure alignment with the Company's compensation philosophy and to ensure a proper balance between short- and long-term objectives. Annual base salary increases reflect the individual's performance and contribution over several years in addition to the results for a single year. Year-toyear changes in annual incentive awards have varied with the performance results of the individual as well as
1 The compensation Peer Group includes some, but not all, of the same companies as the published industry index in the Comparison of Five Year Cumulative Total Return graph included in this Proxy Statement.
III-7
L
the Company. The Company's base salary level for the five named executive officers as a group was below the. median of the salary levels defined by the Peer Group.
The Company has examined the IRS regulation pertaining to the $1,000,000 compensation deductibility cap for each of the five named executive officers and has determined that the regulation is not applicable to the Company, since the total compensation for any one individual is significantly below the cap.
Annual Incentive Compensation
The Company's Management Incentive Compensation Plan was designed to motivate part1c1pants to accomplish stretch financial and individual goals. The corporate financial goals relate to both customer and stockholder measurements. Two criteria must be met before there were any awards under this plan: (1) at least half of specified corporate goals must have been met; and (2) actual earnings per share ("EPS") for the year must have met or exceeded 95% of the Company's EPS goal.
The awards, upon satisfaction of these criteria, contained two components: corporate performance and individual performance. For the senior executives, award targets for both performance components were set annually by the Compensation Committee and have varied among individuals. Approximately 75% of the maximum incentive opportunity for the Company's senior executives, including those named in the compensation tables in this Proxy Statement, arose out of corporate performance, which was measured by (1) the Company's EPS as compared with the Company's EPS goal, and (2) the Company's net change in electric rates per kilowatt hour as compared against the net change in the electric rates of the average of a regional survey2 over a three-year period. Generally, the payout in connection with corporate performance was determined in the following manner. The base multiplier of 1.00 was adjusted at year-end based upon corporate performance. This adjustment could not exceed 150% and was based upon the EPS and Rates performance at the corporate level. EPS Adjustment: If actual EPS was higher than the goal, the multiplier was increased by 5% for each 1 % above the goal. If actual EPS was lower than the goal, the multiplier was decreased by 20% for each 1 % below the goal. Rates Adjustment: If the Company's rates decreased more, or increased less, than the regional survey average, the multiplier was increased by 5% for each 1 % positive deviation. If the Company's rates increased more, or decreased less, than the regional survey average, the decrease was 2% for each 1 % negative deviation.
The remaining approximately 25% of the maximum incentive opportunity for senior executives arose out of individual performance, with a particular focus on achievement of individual goals, as evaluated at each year-end merit review.
Long-Term Incentive Compensation
The Company's Long-Term Incentive Plan has reinforced the importance of providing investors with a competitive return on their investment. Awards granted under this Plan in 1997 consisted entirely of shares of performance-based restricted stock. Participants in the Plan were granted shares of the Company's stock, subject to forfeiture if performance criteria are not met over a four-year performance period. After the end of the fouryear performance cycle, a combination of the Company's performance prior to the Merger, and Conectiv's performance after the Merger, as measured by Total Stockholder Return (stock appreciation and dividends paid), will be compared to the Peer Group to determine the number of shares of unrestricted Conectiv common stock to be paid out to participants. Upon consummation of the Merger, the restricted Common Stock of the Company held in the Long-Term Incentive Plan were converted to shares of Conectiv common stock, as required by the merger agreement. For grants made under the Plan in prior years, for which the performance cycle had not yet run (1995 and 1996 grants), 100% of the shares originally granted were awarded as unrestricted shares of Company Common Stock upon consummation of the Merger, pursuant to the "change in control provisions"
2 The regional survey includes some, but not all, of the same companies as the Peer Group and the published industry index in the Comparison of Five Year Cumulative Total Return graph included in this Proxy Statement.
III-8
--
,,
••
contained in the Plan. The grants made in 1993 and 1994 did not meet the performance criteria and were forfeited.
For the 1997 grants, the following amounts of shares of Conectiv common stock will be awarded at the end of the four-year performance cycle if the combination of the Total Stockholder Return for the Company prior to the Merger, and Conectiv after the Merger, over the four-year cycle as compared to the Peer Group falls in the following percentile ranges: no award for Total Stockholder Return less than the 40th percentile; 25%-99.9% of the shares originally granted for Total Stockholder Return in the 40th percentile to the 54.9th percentile; 100% -149.9% of the shares originally granted for Total Stockholder Return in the 55th percentile to the 84.9th percentile; and 150% of the shares originally granted for Total Stockholder Return in the 85th percentile or greater. The actual percentage of the originally granted shares to be awarded will be determined by interpolation cif a straight line within the percentile ranges.
SUMMARY OF ACTIONS TAKEN BY THE COMPENSATION COMMITTEE
The Compensation Committee of the Company, which has consisted entirely of outside directors, has reviewed and approved each of the transactions with the Company's officers under the Company's executive compensation plans, and has assessed the effectiveness of the program as a whole. This included activities such as reviewing the design of the Company's various incentive plans and assessing the reasonableness of the overall executive compensation program.
In addition, the Committee has administered key aspects of the Company's salary program and incentive plans, such as approving the annual salary increase budget, setting the targets used in the annual incentive plan, approving the size of the annual incentive pool and approving the grants under the annual and long-term incentive plans. With respect to the annual incentive pool, individual awards were not limited by the size of the total pool, but were limited to maximum amounts annually determined by the Compensation Committee. For 1997 performance, within the senior executive group, these maximum amounts have varied among individuals.
Finally, the Committee has implemented the Company's executive compensation program, which includes the Chief Executive Officer and the Company's four other most highly-compensated executives-i.e., the five "named executive officers."
Significant actions by the Committee for fiscal year 1997 included setting salaries and reviewing criteria for and approving the grants of annual incentive awards and long-term incentive opportunities. For 1997, total compensation opportunities for the named executive officers were consistent with the compensation levels in the evolving utility and general industry markets for executive talent. The Committee believes these compensation levels to be appropriate, since having the ability to attract and retain high-quality executives from both within and outside the utility industry is increasingly important in an environment where competition is increasing and predicted to become more intense. In 1997, the Compensation Committee made its senior management team's compensation opportunities more sensitive to the long-term performance of the Company (and Conectiv, after the Merger) and increased value to the Company's and Conectiv's stockholders. The Committee'·s purpose in doing so was to keep management interests in line with the long-term stockholder interests. Accordingly, more of the total compensation of the Company's management team was granted in the form of incentive awards tied to long-term corporate performance. The targets to achieve those incentives were also set at higher levels than in the past.3 Thus, the potential for reward at the end of the four-year performance cycle is greater, but higher levels of performance, measured based on the Company's performance prior to the Merger, and Conectiv' s performance
3 The only exception is that the target for the maximum level was decreased from 90% to 85%. The 90% target had proven unrealistic based on an evaluation of the companies that have achieved this level of performance. Most of these companies have had an extraordinary event over the performance cycle which enabled them to reach the maximum target level. The 85% level still represents a significant challenge but has the potential to be achieved, while ensuring that management's interests continue to be aligned with stockholders.
III-9
thereafter, will be required to achieve that potential. Consistent with the intention to tie more compensation opportunity to long-term corporate performance, the base salaries for the senior management team were increased slightly, with lower annual incentive awards than in the past.
CHIEF EXECUTIVE OFFICER COMPENSATION
Salary Action
Chief Executive Officer, Howard E. Cosgrove's salary remained the same as in 1996, at $400,000. This salary placed Mr. Cosgrove at approximately 97% of the median for Chief Executive Officers in comparablysized utilities.
Consistent with the Compensation Committee's goal to tie more of its executives' total compensation opportunity to corporate performance, the Compensation Committee decided to freeze Mr. Cosgrove's base salary for the 1997 fiscal year and not to grant any annual incentive award. This decision was not intended as a negative reflection on Mr. Cosgrove's performance. On the contrary, the Committee commends Mr. Cosgrove's leadership and supports the direction the Company is taking in this increasingly competitive and uncertain environment. As an expression of confidence in Mr. Cosgrove's ability to drive the Company's, and now Conectiv's, success in the long term, increases in Mr. Cosgrove's total compensation will be earned in long-term incentives which are tied to the Company's and Conectiv's long-term performance.
Annual Incentive Award
In lieu of an annual incentive award, a greater long-term incentive opportunity was granted to Mr. Cosgrove in 1997 than otherwise would have been granted, to allow Mr. Cosgrove to share in corporate success if stockholder value is increased through better long-term corporate performance.
Long-Term Iricentive Plan
Long-term incentive grants represent an increasingly important component of the compensation opportunity for the Chief Executive Officer. Consistent with the Company's Long-Term Incentive Plan, the Committee determined the 1997 grants of performance-based restricted stock (reflected in the compensation tables contained in this Proxy Statement) made to Mr. Cosgrove. The initial award of performance-based restricted stock is targeted at providing total compensation, including a long-term opportunity, consistent with similar awards made to other executives from the Peer Group. The number of shares actually earned, if any, will be awarded in the year 2001 based on a comparison of the combination of the Company's performance prior to the Merger, and Conectiv's performance thereafter, as measured by Total Stockholder Return compared to the Peer Group over the four-year period 1997-2000, as discussed under "Long-Term Incentive Compensation" on page III-8. As discussed above, Mr. Cosgrove's 1997 base salary was not increased and he received no annual incentive award; instead, all of Mr. Cosgrove's- opportunity to increase his total compensation in 1997 was in the form of longterm incentives tied to corporate performance over the four-year period.
COMPENSATION COMMITTEE INTERLOCKS AND INSIDER PARTICIPATION
The Compensation Committee is comprised solely of non-officer directors. There are no Compensation Committee interlocks.
COMPENSATION COMMITTEE
S. I. Gore, Chairperson M. B. Emery J. C. Johnson
III-10
,,
4
COMPARISON OF FIVE YEAR CUMULATIVE TOTAL RETURN* AMONG DELMARVA POWER & LIGHT COMPANY, THE S & P 500 INDEX
DELMARVA POWER & LIGHT COMPANY S & P 500 DOW JONES ELECTRIC UTILITIES • -J&-. ···•···
* $100 INVESTED ON 12/31/92 IN STOCK OR INDEXINCLUDING REINVESTMENT OF DIVIDENDS. FISCAL YEAR ENDING DECEMBER 31.
III-11
Item 12. Security Ownership of Certain Beneficial Owners and Management
Security Ownership of Directors and Executive Officers as of December 31, 1997:
Directors Class I Directors with Terms Expiring in 2000-
R. Franklin Balotti ......................................................... . Michael B. Emery ......................................................... . Sarah I. Gore ............................................................. .
Class II Directors with Terms Expiring in 1998-Howard E. Cosgrove ....................................................... . Audrey K. Doberstein ...................................................... . James C. Johnson .......................................................... . Weston E. Nellius ......................................................... .
Class III Directors with Terms Expiring in 1999-Michael G. Abercrombie .................................................... . Robert D. Burris .......................................................... .
Other Executive Officers Barbara S. Graham ........................................................ . Thomas S. Shaw .......................................................... . Joseph W. Ford ........................................................... . Ralph E. Klesius .......................................................... .
Shares of Common Stock(1)(2)
1,894 1,728 1,753
79,703(3)(4) 1,728 1,809 1,228
1,789(5) 1,195
18,493(3) 21,293(3) 13,863(3) 22,329(3)(4)
As of December 31, 1997, all current executive officers and directors as a group (14 persons) owned beneficially 168,805 shares of Common Stock, representing 0.27% of the shares of Common Stock outstanding.
(1) Each of the individuals listed beneficially owned less than 1 % of the Company's outstanding common stock.
(2) Includes shares owned beneficially by Mr. Cosgrove and Other Executive Officers of the Company pursuant to the Company's Savings & Thrift Plan, Payroll-Based Employee Stock Ownership Plan, and Deferred Compensation Plan Thrift Fund.
(3) Includes 62,750, 14,530, 14,810, 13,460, and 14,070 shares, of performance-based restricted stock for Mr. Cosgrove, Mrs. Graham, and Messrs. Shaw, Ford and Klesius respectively, which were granted as a part of the Compani s Long-Term Incentive Plan. The number of shares actually earned will depend on the Company's performance, as measured by Total Stockholder Return (stock appreciation and dividends paid), relative to the Peer Group at the end of a four-year period.
(4) Does not include 14,400 and 4,400 shares of Common Stock which Messrs. Cosgrove and Klesius respectively, are deemed to have beneficial ownership. These shares may be acquired upon the exercise of stock options granted under the Company's Long-Term Incentive Plan.
(5) Does not include 300 shares of Common Stock owned by Mr. Abercrombie's wife, beneficial ownership of which he disclaims.
III-12
,,,
· • Security Ownership Of Certain Beneficial Owners .
The following table provides information with respect to the only person who is known to Delmarva Power & Light Company to be the beneficial owner of more than 5% of the outstanding shares of Common Stock of the Company.
Name and Address of
Beneficial Owner
Franklin Resources, Inc ......................................... . 777 Mariners Island Boulevard P.O. Box 7777 San Mateo, California 94403
Shares Beneficially Owned(l)
5,801,750
Percent of Class
9.5%
(1) The share ownership shown above is based on Amendment No. 5 to a Form 13G, dated January 16, 1998 filed with the Securities and Exchange Commission.
Item 13. Certain Relationships and Related Transactions
None.
III-13
[THIS PAGE INTENTIONALLY LEFT BLANK]
,,
PART IV
Item 14. Exhibits, Financial Statement Schedules, and Reports on Form 8-K
(a) The following documents are filed as part of this report:
1. Financial Statements-The following financial statements are contained in Item 8 of Part II.
Page No.
Report oflndependent Accountants . . . . . . . . . . . . . . . . . . . . . . . . . . . . . . . . . . . . . . . . . . . . . . . . II-17 Consolidated Statements of Income for the three years ended December 31, 1997 . . . . . . . . . II-18 Consolidated Balance Sheets as of December 31, 1997 and 1996 . . . . . . . . . . . . . . . . . . . . . . . . 11-19 Consolidated Statements of Cash Flows for the three years ended December 31, 1997...... 11-21 Consolidated Statements of Changes in Common Stockholders' Equity for the three years
2. Financial Statement Schedules-No financial statement schedules have been filed since the required information is not present in amounts sufficient to require submission of the schedule or because the information required is included in the respective financial statements or the notes thereto.
3. Schedule of Operating Statistics for the three years ended December 31, 1997 can be found on page IV-4 of this report.
Exhibit Number
4. Exhibits
2 Amended and Restated Agreement and Plan of Merger, dated as of December 26, 1996, between the Company, Atlantic Energy, Inc., Conectiv, Inc. and DS Sub, Inc. (Filed with Registration Statement No. 333-18843.)
3-A Copy of the Restated Certificate and Articles of Incorporation effective as of April 12, 1990. (Filed with Registration Statement No. 33-50453.)
3-B Copy of the Company's Certificate of Designation and Articles of Amendment establishing the 73/4% Preferred Stock-$25 Par. (Filed with Registration Statement No. 33-50453.)
3-C Copy of the Company's Certificate of Designation and Articles of Amendment establishing the 63/4 % Preferred Stock. (Filed with Registration Statement No. 33-53855.)
3-D A copy of the Company's Certificate of Amendment of Restated Certificate and Articles of Incorporation, filed with the Delaware Secretary of State, effective as of June 7, 1996. (Filed with Registration No. 333-07281.)
3-E A copy of the Company's Articles of Amendment of Restated Certificate and Articles of Incorporation, filed with the Virginia State Corporation Commission, effective as of June 7, 1996. (Filed with Registration No. 333-07281.)
3-F A copy of the Company's Certificate and Articles of Amendment of Restated Certificate and Articles of Incorporation, filed with the Delaware Secretary of State, effective as of March 2, 1998 (filed with the Company's Current Report on Form 8-K dated March 4, 1998; File No. 1-1405).
3-G A copy of the Company's Articles of Amendment of Restated Certificate and Articles of Incorporation, filed with the Virginia State Corporation Commission, effective as of March 2, 1998 (filed with the Company's Current Report on Form 8-K dated March 4, 1998; File No. 1-1405).
3-H Certificate of Merger of DS Sub, Inc., a Delaware Corporation with and into the Company, filed with the Delaware Secretary of State, effective as of March 1, 1998 (filed with the Company's Current Report on Form 8-K dated March 4, 1998; File No. 1-1405).
IV-1
Exhibit Number
.,.
3-1 Certificate of Merger of DS Sub, Inc., a Delaware Corporation with and into the Company, filed with the Virginia State Corporation Commission, effective as of March 1, 1998 (filed with the Company's Current Report on Form 8-K dated March 4, 1998; File No. 1-1405).
3-J Copy of the Company's By-Laws as amended March 2, 1998 (filed with the Company's Current Report on Form 8-K dated March 4, 1998; File No. 1-1405).
4-A Copy of the Mortgage and Deed of Trust of Delaware Power & Light Company to the New York Trust Company, Trustee, (the Chase Manhattan Bank, successor Trustee) dated as of October 1, 1943 and copies of the First through Sixty-Eighth Supplemental Indentures thereto. (Filed with Registration Statement No.33-1763.)
4-B Copy of the Sixty-Ninth Supplemental Indenture. (Filed with Registration Statement No. 33-39756.)
4-C Copies of the Seventieth through Seventy-Fourth Supplemental Indentures. (Filed with Registration Statement No. 33-24955.)
4-D Copies of the Seventy-Fifth through the Seventy-Seventh Supplemental Indentures. (Filed with Registration Statement No. 33-39756.)
4-E Copies of the Seventy-Eighth and Seventy-Ninth Supplemental Indentures. (Filed with Registration Statement No. 33-46892.)
4-F Copy of the Eightieth Supplemental Indenture. (Filed with Registration Statement No. 33-49750.)
4-G Copy of the Eighty-First Supplemental Indenture. (Filed with Registration Statement No. 33-57652.)
4-H Copy of the Eighty-Second Supplemental Indenture. (Filed with Registration Statement No. 33-63582.)
4-1 Copy of the Eighty-Third Supplemental Indenture. (Filed with Registration Statement No. 33-50453.)
4-J Copies of the Eighty-Fourth through Eighty-Eighth Supplemental Indentures. (Filed with Registration Statement No. 33-53855.)
4-K Copies of the Eighty-Ninth and Ninetieth Supplemental Indentures. (Filed with Registration Statement No. 333-00505.)
4-L A copy of the Indenture between the Company and The Chase Manhattan Bank (ultimate successor to Manufacturers Hanover Trust Company), as Trustee, dated as of November 1, 1988. (Filed with Registration Statement No. 33-46892.)
4-M A copy of the Indenture (for Unsecured Subordinated Debt Securities relating to Trust Securities) between the Company and Wilmington Trust Company, as Trustee, dated as of October 1, 1996. (Filed with Registration Statement No. 333-20715.)
4-N A copy of the Officer's Certificate dated October 3, 1996, establishing the 8.125% Junior Subordinated Debentures, Series I, Due 2036. (Filed with Registration Statement No. 333-20715.)
4-0 A copy of the Guarantee Agreement between the Company, as Guarantor, and Wilmington Trust Company, as Trustee, dated as of October 1, 1996. (Filed with Registration Statement No. 333-20715.)
4-P A copy of the Amended and Restated Trust Agreement between the Company, as Depositor, and Wilmington Trust Company, Barbara S. Graham, Edric R. Mason and Donald P. Connelly, as Trustees, dated as of October 1, 1996. (Filed with Registration Statement No. 333-20715.)
4-Q A copy of the Agreement as to Expenses and Liabilities dated as of October 1, 1996, between the Company and Delmarva Power Financing I. (Filed with Registration Statement No. 333-20715.)
10-A Copy of the Management Incentive Compensation Plan amended and restated as of January 1, 1996. (Filed with Form 10-K for the year ended December 31, 1996, File No. 1-1405.)
10-B Copy of the Supplemental Executive Retirement Plan, revised as of October 29, 1991.
IV-2
r)
•..
\
•
"!"
Exhibit Number
10-C
10-D
10-E
10-F
10-G
10-H
10-I
10-J
12-A
12-B
23
27
Copies of amendments to the Supplemental Executive Retirement Plan, effective June 15, 1994, and November 1, 1994. (Filed with Form 10-K for the year ended December 31, 1994, File No. 1-1405.)
Copy of the Long Term Incentive Plan amended and restated as of January 1, 1996. (Filed with Form 10-K for the year ended December 31, 1996, File No. 1-1405.)
Copies of amendments to the Long Term Incentive Plan, effective January 1, 1997, and January 30, 1997. (Filed with Form 10-K for the year ended December 31, 1996, File No. 1-1405.)
Copy of the severance agreement with members of management. (Filed with Form 10-K for the year ended December 31, 1994, File No. 1-1405.)
Copy of the current listing of members of management who have signed the severance agreement. (Filed with Form 10-K for the year ended December 31, 1996, File No. 1-1405.)
Copy of the Management Life Insurance Plan amended and restated as of January 1, 1992. (Filed with Form 10-K for the year ended December 31, 1996, File No. 1-1405.)
Copy of the Deferred Compensation Plan, effective as of January 1, 1996. (Filed with the Form 10-K for the year ended December 31, 1995, File No. 1-1405.)
Copy of amendment to the Deferred Compensation Plan, effeciive December 12, 1996. (Filed with Form 10-K for the year ended December 31, 1996, File No. 1-1405.)
Computation of ratio of earnings to fixed charges.
Computation of ratio of earnings to fixed charges and preferred dividends.
Consent of Independent Accountants.
Financial Data Schedule.
(b) Reports on Form 8-K:
On October 27, 1997, the Company filed a Form 8-K which reported an agreement for the sale of a landfill and waste-hauling company owned by a subsidiary of the Company .
IV-3
DELMARVA POWER & LIGHT COMPANY
SCHEDULE OF OPERATING STATISTICS FOR THE THREE YEARS ENDED DECEMBER 31, 1997
The table below sets forth selected financial and operating statistics for the Company's electric and gas businesses for the three years ended December 31, 1997.
1997 1996 1995
ELECTRIC: Electricity generated and purchased (MWh):
Total system output for load .............................. . 13,897,561 13,647,910 12,912,947 Nonregulated purchases ................................. . 4,201,619
Total output ............................................... . 18,099,180 13,647,910 12,912,947
Other ................................................... . 624 645 641
Total customers (4) .................................... . 448,322 442,116 436,650
(Table continued on next page)
IV-4
...
DELMARVA POWER & LIGHT COMPANY
SCHEDULE OF OPERATING STATISTICS-(Continued) FOR THE THREE YEARS ENDED DECEMBER 31, 1997
GAS: Gas Sales and Gas Transported (Met):
Residential .................................................. . Commercial .................................................. . Industrial .................................................... . Interruptible, transportation and other ............................ .
Total service territory ........................................ . Merchant sales ............................................... .
Total ...................................................... .
Operating revenue (thousands): Residential .................................................. . Cornrnercial .................................................. . Industrial .................................................... . Interruptible, transportation and other ............................ .
Total service territory ........................................ . Merchant revenues ............................................ .
Total ................................................ ·······
Number of customers (end of period): Residential .................................................. . Commercial .................................................. . Industrial .................................................... . Interruptible and other ......................................... .
Total customers (4) ......................................... .
(1) Includes unbilled sales. (2) Offsystem, competitive sales and other services. (3) Includes unbilled revenues and other miscellaneous revenues. (4) Service territory only.
Pursuant to the requirements of Section 13 or 15(d) of the Securities Exchange Act of 1934 the Registrant has duly caused this report to be signed on its behalf by the undersigned, thereunto duly authorized, on March 27, 1998.
DELMARVA POWER & LIGHT COMPANY (REGISTRANT)
Isl BARBARA S. GRAHAM BY~~~~~~~~~~~~~~~~~
(Barbara S. Graham, Senior Vice President and Chief Financial Officer)
Pursuant to the requirements of the Securities Exchange Act of 1934, this report has been signed below by the following persons on behalf of the Registrant and in the capacities, on March 27, 1998.
Signature Title
Isl How ARD E. CosGROVE (Howard E. Cosgrove)
Chairman of the Board, Chief Executive Officer and Director
.................... !.~!. .... ~~~-~:.9.~.I?;~~..................... Senior Vice President, (Barbara S. Graham) Chief Financial Officer and
Director
Isl JAMES P. LAVIN Controller and Chief (James P. Lavin) Accounting Officer
............. M ..... M.~~1?.rr:~. ~ .... ?.~~~~-~~?. !.~·. .. . .. . .. .. . .. . Director (Meredith I. Harlacher, Jr.)
Isl THOMAS S. SHAW Director ······················································································ (Thomas S. Shaw)
...................... ./~( .... ~~~!3X.~: .. ~~~~!'.<......................... Director (Barry R. Elson) .