Public Transit Investment Decisions: Per Capita Trends and Conditions Final Report Prepared for: Department of Transportation State of Florida By: Center for Urban Transportation Research College of Engineering University of South Florida December 2001
Transcript
Public Transit Investment Decisions: Per Capita Trends and Conditions
Final Report
Prepared for:
Department of Transportation State of Florida
By: Center for Urban Transportation Research
College of Engineering University of South Florida
December 2001
TECHNICAL REPORT STANDARD TITLE PAGE 1. Report No.
416-12 2. Government Accession No.
3. Recipient's Catalog No.
5. Report Date
December 2001 4. Title and Subtitle
Public Transit Investment Decisions: Per Capita Trends and Conditions
6. Performing Organization Code
7. Author(s)
Mistretta, Mark and Gregg, Rob 8. Performing Organization Report No.
10. Work Unit No.
9. Performing Organization Name and Address
National Center For Transit Research (NCTR) University of South Florida, CUT 100 4202 East Fowler Avenue, Tampa, FL 33620
11. Contract or Grant No.
DTRS98-G-0032 13. Type of Report and Period Covered
12. Sponsoring Agency Name and Address
Research Center Florida Department of Transportation 605 Suwannee Street, M.S. 30 Tallahassee, FL 32399-0450
14. Sponsoring Agency Code
15. Supplementary Notes
Supported by a grant from the Florida Department of Transportation
16. Abstract
Over the past four decades, federal assistance for transit has continued to increase, as well as become more specialized. Investments have been focused on economic development, job access, increasing transportation person trip capacity, environmental improvements, and quality of life improvements. As a result, individual agencies have had to become increasingly creative and knowledgeable when seeking federal assistance. With increasing traffic congestion and a renewed focus on transit, local and state governments must re-evaluate the benefits that overall mobility contributes to their communities’ economies, environment, and quality of life. The type and amount of investments are critical to the success of local mass transportation networks. Per capita investment in and per capita utilization of transit services between 1993 and 1999 was investigated, and changes that have occurred over that time and the corresponding influences responsible for change were analyzed. The study was based on investigations of the Sarasota County Area Transit Department (SCAT) and the Lakeland Area Mass Transit District (LAMTD). Both transit systems were found to be in a growth mode, although respective trends in funding were different; SCAT has experienced a reduction in federal assistance for which local funding has had to compensate, while LAMTD has experienced large increases in state and federal funding and so has not increased its local share. In both systems, ridership has increased but has not kept pace with operating expenditures. This report suggested that while ridership may provide a valuable indication of service utilization, the value of the transit investments may also be understood in terms of the community value of the ridership indicator, which was not studied. That is, there may currently exist unfactored benefits that would suggest a closer relationship between operating expenditures and utilization. 17. Key Words
Transit, Per Capita 18. Distribution Statement
Available to the public through the National Technical Information Service (NTIS), 5285 Port Royal Road, Springfield, VA 22161, (703) 605-6000, http://www.ntis.gov/ and through the NCTR web site at http://www.nctr.usf.edu/
19. Security Classif. (of this report)
Unclassified
20. Security Classif. (of this page)
Unclassified
21. No. of pages
38
22. Price
Form DOT F 1700.7 (8-69)
i
Acknowledgements
This project was prepared by the Center for Urban Transportation Research (CUTR) for the Florida Department of Transportation (FDOT). This is for Research Project Order #26 and completes services prepared for Contract #BC137. CUTR Project Team: Mark Mistretta, Research Associate Rob Gregg, Transit Management Director Transit Property Staff: Thanks to the following SCAT and LAMTD employees for their assistance in completing this project: Jay Goodwill, Transit Director, SCAT Michael Perry, Transit Administrative Manager, SCAT Ann Stiner, Finance and Grants Management, SCAT Steve Githens, Transit Director – LAMTD A special thanks to: Richard Dreyer, Transit Programs Administrator for FDOT District One, for coordinating the work sessions and overall guidance with this project.
Chapter 3 Background and Demographics…………………………………………………. 3
A. Sarasota County …………………………………………………………… 3 B. City of Lakeland …………………………………………………………… 4
Chapter 4 Local Funding Per Capita Trends in Transit .……………...………………….. 5
Transit Service Per Capita versus Local Contribution Per Capita ………… 5 Federal and State Contributions to Transit …………………………………. 8
Chapter 5 Local Funding Per Capital Trends – Other Programs ……...……..…………. 11
A. Sarasota County Programs ………………………………………………. 11 B. City of Lakeland General Funding Categories .…………...…………… 23
Chapter 6 Conclusions ……………………………………………………………………… 34 Appendices Appendix 1 – Sarasota County Data Appendix 2 – Sarasota County Performance Measures by Program Appendix 3 – Lakeland County Data
1
Chapter 1 Introduction Public Transportation was predominantly provided by the private sector up until the 1950’s and 1960’s. However, this would all change when the President of the United States called for a plan to build a new network of coast-to-coast highways in 1954, a project that soon came to be known as the Interstate Highway System. With the United States making major investments in new roadways and the mass production of affordable automobiles, private providers of transportation (especially the railroads) could not maintain a competitive transportation mode and many went bankrupt. Private transit operators were also held back by government-imposed limits to the fares they could charge, making it more difficult to survive in the business. So, the federal government soon placed itself in the position to provide public subsides for mass transportation systems. The history of government (in this case federal) assistance for transit in the United States can be traced back to 1958. During this year, a law passed that removed any control that state governments previously exercised over petitions railroads might file to abandon various local passenger services. This immediately resulted in the closing down of several important commuter rail services, and many others were perceived as being under serious threat. This development served as the catalyst that would lead to a bill introduced in the Senate to provide federal assistance for mass transportation just two years later. The bill was enacted into law in 1961 and provided $50 million for loans and another $25 million in grants for demonstration pilot projects in mass transportation. The following year, President Kennedy called for the establishment of a program of federal capital assistance for mass transportation. It wasn’t until 1964, that the Urban Mass Transportation Act (UMTA) was enacted into law. This new measure provided $375 million in capital assistance over three years. This was the beginning of the program of financial assistance for mass transportation that is today managed and run by the Federal Transit Administration (FTA). While federal assistance for transit has continued to increase – it has also grown more specialized. Investments have been focused on economic development, job access, increasing transportation person trip capacity, environmental, or quality of life improvements. This specialization requires individual agencies to be more creative and knowledgeable when seeking federal assistance. With a renewed focus on transit, local and state governments must also re-evaluate the benefits that overall mobility contributes to their economies, their environment, and their quality of life. The type of investments and how much is allocated is critical to the success of the local mass transportation network. The purpose of this analysis is to attempt to discover relationships between local transit per capita investments and per capita use in service. Does additional local funding lead to additional use of the system? Also, how does the per capita investment in transit compare with other local funding for other sample jurisdictional services?
2
Chapter 2 Methodology
For the purpose of this report, two Florida transit agencies were selected for review: Sarasota County Area Transit (SCAT), and Lakeland Area Mass Transit District (LAMTD), (the fixed route service is known as Citrus Connection). Historical population, employment, and housing data for Sarasota and Polk Counties were collected from the Florida Statistical Abstracts. Transit performance data was compiled from the National Transit Database (NTD). County Budget data was provided by the local transit agencies. The two transit agencies are organizationally distinctive. SCAT is a county department. As such, SCAT is locally funded through the general fund that funds all county departments. There is not an exclusive mission just for transit, but rather a naturally competitive environment among all departments for limited resources, tempered by public pressure to minimize taxes. LAMTD is an independent special district with the authority to levy an ad valorem property tax of up to fifty cents per $1,000 of assessed valuation. LAMTD is focused on only transit with a dedicated funding source with expansion based upon areas voting themselves within the taxation district.
A kickoff session was held with staff from both agencies and FDOT staff to discuss the project and define applicability and availability of data to be utilized in the research analysis. Key staff members from both agencies were interviewed to provide background information about their system and insight into their budget process. A final workgroup session was conducted to review a draft report and confirm collected data.
3
Chapter 3 Background and Demographics A. Sarasota County
Sarasota County is a 620 square mile area located on the southwest coast of Florida. Within its borders, there are four municipalities: the cities of Sarasota, Venice, North Port, and the Town of Longboat Key. There are also several unincorporated communities that provide clusters and corridors of residential and commercial activity. Most of Sarasota County's population is along the coast. The incorporated place with the greatest population is the city of Sarasota, which in 1999 had a population of 51,659 followed by Venice, with a 1999 population of 19,232 and North Port, with a 1999 population of 18,759. Nearly 71% of Sarasota County's population was in unincorporated areas in 1999. The U.S. Bureau of the Census has designated Sarasota County as the Sarasota Metropolitan Statistical Area. In 1999, 95% of Sarasota County's population was white and 5% was non-white. Persons aged 65 and over accounted for 32.5% of the population of Sarasota County in 1999.
Table 3A-1 Sarasota County Demographic Trends
Year Population Households Employees Median Per Capita Age Income 1993 290,162 131,609 126,760 N/A $29,714 1994 296,002 134,072 123,528 49.7 $31,359 1995 301,528 135,944 122,908 49.9 $32,294 1996 305,848 137,891 131,613 50.1 $33,850 1997 311,043 140,226 143,445 50.4 $35,809 1998 316,023 141,821 141,664 50.7 $37,131 1999 321,044 144,077 149,277 51.0 N/A %Change 93-99 10.5% 9.5% 17.7% 2.6% 25.0%
Sarasota County has experienced a steady rise in population in the 1990’s. Total population has increased 10.5% from 1993 to 1999. The number of households in Sarasota County increased along with the increase in population. Total employment actually fell from 1993 to 1995, but recovered the next year and was up 17.7% during this six-year time frame. The median age in Sarasota County in 1999 was 51 years old, which is one of the highest in the state. This substantiates the perception of Sarasota being a retirement Mecca, as many retirees from the North move to the area during their retirement years. In fact, 100% of the population increase in Sarasota County from 1990 to 1999 occurred from net migration. The area is also one of the wealthiest of the 67 Florida counties with a $37,131 per capita income (1998).
4
B. City of Lakeland – Polk County Located in western Polk County in the booming Interstate 4 corridor, Lakeland is the largest city in Polk County, and the economic capital of a large surrounding area. Long known as the "World Citrus Center," Lakeland is no longer surrounded by citrus, but rapid growth of manufacturing, distribution, and white-collar jobs are credited with fueling the areas population growth. Some 75,000 people reside in the city's 48 square mile area, and enjoy the amenities of a growing metropolitan area, including the Polk Museum of Art, and the Imperial Symphony Orchestra. Governed by a commission/manager form of government, Lakeland provides all basic municipal services, including excellent recreational facilities, and the multi-venue Lakeland Center. Lakeland is also the headquarters for Publix Super Markets, the No. 1 private employer in Florida. The city's location between Orlando and Tampa on Interstate 4 makes it a prime location for future growth. In 1999, 62% of Polk County's population was in unincorporated areas. There are 17 incorporated places throughout the county ranging in size from Lakeland (population of 77,487 in 1999) to Highland Park (population of 157 in 1999). The population in unincorporated areas nearly doubled between 1970 and 1987. Polk County has numerous unincorporated places with populations under 10,000. The U.S. Bureau of the Census has designated Polk County as the Lakeland-Winter Haven Metropolitan Statistical Area. In 1999, 86% of Polk County's population was white, and 14% was non-white. Persons aged 65 and over accounted for 20.6% of the population of Polk County in 1999. Table 3B-1 Polk County Demographic Trends
The City of Lakeland grew at a 6.4% rate from 1993 to 1999. This was a slower pace than overall Polk County, which experienced a 10.4% gain during this same period. This can be attributed to more growth in the unincorporated areas than in the cities. Of the population increase during the 90’s, 78.1% was due to net migration, with the other 21.9% attributed to more births than deaths. The number of households in Polk County increased along with the Polk County population. The number of employees in Polk County increased slightly slower than the population at 9.2%. The median age in Polk County was 40 years old in 1999. This is a full eleven years less than Sarasota County and ranks in the middle among all Florida Counties. The 1998 per capita income for Polk was $22,609, which also ranks near the middle range of income for the state.
5
Chapter 4 Local Funding Per Capita Trends in Transit A. Transit Service Per Capita Versus Local Contribution Per Capita The following data in tables 4A-1 and 4A-2 were compiled from the NTD Database and show the ridership and local contributions per capita for each transit property for the years FY 93 through FY 99. These tables also show the service area population, total service area in square miles, and service density. Also displayed in these tables are total operating expense per capita and the percentage of total operating expense that is accounted for by local contributions. Table 4A-1 SCAT Transit Service Per Capita Trends SCAT FY 93 FY 94 FY 95 FY 96 FY 97 FY 98 FY 99 % Change
Service Area Pop. 290,602 234,434 238,210 242,232 272,474 251,019 272,000 -6.4% Service Area (sq. miles) 96.2 96.2 96.2 96.2 114.6 159.2 159.2 65.5% Service Density 3,021 2,437 2,476 2,518 2,378 1,577 1,709 -43.4%
*The FY 99 Local Contribution from the General Fund also includes $564,462 in carryover funds that is not reflected in the near $3 million figure shown for that year. SCAT’s service area population has declined 6.4% since FY 93, but since FY 94 it has increased 16%. The FY 93 figure is practically the same as the overall Sarasota County Population and it appears that SCAT did not differentiate service population from actual population until FY 94. In determining the per capita for various measures, the overall Sarasota County Population was used because SCAT is a county department and therefore is required to serve the population of the entire county.
The service area population for LAMTD was defined at 110,000 and has stayed that way throughout the study period. Because this number is larger than the City of Lakeland population, this number is used to determine LAMTD’s per capita measures, as it represents the entire population that the agency serves. The transit per capita trend data offers a sharp contrast between the two systems. While ridership has increased for both properties, per capita ridership for Lakeland outpaced that of Sarasota County by more than 30%. The amount of local contribution revenues allocated to transit varies greatly between the two properties. SCAT’s local revenue has more than doubled in six years, while Lakeland’s contributions from local sources has been flat and has actually decreased 11.8% during this time. The per capita data also reflects this vast difference. The percent of the total transit operating expense that were paid from local sources showed that SCAT’s local contribution became a greater part of their total, increasing 51.8% to account for 67% of the total. On the other hand, Lakeland’s percent of operating expense paid from local contributions went in the opposite direction, decreasing 52.4% from FY 93 to FY 99 to account for only 30% of their total expenses. See graph 4A-1 for a graphical per capita trend comparison of Sarasota County and the City of Lakeland.
7
Graph 4A-1
Transit Ridership vs Local Contribution Per Capita
5.015.246.176.07
5.37
4.404.53
$4.41
$9.34
$7.00
$5.43
$9.58$10.82
$8.848.93
9.78 10.3210.59
11.29
12.6012.66
$8.49$8.48
$6.42 $6.26
$7.48$7.23
$9.17
0.00
2.00
4.00
6.00
8.00
10.00
12.00
14.00
FY 93 FY 94 FY 95 FY 96 FY 97 FY 98 FY 99
SCAT Riders Per CapitaSCAT Local Cont. Per CapitaLAMTD Riders Per CapitaLAMTD Local Cont. Per Capita
The total per capita operating expenses of each property shows a different picture than the per capita local contributions. Both per capita amounts for SCAT and LAMTD increased 39.6% and 85.4% respectively. This shows that total operating expenses are better correlated to ridership gains in both systems as both have been increasing. See graph 4A-2 for a graphical representation of this correlation.
8
Graph 4A-2
Transit Ridership vs Total Operating Expenses Per Capita
4.53
4.40
5.37 6.07 6.175.24 5.01
$11.72$12.71 $13.34
$9.93$10.97
$13.91
$9.9712.66
12.6011.29
10.5910.329.788.93
$21.17$21.05
$24.86
$20.54$19.73
$15.19
$13.41
0.00
5.00
10.00
15.00
20.00
25.00
30.00
FY 93 FY 94 FY 95 FY 96 FY 97 FY 98 FY 99
SCAT Riders Per CapitaSCAT Oper. Exp. Per CapitaLAMTD Riders Per CapitaLAMTD Oper. Exp. Per Capita
B. Federal and State Contributions to Transit The amount of federal funding that is distributed to specific transit agencies is determined by the Urbanized Area Formula Program (Section 5307) on an annual basis. An urbanized area is defined as an area that is densely settled and has a population of at least 50,000. This program is available for these areas to be used for transit capital and operating assistance as well as transportation related planning activities. For urbanized areas (UZA’s) with 200,000 in population and over, Section 5307 Funds are no longer available to be provided for operating assistance as of FY 99. This is significant, because SCAT is part of the Sarasota-Bradenton UZA, which has a FY 99 population of over 200,000. The impact on Lakeland was a continued ability to utilize federal funds for operating since Lakeland remained eligible with a UZA population under 200,000. A major change that occurred in FY 98 that impacted transit agencies federal funding decisions was the eligibility of preventive maintenance expenses to be categorized as a capital expense instead of an operating expense. This allowed these expenses, which were previously funded at 50% Federal share to be matched at an 80% Federal share. The results of this change was more federally allocated funds could be used for preventative maintenance, which was previously considered an operating expense.
9
State program funding policies also have a significant impact on determining use of local funding for operating assistance to the transit system. The State of Florida’s Transit Block Grant Program provides additional funding to local agencies for use towards operating or capital needs. The dip in LAMTD’s state funding in FY 99 can be attributed to some of these funds being shifted to fund Winter Haven’s new transit system that began operation in 1999. Local government support of public transit has varied with public demand for service and funding availability from federal and state resources. Some transit properties have to seek additional funding sources as their federal funding allocations have diminished. Other properties have been content with their local funding levels and have done little to increase these levels because of increased funding from state and federal sources. SCAT’s local funding increased for operating expenses as eligible federal funding for operations decreased. Whereas, LAMTD’s local funding for operating increased only slightly (due to more passenger fares collected), as federal and state allocations increased. Table 4A-3 Transit Operating Funding by Source SCAT FY 93 FY 94 FY 95 FY 96 FY 97 FY 98 FY 99 % Change Local Funding N/A $2,302,120 $2,514,200 $3,122,860 $3,956,870 $4,097,170 $4,724,680 105.2%
State Funding $279,850 $703,144 $428,353 $730,878 $650,031 $778,873 $634,806 246.7%
Federal Funding $776,232 $930,980 $1,085,459 $670,000 $881,812 $926,175 $1,448,870 115.3% Table 4A-3 and the following Graph 4A-3 shows that SCAT’s total local revenue has increased dramatically in the last six years, more than doubling from $2.3 million in FY 94 to $4.7 million in FY 99. A large portion of this increase (approximately $1.5 million) was due to an increase in the local contribution from the general fund. State funding contributions have stayed in the range of $400,000 to $900,000, while the federal funding amount has been severely cut from $1 million in FY 93 down to $150,000 in FY 99. Passenger fares have fluctuated depending on the base fare charged, which changed from $1.00 to $0.25 in FY 94 and $0.25 to $0.50 in FY 98. LAMTD, as shown in Graph 4A-4, has seen its federal and state funding increase substantially since FY 93. Because the amount that they have to contribute locally is directly dependent on how much state and federal funding is obtained, LAMTD has not had to spend more local funds. Local funding has increased just 12.1% since FY 94.
10
Graph 4A-3
Total Operating Funding by Source - SCAT
$3,122,860
$152,239
$2,302,120$2,514,200
$3,956,870
$4,724,680
$4,097,170
$641,308$618,357$620,732
$861,783
$455,990 $516,377
$784,488
$400,000$291,151$555,720
$627,739
$1,002,036
$145,000$0
$500,000
$1,000,000
$1,500,000
$2,000,000
$2,500,000
$3,000,000
$3,500,000
$4,000,000
$4,500,000
$5,000,000
FY 93 FY 94 FY 95 FY 96 FY 97 FY 98 FY 99
Total Local RevenueState Operating FundingFederal Operating Funding
Graph 4A-4
Total Operating Funding by Source - LAMTD
$1,743,900
$1,905,110 $1,917,600
$1,537,480
$1,775,120$1,710,070
$730,878$703,144
$279,850
$428,353
$650,031
$778,873
$634,806
$1,448,870
$881,812
$776,232
$930,980 $1,085,459
$670,000
$926,175
$0
$500,000
$1,000,000
$1,500,000
$2,000,000
$2,500,000
FY 93 FY 94 FY 95 FY 96 FY 97 FY 98 FY 99
Total Local RevenueState Operating FundingFederal Operating Funding
11
Chapter 5 Local Funding Per Capita Trends - Other Programs Transit systems often have to compete with other city or county services for local funding. Many of these services are perceived as essential and therefore are seen as high priority. Services such as Fire Protection, Public Health, and Law Enforcement fit this description. On the other hand, public leaders may see transit as a non-essential service or one that should be maintained at a status quo and therefore local funding should not be increased. This chapter will examine how transit’s per capita funding trends compare with other jurisdictional programs per capita funding trends. The focus of this chapter is on the general fund, which in Sarasota County’s case, contains the operating expenditures for services that are Countywide in nature and therefore reveals the amount of local funds that are being invested into certain programs. In the case of the City of Lakeland, the general fund expenses are divided into different categories instead of by specific program. A. Sarasota County Programs Services budgeted in Sarasota County’s general fund include parks and recreation, libraries, public health, historical resources and public transportation. Additionally, the general fund supports the budgets of the five Elected Officials: Sheriff, Supervisor of Elections, Property Appraiser, and Tax Collector. For this report, a number of programs were selected for trend and comparative analysis. The programs selected are not all of the county programs that receive funding from the general fund, but rather a sample of such programs that were identified as major programs. Table 5A-1 Selected Sarasota County Programs Transit (SCAT) - Public Transportation Parks and Recreation Services Library Services Public Health Fire and Life Protection Services Historical Resources Legal Services Sheriff Program
Each of these programs receives funding from the general fund, which may or may not account for all of the program’s funding. The exception to this is the Fire and Life Protection Services Program, which receives funding from a fire department fund as well as from district funds. The following table shows the local funding amounts that were contributed to all programs for each year.
12
Table 5A-2 General Fund Contributions for Selected Sarasota County Programs
Year *General Fund Per Capita FY 93 $60,347,883 $208FY 94 $66,289,697 $224FY 95 $70,308,545 $233FY 96 $71,858,531 $235FY 97 $84,292,772 $271FY 98 $88,140,305 $279FY 99 $91,989,158 $287
% Change 93-99 52.4% 38.0%
* Local Funds for the Fire and Life Protection Services Program are included in the general fund amounts even though they are not funded from the general fund.
Table 5A-2 shows that the general fund contributions to the selected programs has increased substantially in the last six years by over 50%. On a per capita basis, this is still an increase of 38%. It is important to compare the local funding amount with total expenditures to see if this increase is only occurring on a local level (general fund) or is increasing with other funding sources as well. Other funding sources include state and federal grants, fares, fees, tax proceeds, and miscellaneous revenue.
Table 5A-3 Total Expenditures – Selected Sarasota County Programs
Table 5A-3 shows the total expenditures for all of the Sarasota County programs selected. Total expenditures for all programs increased 65.7% since FY 93, which is a faster pace than the 52.4% increase in the general fund contributions. Therefore, the percentage of total expenditures that comes from the general fund has decreased from over 91% in FY 93 to 83.8% in FY 99.
The next task is to examine and analyze each individual program for any variations to the overall per capita trends for Sarasota County.
13
Public Transportation Services Program - Sarasota County Area Transit (SCAT) The purpose of this program is to provide safe, reliable, and cost effective public transportation services for the benefits of residents and visitors of Sarasota County to ensure personal mobility and enhance their quality of life.
*The FY 99 Local Contribution from the General Fund also includes $564,462 in carryover funds that is not reflected in the near $3 million figure shown for that year.
SCAT has experienced a large increase in general funding from FY 93 to FY 99. Total dollars allocated have more than doubled during this time period and the per capita figure also increased substantially. Only one year, FY 97 to FY 98, was there a major decrease in funding levels. The percent of local funding shows the percentage of expenditures that were funded by local sources. This percentage has increased in the last six years, meaning that local services now provide a majority of the funding for the transit program. The percent of total column shows the percentage of the general fund monies allocated to transit as compared to the total of all the programs selected for the purpose of this report. This percentage did increase, but is still a small 3.3% of the total.
Parks and Recreation Services Program
The purpose of this program is to provide “Quality Leisure for Life” for the benefit of the residents and visitors of Sarasota County by planning, organizing, conducting, and maintaining a system of parks, beaches, and recreation facilities.
14
Table 5A-5 General Funding Trends for Parks and Recreation
Year General Fund % Local Per Capita % of Total FY 93 $9,069,649 92.7% $31.21 15.0% FY 94 $9,754,499 92.7% $32.95 14.7% FY 95 $8,967,614 89.1% $29.74 12.8% FY 96 $8,592,334 75.9% $28.09 12.0% FY 97 $9,495,153 76.4% $30.53 11.3% FY 98 $10,681,369 76.1% $33.80 12.1% FY 99 $7,351,763 78.2% $22.90 7.9%
% Change 93-99 -18.9% -15.6% -26.6% -47.1%
Table 5A-5 displays the general funding levels supplied to the Parks and Recreation Services Program from FY 93 to FY 99. During this period of time, the amount of funding fluctuated between $7 million and $11 million. The percentage of funding coming from local sources has decreased -15.6% during this time frame. The per capita amount has decreased -26.6% due to the 10% increase in population in Sarasota County. The percent of total funding allocated to the Parks and Recreation Program has fallen substantially by –47.1%, as funds have been distributed more heavily to other programs. Library Services Program The purpose of this program is to actively provide timely, accurate, and useful information for community residents that feature current, high-demand, high-interest materials in a variety of formats for persons of all ages; and assist life-long learners in meeting their education objectives. Table 5A-6 General Funding Trends for Library Services
Table 5A-6 displays the general funding levels supplied to the Library Services Program from FY 93 to FY 99. The general fund amounts appreciated 21.5% during this time period. All of the funding for the Library Services Program is 100% from local sources and continues to be that
15
way. The per capita figure increased at a 10% rate. The percentage share of total local funding dollars contributed to this program declined 20.8% during this time frame.
Public Health Program
The purpose of this program is to protect and improve the health of visitors and residents of Sarasota County by providing quality environmental and personal health services and promote healthy lifestyle practices.
Table 5A-7 General Funding Trends for Public Health
Year General Fund % Local Per Capita % of Total FY 93 $1,773,198 100% $ 6.10 2.9% FY 94 $3,308,010 100% $10.26 4.6% FY 95 $3,039,768 100% $10.08 4.3% FY 96 $3,039,768 100% $ 9.94 4.2% FY 97 $3,039,768 100% $ 9.77 3.6% FY 98 $2,939,768 100% $ 9.30 3.3% FY 99 $2,287,871 75.9% $ 7.13 2.5%
% Change 93-99 29.0% -24.1% 16.8% -15.9%
Table 5A-7 displays the general funding levels supplied to the Public Health Program from FY 93 to FY 99. Although the general fund increased 29.0% during this period, it occurred from FY 93 to FY 94 and then leveled off at a set amount for three years. Since then, the amount has actually decreased. The percentage of funds that come from local sources dropped from 100% to 75.9% in FY 99 due to changes in definition of the funding sources. Fire and Life Protection Services Program
The purpose of this program is to protect and enhance the quality of life within the community of Sarasota County by providing a range of public services for the health, safety, and welfare of all citizens. Services include emergency related activities such as fire suppression services, technical rescues, and hazardous materials incidents. Personnel also perform safety inspections and advise on the safe disposal of hazardous materials. This program is also responsible for quality emergency medical treatment and transport services.
16
Table 5A-8 Local Funding Trends for Fire and Life Protection
Year Local Funds % Local Per Capita % of Total FY 93 $14,200,421 83.0% $48.86 23.5% FY 94 $14,552,586 82.2% $49.16 22.0% FY 95 $16,209,917 81.0% $53.76 23.1% FY 96 $14,381,818 52.1% $47.02 20.0% FY 97 $23,956,263 72.0% $77.02 28.4% FY 98 $22,470,856 65.6% $71.11 25.5% FY 99 $24,428,902 68.5% $76.09 26.4%
% Change 93-99 72.0% -17.5% 55.7% 12.2%
Table 5A-8 displays the local funding levels supplied to the Fire and Life Protection Services Program from FY 93 to FY 99. On January 1, FY 96, the City of Sarasota Fire-Rescue Bureau consolidated with the County Fire Department. The blending of these two emergency agencies caused a major increase in the County Fire Department by way of 143 additional employees, 5 additional fire-rescue stations, 53 vehicles and increase in the operating budget by approximately $9.3 million. This program is not funded by the general fund, but rather by a separate fire department fund and by district funds. This program is the second highest funded program among those selected, behind only the Sheriff Program. Although funding increased 72% during this time period, this was mainly due to the consolidation of FY 96. The overall share of local funding contribution to this program increased 12.2% over the six-year period.
Historical Resources Program
The purpose of this program is to promote an increased understanding of Sarasota County’s heritage and protect its historical resources in ways that are consistent with the Historic Preservation Chapter of Sarasota County’s Comprehensive Plan.
Table 5A-9 General Funding Trends for Historical Resources
Year General Fund % Local Per Capita % of Total FY 93 $185,235 100% $0.64 0.3% FY 94 $207,184 100% $0.70 0.3% FY 95 $246,769 100% $0.82 0.4% FY 96 $277,686 98.0% $0.91 0.4% FY 97 $302,370 99.5% $0.97 0.4% FY 98 $361,004 87.0% $1.14 0.4% FY 99 $338,854 75.8% $1.06 0.4%
% Change 93-99 82.9% -24.2% 65.6% 19.3%
17
Table 5A-9 displays the general funding levels supplied to the Historical Resources Program from FY 93 to FY 99. This program is by far the smallest and least funded among the programs selected. The 83% increase may seem impressive, but the total dollar amount increase is only approximately $150,000. The percent of total dollars contributed to this program is a very minor 0.4%. Legal Services Program
The purpose of this program is to provide in-house legal service, advice, counsel, and representation to Sarasota County Government, primarily for the benefit of the Board of County Commissioners, the County Administrator, the operating departments, Constitutional Officers, advisory boards and committees to enhance opportunities in achieving client’s goals and prevent liability within legal framework.
Table 5A-10 General Funding Trends for Legal Services
Year General Fund % Local Per Capita % of Total FY 93
Table 5A-10 displays the general funding levels supplied to the Legal Services Program from FY 94 to FY 99. FY 93 data is not available for this program as it was part of a different program prior to branching off in FY 94. The general funding for this program increased 35.7% during the five-year period. The overall share of local fund contributions for this program fell slightly. Sheriff Program
The Sheriff’s Office is responsible for all law enforcement activities in the unincorporated areas of Sarasota County. Enforcement of Florida Statutes, regulations, and local ordinances as well as execution of civil process fall within the jurisdiction of the Sheriff. The Sheriff is charged with the responsibility of operating and maintaining the County Jail.
18
Table 5A-11 General Funding Trends for the Sheriff Program
Year General Fund % Local Per Capita % of Total FY 93 $30,110,110 98.6% $103.61 49.9% FY 94 $32,350,868 98.5% $109.29 48.8% FY 95 $35,042,458 97.4% $116.22 49.8% FY 96 $38,660,999 97.3% $126.41 53.8% FY 97 $39,788,254 90.1% $127.92 47.2% FY 98 $43,215,711 92.1% $136.75 49.0% FY 99 $50,053,866 98.7% $155.91 54.1%
% Change 93-99 66.2% 0.2% 50.5% 8.4%
Table 5A-11 displays the general funding levels supplied to the Sheriff Program from FY 93 to FY 99. This program is the highest funded program among those selected with over than $50 million attributed from the general fund. Funding has increased every year and the overall share has also increased. Local Per Capita The local per capita costs of each program for FY 99 are detailed in the following table. Table 5A-12 Local Cost Per Capita Per Program FY 99 Local Cost
Per Capita Sheriff Program $155.91 Fire and Life Protection
Services $76.09 Parks and Recreation Services $22.90 Library Services $14.11 Transit $9.34 Legal Services Program $8.57 Public Health Program $7.13 Historical Resources $1.06
Transit in Sarasota County ranks in the bottom two-thirds of all programs. The Sheriff Program is by far the most cost intensive at $155.91 per Capita. This is consistent with comments received during interviews with Sarasota County Area Transit Staff. Fire and Life Protection Services is a distant second at $76.09 per Capita, but is twice as expensive as the next program. Transit Services rank higher than three programs, Legal Services, Public Health, and Historical Resources. To see a visual representation of the Per Capita trends from FY 93-FY 99 by
19
program, refer to Graphs 5A-1 and 5A-2. Graph 5A-2 depicts only the Sheriff Program as its funding amounts far exceed those of other programs. Graph 5A-1
Sarasota County General Funding per Capita by Category
$0.00
$10.00
$20.00
$30.00
$40.00
$50.00
$60.00
$70.00
$80.00
$90.00
FY 93 FY 94 FY 95 FY 96 FY 97 FY 98 FY 99
Fund
ing
Fire and Life Protection Services
Parks and Recreation Services
Library Services
Public Health Program
Legal Services Program
Historical Resources
Transit
Graph 5A-2
Sarasota County General Funding per Capita: Sheriff Program
$0.00
$20.00
$40.00
$60.00
$80.00
$100.00
$120.00
$140.00
$160.00
$180.00
FY 93 FY 94 FY 95 FY 96 FY 97 FY 98 FY 99
Fund
ing
Sheriff Program
20
Performance Analysis The performance of each program is an important factor to reveal if local funding is being expended in a way that gives value back to the community. Assigning performance measures to estimate value can be a subjective process and each individual program has different measures that make it difficult to formulate accurate comparisons. However, the process of measuring performance is still a worthy endeavor, as it provides a general idea of perceived value. Table 5A-13 Performance Measures by County Program Program FY 99 Total % Change 94-99 Transit Service Ridership 1,607,040
(93-99)21.9%
Parks and Recreation Services No. of Campers Enrolled 5,191 92.3%
Library Services No. of People Registered No. of Items Circulated
194,6772,449,042
-19.4%27.4%
Public Health No. of Immunizations Given 43,340
(95-99)19.2%
Fire and Life Protection Fire and Medical Incidents 37,671
(95-99)64.7%
Historical Resources Development Applications Reviewed 375 16.5%
Legal Services N/a N/a
Sheriff Program Calls for Service 129,810 22.6%
The performance measure that may possibly best define transit usage is annual ridership. Total ridership outpaced the population growth of Sarasota County by posting an increase of 21.9% from FY 93 to FY 99. However, ridership did not keep pace with the higher operating expenses or local funding contributed to SCAT. A factor that had an influence on ridership was SCAT’s implementation of changes in their fare structure over the past ten years. In FY 94, the basic fare was slashed from $1.00 down to $0.25. Then, only four years later, the fare increased back to $0.50. The cutting of the fares from $1.00 to $0.25 sent ridership sharply higher in FY 95 by 20%, and ridership gains continued in FY 96 and FY 97. Doubling the fare in FY 98 caused the ridership to decrease by 14% and the trend continued downward in FY 99. It is possible then, that SCAT would have not seen any ridership increases for this period if the fare was not lowered.
21
The performance measure selected for the Parks and Recreation Services Program, campers enrolled, has increased better than 92% from FY 94 to FY 99. However, this category accounts for only a small part of the program and therefore does not accurately portray the services of this program. A better measure, the number of user visits, was not available until FY 99 and therefore the trend cannot be examined. Two measures were selected for the Library Services Program, number of people registered and number of items in circulation. The number of people registered has decreased 25.7% over the last six years. However, this measure does not track overall use of libraries and therefore is not particularly helpful. A better measure is number of visits, but this measure was not reported until FY 99. The number of items in circulation has grown 27.4% in the same period and indicates that the Library system continues to add new material, which somewhat validates its 37% increase in funding. The Public Health Program measure used was the number of immunizations given, which has increased steadily since FY 95, at 19.2%. This is impressive, because funding for this program has been stagnant and was even cut back slightly during this time. However, the number of immunizations is only a small part of the overall program. A better measure would be overall patients served, but that information is not currently available in the budget. The measure selected to indicate use of the Fire and Life Services Program was fire and medical incidents. This number has increased 64.7% since FY 95. This is in line with the funding increases that have occurred. This measure is an adequate measure because it gives an idea of total workload. Historical Resources lacks a true performance measure to define the system, so the number of development applications reviewed was selected. This measure has increased 16.5% since FY 94, and has remained constant since FY 96. This increase does not come close to matching the increase in funding for this program over this period of time. Because reviewing development applications is only one task of this program it is not a good overall indicator of program usage. The Sheriff Program measure selected was calls for service, which provides a seemingly good measure for the demand for services. However, the Sheriff’s department is also responsible for operating and maintaining the County Jail. This measure has increased 22.6% over the last six years. This falls short of the 60%+ increase in funding for the Sheriff Program during this time frame. This may indicate that other areas of the program, such as maintaining the county jail, have accounted for the higher expenditures. The Legal Services Program does not have any measures that are applicable for comparison. Cost per User Another calculation that can be made to make comparisons is the cost per user of the program. In order to calculate this, the number of users is divided into the amount of general funding provided for that particular year. Table 5A-14 shows the costs per user for each program.
22
Table 5A-14 Cost per User by County Program Program FY 99 % Change 94-99 Transit Service Cost per Rider $1.87 51%
Parks and Recreation Services Cost per Camper Cost per Visitor
$1,416$0.60
-60.8%N/a
Library Services Cost per Person Registered Cost per Item Circulated Cost per Visit
$26.30$2.09$2.36
32.9%-15.9%
N/aPublic Health Cost per Immunization $52.79
(95-99)-36.8%
Fire and Life Protection Cost per Incident $648.48
(95-99)-8.5%
Historical Resources Cost per Application Reviewed $903.61 40.4%
Legal Services N/a N/a
Sheriff Program Cost per Service Call $387.47 26.2%
Transit’s cost per user was $1.87 in FY 99, an increase of 51% since FY 94. While ridership has grown at a pace of 23.4% during this time, the local contributions to transit have more than doubled, accounting for the large increase in cost per user. The Parks and Recreation Program had a sharp decrease in the cost per camper enrolled, decreasing 60.8% since FY 94. A much better measure of overall usage was used in FY 99, and with over 12 million visitors, the cost per user was only $0.60. The measures used for the Library Services Program showed mixed results. The cost per person registered has increased 32.9% since FY 94. However the cost per item in circulation has decreased 15.9% since that year to $2.09. The total number of visits to the library, which was calculated in FY 99, results in a cost of $2.36 per visit. The cost per immunization given by the Public Health Program has decreased 36.8% since FY 95 to $52.79. The actual cost of an immunization for FY 99 was $22.80, which gives an idea of how reliable the number of immunizations is as a measure of the overall program usage. The Fire and Life Protection Services Program experienced a decrease in the cost per incident by 8.5% since FY 95. However, the cost per incident is still a very costly $648.48.
23
The Historical Resources Program has seen increase in cost per application by 40.4% since FY 94. This measure is a poor indicator of overall use of this program. However, since the functions of this program are many and varied, there does not appear to be a measure that would indicate overall usage. The cost per call of service for the Sheriff Program has increased 26.2% since FY 94. This steady increase results in a cost per call of $387.47 in FY 99. Like the Fire and Life Protection Services Program, this program is relatively expensive due to its emergency and life saving aspects. Once again, the Legal Services Program does not have any applicable performance measures to estimate a cost per user.
B. City of Lakeland The City of Lakeland data provided varies from the Sarasota County data. The Lakeland data includes the entire general fund expenditures divided into different categories. In contrast, the Sarasota County data consisted of a select group of programs from the overall county budget. For the display of the City of Lakeland data, there is no need for percent of local columns as the entire amount of each category comes from the general fund. Table 5B-1 General Funding Trends – City of Lakeland
The general fund has increased by 37.3% in six years. Taken into account population increases; the per capita figure rose a substantial 29.0%. This percentage is slightly below that of Sarasota County’s general funding increase.
24
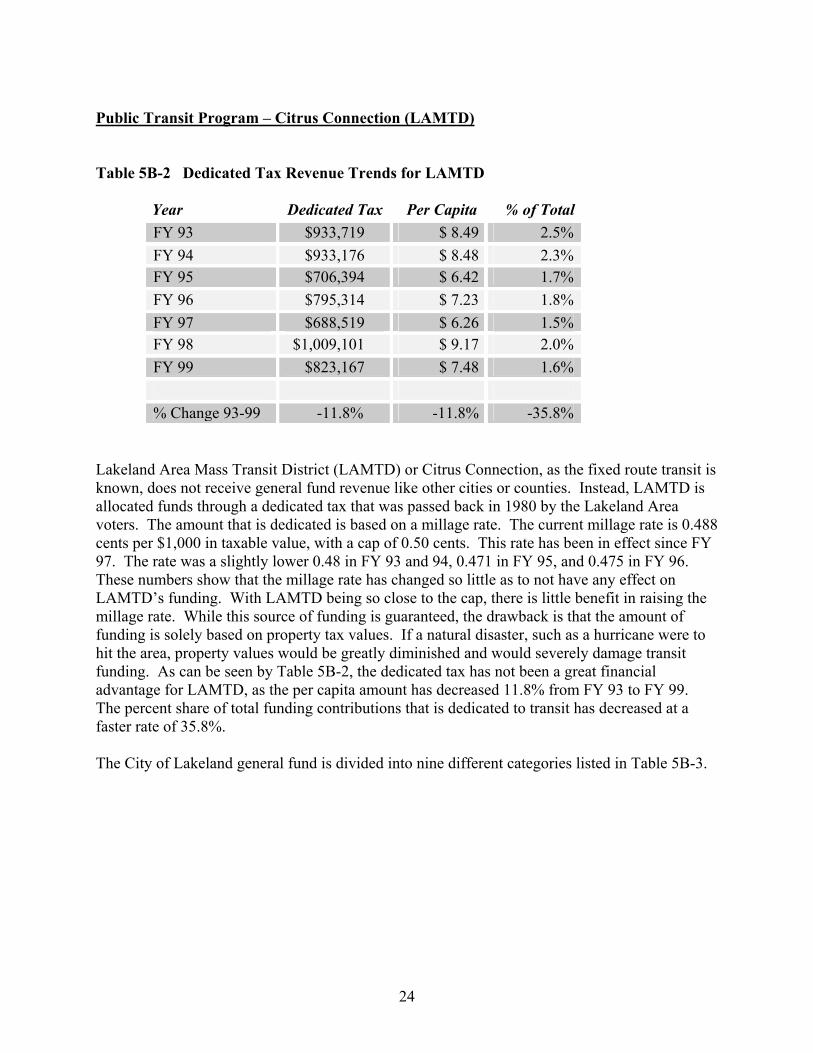
Public Transit Program – Citrus Connection (LAMTD)
Lakeland Area Mass Transit District (LAMTD) or Citrus Connection, as the fixed route transit is known, does not receive general fund revenue like other cities or counties. Instead, LAMTD is allocated funds through a dedicated tax that was passed back in 1980 by the Lakeland Area voters. The amount that is dedicated is based on a millage rate. The current millage rate is 0.488 cents per $1,000 in taxable value, with a cap of 0.50 cents. This rate has been in effect since FY 97. The rate was a slightly lower 0.48 in FY 93 and 94, 0.471 in FY 95, and 0.475 in FY 96. These numbers show that the millage rate has changed so little as to not have any effect on LAMTD’s funding. With LAMTD being so close to the cap, there is little benefit in raising the millage rate. While this source of funding is guaranteed, the drawback is that the amount of funding is solely based on property tax values. If a natural disaster, such as a hurricane were to hit the area, property values would be greatly diminished and would severely damage transit funding. As can be seen by Table 5B-2, the dedicated tax has not been a great financial advantage for LAMTD, as the per capita amount has decreased 11.8% from FY 93 to FY 99. The percent share of total funding contributions that is dedicated to transit has decreased at a faster rate of 35.8%. The City of Lakeland general fund is divided into nine different categories listed in Table 5B-3.
25
Table 5B-3 City of Lakeland General Fund Categories General Government Public Safety Physical Environment Transportation Economic Environment Human Services Culture/Recreation Capital Outlay Debt Services Other Financing Uses
General Government This category includes services provided by the legislative and administrative branches of the local government for the benefit of the public and the governmental body as a whole. Included in this fund expense is the legislative function of the City Commission. Also included is the Office of the City Manager, who provides executive management and administration, including coordination, guidance, and support for the development of effective programs; and the planning, evaluation, analysis, control, and overall supervision of such programs. Another area is that of Finance and Administration, whose activities include budgeting, accounting, auditing, property appraisal, tax collecting, personnel, purchasing, communication, etc. Other departments classified in general government are the Legal Department, the Community Development Department and the Planning Department. Other expenses classified as general government expenses include facilities maintenance and city contributions to community organizations. Table 5B-4 General Funding Trends for the General Government Category
Year General Fund Per Capita % of Total FY 93 $4,901,527 $67.03 13.0% FY 94 $4,820,103 $65.32 12.0% FY 95 $4,766,602 $63.87 11.2% FY 96 $5,216,653 $69.17 11.7% FY 97 $5,746,609 $76.35 12.2% FY 98 $5,827,283 $75.57 11.7% FY 99 $6,014,964 $77.31 11.6%
% Change 93-99 22.7% 15.3% -10.6%
26
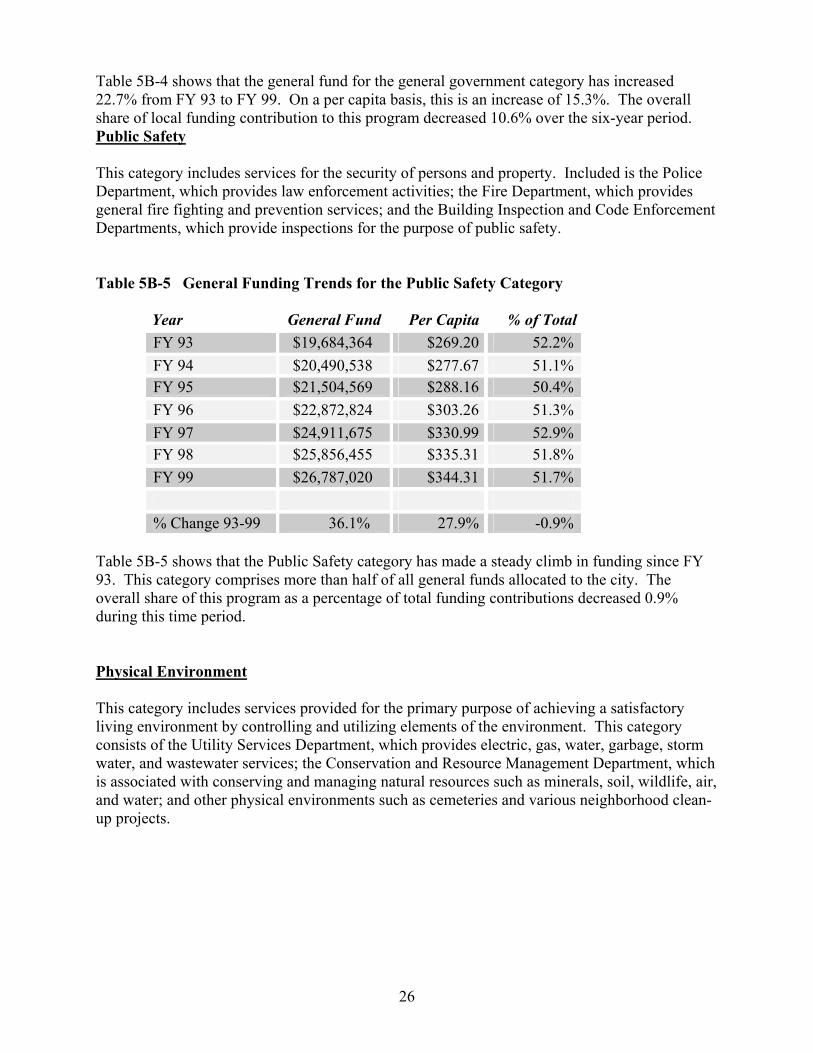
Table 5B-4 shows that the general fund for the general government category has increased 22.7% from FY 93 to FY 99. On a per capita basis, this is an increase of 15.3%. The overall share of local funding contribution to this program decreased 10.6% over the six-year period. Public Safety This category includes services for the security of persons and property. Included is the Police Department, which provides law enforcement activities; the Fire Department, which provides general fire fighting and prevention services; and the Building Inspection and Code Enforcement Departments, which provide inspections for the purpose of public safety. Table 5B-5 General Funding Trends for the Public Safety Category
Year General Fund Per Capita % of Total FY 93 $19,684,364 $269.20 52.2% FY 94 $20,490,538 $277.67 51.1% FY 95 $21,504,569 $288.16 50.4% FY 96 $22,872,824 $303.26 51.3% FY 97 $24,911,675 $330.99 52.9% FY 98 $25,856,455 $335.31 51.8% FY 99 $26,787,020 $344.31 51.7%
% Change 93-99 36.1% 27.9% -0.9%
Table 5B-5 shows that the Public Safety category has made a steady climb in funding since FY 93. This category comprises more than half of all general funds allocated to the city. The overall share of this program as a percentage of total funding contributions decreased 0.9% during this time period. Physical Environment This category includes services provided for the primary purpose of achieving a satisfactory living environment by controlling and utilizing elements of the environment. This category consists of the Utility Services Department, which provides electric, gas, water, garbage, storm water, and wastewater services; the Conservation and Resource Management Department, which is associated with conserving and managing natural resources such as minerals, soil, wildlife, air, and water; and other physical environments such as cemeteries and various neighborhood clean-up projects.
27
Table 5B-6 General Funding Trends for the Physical Environment Category
Year General Fund Per Capita % of Total FY 93 $1,545,898 $21.14 4.1% FY 94 $1,832,661 $24.83 4.6% FY 95 $1,834,611 $24.58 4.3% FY 96 $1,765,905 $23.41 4.0% FY 97 $1,900,643 $25.25 4.0% FY 98 $2,076,353 $26.93 4.2% FY 99 $2,368,049 $30.44 4.6%
% Change 93-99 53.2% 44.0% 11.6%
Table 5B-6 shows that general funds for the Physical Environment category has increased 53.2%, and the per capita amount increased 44%. The overall share of this program as a percentage of total funding contributions increased 11.6% since FY 93. Transportation This category includes costs of services for the safe and adequate flow of vehicles, travelers, and pedestrians. This includes the cost of providing road and street facilities, and ancillary facilities such as bridges, sidewalks, traffic control devices, streetlights, right-of-way, shoulders, and other facilities incidental to the proper movement of traffic along roads and streets. Table 5B-7 General Funding Trends for the Transportation Category
Year General Fund Per Capita % of Total FY 93 $4,518,319 $61.79 12.0% FY 94 $4,774,357 $64.70 11.9% FY 95 $4,979,650 $66.73 11.7% FY 96 $4,968,193 $65.87 11.2% FY 97 $5,096,192 $67.71 10.8% FY 98 $5,372,207 $69.67 10.8% FY 99 $5,537,368 $71.17 10.7%
% Change 93-99 22.6% 15.2% -10.7%
Table 5B-7 shows the funding trends for the transportation category. The general fund contribution has increased 22.6% over this time frame and the per capita total has increased
28
15.2%. The overall share of this program as a percentage of total funding contributions decreased 10.7% since FY 93. Economic Environment This category includes costs of providing services that develop and improve the economic condition of the community and its citizens. A subset of this category is Industry Development, which promotes tourism as well as encourages desirable firms or industries to locate its facilities or offices in the area. Table 5B-8 General Funding Trends for the Economic Environment Category
Year General Fund Per Capita % of Total FY 93 $82,408 $1.13 0.2% FY 94 $80,573 $1.09 0.2% FY 95 $75,750 $1.02 0.2% FY 96 $75,469 $1.00 0.2% FY 97 $75,530 $1.00 0.2% FY 98 $79,846 $1.04 0.2% FY 99 $95,325 $1.23 0.2%
% Change 93-99 15.7% 8.7% -15.7%
Table 5B-8 shows that general funds allocated to the Economic Environment category have increased 15.7%. If it were not for the increase from FY 98 to FY 99, this category would have seen an actual decrease. This category is a very minor part of the whole, as only 0.2% of the total general fund is allocated to it. Therefore any changes in this category will not affect the overall general funding percentages. Human Services This category includes costs of providing services for the care, treatment, and control of human illness, injury, or handicap; and for the welfare of the community as a whole and its individuals. This includes mental health, physical health, and public assistance programs, developmentally disabled, and interrelated programs such as the provision of health care for indigent persons.
29
Table 5B-9 General Funding Trends for the Human Services Category
Year General Fund Per Capita % of Total FY 93 $39,750 $0.54 0.1% FY 94 $45,010 $0.61 0.1% FY 95 $47,570 $0.64 0.1% FY 96 $46,332 $0.61 0.1% FY 97 $23,500 $0.31 0.0% FY 98 $36,298 $0.47 0.1% FY 99 $15,625 $0.20 0.0%
% Change 93-99 -60.7% -63.1% -71.4%
Table 5B-9 shows that general funds allocated to the Human Services category have been more than cut in half, with the largest decrease occurring from FY 98 to FY 99. This category was allocated only $15,625 in FY 99, which makes it by far the least funded category. Like the Economic Environment category, any changes in this category will not affect the overall funding percentages. Culture/Recreation This category includes the cost of providing and maintaining cultural and recreational facilities and activities for the benefit of citizens and visitors. Included in this category are Libraries, Parks and Recreation, Cultural Services, and Special Events. The costs associated with the libraries are providing and maintaining library facilities and services. The Parks and Recreation Department is responsible for providing recreational facilities and activities for both participant and spectator involvement. Cultural facilities such as the Polk Museum of Art and the Polk Theatre are provided for in this category. Special events consist of such activities as county fairs, civic events, historical celebrations, and special holidays or festive occasions. Table 5B-10 General Funding Trends for the Culture/Recreation Category
Year General Fund Per Capita % of Total FY 93 $5,582,513 $76.35 14.8% FY 94 $6,135,677 $83.15 15.3% FY 95 $6,511,697 $87.26 15.3% FY 96 $6,954,826 $92.21 15.6% FY 97 $7,349,532 $97.65 15.6% FY 98 $7,775,684 $100.83 15.6%
30
FY 99 $7,913,170 $101.71 15.3%
% Change 91-99 41.7% 33.2% 3.2% Table 5B-10 shows that general funds allocated to the Culture/Recreation category have increased 41.7% in the six-year period. Much like the Public Safety and Physical Environment categories, this category has risen steadily and has seen its overall share as a percentage of the total funding contributions increase 3.2%. Capital Outlay This category includes costs related to the purchase and/or construction of capital assets. Table 5B-11 General Funding Trends for the Capital Outlay Category
Year General Fund Per Capita % of Total FY 93 $81,641 $1.12 0.2% FY 94 $76,256 $1.03 0.2% FY 95 $94,276 $1.26 0.2% FY 96 $122,666 $1.63 0.3% FY 97 $81,121 $1.08 0.2% FY 98 $707,737 $9.18 1.4% FY 99 $673,149 $8.65 1.3%
% Change 93-99 724.5% 674.9% 500.5%
Table 5B-11 shows that the general funds allocated to the Capital Outlay category have dramatically increased in FY 98 and FY 99 by almost ten times. Up until FY 97, this category accounted for less than 0.3% of the total funds allocated. But in FY 98, this percentage jumped to 1.4% and stayed at 1.3% the following year. Debt Service (debt payments) Table 5B-12 General Funding Trends for Debt Services Category
Year General Fund Per Capita % of Total FY 93 $82,285 $1.13 0.2% FY 94 $208,694 $2.83 0.5% FY 95 $71,595 $0.96 0.2% FY 96 $123,005 $1.63 0.3% FY 97 $144,055 $1.91 0.3%
Table 5B-12 shows that the general funds allocated to the capital outlay category has substantially increased since 1991, by 202.4%. The overall share amount as a percentage of all local contributions increased 120.2%. However, this category is still a relatively small one at only 0.5% of the total. Other Financing Uses This category includes transfers from one fund of the reporting entity to another, which are not repayable and do not constitute payment or reimbursement for goods provided or services performed. Table 5B-13 General Funding Trends for the Other Financing Uses Category
Year General Fund Per Capita % of Total FY 93 $286,958 $3.92 0.8% FY 94 $714,092 $9.68 1.8% FY 95 $2,062,545 $27.64 4.8% FY 96 $1,612,880 $21.38 3.6% FY 97 $1,031,532 $13.71 2.2% FY 98 $939,620 $12.18 1.9% FY 99 $1,338,805 $17.21 2.6%
% Change 93-99 366.6% 333.8% 239.8%
Table 5B-13 shows that the general funds allocated to the Other Uses category have more than increased five times in this time frame. However, this category is the least consistent of the categories with a low of $286,958 in FY 93 to a high of $2,062,545 in FY 95. Local Per Capita The local per capita costs of each category for FY 99 are detailed in the following table.
32
Table 5B-14 Local Cost Per Capita by Category FY 99 Local Cost
Per Capita Public Safety $344.31 Culture/Recreation $101.71 General Government $77.31 Transportation $71.17 Physical Environment $30.44 Other Uses $17.21 Capital Outlay $8.65 Transit $7.48 Debt Service $3.20 Economic Environment $1.23 Human Services $0.20
The Public Safety category is the most expensive category, which is consistent with the fact that the Sheriff Program is the most expensive in Sarasota County. The transit per capita cost of $7.48 in Lakeland, which is even less than SCAT’s per capita cost of $9.34. It also ranks in a similar location – the bottom two-thirds. To see a visual representation of the per capita trends from FY 93-FY 99 by program, refer to Graphs 5B-1 and 5B-2. Graph 5B-2 depicts only the Public Safety category as it far exceeds the funding amounts of any other category.
33
Graph 5B-1
City of Lakeland General Funding Trends per Capita by Category
$0.00
$20.00
$40.00
$60.00
$80.00
$100.00
$120.00
FY 93 FY 94 FY 95 FY 96 FY 97 FY 98 FY 99
Fund
ing
Culture/Recreation
General Government
Transportation
Physical Environment
Other UsesTransit
Capital Outlay
Debt Service
Economic Environment
Human Services
Graph 5B-2
City of Lakeland General Funding Trends per Capita : Public Safety
$0.00
$50.00
$100.00
$150.00
$200.00
$250.00
$300.00
$350.00
$400.00
FY 93 FY 94 FY 95 FY 96 FY 97 FY 98 FY 99
Fund
ing
Public Safety
Performance Analysis Because the Lakeland categories entail several different programs, it is not possible to attain performance measures or costs per user data.
34
Chapter 6 Conclusions The findings from this project suggest contrasting views in local investment in transit per capita trends. While both properties experienced population increases and ridership increases from FY 93 to FY 99, the trend in local contributions to transit was vastly different for each system. The local per capita investment in transit for SCAT in Sarasota has more than doubled since FY 93 from $4.41 to $9.34. The local per capita investment in transit for LAMTD in Lakeland was down from $8.49 to $7.48 during this same time frame. Looking at the amount of state and federal funds allocated to transit for each property offers a partial explanation for the local contribution trends. LAMTD has seen a large increase in state and federal funding and therefore has not felt the need to increase their local share to transit. SCAT, on the other hand, has seen its federal contributions dwindle over the last six years and has had to replace that funding with local sources. Due to the influence of eligibility of federal and state funding between the two transit systems; an overall view of combined federal, state, and local investments provides a clearer picture. Total investments reveal similarities in the systems with a correlation to increased ridership. SCAT’s per capita for total operating expenditures increased from $9.97 in FY 93 to $13.91 in FY 99, equal to a 39.6% increase. This compared to a ridership increase of 21.9% for Sarasota during the same period in time. LAMTD experienced an 85% increase from FY 93 to FY 99 in per capita total expenditures rising from $13.41 to $24.86. Comparatively, LAMTD’s ridership increased by 41.9% during this time frame. Comparing other jurisdictional service programs with the transit program, a few major issues emerge. First of all, it can be seen that for both transit properties selected that the transit service ranks in the bottom two-thirds of the selected local service programs. This reinforces the earlier
35
statement that other programs such as the sheriff and fire departments are seen as being more valuable on a local level. Secondly, it can be stated that Sarasota County and the City of Lakeland have been in growth mode over the last decade as their overall expenditures have increased 54.2% and 85.4% respectively. Sarasota County’s performance analysis and cost per user data offers a few more insights that are not available for the City of Lakeland. The local cost per user increased from $1.24 in FY 94 to $1.87 in FY 99. This means that the local contributions to transit have increased at a much faster pace than the ridership. Non-local contributions have decreased for SCAT during this same time frame, which can account for some of the need for local sources to increase funding. The cost per user data for other jurisdictional services reveals a wide range of costs with the sheriff and fire services costing the most per unit of service, while services such as Parks and Recreation and the Libraries have very low costs per users. Even though the SCAT transit local cost per user has increased, it remains a small amount compared to other jurisdictional services. This project suggests that additional studies may be appropriate to further examine per capita costs. Better performance data should be calculated and analyzed to get a clearer picture of actual costs per user for each program. A more in-depth analysis on the individual agencies decision-making processes could be explored. Additionally, although ridership may provide a valuable indication of service utilization, there may be additional insight gained on transit investments by analyzing the community “value” of that ridership indicator. The use of transit may reveal benefits that can be quantified as it relates to the local economy, environmental improvements and increased capacity of the overall transportation system. Finally, another observation for future analysis relates to the total capacity created by these transit improvements and customer accessibility to this capacity. This study reviewed the per capita investments for transit services and the resulting ridership up to date. What was not analyzed was the total capacity created by this investment and potential ridership yet realized. Both the Lakeland and Sarasota areas are projected to experience population and economic growth. A key factor in transit use is the simple fact of convenient accessibility to the system. Land use decisions and growth management strategies of locating development and other jurisdictional services in coordination with transit services can dramatically improve utilization and effective performance.
Per Capita $208 $224 $233 $235 $271 $279 $287 38.0%
38
Appendix 2
Sarasota County Perfomance Measures by Program
Name of Program 93 94 95 96 97 98 99% Change
94-99
Public TransitRidership 1,317,850 1,302,060 1,618,860 1,856,010 1,918,180 1,656,650 1,607,040 23.4%Cost per User $0.97 $1.24 $1.30 $1.46 $1.75 $1.83 $1.87 51.0%
Parks and Recreation ServicesNo. of Campers Enrolled n/a 2,700 2,920 4,550 7,314 7,725 5,191 92.3%Cost per Camper n/a $3,613 $3,071 $1,888 $1,298 $1,383 $1,416 -60.8%No. of Visitors at County Parks 12,248,492 n/aCost per Visitor $0.60 n/a
Library ServicesNo. of People Registered n/a 241,479 257,218 192,379 212,648 224,453 194,677 -19.4%Cost per User n/a $19.79 $18.24 $21.85 $20.44 $24.25 $23.27 17.6%No. of Items Circulated 1,751,883 1,922,990 2,096,060 2,195,165 2,321,100 2,413,944 2,449,042 27.4%Cost per Item $2.13 $2.48 $2.24 $1.91 $1.87 $2.25 $1.85 -25.6%No. of Visits to Library 2,166,441 n/aCost per Visit $2.09 n/a
Public Health ProgramNo. of Immunizations given n/a n/a 36,374 39,000 39,349 43,615 43,340 19.2%Cost per Immunization n/a n/a $83.57 $77.94 $77.25 $67.40 $52.79 -36.8%
Fire and Life Protection ServicesFire and Medical Incidents n/a n/a 22,873 33,053 36,065 36,865 37,671 64.7%Cost per Incident n/a n/a $708.69 $435.11 $664.25 $609.54 $648.48 -8.5%