Public Transportation Investment Background Data November 2015 11th Edition PUBLISHED BY American Public Transportation Association LOGO American Public Transportation Association 1300 I Street, N.W., Suite 1200 East Washington, DC 20005 TELEPHONE: (202) 496-4800 E-MAIL: [email protected]www.apta.com
Transcript
Public Transportation Investment Background Data
November 2015
11th Edition
PUBLISHED BY
American Public Transportation Association
LOGO
American Public Transportation Association
1300 I Street, N.W., Suite 1200 East Washington, DC 20005
Public Transportation Investment Background Data, 11th Edition
American Public Transportation Association
Washington, DC November 2015
Material from Public Transportation Investment Background Data may be quoted or reproduced without obtaining the permission of the American Public Transportation Association.
Suggested Identification: American Public Transportation Association. Public Transportation Investment Background Data, 11th Edition. Washington, DC, November 2015.
Public Transportation Investment Background Data Page 3
Table of Contents I. INTRODUCTION .................................................................................................................. 6 II. STATE OF THE TRANSIT INDUSTRY ............................................................................... 6 Figure 1: Transit Has Carried Over 10 Billion Passenger Trips For 9 Straight Years (Update 11/20/2015) Figure 2: The Number of Rail Transit Systems Has Increased Steadily over Three and One-Half Decades (updated 11/20/2015) III. WHERE TRANSIT FUNDS COME FROM ......................................................................... 7 III. A. Directly Generated Revenues ........................................................................................ 8 III. B. Local Revenues .............................................................................................................. 8 III. C. State Revenues ............................................................................................................... 8 III. D. Federal Revenues ........................................................................................................... 8 Figure 3: Sources of Operating Funds, 2013 (updated 11/20/2015) Table 1: Source of Operating Funds, 2010-2013 (Accrued Revenue) (updated 11/20/2015) Figure 4: Sources of Capital Funds, 2013 (updated 11/20/2015) Table 2: Source of Capital Funds, 2010-2013 (Accrued Revenue) (updated 11/20/2015) III. E. Overall Funding Sources ................................................................................................ 10 Table 3: Source of Total Funding, Operating and Capital Combined, 2010-2013 (Accrued Revenue) (updated 11/20/2015) III. F. The Trend in Funding ...................................................................................................... 10 Figure 5: Growth in Capital Revenue by Source, 1995-2013 (updated 11/20/2015) Figure 6: Growth in Operating Revenue by Source, 1995-2013 (updated 11/20/2015) III. G. Federal Transit Funding .................................................................................................. 11 III. H. Other Federal Funds ..................................................................................................... 11 Table 4: Federal Transit Act Authorizations and Appropriations, 2000-2015 (updated 11/20/2015) Figure 7: Federal Appropriations and Total Funding Including Flexed Funds, 2000-2015 (updated 11/20/2015) III. I. "Guarantee Provision" ..................................................................................................... 13 Figure 8: Federal Authorizations and Appropriations, 2000-2015 (updated 11/20/2015) III. J. Apportionments and Allocations ................................................................................. 14
Public Transportation Investment Background Data Page 4
IV. WHAT TRANSIT FUNDS ARE SPENT FOR .................................................................. 14 IV. A. Capital Expenditures .................................................................................................... 14 Table 5: Capital Expense by Mode and Type of Investment, 2010-2013 (updated 11/20/2015) IV. B. Vehicle Fleet Size and Vehicle Purchases ................................................................... 16 Figure 9: The Public Transportation Passenger Vehicle Fleet Has Expanded Steadily (updated 11/20/2015) Table 6: Number of Transit Vehicles by Mode, 2004-2013 (updated 11/20/2015) Table 7: Estimated Number of New Passenger Vehicles Delivered by Mode, 2004-2013 (updated 11/20/2015) Table 8: Active Roadway Vehicles from 2013 National Transit Database Revenue Vehicle Inventory for Urbanized Areas (updated 11/20/2015) Table 9: Active Bus Vehicles by Length and Mode of Service from 2013 National Transit Database Revenue Vehicle Inventory for Urbanized Areas (updated 11/20/2015) Table 10: Active Roadway Vehicles by Type of Vehicle and Length from 2013 National Transit Database Revenue Vehicle Inventory for Rural Areas (updated 11/20/2015) Table 11: Roadway Vehicles Listed in 2013 and 2012 National Transit Database Revenue Vehicle Inventory for Urbanized Areas by Year Built (updated 11/20/2015) Table 12: Rail Vehicles Listed in 2013 and 2012 National Transit Database Revenue Vehicle Inventory for Urbanized Areas by Year Built (updated 11/20/2015) Table 13: Active Transit Vehicles by Source of Federal Funding from 2013 National Transit Database Revenue Vehicle Inventory for Urbanized Areas (Vehicles Only in Urbanized Areas) (updated 11/20/2015) Table 14: Active Transit Vehicles by Source of Federal Funding from 2013 National Transit Database Revenue Vehicle Inventory for Rural Areas (Vehicles Only in Rural Areas) (updated 11/20/2015) Table 15: FTA Required Minimum Useful Life before Replacement by Vehicle Type Table 16: Rail Vehicles by Year of Manufacture from 2015 APTA Public Transportation Vehicle Database (updated 11/20/2015) Table 17: Roadway Vehicles by Year of Manufacture from 2015 APTA Public Transportation Vehicle Database (updated 11/20/2015) Table 18: Average Vehicle Cost by Vehicle Type from 2015 APTA Public Transportation Vehicle Database (updated 11/20/2015) IV. C. Vehicle Fuel Types ....................................................................................................... 26 Table 19: Percent of Bus, Demand Response, and Commuter Rail Vehicles by Type of Fuel from APTA Public Transportation Vehicle Database, 2007 through 2015 (updated 11/20/2015)
Public Transportation Investment Background Data Page 5
IV. D. Fixed-Guideway Infrastructure ..................................................................................... 27 Table 20: Miles of Track by Mode, 2002-2013 (updated 11/20/2015) Table 21: Openings of Entirely New Fixed-Guideway Systems, 2004- October 2015 (updated 11/20/2015) Table 22: Stations and Maintenance Facilities by Mode, 2013 (updated 11/20/2015) IV. E. Federal New Starts "Pipeline" ....................................................................................... 26 Table 23: Summary of Federal Capital Investment Grant Proposal Financial Plans as of February 3, 2015 (added 11/20/2015) Table 24: FTA New Starts Capital Investment Program Project Profiles as of February 3, 2015 (updated 11/20/2015) IV. F. Operating Expenditures ................................................................................................ 34 Table 25: Operating Expenditures by Function Class, 2010-2013 (updated 11/20/2015) V. ARE VOTERS WILLING TO SUPPORT TRANSIT INVESTMENT? ................................ 34 Table 26: Local Referenda Approvals (updated 11/20/2015) VI. REFERENCES .................................................................................................................. 35 VI. A. American Public Transportation Association Publications ............................................. 35 VI. B. Federal Transit Administration Publications ................................................................... 35
Public Transportation Investment History Background Data Page 6
I. Introduction This report assembles in one place brief answers for those questions which APTA is most frequently asked for background data about investment in transit, with references to sources with more detailed information. Investment questions focus on transit financing: where do transit funds come from, how does the funding process work, how dependable are the funding sources, and what do transit funds buy? This is the 11th edition of Public Transportation Investment Background Data. Earlier editions include data for prior years for many of the tables in this edition. Earlier editions are archived on the APTA web site at www.apta.com.
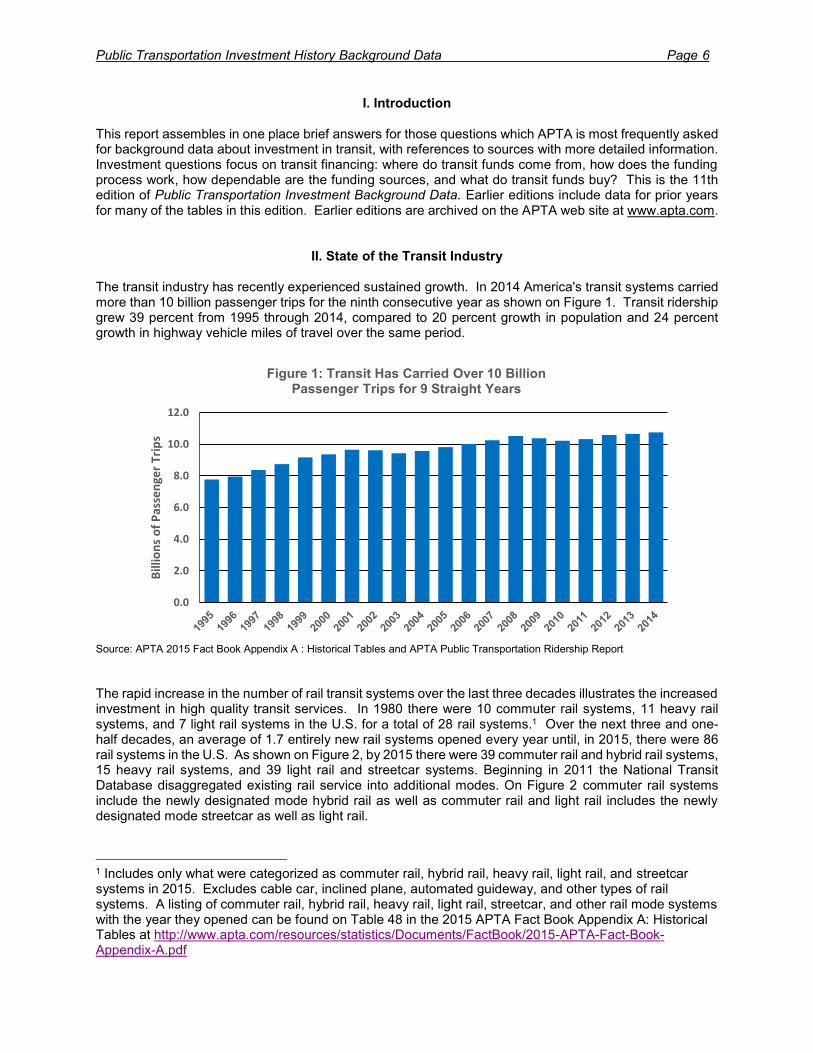
II. State of the Transit Industry The transit industry has recently experienced sustained growth. In 2014 America's transit systems carried more than 10 billion passenger trips for the ninth consecutive year as shown on Figure 1. Transit ridership grew 39 percent from 1995 through 2014, compared to 20 percent growth in population and 24 percent growth in highway vehicle miles of travel over the same period.
Source: APTA 2015 Fact Book Appendix A : Historical Tables and APTA Public Transportation Ridership Report
The rapid increase in the number of rail transit systems over the last three decades illustrates the increased investment in high quality transit services. In 1980 there were 10 commuter rail systems, 11 heavy rail systems, and 7 light rail systems in the U.S. for a total of 28 rail systems.1 Over the next three and one-half decades, an average of 1.7 entirely new rail systems opened every year until, in 2015, there were 86 rail systems in the U.S. As shown on Figure 2, by 2015 there were 39 commuter rail and hybrid rail systems, 15 heavy rail systems, and 39 light rail and streetcar systems. Beginning in 2011 the National Transit Database disaggregated existing rail service into additional modes. On Figure 2 commuter rail systems include the newly designated mode hybrid rail as well as commuter rail and light rail includes the newly designated mode streetcar as well as light rail.
1 Includes only what were categorized as commuter rail, hybrid rail, heavy rail, light rail, and streetcar systems in 2015. Excludes cable car, inclined plane, automated guideway, and other types of rail systems. A listing of commuter rail, hybrid rail, heavy rail, light rail, streetcar, and other rail mode systems with the year they opened can be found on Table 48 in the 2015 APTA Fact Book Appendix A: Historical Tables at http://www.apta.com/resources/statistics/Documents/FactBook/2015-APTA-Fact-Book-Appendix-A.pdf
0.0
2.0
4.0
6.0
8.0
10.0
12.0
Bill
ion
s o
f P
asse
nge
r Tr
ips
Figure 1: Transit Has Carried Over 10 BillionPassenger Trips for 9 Straight Years
Public Transportation Investment History Background Data Page 7
Source: APTA 2015 Fact Book Appendix A: Historical Tables
III. Where Transit Funds Come From Transit revenue is categorized into four source groups based on the original source of the funds: funds directly generated by transit agencies, local government financial assistance, state government financial assistance, and federal government financial assistance. The words "funds" and "revenues" are used interchangeably. Transit funding is also classified by use, either for operations or for capital. The definition of operating and capital funds differs between accounting practice and federal transit law. Federal transit law, as codified in Title 49, Chapter 53 of the United States Code,2 defines capital expenditures to include the purchase of capital items and the maintenance of rolling stock and facilities. The Federal Transit Administration's National Transit Database (NTD) defines a standard accounting system to meet the annual federal requirement for all transit agencies in urbanized areas receiving federal assistance to report financial and operating data. The NTD classifies maintenance expenditures as an operating expenditure, not a capital expenditure. Funds received for transit expenditures are classified in the NTD as operating or capital revenues based on their eventual use. All funding data reported on the following Tables 1, 2, 3, and 5 and Figures 3 through 6 are accrued revenue based on data from the National Transit Database expanded by APTA using accepted statistical procedures to account for transit agencies that do not report revenue data to the NTD such as not for profit elderly and disabled service providers, small agencies in urbanized areas that obtain reporting waivers, and private systems that choose not to report to the NTD. The years for the data are NTD Report Years, which are flexible time periods that include the Fiscal Year for each reporting transit agency that ends in the identified Calendar Year. III. A. Directly Generated Revenues are any funds acquired by the transit agency or its oversight agency by their own activity as a business or by taxing actions where the agency has been enabled by the state to collect a specific tax in a specific area.
2 Chapter 53 of Title 49, as amended by MAP-21, The Moving Ahead for Progress in the 21st Century Act, Public Law 112-141, enacted July 6, 2012 at http://www.apta.com/gap/legissues/authorization/Documents/Ramseyer_Ch_53_Revisions_Final%20(2).pdf
0
5
10
15
20
25
30
35
40
45
Commuter and HybridRail Systems
Heavy Rail Systems Light Rail and StreetcarSystems
Nu
mb
er o
f R
ail
Tran
sit
Syst
ems
Figure 2: The Number of Rail Transit Systems Has Increased Steadily Over Three and One-Half Decades
Public Transportation Investment History Background Data Page 8
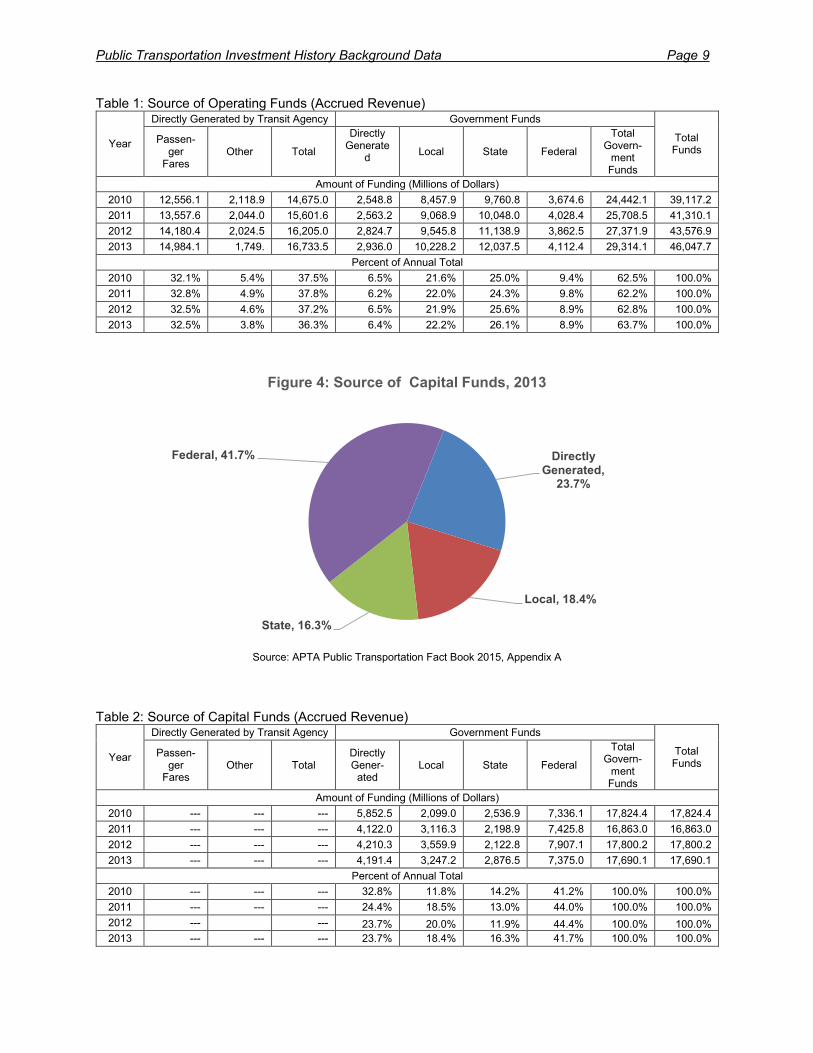
Directly Generated Funds account for 42.7 percent of all operating revenue and 23.7 percent of all capital revenue in 2013 as shown on Tables 1 and 2 and illustrated on Figures 3 and 4.3 The largest portion of Directly Generated Revenue comes from Passenger Fares, 32.5 percent of all operating revenue, and smaller portions of operating revenue, as reported on Table 1, come from Directly Generated Other and Directly Generated Dedicated revenues. Directly Generated Other funds do not come from taxes and include advertising, concessions, parking revenues, and toll revenues from other sectors of operations. Directly Generated Dedicated funds are revenues that come from taxes controlled by the transit agency but enabled by a state government. III. B. Local Revenues are any revenues where the tax or fee is assessed in a local or regional area and a local or regional government is enabled to implement the tax or fee. The actual collection of the tax or fee could be by another government, for example as an add-on to a state sales tax or income tax. Local revenue, also termed local financial assistance, in 2013 accounted for 22.2 percent of operating revenue and 18.4 percent of capital revenue. Both Directly Generated Revenues and Local Revenues are obtained in the transit agency's service area and should be combined when determining the funding that comes from "local" sources. III. C. State Revenues, also called state financial assistance, are any revenue where the source tax or fee is imposed by a state government on the entire state. In 2013 state funds accounted for 26.1 percent of operating revenue and 16.3 percent of capital revenue. III. D. Federal Revenues, also called federal financial assistance, are revenues that originated from federal government funds, even if they are transferred to other levels of government for final distribution. Federal funds in 2013 provided 8.9 percent of operating revenue and 41.7 percent of capital revenue.
Source: APTA Public Transportation Fact Book 2015, Appendix A
3 APTA Fact Book Appendix A: Historical Tables. Washington: American Public Transportation Association at http://www.apta.com/resources/statistics/Documents/FactBook/2015-APTA-Fact-Book-Appendix-A.pdf
Public Transportation Investment History Background Data Page 10
III. E. Overall Funding Sources for capital and operating revenue combined are shown on Table 3.4 In 2013 all types of Directly Generated funds accounted for 37.5 percent of total revenue, Federal funds were 19.3 percent, State funds 23.4 percent, and Local funds 21.1 percent. Funds solely from the transit agency service areas, Directly Generated and Local combined, account for 58.6 percent of all revenue. Table 3: Source of Total Funding, Operating and Capital Combined (Accrued Revenue)
Year
Directly Generated by Transit Agency Government Funds
III. F. The Trend in Funding from different sources is shown on Figures 5 and 6.5 Capital funding, on Figure 5, has seen significant growth from combined Directly Generated and Local Sources, 167 percent or $4.7 billion over the eighteen-year period from 1995 through 2013, while Federal funds have grown 116 percent or $4.0 billion and state funds 182 percent or $1.9 billion.
Federal operating revenue, on Figure 6, has increased 403 percent or $3.3 billion from 1995 through 2013 but remains the smallest source of funding at only 8.9 percent of operating funds. State operating funds
4 APTA Fact Book Appendix A: Historical Tables. Washington: American Public Transportation Association at http://www.apta.com/resources/statistics/Documents/FactBook/2015-APTA-Fact-Book-Appendix-A.pdf 5 APTA Fact Book Appendix A: Historical Tables. Washington: American Public Transportation Association at http://www.apta.com/resources/statistics/Documents/FactBook/2015-APTA-Fact-Book-Appendix-A.pdf
Public Transportation Investment History Background Data Page 11
have increased 214 percent or $8.2 billion over the eighteen-year period, combined Directly Generated, except Passenger Fares, and Local Funds have increased 120 percent or $8.1 billion, and passenger fare revenue has increased 120 percent or $8.2 billion.
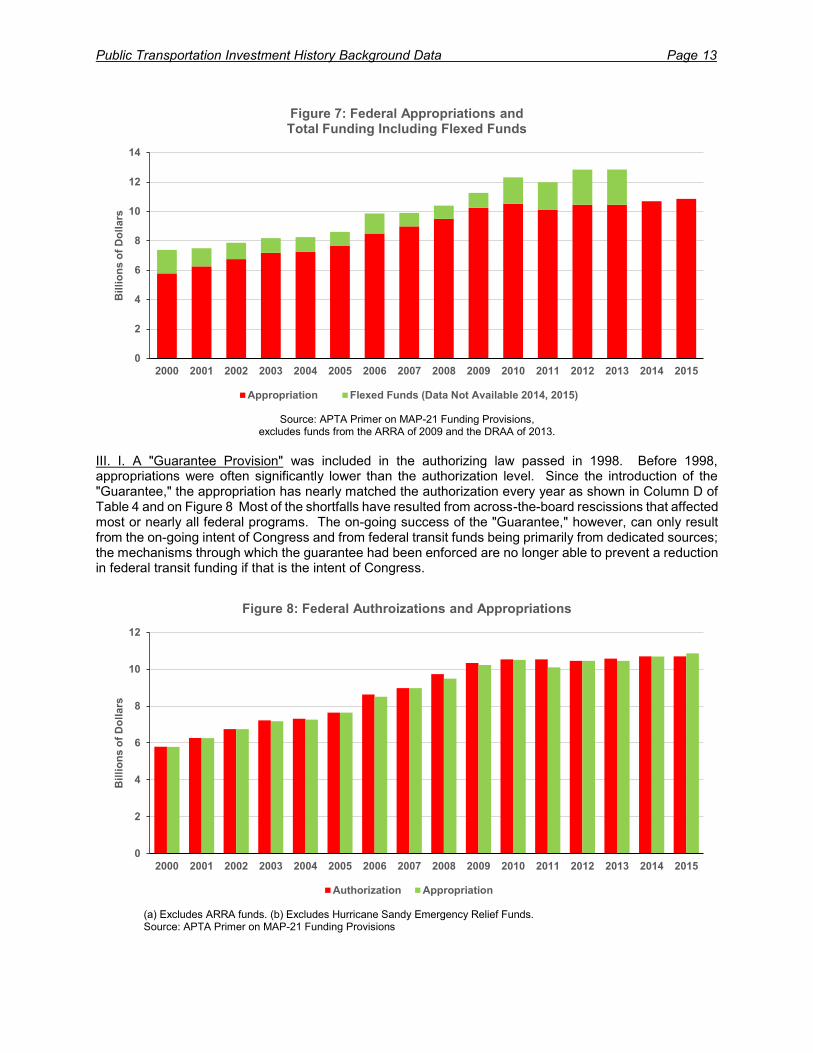
III. G. Federal transit funding programs have provided transit funding since 1964. Table 4 and Figure 7 report federal funding from the Federal Transit Administration from 2000 through 2014. Authorizations and appropriations for the federal transit program, Title 49, Chapter 53, of the U.S. Code, are shown in Columns B and C of Table 4. An authorization is a long-term law, typically six years, that permits an annual appropriation of funds up to the amount authorized. The authorization also makes permanent changes to how the law operates, such as how funds are distributed and what activities they can be used for. The law which currently authorizes annual appropriations is the Moving Ahead for Progress in the 21st Century Act of 2012 (MAP 21) which became law on July 6, 2012. MAP 21 authorizes the transit program for FY 2013 and FY 2014, a shorter period than the last three authorizations. The annual appropriation determines the amount of money in each authorized program that will be given to the Federal Transit Administration in that year for distribution to transit systems and other recipients and to fund FTA operations. The determination of the amounts that are distributed to transit agencies or designated recipients is called an apportionment. Authorizations have grown from $5.8 billion in FY 2000 to $10.7 billion in FY 2014. III. H. Other federal funds are provided for transit investment. The American Recovery and Reinvestment Act of 2009 (ARRA) was enacted in February, 2009 to stimulate the economy. The ARRA appropriated a total of $787 billion including $48 billion for transportation of which $8.4 billion was specifically for transit capital investment. Transit funds were directed to seven programs. Over $7.5 billion or nearly 90 percent of the ARRA funds were apportioned through existing Federal Transit Administration formula programs with amounts available to recipients published in the Federal Register in early March 2009. The remaining $867 million was distributed through discretionary grants by the FTA. ARRA funds were in addition to funds provided under the regular, on-going FTA program authorized by SAFETEA-LU. They did not replace or substitute for those funds. These amounts are reported on row "2009 ARRA" on Table 4. The Disaster Relief Appropriations Act of 2013 (DRAA) appropriated $10.9 billion for use by the FTA to make grants "for relief efforts in the areas most affected by Hurricane Sandy." Of those funds, $5.383 billion could be used to "carry out projects related to reducing risk of damage from future disasters in areas impacted by Hurricane Sandy." These funds were authorized at the level of "such sums as are necessary" for use under 49 USC 5324 by MAP-21. These amounts are reported on row "2013 DRAA" on Table 4.
Figure 6: Growth in Operating Revenue by Source, 1995-2013
Passenger Fares Directly Generated and Local State Federal
Public Transportation Investment History Background Data Page 12
Table 4: Federal Transit Act Authorizations and Appropriations, 2000 to 2015 6
Fiscal Year
Federal Transit Program
Authorization (Millions) (a)
All Transit Appropriation (Millions) (a)
Percent of Authorized Funds
Appropriated (Millions) (a)
Flexed Funds (Millions)
Appropriation Plus Flexed Funds
(Millions)
(Column A) (Column B) (Column C) (Column D) (Column E) (Column F)
2000 5,797 5,786 99.8% 1,599 7,385
2001 6,271 6,261 99.8% 1,233 7,494
2002 6,747 6,747 100.0% 1,118 7,865
2003 7,226 7,179 99.3% 1,009 8,188
2004 7,309 7,266 99.4% 981 8,247
2005 7,646 7,646 100.0% 966 8,612
2006 8,623 8,505 98.6% 1,348 9,853
2007 8,975 8,975 100.0% 923 9,898
2008 9,731 9,492 97.5% 894 10,386
2009 10,338 10,231 99.0% (b) 1,026 11,257
2009 ARRA (a,c) 8,400 8,400 100.0% In '09 through '12 8,400
2010 10,529 10,508 99.8% (b) 1,977 12,530
2011 10,529 10,098 95.9% (b) 1,890 12,187
2012 10,458 10,458 100.0% (b) 2,382 12,840
2013 10,578 10,455 98.8% (b) 2,399 12,854
2013 DRAA (a,d) ssaan (d) 10,900 --- --- 10,900
2014 10,695 10,691 99.9% NA NA
2015 10,695 10,858 101.5% NA NA
(a) Regular Fiscal Year amounts include only funds authorized by regular transit program under 49 USC 5300, amounts from other authorizing laws are not included except for the ARRA and DRAA. (b) Includes funds flexed from the ARRA. (c) American Recovery and Reinvestment Act of 2009 (ARRA) was a one-time funding program in addition to annual appropriations. (d) Appropriated by the Disaster Relief Appropriations Act of 2013 from authorization in MAP-21 for 49 USC 5324 Public Transportation Emergency Relief Program in the amount of "such sums as are necessary." NA = Not available until end of Fiscal Year.
Funds for specific uses have been authorized separately from MAP-21 and previous FTA authorizations. One such authorization currently in effect is Title VI – Capital and Preventive Maintenance Projects for Washington Metropolitan Area Transit Authority (WMATA) contained in the Federal Rail Safety Improvements Act of 2008. This Act provided $1.5 billion for WMATA in "increments" over 10 fiscal years beginning in FY 2009. Appropriations have been or near $150 million each year since then. These amounts, and amounts from other federal programs beyond regular FTA appropriation, the ARRA, and the DRAA, and not included in Table 4 or Figures 7 and 8. In addition to funds appropriated to Federal Transit Administration programs, some funds appropriated to the Federal Highway Administration for highway programs may be transferred to transit uses at the request of states. These amounts are shown as "Flexed Funds" in Column E of Table 4 and also on Figure 7. No specific amounts of funds are appropriated or apportioned to be flexed, therefore, the amounts are not known until the end of the year after the flexing decisions have occurred. Column F of Table 4 and Figure 7 show the total amount appropriated and flexed for transit uses. Some transit agencies receive federal funds from special transportation programs and non-transportation programs that are not included in these descriptions.
6 APTA Primer on Transit Finding, The Moving Ahead for Progress in the 21st Century Act and Other
Related Laws, FY 2013 Through FY 2015. Washington: American Public Transportation Association at http://www.apta.com/gap/policyresearch/Documents/APTA-Primer-Map-21-Funding.pdf
Public Transportation Investment History Background Data Page 13
Source: APTA Primer on MAP-21 Funding Provisions, excludes funds from the ARRA of 2009 and the DRAA of 2013.
III. I. A "Guarantee Provision" was included in the authorizing law passed in 1998. Before 1998, appropriations were often significantly lower than the authorization level. Since the introduction of the "Guarantee," the appropriation has nearly matched the authorization every year as shown in Column D of Table 4 and on Figure 8 Most of the shortfalls have resulted from across-the-board rescissions that affected most or nearly all federal programs. The on-going success of the "Guarantee," however, can only result from the on-going intent of Congress and from federal transit funds being primarily from dedicated sources; the mechanisms through which the guarantee had been enforced are no longer able to prevent a reduction in federal transit funding if that is the intent of Congress.
(a) Excludes ARRA funds. (b) Excludes Hurricane Sandy Emergency Relief Funds. Source: APTA Primer on MAP-21 Funding Provisions
Figure 8: Federal Authroizations and Appropriations
Authorization Appropriation
Public Transportation Investment History Background Data Page 14
III. J. Apportionments and Allocations. Federal assistance is distributed through a variety of programs that may be for specific uses such as state of good repair, elderly and disabled transportation, and bus capital programs; while funds from other programs can be used for any eligible expense such as urbanized area formula funds and rural formula funds. There are two distribution mechanisms, formulas and allocations. Formula programs distribute funds to all participants in a category. Formula distributions of funds are called apportionments. Urbanized Area Formula Funds, for example, are distributed to the designated recipients in all medium-size and large urbanized areas and to state Departments of Transportation for small urbanized areas by an apportionment. Formula programs typically fund needs that are on-going and evenly distributed over time such as vehicle or equipment purchases and vehicle and facility maintenance. Allocated programs typically fund "lumpy programs" where needs are large but not continuous such as fixed-guideway new starts and extensions or facility construction. Allocated programs usually have the recipients selected each year by Congress but Congress often defers allocating a portion or all of a program's funds, instructing the Federal Transit Administration to make allocations for those funds. In recent years Congress has not made allocations and the FTA has selected the recipients of allocated programs. The term "apportionment" is also used for the document that publishes both the apportionment of formula funds and allocation of discretionary funds each year. A detailed history of the enactment of and descriptions of formulas and the allocation process and other provisions of federal funding laws can be found in the APTA Primer on Transit Finding, The Moving Ahead for Progress in the 21st Century Act and Other Related Laws, FY 2013 Through FY 2015.7
IV. What Transit Funds Are Spent For IV. A. Capital expenditures are defined in two ways. In the National Transit Database capital expenditures are spending for acquisition of equipment and construction of facilities. In federal funding law, however, capital uses are any uses designated as eligible by the law and include capital expenditures as defined in the National Transit Database plus expenses for maintenance of vehicles and facilities and some planning activities considered to be operating expenditures in the National Transit Database.
Capital expenditures as defined by the National Transit Database, categorized by their use, are shown on Table 5. These amounts are expanded to include all transit systems, not just those reporting to the NTD. The larger part of capital expenditure goes for facility construction, in 2013 a total of 59.2 percent, including 35.2 percent for fixed-guideways, 16.3 percent for stations, and 7.7 percent for administration buildings and maintenance facilities.
Vehicles accounted for 24.9 percent of capital expenditures in 2013, 24.2 percent of which was for passenger vehicles and 0.7 percent for service vehicles. Fare revenue collection equipment accounted for 1.1 percent of capital expenditures in 2013, communication and information systems for 8.7 percent, and other capital uses for 6.1 percent.
7 APTA Primer on Transit Finding, The Moving Ahead for Progress in the 21st Century Act and Other
Related Laws, FY 2013 Through FY 2015. Washington: American Public Transportation Association at http://www.apta.com/gap/policyresearch/Documents/APTA-Primer-Map-21-Funding.pdf
(a) Includes all types of bus service. (b) Includes hybrid rail. (c) Includes streetcar. Note: All capital expense as defined by National Transit Database accounting system; but also includes amounts for all transit agencies not reporting in the NTD. Source: APTA Public Transportation Fact Book and supporting data.
Public Transportation Investment History Background Data Page 16
IV.B. Vehicle Fleet Size and Vehicle Purchases are reported for on Tables 6 and 7. These data are taken from the 2015 APTA Public Transportation Fact Book, Appendix A: Historical Data.8 These data have limitations. They are expansions estimated from sources that report vehicles by the mode of service in which they operate. For rail vehicles this is obvious, heavy rail service is operated by heavy rail vehicles, etc. For roadway service, however, this can be misleading. Bus service is fixed-route service and any variations of fixed-route service that offer variable destination or times. This service may be provided by the physical vehicle called a bus or it may be provided by vans or other vehicles not normally called buses. In the same way, demand response service is a variable origin and destination service. The service is normally provided by vans but some demand response service is operated by buses or larger vehicles that might be called buses. The growth in the entire transit fleet over the past 19 years is illustrated on Figure 9, also based on data in the 2015 APTA Public Transportation Fact Book, Appendix A: Historical Data.
Source: 2015 APTA Public Transportation Fact Book Historical Appendix
On Table 6 and Table 7 there is a discontinuity between 2006 and 2007 for roadway vehicles. This results from the availability of extensive data for rural transit service providers for the first time in 2007. Beginning during World War II, when the ATA (the American Transit Association, an APTA predecessor) first published data in the Transit Fact Book, data reported to the ATA by ATA members were expanded to the entire transit industry based on data that had been reported by the United States Census Bureau in, by then, discontinued surveys of transportation and from data from other available sources. The Federal Transit Administration's National Transit Database (NTD) replaced APTA surveys as the primary source for data expansion beginning in 1982 but the NTD only collected data for urbanized area transit agencies receiving federal financial assistance, not for rural agencies or agencies in urbanized areas not receiving federal assistance. Amounts for non-reporting agencies and rural agencies continued to be estimated by APTA from available data. The 1990 and 2000 Censuses expanded the number of urbanized areas and the size of urbanized areas, thus expanding the number of transit agencies included in NTD data. At the same time the number of agencies in areas that were still rural was believed to have grown. For the 2007 report year, NTD data for rural transit agencies were made available on request but were not yet published on the NTD web site. Although a data set with a limited number of items, the number of vehicles by physical characteristics and the amount of service by mode were reported; but data for vehicles by mode were not included. This led to a change is the number of vehicles by mode for national data
8 APTA Fact Book Appendix A: Historical Tables. Washington: American Public Transportation Association at http://www.apta.com/resources/statistics/Documents/FactBook/2015-APTA-Fact-Book-Appendix-A.pdf
0
20,000
40,000
60,000
80,000
100,000
120,000
140,000
160,000
180,000
200,000
Tra
nsit P
assener
Vehic
les
Figure 9: The Public Transportation Vehicle FleetHas Expanded Steadily
Public Transportation Investment History Background Data Page 17
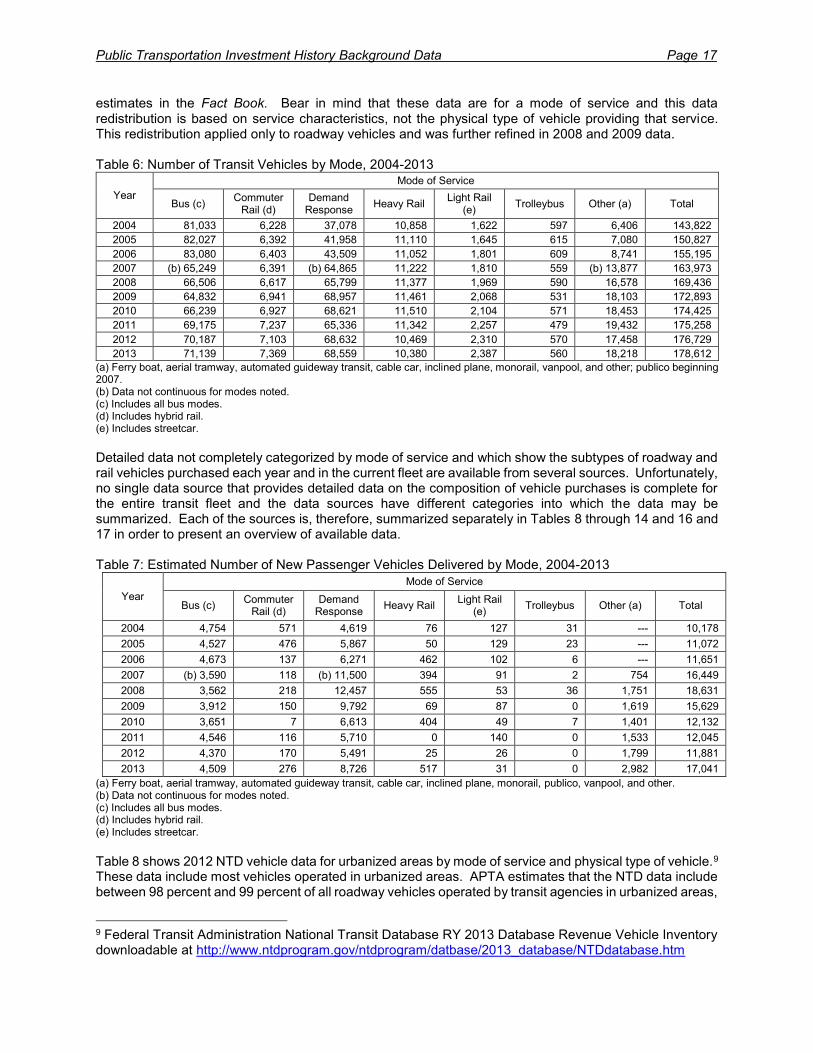
estimates in the Fact Book. Bear in mind that these data are for a mode of service and this data redistribution is based on service characteristics, not the physical type of vehicle providing that service. This redistribution applied only to roadway vehicles and was further refined in 2008 and 2009 data. Table 6: Number of Transit Vehicles by Mode, 2004-2013
(a) Ferry boat, aerial tramway, automated guideway transit, cable car, inclined plane, monorail, vanpool, and other; publico beginning 2007. (b) Data not continuous for modes noted. (c) Includes all bus modes. (d) Includes hybrid rail. (e) Includes streetcar.
Detailed data not completely categorized by mode of service and which show the subtypes of roadway and rail vehicles purchased each year and in the current fleet are available from several sources. Unfortunately, no single data source that provides detailed data on the composition of vehicle purchases is complete for the entire transit fleet and the data sources have different categories into which the data may be summarized. Each of the sources is, therefore, summarized separately in Tables 8 through 14 and 16 and 17 in order to present an overview of available data. Table 7: Estimated Number of New Passenger Vehicles Delivered by Mode, 2004-2013
Year
Mode of Service
Bus (c) Commuter
Rail (d) Demand
Response Heavy Rail
Light Rail (e)
Trolleybus Other (a) Total
2004 4,754 571 4,619 76 127 31 --- 10,178
2005 4,527 476 5,867 50 129 23 --- 11,072
2006 4,673 137 6,271 462 102 6 --- 11,651
2007 (b) 3,590 118 (b) 11,500 394 91 2 754 16,449
2008 3,562 218 12,457 555 53 36 1,751 18,631
2009 3,912 150 9,792 69 87 0 1,619 15,629
2010 3,651 7 6,613 404 49 7 1,401 12,132
2011 4,546 116 5,710 0 140 0 1,533 12,045
2012 4,370 170 5,491 25 26 0 1,799 11,881
2013 4,509 276 8,726 517 31 0 2,982 17,041
(a) Ferry boat, aerial tramway, automated guideway transit, cable car, inclined plane, monorail, publico, vanpool, and other. (b) Data not continuous for modes noted. (c) Includes all bus modes. (d) Includes hybrid rail. (e) Includes streetcar.
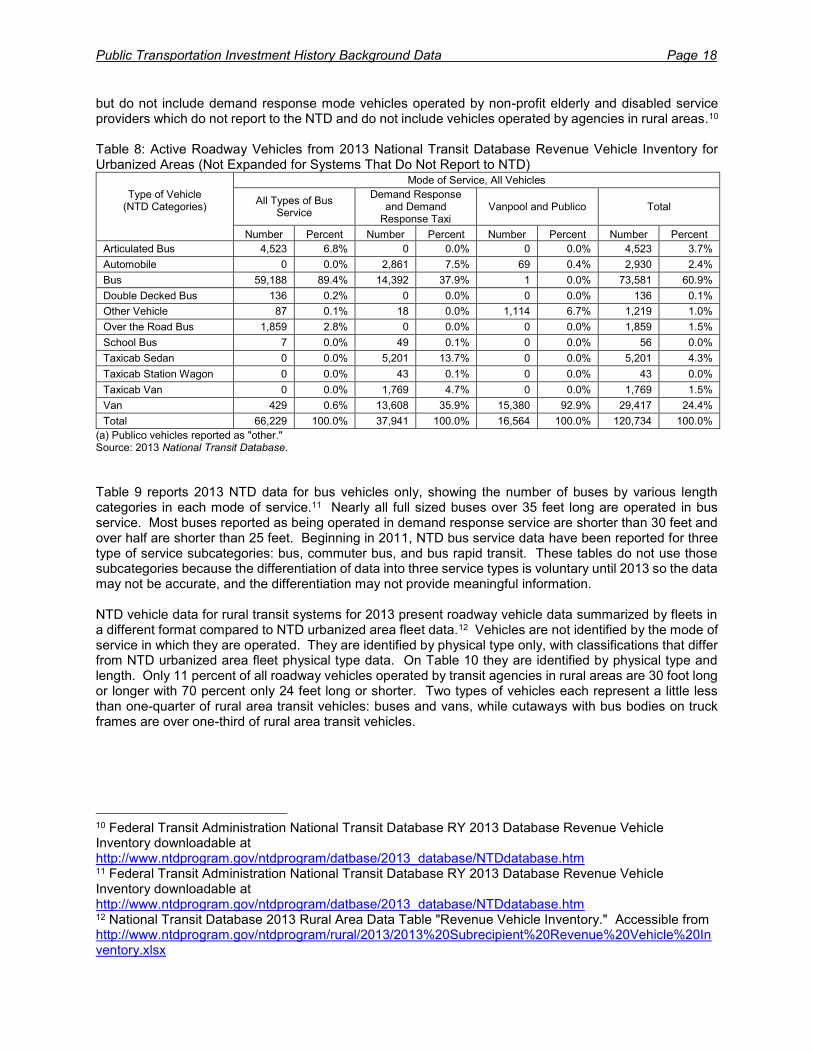
Table 8 shows 2012 NTD vehicle data for urbanized areas by mode of service and physical type of vehicle.9 These data include most vehicles operated in urbanized areas. APTA estimates that the NTD data include between 98 percent and 99 percent of all roadway vehicles operated by transit agencies in urbanized areas,
9 Federal Transit Administration National Transit Database RY 2013 Database Revenue Vehicle Inventory downloadable at http://www.ntdprogram.gov/ntdprogram/datbase/2013_database/NTDdatabase.htm
Public Transportation Investment History Background Data Page 18
but do not include demand response mode vehicles operated by non-profit elderly and disabled service providers which do not report to the NTD and do not include vehicles operated by agencies in rural areas.10 Table 8: Active Roadway Vehicles from 2013 National Transit Database Revenue Vehicle Inventory for Urbanized Areas (Not Expanded for Systems That Do Not Report to NTD)
Type of Vehicle (NTD Categories)
Mode of Service, All Vehicles
All Types of Bus Service
Demand Response and Demand
Response Taxi Vanpool and Publico Total
Number Percent Number Percent Number Percent Number Percent
Articulated Bus 4,523 6.8% 0 0.0% 0 0.0% 4,523 3.7%
Automobile 0 0.0% 2,861 7.5% 69 0.4% 2,930 2.4%
Bus 59,188 89.4% 14,392 37.9% 1 0.0% 73,581 60.9%
Double Decked Bus 136 0.2% 0 0.0% 0 0.0% 136 0.1%
Other Vehicle 87 0.1% 18 0.0% 1,114 6.7% 1,219 1.0%
Over the Road Bus 1,859 2.8% 0 0.0% 0 0.0% 1,859 1.5%
School Bus 7 0.0% 49 0.1% 0 0.0% 56 0.0%
Taxicab Sedan 0 0.0% 5,201 13.7% 0 0.0% 5,201 4.3%
Van 429 0.6% 13,608 35.9% 15,380 92.9% 29,417 24.4%
Total 66,229 100.0% 37,941 100.0% 16,564 100.0% 120,734 100.0%
(a) Publico vehicles reported as "other." Source: 2013 National Transit Database.
Table 9 reports 2013 NTD data for bus vehicles only, showing the number of buses by various length categories in each mode of service.11 Nearly all full sized buses over 35 feet long are operated in bus service. Most buses reported as being operated in demand response service are shorter than 30 feet and over half are shorter than 25 feet. Beginning in 2011, NTD bus service data have been reported for three type of service subcategories: bus, commuter bus, and bus rapid transit. These tables do not use those subcategories because the differentiation of data into three service types is voluntary until 2013 so the data may not be accurate, and the differentiation may not provide meaningful information. NTD vehicle data for rural transit systems for 2013 present roadway vehicle data summarized by fleets in a different format compared to NTD urbanized area fleet data.12 Vehicles are not identified by the mode of service in which they are operated. They are identified by physical type only, with classifications that differ from NTD urbanized area fleet physical type data. On Table 10 they are identified by physical type and length. Only 11 percent of all roadway vehicles operated by transit agencies in rural areas are 30 foot long or longer with 70 percent only 24 feet long or shorter. Two types of vehicles each represent a little less than one-quarter of rural area transit vehicles: buses and vans, while cutaways with bus bodies on truck frames are over one-third of rural area transit vehicles.
10 Federal Transit Administration National Transit Database RY 2013 Database Revenue Vehicle Inventory downloadable at http://www.ntdprogram.gov/ntdprogram/datbase/2013_database/NTDdatabase.htm 11 Federal Transit Administration National Transit Database RY 2013 Database Revenue Vehicle Inventory downloadable at http://www.ntdprogram.gov/ntdprogram/datbase/2013_database/NTDdatabase.htm 12 National Transit Database 2013 Rural Area Data Table "Revenue Vehicle Inventory." Accessible from http://www.ntdprogram.gov/ntdprogram/rural/2013/2013%20Subrecipient%20Revenue%20Vehicle%20Inventory.xlsx
Public Transportation Investment History Background Data Page 19
Table 9: Active Bus Vehicles by Length and Mode of Service from 2013 National Transit Database Revenue Vehicle Inventory for Urbanized Areas (Bus Vehicles Only in Urbanized Areas with All Modes of Service Combined)
Length of Vehicle
Mode of Service for Bus Vehicles Only
Bus Vehicles in All Types of Bus Service
Bus Vehicles in Demand Response
and Demand Response Taxi
Service
Bus Vehicles in Vanpool and Publico
Service Total Bus Vehicles
Number Percent Number Percent Number Percent Number Percent
46 ft and Longer 4,807 7.4% 4 0.0% 0 0.0% 4,811 6.1%
42 ft to 45 ft 5,428 8.3% 3 0.0% 0 0.0% 5,431 6.9%
35 ft to 41 ft 46,060 70.7% 72 0.5% 0 0.0% 46,132 58.7%
30 ft to 34 ft 3,937 6.0% 317 2.4% 0 0.0% 4,254 5.4%
25 ft to 29 ft 3,695 5.7% 4,898 36.6% 1 100.0% 8,594 10.9%
24 ft and Shorter 1,227 1.9% 8,104 60.5% 0 0.0% 9,331 11.9%
Table 10: Active Roadway Vehicles by Type of Vehicle and Length from 2013 National Transit Database Revenue Vehicle Inventory for Rural Areas (Rural Areas Only, All Modes of Service Combined)
Length of Vehicle
Type of Vehicle, Rural Areas Only
Bus, All Types
Cutaway Van Automobile,
Minivan, and SUV
Other Total
Number Number Number Number Number Number Percent
35 ft and Longer 1,142 37 0 0 0 1,179 5.4%
30 ft to 34 ft 802 338 4 0 0 1,144 5.2%
25 ft to 29 ft 1,198 3,061 11 0 0 4,270 19.5%
24 ft and Shorter 387 7,191 3,510 4,259 2 15,349 70.0%
Total, Number 3,529 10,627 3,525 4,259 2 21,942 100.0%
Source: Calculated from National Transit Database 2013 rural data.
The roadway vehicle fleet is also identified by year of manufacture in the NTD urbanized area vehicle inventory. The number of vehicles by year of manufacture for the past five years from both the 2013 NTD and the 2012 NTD13 are shown on Table 11. The year of manufacture is a calendar year whereas the reporting year for each transit agency is that agency's fiscal year that ends during the calendar year. This results in the current year for each report being, therefore, significantly underreported. A comparison of the 2013 and 2012 report data shows some variations which indicate that the year for which a vehicle is identified may vary because of probable uncertainty over year of delivery compared to year of manufacture and model year.
13 Federal Transit Administration National Transit Database RY 2013 Database Revenue Vehicle Inventory downloadable at and http://www.ntdprogram.gov/ntdprogram/datbase/2013_database/NTDdatabase.htm Federal Transit Administration National Transit Database RY 2012 Database Revenue Vehicle Inventory downloadable at http://www.ntdprogram.gov/ntdprogram/datbase/2012_database/NTDdatabase.htm
Public Transportation Investment History Background Data Page 20
Table 11: Roadway Vehicles Listed in 2013 and 2012 National Transit Database Revenue Vehicle Inventory for Urbanized Areas by Year Built (Urbanized Area Data Only)
Vehicle Type
From 2013 National Transit Database, Reported Year of Manufacture
From 2012 National Transit Database, Reported Year of Manufacture
2013 2012 2011 2010 2009 2012 2011 2010 2009 2008
Bus, 46 ft and Longer 163 553 305 420 219 317 303 386 180 405
Bus, 35 ft to 45 ft 1,532 3,236 2,937 3,502 3,633 1,613 2,900 3,307 3,004 4,360
Bus, 34 ft or Shorter 1,391 2,517 2,133 2,133 2,848 1,213 1,808 2,904 2,794 3,299
Vans and Other 3,200 4,370 3,649 2,887 2,960 2,672 3,702 3,052 3,393 3,460
Data in shaded areas are only for that part of each agency's fiscal year which falls within that calendar year, therefore, the data are incomplete.
(a) Includes only buses for which both year built and length data were reported and other vehicles for which year built data were reported. Source: National Transit Database, 2013 and 2012.
Data are also available about the number of rail vehicles manufactured. Table 12 reports rail vehicles by year of manufacture for the previous five years from the 2013 NTD and the 2012 NTD.14 Once again agencies are reporting their fiscal year that ended during the Calendar Year 2013 or 2012. Because of this the current year for each report is significantly underreported. The rail data show the same phenomena as bus data where the year of manufacture for vehicles appears to vary between the two reports. Table 12: Rail Vehicles Listed in 2013 and 2012 National Transit Database Revenue Vehicle Inventory for Urbanized Areas by Year Built (Urbanized Area Data Only)
Vehicle Type
From 2013 National Transit Database Reported Year of Manufacture
From 2012 National Transit Database Reported Year of Manufacture
Data in shaded areas are only for that part of each agency's fiscal year which falls within that calendar year, therefore, the data are incomplete.
Source: National Transit Database, 2013 and 2012.
The NTD Database Revenue Vehicle Inventory for urbanized areas also indicates which vehicle fleets were purchased with federal financial assistance. Data for vehicles from urbanized areas, reported on Table 1315 identifies three funding source categories: vehicles purchased with federal financial assistance from the Urbanized Area Formula Program, vehicles purchased with assistance from other federal funding programs, and vehicles purchased without any federal assistance. When a vehicle is purchased with
14 Federal Transit Administration National Transit Database RY 2013 Database Revenue Vehicle Inventory downloadable at and http://www.ntdprogram.gov/ntdprogram/datbase/2013_database/NTDdatabase.htm Federal Transit Administration National Transit Database RY 2012 Database Revenue Vehicle Inventory downloadable at http://www.ntdprogram.gov/ntdprogram/datbase/2012_database/NTDdatabase.htm 15 Federal Transit Administration National Transit Database RY 2013 Database Revenue Vehicle Inventory downloadable at and http://www.ntdprogram.gov/ntdprogram/datbase/2013_database/NTDdatabase.htm
Public Transportation Investment History Background Data Page 21
federal financial assistance, under normal circumstances the state or local government pays a portion or "share" of the cost. The ratio can be up to 80 percent from the federal share and as low as 20 percent from the state and local share. For some vehicles, especially rail cars purchased for a new rail system, the federal share is lower than 80 percent. Details of federal funding laws can be found in the APTA Primer on Transit Funding: The Moving Ahead for Progress in the 21st Century Act and Other Related Laws, FY 2013 Through FY 2015.16 Of all vehicles reported in the 2013 NTD, regardless of the year in which they were manufactured, 64 percent of vehicles in use in urbanized areas were purchased with federal financial assistance including 82 percent of buses, 29 percent of vans and automobiles, 63 percent of rail vehicles, and 45 percent of ferry boats. In this table, buses and vans refer to physical types of vehicles, not to modes of service. Thirty-six percent of vehicles in urbanized areas had been purchased without federal assistance. The lower value of the percent using federal assistance for rail vehicles compared to buses may be due in part to the age of rail vehicles. As is shown on Table 16, over one-fifth of rail vehicles were purchased before 1980 when the federal financial program was relatively small. Table 13: Active Transit Vehicles by Source of Federal Funding from 2013 National Transit Database Revenue Vehicle Inventory for Urbanized Areas (Vehicles Only in Urbanized Areas)
Funding Source
Type of Vehicle
All Bus Vans and
Automobile Based
All Rail Ferry Boat All Vehicles
Number of Vehicles
Urbanized Area Formula Program 54,825 7,271 8,213 59 70,368
Other Federal Programs 13,375 4,638 5,928 12 23,953
Subtotal All Federal Programs 68,200 11,909 14,141 71 94,321
No Federal Funding 15,408 29,689 8,171 86 53,354
Total 83,608 41,598 22,312 157 147,675
Percent of Each Column
Urbanized Area Formula Program 65.6% 17.5% 36.8% 37.6% 47.7%
Other Federal Programs 16.0% 11.1% 26.6% 7.6% 16.2%
Subtotal All Federal Programs 81.6% 28.6% 63.4% 45.2% 63.9%
No Federal Funding 18.4% 71.4% 36.6% 54.8% 36.1%
Total 100.0% 100.0% 100.0% 100.0% 100.0%
Source: National Transit Database, 2013
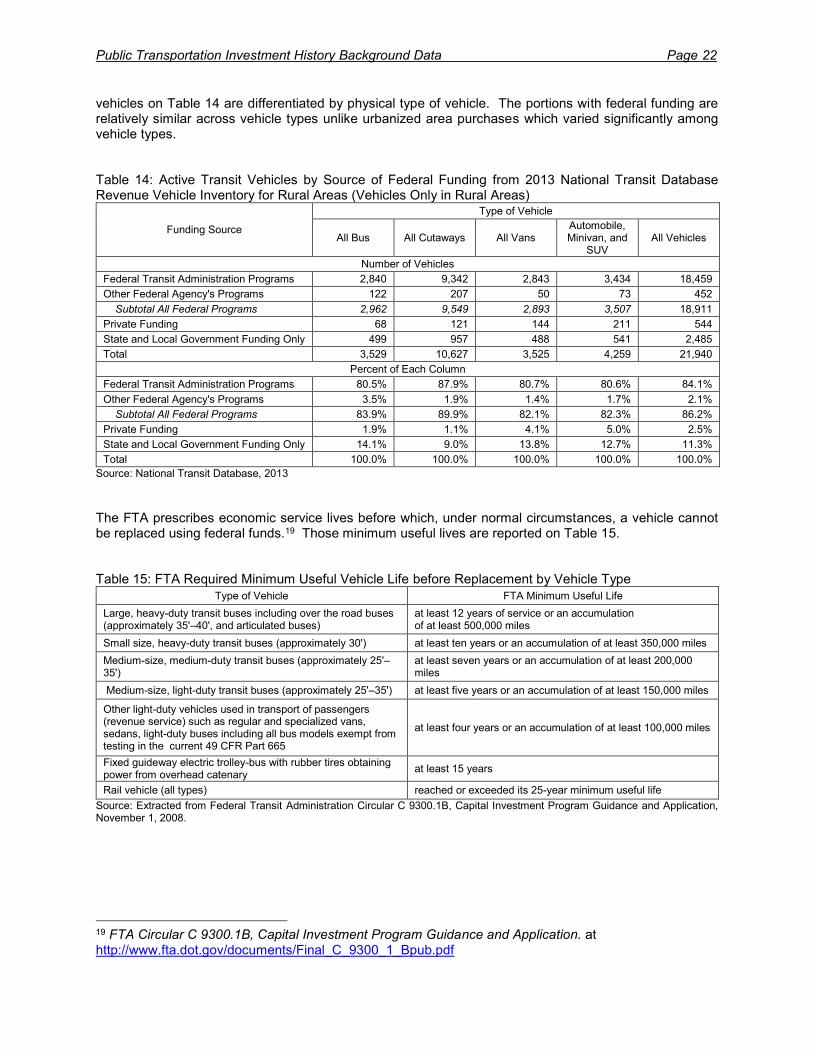
Table 14 reports the portion of vehicles in service, regardless of age, in rural areas purchased with federal financial assistance. 17 The categories of financial assistance are different from those in Table 13 for vehicles in urbanized areas. The categories are Federal Transit Administration Programs, Other Federal Agency's Programs, Private Funding, and State and Local Government Funding Only. The FTA funding programs are primarily Outside of Urbanized Areas [Rural] Assistance and Bus and Bus Capital Assistance. As with urbanized area programs, rural program federal funding also requires a state and local share or "match," with a maximum federal share of 80 percent under normal circumstances. Details of federal funding laws can be found in the APTA Primer on Transit Finding, The Moving Ahead for Progress in the 21st Century Act and Other Related Laws, FY 2013 Through FY 2015.18 A larger portion of rural vehicles, 85 percent overall, were purchased with federal assistance compared to urbanized area vehicles where the overall portion purchased with federal assistance was 64 percent. The
16 APTA Primer on Transit Funding: The Moving Ahead for Progress in the 21st Century Act and Other Related Laws, FY 2013 Through FY 2015. Washington: American Public Transportation Association at http://www.apta.com/resources/reportsandpublications/Documents/APTA-Primer-MAP-21-Funding.pdf 17 National Transit Database 2012 Rural Area Data Table "Revenue Vehicle Inventory." Accessible from http://www.ntdprogram.gov/ntdprogram/rural/2012/2012_Revenue%20Vehicle%20Inventory.xlsx 18 APTA Primer on Transit Finding, The Moving Ahead for Progress in the 21st Century Act and Other
Related Laws, FY 2013 Through FY 2015. Washington: American Public Transportation Association at http://www.apta.com/gap/policyresearch/Documents/APTA-Primer-Map-21-Funding.pdf
Public Transportation Investment History Background Data Page 22
vehicles on Table 14 are differentiated by physical type of vehicle. The portions with federal funding are relatively similar across vehicle types unlike urbanized area purchases which varied significantly among vehicle types. Table 14: Active Transit Vehicles by Source of Federal Funding from 2013 National Transit Database Revenue Vehicle Inventory for Rural Areas (Vehicles Only in Rural Areas)
Funding Source
Type of Vehicle
All Bus All Cutaways All Vans Automobile, Minivan, and
SUV All Vehicles
Number of Vehicles
Federal Transit Administration Programs 2,840 9,342 2,843 3,434 18,459
Other Federal Agency's Programs 122 207 50 73 452
Subtotal All Federal Programs 2,962 9,549 2,893 3,507 18,911
Private Funding 68 121 144 211 544
State and Local Government Funding Only 499 957 488 541 2,485
Total 3,529 10,627 3,525 4,259 21,940
Percent of Each Column
Federal Transit Administration Programs 80.5% 87.9% 80.7% 80.6% 84.1%
Other Federal Agency's Programs 3.5% 1.9% 1.4% 1.7% 2.1%
Subtotal All Federal Programs 83.9% 89.9% 82.1% 82.3% 86.2%
Private Funding 1.9% 1.1% 4.1% 5.0% 2.5%
State and Local Government Funding Only 14.1% 9.0% 13.8% 12.7% 11.3%
Total 100.0% 100.0% 100.0% 100.0% 100.0%
Source: National Transit Database, 2013 The FTA prescribes economic service lives before which, under normal circumstances, a vehicle cannot be replaced using federal funds.19 Those minimum useful lives are reported on Table 15. Table 15: FTA Required Minimum Useful Vehicle Life before Replacement by Vehicle Type
Type of Vehicle FTA Minimum Useful Life
Large, heavy-duty transit buses including over the road buses (approximately 35'–40', and articulated buses)
at least 12 years of service or an accumulation of at least 500,000 miles
Small size, heavy-duty transit buses (approximately 30') at least ten years or an accumulation of at least 350,000 miles
at least seven years or an accumulation of at least 200,000 miles
Medium-size, light-duty transit buses (approximately 25'–35') at least five years or an accumulation of at least 150,000 miles
Other light-duty vehicles used in transport of passengers (revenue service) such as regular and specialized vans, sedans, light-duty buses including all bus models exempt from testing in the current 49 CFR Part 665
at least four years or an accumulation of at least 100,000 miles
Fixed guideway electric trolley-bus with rubber tires obtaining power from overhead catenary
at least 15 years
Rail vehicle (all types) reached or exceeded its 25-year minimum useful life
Source: Extracted from Federal Transit Administration Circular C 9300.1B, Capital Investment Program Guidance and Application, November 1, 2008.
19 FTA Circular C 9300.1B, Capital Investment Program Guidance and Application. at http://www.fta.dot.gov/documents/Final_C_9300_1_Bpub.pdf
Public Transportation Investment History Background Data Page 23
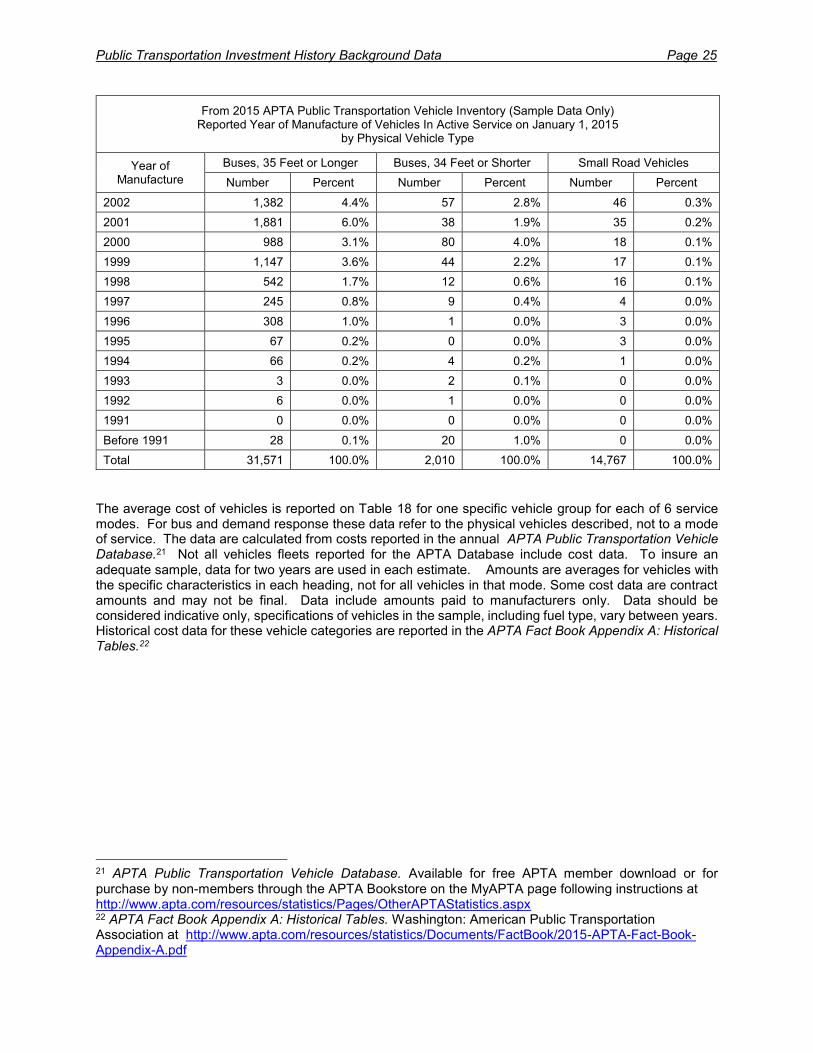
Both roadway and rail vehicles by year of manufacture and physical category are also found in the APTA 2015 Public Transportation Vehicle Database.20 Those data are reported on Table 16 for rail vehicles from 1980 through 2014 and Table 17 for roadway vehicles from 1990 through 2014. These time periods are chosen to exceed the FTA defined minimum life for replacement of a typical vehicle and show vehicles which might need replacement. Note that this data summary does not indicate how many vehicles have had mid-life overhauls which, especially for rail-cars, significantly extend their service lives. APTA 2015 Public Transportation Vehicle Database data are as of January 1, 2015, hence many vehicles manufactured in 2014 may not yet have been delivered and accepted by agencies and hence, may not be included in 2014 numbers. The APTA Public Transportation Vehicle Database includes only data from APTA members which voluntarily report their data; the data are not expanded to include the entire transit industry. The correct way to read Tables 16 and 17 is to pick a mode and year and read the data as the number of vehicles currently, on January 1, 2015, in active service which the agencies reporting to the APTA Public Transportation Vehicle Database. For example, on Table 17 under the columns "Buses, 35 Feet or Longer" and the row "2005" is "2,069" and "6.6%." This should be read as "On January 1, 2015, there were among the active buses 35 feet and longer in the fleets of the sample of systems reporting to the APTA database, 2,069 that were manufactured in 2003. This is 6.6% of all the active buses 35 feet or longer in those fleets on January 1, 2015." Table 16: Rail Vehicles by Year of Manufacture from 2015 APTA Public Transportation Vehicle Database (Data are a sample from an APTA member survey, they are NOT expanded to national totals)
From 2015 APTA Public Transportation Vehicle Inventory (Sample Data Only) Reported Year of Manufacture of Vehicles In Active Service on January 1, 2015
by Physical Vehicle Type
Year of Manufacture
Commuter Rail and Hybrid Rail Cars
Heavy Rail Cars Light Rail Cars and Streetcars
Number Percent Number Percent Number Percent
2014 104 2.14% 240 2.12% 18 1.08%
2013 276 5.68% 517 4.57% 0 0.00%
2012 162 3.33% 120 1.06% 0 0.00%
2011 117 2.41% 48 0.42% 152 9.10%
2010 48 0.99% 222 1.96% 116 6.94%
2009 32 0.66% 652 5.77% 1 0.06%
2008 20 0.41% 772 6.83% 87 5.21%
2007 57 1.17% 274 2.42% 132 7.90%
2006 359 7.39% 30 0.27% 59 3.53%
2005 416 8.56% 42 0.37% 24 1.44%
2004 442 9.10% 234 2.07% 94 5.63%
2003 297 6.11% 400 3.54% 81 4.85%
2002 62 1.28% 746 6.60% 9 0.54%
2001 37 0.76% 442 3.91% 25 1.50%
2000 110 2.26% 52 0.46% 47 2.81%
1999 129 2.66% 106 0.94% 79 4.73%
1998 126 2.59% 102 0.90% 18 1.08%
20 APTA Public Transportation Vehicle Database. Available for free APTA member download or for purchase by non-members through the APTA Bookstore on the MyAPTA page following instructions at http://www.apta.com/resources/statistics/Pages/OtherAPTAStatistics.aspx
Public Transportation Investment History Background Data Page 24
From 2015 APTA Public Transportation Vehicle Inventory (Sample Data Only) Reported Year of Manufacture of Vehicles In Active Service on January 1, 2015
by Physical Vehicle Type
Year of Manufacture
Commuter Rail and Hybrid Rail Cars
Heavy Rail Cars Light Rail Cars and Streetcars
Number Percent Number Percent Number Percent
1997 139 2.86% 86 0.76% 25 1.50%
1996 72 1.48% 13 0.12% 46 2.75%
1995 27 0.56% 92 0.81% 92 5.51%
1994 40 0.82% 68 0.60% 0 0.00%
1993 10 0.21% 290 2.57% 87 5.21%
1992 17 0.35% 112 0.99% 46 2.75%
1991 126 2.59% 0 0.00% 0 0.00%
1990 55 1.13% 14 0.12% 0 0.00%
1989 61 1.26% 297 2.63% 54 3.23%
1988 90 1.85% 720 6.37% 37 2.21%
1987 141 2.90% 90 0.80% 9 0.54%
1986 168 3.46% 946 8.37% 97 5.80%
1985 143 2.94% 468 4.14% 0 0.00%
1984 144 2.96% 293 2.59% 0 0.00%
1983 7 0.14% 281 2.49% 0 0.00%
1982 34 0.70% 339 3.00% 0 0.00%
1981 0 0.00% 142 1.26% 188 11.25%
Before 1981 790 16.26% 2,052 18.16% 48 2.87%
Total 4,858 100.00% 11,302 100.00% 1,671 100.00%
Table 17: Roadway Vehicles by Year of Manufacture from 2015 APTA Public Transportation Vehicle Database (Data are a sample from an APTA member survey, they are NOT expanded to national totals)
From 2015 APTA Public Transportation Vehicle Inventory (Sample Data Only) Reported Year of Manufacture of Vehicles In Active Service on January 1, 2015
by Physical Vehicle Type
Year of Manufacture
Buses, 35 Feet or Longer Buses, 34 Feet or Shorter Small Road Vehicles
Number Percent Number Percent Number Percent
2014 2,487 7.9% 119 5.9% 2,115 14.3%
2013 1,944 6.2% 153 7.6% 2,055 13.9%
2012 2,188 6.9% 136 6.8% 1,924 13.0%
2011 1,865 5.9% 86 4.3% 1,473 10.0%
2010 1,653 5.2% 175 8.7% 1,376 9.3%
2009 2,109 6.7% 258 12.8% 1,660 11.2%
2008 2,254 7.1% 117 5.8% 1,696 11.5%
2007 1,791 5.7% 160 8.0% 877 5.9%
2006 1,983 6.3% 226 11.2% 749 5.1%
2005 2,069 6.6% 133 6.6% 364 2.5%
2004 2,096 6.6% 105 5.2% 205 1.4%
2003 2,469 7.8% 74 3.7% 130 0.9%
Public Transportation Investment History Background Data Page 25
From 2015 APTA Public Transportation Vehicle Inventory (Sample Data Only) Reported Year of Manufacture of Vehicles In Active Service on January 1, 2015
by Physical Vehicle Type
Year of Manufacture
Buses, 35 Feet or Longer Buses, 34 Feet or Shorter Small Road Vehicles
Number Percent Number Percent Number Percent
2002 1,382 4.4% 57 2.8% 46 0.3%
2001 1,881 6.0% 38 1.9% 35 0.2%
2000 988 3.1% 80 4.0% 18 0.1%
1999 1,147 3.6% 44 2.2% 17 0.1%
1998 542 1.7% 12 0.6% 16 0.1%
1997 245 0.8% 9 0.4% 4 0.0%
1996 308 1.0% 1 0.0% 3 0.0%
1995 67 0.2% 0 0.0% 3 0.0%
1994 66 0.2% 4 0.2% 1 0.0%
1993 3 0.0% 2 0.1% 0 0.0%
1992 6 0.0% 1 0.0% 0 0.0%
1991 0 0.0% 0 0.0% 0 0.0%
Before 1991 28 0.1% 20 1.0% 0 0.0%
Total 31,571 100.0% 2,010 100.0% 14,767 100.0%
The average cost of vehicles is reported on Table 18 for one specific vehicle group for each of 6 service modes. For bus and demand response these data refer to the physical vehicles described, not to a mode of service. The data are calculated from costs reported in the annual APTA Public Transportation Vehicle Database.21 Not all vehicles fleets reported for the APTA Database include cost data. To insure an adequate sample, data for two years are used in each estimate. Amounts are averages for vehicles with the specific characteristics in each heading, not for all vehicles in that mode. Some cost data are contract amounts and may not be final. Data include amounts paid to manufacturers only. Data should be considered indicative only, specifications of vehicles in the sample, including fuel type, vary between years. Historical cost data for these vehicle categories are reported in the APTA Fact Book Appendix A: Historical Tables.22
21 APTA Public Transportation Vehicle Database. Available for free APTA member download or for purchase by non-members through the APTA Bookstore on the MyAPTA page following instructions at http://www.apta.com/resources/statistics/Pages/OtherAPTAStatistics.aspx 22 APTA Fact Book Appendix A: Historical Tables. Washington: American Public Transportation Association at http://www.apta.com/resources/statistics/Documents/FactBook/2015-APTA-Fact-Book-Appendix-A.pdf
Average Cost $486,653 $2,400,000 $71,593 2,300,804 $3,300,000 $24,665
2013-2014
Sample Size 3,400 10 879 4 --- 177
Average Cost $486,986 $2,824,000 $83,698 $2,068,795 --- $26,462
2014-2015
Sample Size 4,335 --- 708 --- 78 360
Average Cost $504,464 --- $82,082 --- $3,374,510 $23,775
(a) Does not include articulated, double-deck, intercity, suburban, or trolley-replica buses of any length.
Source: American Public Transportation Vehicle Database, annual.
IV.C. Vehicle Fuel Types have steadily changed. Over the short eight-year period since 2007, the portion of bus service vehicles powered by diesel fuel engines has dropped from 80 percent to 52 percent as reported on Table 19. Natural gas, hybrid fuels, and biodiesel now power a significant and increasing portion of the transit buses.23 The same trend, when comparing the sum of diesel and gasoline fueled vehicles, is not as strong for vehicles used in demand response service, most of which are smaller vehicles such as vans. The portion of demand response vehicles powered by diesel fuel or gasoline engines has declined more slowly, from 95 percent in 2007 to 83 percent in 2013. Self-propelled commuter rail cars are nearly all powered by electricity; unpowered cars are hauled by locomotives which are primarily diesel fueled. Other modes such are heavy rail, light rail, and trolleybus are either totally or approach totally electrically powered fleets. These data are based on the sample of agencies that participate in the APTA Public Transportation Vehicle Database. Some of the variation in these data may result from the changing set of participants in that annual sample.
23 APTA Public Transportation Vehicle Database. Available for free APTA member download or for purchase by non-members through the APTA Bookstore on the MyAPTA page following instructions at http://www.apta.com/resources/statistics/Pages/OtherAPTAStatistics.aspx
Public Transportation Investment History Background Data Page 27
Table 19: Percent of Bus, Demand Response, and Commuter Rail Vehicles by Type of Fuel from APTA Public Transportation Vehicle Database, 2007 through 2015 (Data are a sample from an APTA member survey, they are NOT adjusted to national totals)
Diesel 96.8% 83.3% 88.2% 88.7% 90.0% 89.3% 88.7% Source: American Public Transportation Vehicle Database, annual.
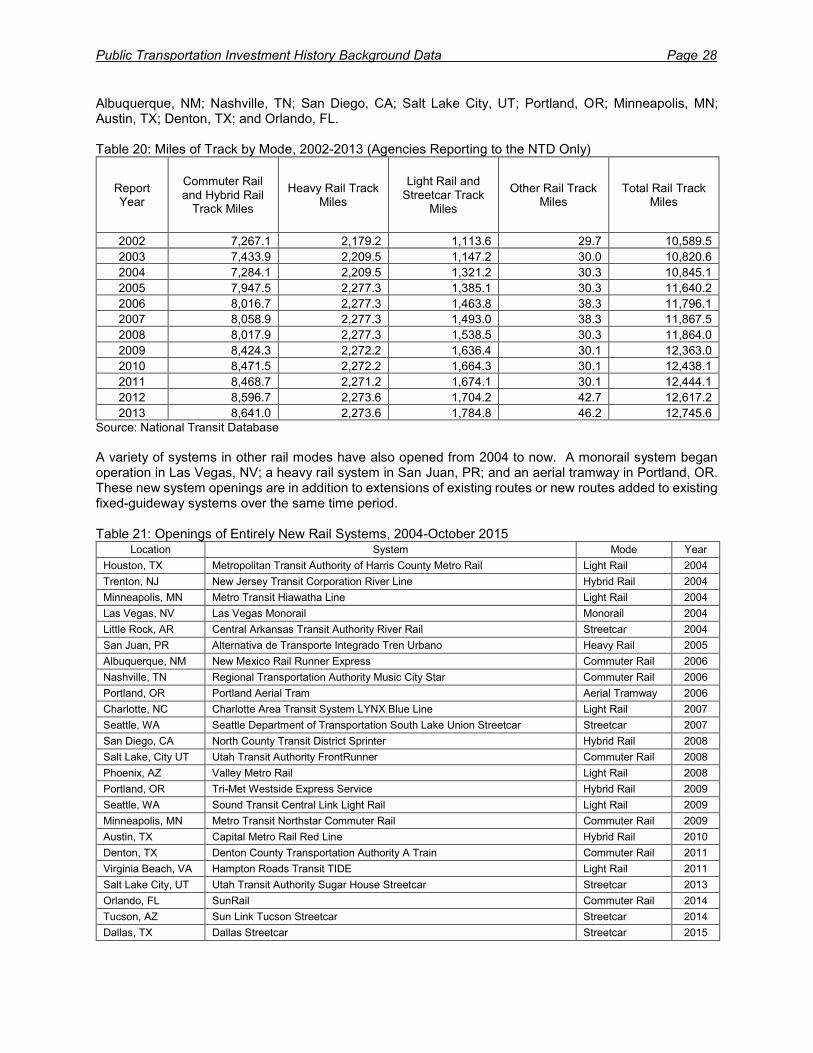
IV.D. Fixed-Guideway Infrastructure growth is described in the following tables. The NTD reports miles of track beginning in 2002. These data are shown on Table 20. Miles of track reported in the NTD include main line, siding, and yard trackage.24 From RY 2002 to RY 2013, miles of track for all modes increased 20 percent, from 10,590 miles to 12,746 miles. These data include only systems reporting to the NTD, they are not expanded to include non-reporting systems. Tables 20 and 22 recognize the new modes of service categories for the NTD beginning in 2011. For rail modes, what had been commuter railroad is now divided into commuter railroad and hybrid railroad, and what had been light rail is now divided into light rail and streetcar. Two systems formerly listed as light rail were also reclassified as hybrid rail. These modes are combined for this report because the data are not required to be reported separately until data are submitted for the 2013 NTD report. Data reported in voluntary divisions in 2011 and 2012 might be inaccurate and summing them into their former categories maintains comparability. Data for the new individual modes is available reported in the APTA Fact Book Appendix A: Historical Tables.25 Table 21 lists all entirely new fixed-guideway transit systems opened from 2004 through summer 2015. New extensions to existing fixed-route systems are not included. Ten entirely new light rail and streetcar systems have been opened in Houston, TX; Minneapolis, MN; Little Rock, AR; Charlotte, NC; Seattle, WA (2 systems); Phoenix, AZ; Virginia Beach, VA; Salt Lake City, UT; Tucson, AZ, and Dallas, TX. Entirely new commuter and hybrid rail systems opened in Trenton, NJ;
24 Federal Transit Administration National Transit Database, annual. See Table 23 at http://www.apta.com/resources/statistics/Pages/NTDDataTables.aspx 25 APTA Fact Book Appendix A: Historical Tables. Washington: American Public Transportation Association at http://www.apta.com/resources/statistics/Documents/FactBook/2015-APTA-Fact-Book-Appendix-A.pdf
Public Transportation Investment History Background Data Page 28
Albuquerque, NM; Nashville, TN; San Diego, CA; Salt Lake City, UT; Portland, OR; Minneapolis, MN; Austin, TX; Denton, TX; and Orlando, FL. Table 20: Miles of Track by Mode, 2002-2013 (Agencies Reporting to the NTD Only)
Report Year
Commuter Rail and Hybrid Rail
Track Miles
Heavy Rail Track Miles
Light Rail and Streetcar Track
Miles
Other Rail Track Miles
Total Rail Track Miles
2002 7,267.1 2,179.2 1,113.6 29.7 10,589.5
2003 7,433.9 2,209.5 1,147.2 30.0 10,820.6
2004 7,284.1 2,209.5 1,321.2 30.3 10,845.1
2005 7,947.5 2,277.3 1,385.1 30.3 11,640.2
2006 8,016.7 2,277.3 1,463.8 38.3 11,796.1
2007 8,058.9 2,277.3 1,493.0 38.3 11,867.5
2008 8,017.9 2,277.3 1,538.5 30.3 11,864.0
2009 8,424.3 2,272.2 1,636.4 30.1 12,363.0
2010 8,471.5 2,272.2 1,664.3 30.1 12,438.1
2011 8,468.7 2,271.2 1,674.1 30.1 12,444.1
2012 8,596.7 2,273.6 1,704.2 42.7 12,617.2
2013 8,641.0 2,273.6 1,784.8 46.2 12,745.6
Source: National Transit Database
A variety of systems in other rail modes have also opened from 2004 to now. A monorail system began operation in Las Vegas, NV; a heavy rail system in San Juan, PR; and an aerial tramway in Portland, OR. These new system openings are in addition to extensions of existing routes or new routes added to existing fixed-guideway systems over the same time period. Table 21: Openings of Entirely New Rail Systems, 2004-October 2015
Location System Mode Year
Houston, TX Metropolitan Transit Authority of Harris County Metro Rail Light Rail 2004
Trenton, NJ New Jersey Transit Corporation River Line Hybrid Rail 2004
Minneapolis, MN Metro Transit Hiawatha Line Light Rail 2004
Las Vegas, NV Las Vegas Monorail Monorail 2004
Little Rock, AR Central Arkansas Transit Authority River Rail Streetcar 2004
San Juan, PR Alternativa de Transporte Integrado Tren Urbano Heavy Rail 2005
Albuquerque, NM New Mexico Rail Runner Express Commuter Rail 2006
Nashville, TN Regional Transportation Authority Music City Star Commuter Rail 2006
Portland, OR Portland Aerial Tram Aerial Tramway 2006
Charlotte, NC Charlotte Area Transit System LYNX Blue Line Light Rail 2007
Seattle, WA Seattle Department of Transportation South Lake Union Streetcar Streetcar 2007
San Diego, CA North County Transit District Sprinter Hybrid Rail 2008
Salt Lake, City UT Utah Transit Authority FrontRunner Commuter Rail 2008
Phoenix, AZ Valley Metro Rail Light Rail 2008
Portland, OR Tri-Met Westside Express Service Hybrid Rail 2009
Seattle, WA Sound Transit Central Link Light Rail Light Rail 2009
Minneapolis, MN Metro Transit Northstar Commuter Rail Commuter Rail 2009
Austin, TX Capital Metro Rail Red Line Hybrid Rail 2010
Denton, TX Denton County Transportation Authority A Train Commuter Rail 2011
Virginia Beach, VA Hampton Roads Transit TIDE Light Rail 2011
Salt Lake City, UT Utah Transit Authority Sugar House Streetcar Streetcar 2013
Orlando, FL SunRail Commuter Rail 2014
Tucson, AZ Sun Link Tucson Streetcar Streetcar 2014
Dallas, TX Dallas Streetcar Streetcar 2015
Public Transportation Investment History Background Data Page 29
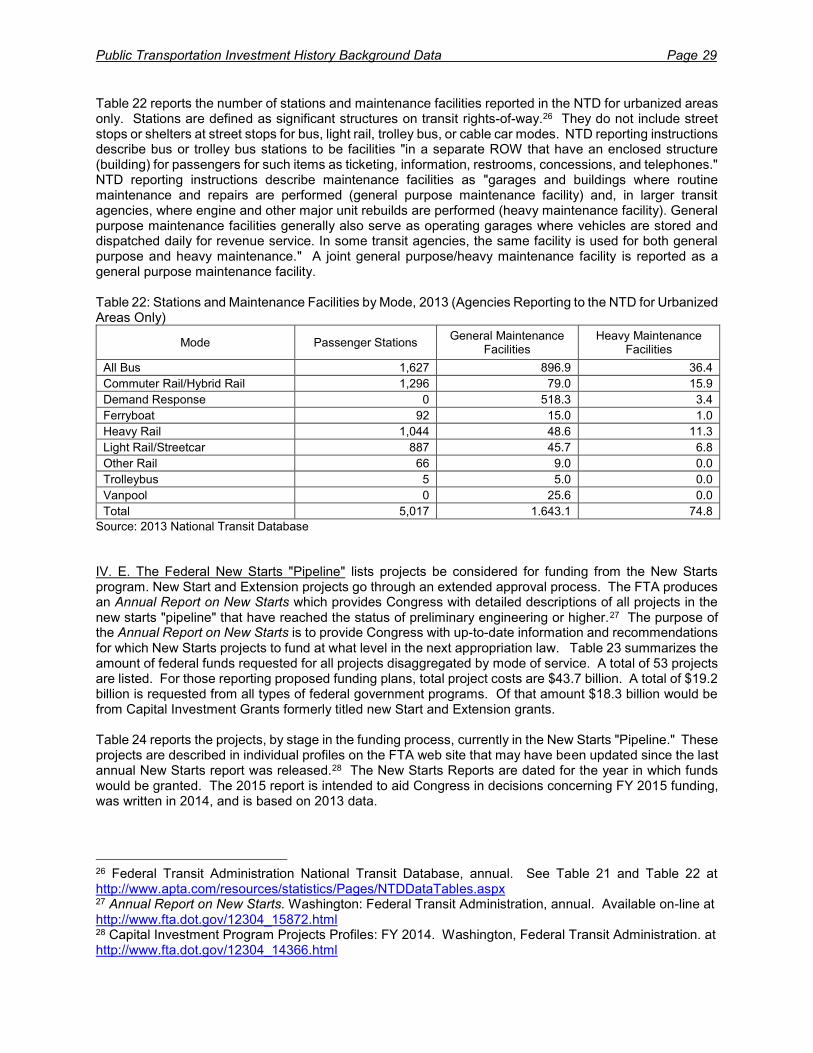
Table 22 reports the number of stations and maintenance facilities reported in the NTD for urbanized areas only. Stations are defined as significant structures on transit rights-of-way.26 They do not include street stops or shelters at street stops for bus, light rail, trolley bus, or cable car modes. NTD reporting instructions describe bus or trolley bus stations to be facilities "in a separate ROW that have an enclosed structure (building) for passengers for such items as ticketing, information, restrooms, concessions, and telephones." NTD reporting instructions describe maintenance facilities as "garages and buildings where routine maintenance and repairs are performed (general purpose maintenance facility) and, in larger transit agencies, where engine and other major unit rebuilds are performed (heavy maintenance facility). General purpose maintenance facilities generally also serve as operating garages where vehicles are stored and dispatched daily for revenue service. In some transit agencies, the same facility is used for both general purpose and heavy maintenance." A joint general purpose/heavy maintenance facility is reported as a general purpose maintenance facility. Table 22: Stations and Maintenance Facilities by Mode, 2013 (Agencies Reporting to the NTD for Urbanized Areas Only)
Mode Passenger Stations General Maintenance
Facilities Heavy Maintenance
Facilities
All Bus 1,627 896.9 36.4
Commuter Rail/Hybrid Rail 1,296 79.0 15.9
Demand Response 0 518.3 3.4
Ferryboat 92 15.0 1.0
Heavy Rail 1,044 48.6 11.3
Light Rail/Streetcar 887 45.7 6.8
Other Rail 66 9.0 0.0
Trolleybus 5 5.0 0.0
Vanpool 0 25.6 0.0
Total 5,017 1.643.1 74.8
Source: 2013 National Transit Database
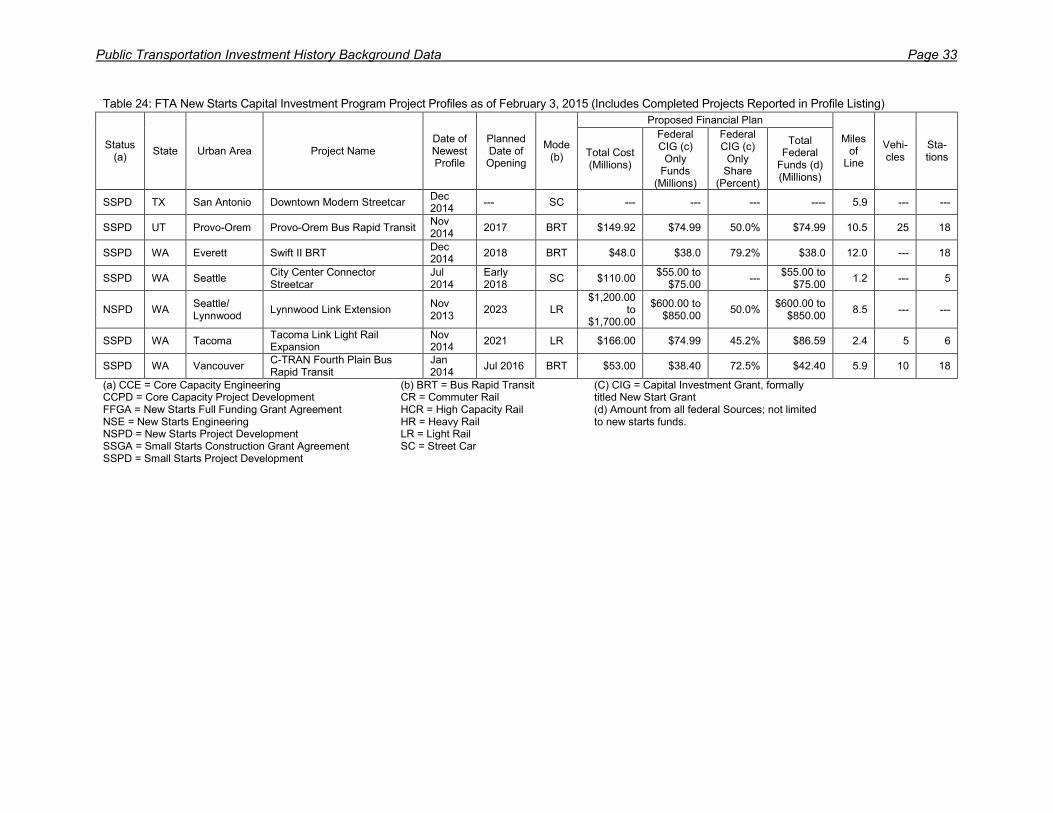
IV. E. The Federal New Starts "Pipeline" lists projects be considered for funding from the New Starts program. New Start and Extension projects go through an extended approval process. The FTA produces an Annual Report on New Starts which provides Congress with detailed descriptions of all projects in the new starts "pipeline" that have reached the status of preliminary engineering or higher.27 The purpose of the Annual Report on New Starts is to provide Congress with up-to-date information and recommendations for which New Starts projects to fund at what level in the next appropriation law. Table 23 summarizes the amount of federal funds requested for all projects disaggregated by mode of service. A total of 53 projects are listed. For those reporting proposed funding plans, total project costs are $43.7 billion. A total of $19.2 billion is requested from all types of federal government programs. Of that amount $18.3 billion would be from Capital Investment Grants formerly titled new Start and Extension grants. Table 24 reports the projects, by stage in the funding process, currently in the New Starts "Pipeline." These projects are described in individual profiles on the FTA web site that may have been updated since the last annual New Starts report was released.28 The New Starts Reports are dated for the year in which funds would be granted. The 2015 report is intended to aid Congress in decisions concerning FY 2015 funding, was written in 2014, and is based on 2013 data.
26 Federal Transit Administration National Transit Database, annual. See Table 21 and Table 22 at http://www.apta.com/resources/statistics/Pages/NTDDataTables.aspx 27 Annual Report on New Starts. Washington: Federal Transit Administration, annual. Available on-line at http://www.fta.dot.gov/12304_15872.html 28 Capital Investment Program Projects Profiles: FY 2014. Washington, Federal Transit Administration. at http://www.fta.dot.gov/12304_14366.html
Total All Modes 53 43,732.30 18,270.26 19,285.56 492.5 809 628
(a) As reported in Federal Transit Administration Annual Report on Funding Recommendation Fiscal Year 2016. (b) Includes amounts reported only; amounts are not expanded to account for projects not reporting data. (c) Includes federals funds that have already been appropriated.
Table 24: FTA New Starts Capital Investment Program Project Profiles as of February 3, 2015 (Includes Completed Projects Reported in Profile Listing)
Status (a)
State Urban Area Project Name Date of Newest Profile
Planned Date of Opening
Mode (b)
Proposed Financial Plan
Miles of
Line
Vehi-cles
Sta-tions Total Cost
(Millions)
Federal CIG (c)
Only Funds
(Millions)
Federal CIG (c)
Only Share
(Percent)
Total Federal
Funds (d) (Millions)
SSPD AZ Tempe Tempe Streetcar Apr 2013
Late 2017
SC $129.34 $56.00 43.3% $88.10 2.7 5 18
SSPD CA Fresno Fresno Area Express Blackstone/Kings Canyon BRT
Nov 2014
Late 2015
BRT $48.53 $38.82 80.0% $38.82 15.7 17 27
FFGA CA Los Angeles Regional Connector Transit Corridor
Jan 2015
2021 LR $1,402.93 $669.90 47.8% $733.90 1.9 4 3
FFGA CA Los Angeles Westside Purple Line Extension Section 1
Jan 2015
Oct 2024 HR $2,821.96 $1,250.0 44.3% $1,262.17 3.9 34 3
NSE CA Los Angeles Westside Purple Line Extension section 2
Nov 2014
Oct 2024 HR $2,374.44 $1,187.00 49.9% $1,356.00 2.6 20 2
SSPD CA Los Angeles Downtown Los Angeles Streetcar
Feb 2014
--- SC $153.00 to
$162.00 $74.99 --- $74.99 3.8 8 24
SSPD CA Sacramento Downtown Riverfront Streetcar Project
Nov 2014
Jan 2018 SC $165.93 $74.99 45.2% $79.99 4.0 8 25
NSPD CA San Diego Mid-Coast Corridor Transit Project
Nov 2014
May 2019
LR $2,112.11 $1,043.38 49.4% $1,043.38 10.9 36 9
FFGA CA San Francisco
Third Street Light Rail Phase 2 - Central Subway
Jan 2015
Dec 2018
LR $1,578.30 $942.2 59.7% $983.22 1.7 4 4
Public Transportation Investment History Background Data Page 31
Table 24: FTA New Starts Capital Investment Program Project Profiles as of February 3, 2015 (Includes Completed Projects Reported in Profile Listing)
Status (a)
State Urban Area Project Name Date of Newest Profile
Planned Date of Opening
Mode (b)
Proposed Financial Plan
Miles of
Line
Vehi-cles
Sta-tions Total Cost
(Millions)
Federal CIG (c)
Only Funds
(Millions)
Federal CIG (c)
Only Share
(Percent)
Total Federal
Funds (d) (Millions)
SSPD CA San Francisco
Van Ness Avenue BRT Nov 2014
Mid 2018 BRT $162.07 $74.99 46.3% $74.99 2.0 38 9
SSPD CA San Jose El Camino Real Corridor BRT Project
Jul 2013
Late 2018
BRT $188.00 $74.99 39.9% $74.99 17.4 --- 16
FFGA CA San Jose Silicon Valley Berryessa Extension Project (BART)
Jan 2015
2018 HR $2,330.02 $900.00 38.6% $900.00 10.2 40 2
SSPD CA San Rafael San Rafael to Larkspur Regional Connection
Nov 2014
Late 2016
CR $42.53 $22.53 53.0% $22.53 2.1 --- 1
FFGA CO Denver Eagle Commuter Rail Jan 2015
Dec 2016
CR $2,043.14 $1,030.45 50.4% $1,092.55 30.2 44 13
NSPD CO Denver Southeast Extension Nov 2014
Spring 2019
LR $224.29 $92.00 41.0% $99.50 2.3 8 3
SSPD FL Fort Lauderdale
Wave Streetcar Nov 2014
Dec 2017
SC $161.85 $59.28 36.6% $80.78 2.8 5 10
SSPD FL Jacksonville JTA BRT Southeast Corridor Nov 2014
Early 2017
BRT $23.88 $19.10 80.0% $19.10 11.1 8 7
SSPD FL Orlando SunRail Phase 2 North Nov 2014
2017 CR $68.68 $34.34 50.0% $34.34 12.0 3 1
NSE FL Orlando SunRail Phase 2 South Nov 2014
2017 CR $184.88 $92.44 50.0% $92.44 17.2 6 4
FFGA HI Honolulu High Capacity Transit Corridor Project
Jan 2015
Jan 2020 HCR $5,121.69 $1,550.00 30.3% $1,763.90 20.0 80 21
SSPD IL Chicago Ashland Avenue BRT Phase I Project
Jan 2014
--- BRT $116.90 $58.3 49.9% $58.30 5.4 50 14
CCPD IL Chicago Red and Purple Line Modernization Project
Nov 2014
2020/ 2021
HR $1,700.00 --- --- --- 9.6 --- 4
FFGA MA Boston Cambridge to Medford Green Line Extension
Jan 2015
Jun 2021 LR $2,297.62 $996.12 43.4% $996.12 4.7 24 7
NSPD MD Baltimore Baltimore Red Line Nov 2014
Late 2023
LR $2,997.75 $900.00 30.0% $955.20 14.1 26 19
NSE MD Washington Maryland National Capital Purple Line
Public Transportation Investment History Background Data Page 33
Table 24: FTA New Starts Capital Investment Program Project Profiles as of February 3, 2015 (Includes Completed Projects Reported in Profile Listing)
Status (a)
State Urban Area Project Name Date of Newest Profile
Planned Date of Opening
Mode (b)
Proposed Financial Plan
Miles of
Line
Vehi-cles
Sta-tions Total Cost
(Millions)
Federal CIG (c)
Only Funds
(Millions)
Federal CIG (c)
Only Share
(Percent)
Total Federal
Funds (d) (Millions)
SSPD TX San Antonio Downtown Modern Streetcar Dec 2014
--- SC --- --- --- ---- 5.9 --- ---
SSPD UT Provo-Orem Provo-Orem Bus Rapid Transit Nov 2014
2017 BRT $149.92 $74.99 50.0% $74.99 10.5 25 18
SSPD WA Everett Swift II BRT Dec 2014
2018 BRT $48.0 $38.0 79.2% $38.0 12.0 --- 18
SSPD WA Seattle City Center Connector Streetcar
Jul 2014
Early 2018
SC $110.00 $55.00 to
$75.00 ---
$55.00 to $75.00
1.2 --- 5
NSPD WA Seattle/ Lynnwood
Lynnwood Link Extension Nov 2013
2023 LR $1,200.00
to $1,700.00
$600.00 to $850.00
50.0% $600.00 to
$850.00 8.5 --- ---
SSPD WA Tacoma Tacoma Link Light Rail Expansion
Nov 2014
2021 LR $166.00 $74.99 45.2% $86.59 2.4 5 6
SSPD WA Vancouver C-TRAN Fourth Plain Bus Rapid Transit
Jan 2014
Jul 2016 BRT $53.00 $38.40 72.5% $42.40 5.9 10 18
(a) CCE = Core Capacity Engineering CCPD = Core Capacity Project Development FFGA = New Starts Full Funding Grant Agreement NSE = New Starts Engineering NSPD = New Starts Project Development SSGA = Small Starts Construction Grant Agreement SSPD = Small Starts Project Development
(b) BRT = Bus Rapid Transit CR = Commuter Rail HCR = High Capacity Rail HR = Heavy Rail LR = Light Rail SC = Street Car
(C) CIG = Capital Investment Grant, formally titled New Start Grant (d) Amount from all federal Sources; not limited to new starts funds.
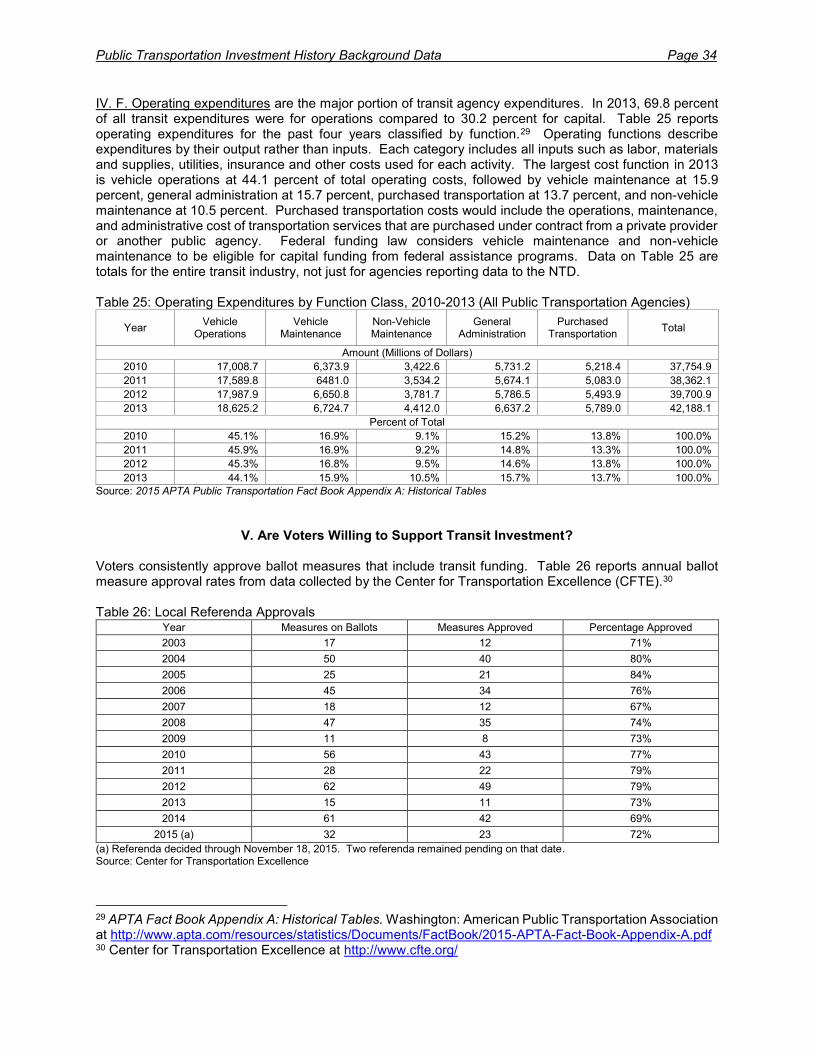
Public Transportation Investment History Background Data Page 34
IV. F. Operating expenditures are the major portion of transit agency expenditures. In 2013, 69.8 percent of all transit expenditures were for operations compared to 30.2 percent for capital. Table 25 reports operating expenditures for the past four years classified by function.29 Operating functions describe expenditures by their output rather than inputs. Each category includes all inputs such as labor, materials and supplies, utilities, insurance and other costs used for each activity. The largest cost function in 2013 is vehicle operations at 44.1 percent of total operating costs, followed by vehicle maintenance at 15.9 percent, general administration at 15.7 percent, purchased transportation at 13.7 percent, and non-vehicle maintenance at 10.5 percent. Purchased transportation costs would include the operations, maintenance, and administrative cost of transportation services that are purchased under contract from a private provider or another public agency. Federal funding law considers vehicle maintenance and non-vehicle maintenance to be eligible for capital funding from federal assistance programs. Data on Table 25 are totals for the entire transit industry, not just for agencies reporting data to the NTD. Table 25: Operating Expenditures by Function Class, 2010-2013 (All Public Transportation Agencies)
Source: 2015 APTA Public Transportation Fact Book Appendix A: Historical Tables
V. Are Voters Willing to Support Transit Investment? Voters consistently approve ballot measures that include transit funding. Table 26 reports annual ballot measure approval rates from data collected by the Center for Transportation Excellence (CFTE).30 Table 26: Local Referenda Approvals
Year Measures on Ballots Measures Approved Percentage Approved
2003 17 12 71%
2004 50 40 80%
2005 25 21 84%
2006 45 34 76%
2007 18 12 67%
2008 47 35 74%
2009 11 8 73%
2010 56 43 77%
2011 28 22 79%
2012 62 49 79%
2013 15 11 73%
2014 61 42 69%
2015 (a) 32 23 72%
(a) Referenda decided through November 18, 2015. Two referenda remained pending on that date. Source: Center for Transportation Excellence
29 APTA Fact Book Appendix A: Historical Tables. Washington: American Public Transportation Association at http://www.apta.com/resources/statistics/Documents/FactBook/2015-APTA-Fact-Book-Appendix-A.pdf 30 Center for Transportation Excellence at http://www.cfte.org/
Public Transportation Investment History Background Data Page 35
The CFTE tracks the outcomes of transit ballot measures throughout the United States. From 2003 through 2015, between 67 percent and 84 percent of all transit referenda were approved by voters each year, with an average approval rate of 75 percent over the thirteen-year period.
VI. References The following references provide detailed explanations and extended data to expand on the material in this report. VI. A. American Public Transportation Association Publications: Public Transportation Fact Book: The Fact Book is a summary of national total data for the entire transit industry for a single year. Operating statistics and financial data are included. A supplemental volume, Public Transportation Fact Book, Appendix A: Historical Data, lists basic national total statistics for every year since they were first collected, as far back as 1902. Public Transportation Fact Book, Appendix B: Agency and Urbanized Area Operating Statistics, ranks for one year transit agencies and urbanized areas by size for six operating statistics by mode and for total amounts. The Fact Book is on-line at http://www.apta.com/resources/statistics/Pages/transitstats.aspx. APTA Primer on Transit Finding, The Moving Ahead for Progress in the 21st Century Act and Other Related Laws, FY 2013 Through FY 2015. The Primer describes distribution and uses of federal transit funds. The report summarizes where federal funds come from, where they go and why, and what they can be used for in detail. A history of federal authorizing and appropriation laws is included along with a legislative terms glossary and a description of highway funds that can be used for transit investments. The Primer is on-line at http://www.apta.com/resources/reportsandpublications/Documents/APTA-Primer-MAP-21-Funding.pdf Public Transportation Vehicle Database: The Vehicle Database lists transit vehicles by fleet of vehicles with the same characteristics manufactured in the same year. Vehicle characteristics such as model, power source, year built, seats, length, and various types of equipment are quantified. Pricing data for new vehicles are also included. Based on voluntary survey of APTA members. Available for free APTA member download or for purchase by non-members through the APTA Bookstore on the MyAPTA page following instructions at http://www.apta.com/resources/statistics/Pages/OtherAPTAStatistics.aspx Public Transportation Infrastructure Database: The Infrastructure Database provides data on transit agency physical infrastructure. Lengths and termini are provided for all fixed-guideway route segments in operation, under construction, or projected. Data included by agency for number of and characteristics of passenger stations and non-station stops including parking, ADA access, information display, security cameras, and many other types of equipment. Based on voluntary survey of APTA members. Available for free APTA member download or for purchase by non-members through the APTA Bookstore on the MyAPTA page following instructions at http://www.apta.com/resources/statistics/Pages/OtherAPTAStatistics.aspx Public Transportation Fare Database: The Fare Database provides details on transit agency fare structures including base fares, passes, zones, transfers, special fares for students and elderly, and other variations in individual agency fare structures. Fixed-route and demand response fare structures are presented separately. Details on fare media sale equipment and fare collection equipment are also included. Based on voluntary survey of APTA members. Available for free APTA member download or for purchase by non-members through the APTA Bookstore on the MyAPTA page following instructions at http://www.apta.com/resources/statistics/Pages/OtherAPTAStatistics.aspx VI. B. Federal Transit Administration Publications: Annual Report on New Starts: The New Starts Report details the status, financing, and characteristics of new start and extension projects in the federal funding "pipeline" that have reached at least the preliminary
Public Transportation Investment History Background Data Page 36
engineering stage in the funding application process. Prepared as background material for the Congress to make funding allocation decisions, the report is highly detailed. Available on-line at http://www.fta.dot.gov/grants/12868.html Updated profiles of projects can be found at http://www.fta.dot.gov/12304_14366.html Statistical Summaries: The Statistical Summaries provide extensive detail concerning federal financial assistance expenditures. Tables detail in cross tabulations where programs funds are taken from, what they are used to buy, and which state and local jurisdictions they go to. Available on-line at http://www.fta.dot.gov/grants/13473.html Apportionment Notices: Apportionment Notices, printed in the Federal Register, advise transit agencies on the amount of funding available to each urbanized area or state from each Federal Transit Administration funding program. Available on-line at http://www.fta.dot.gov/grants/12853.html National Transit Database: The National Transit Database (NTD) is an extensive assemblage of financial, operating, and asset data for transit agencies in urbanized areas that receive federal funding either directly or indirectly. Separate data sets describe revenues by source government or transit agency activity, and capital and operating expenditures by function class, object class, or material purchased. Details are provided on vehicles and fixed-guideway infrastructure. Available on-line at www.ntdprogram.gov/ntdprogram/ and copies of the NTD Tables with urbanized area names and populations added by APTA can be found at the APTA U.S. Government Statistics web page, annual, at http://www.apta.com/resources/statistics/Pages/NTDDataTables.aspx FTA Circular C 9300.1B, Capital Investment Program Guidance and Application: This circular provides guidance about submitting grants for federal capital funding programs including minimum useful requirements for replacing transit passenger vehicles. Available on-line at http://www.fta.dot.gov/documents/Final_C_9300_1_Bpub.pdf