Publication Of The Central Bank Of Nigeria Volume 45 No. 4 October - December, 2021 www.cbn.gov.ng by: Shehu Muhammad by: Ebunoluwa O. Oyegoke Wasiu A. Yusuf by: David N. Odu by: Efayena O. Oba Ngozi P. Buzugbe by: Xavier-Itam A. Okon George N. Ude (Digital Only Banks) The Changing Face of Global Banking: Challenges, Opportunities, and AML/CFT Implications For Nigeria. Does Technological Innovations Affect Unemployment in Nigeria? by: Muhammad A. Abubakar Board of Directors Structure and Corporate Tax Aggressiness of Listed Industrial Goods Companies in Nigeria Is the Heterogeneity of Expenditure Relevant to Economic Growth? The Case of Nigeria Activity Series of The Central Bank of Nigeria Development Finance Interventions Oil Price and Foreign Direct Investment in Nigeria, New Evidence from Structural Breaks and a Nonlinear Analysis Picture source: bangkokpost.com, fool.com
Transcript
Publication Of The Central Bank Of Nigeria
Volume 45 No. 4 October - December, 2021
www.cbn.gov.ng
by: Shehu Muhammad
by: Ebunoluwa O. Oyegoke Wasiu A. Yusuf
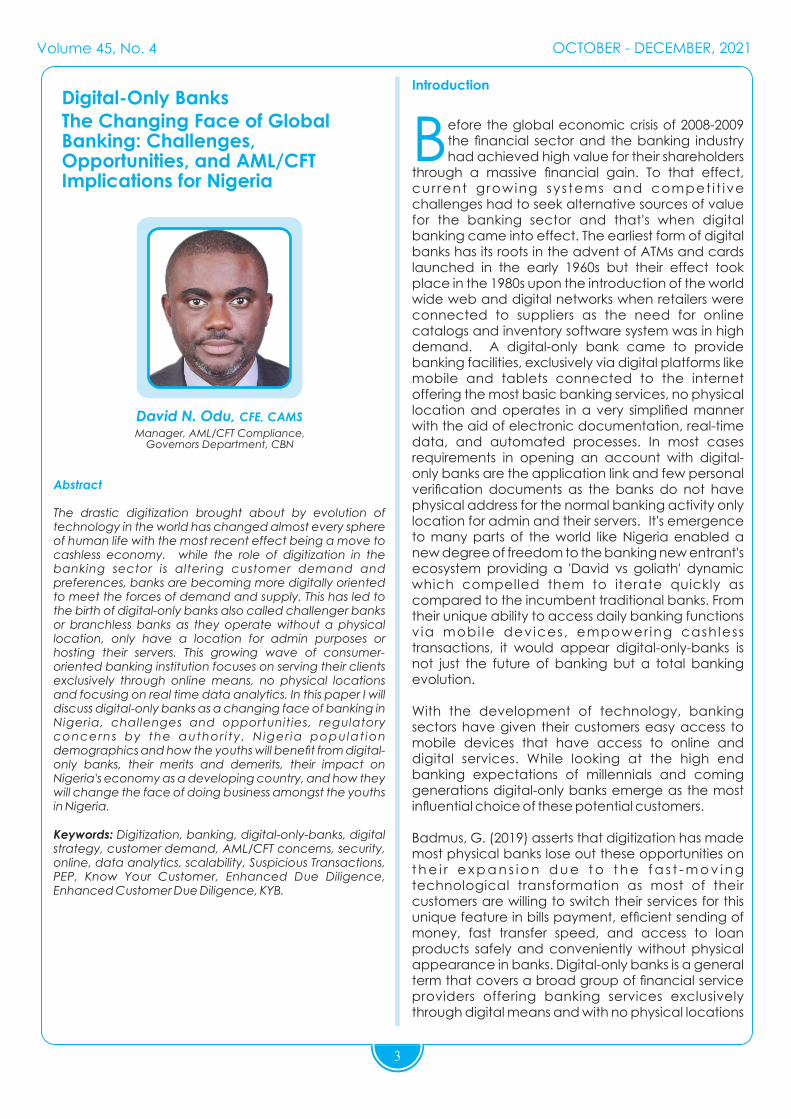
by: David N. Odu
by: Efayena O. Oba Ngozi P. Buzugbe
by: Xavier-Itam A. Okon George N. Ude
(Digital Only Banks) The Changing Face of Global Banking: Challenges, Opportunities, and AML/CFT Implications For Nigeria.
Does Technological Innovations Affect Unemployment in Nigeria?
by: Muhammad A. Abubakar
Board of Directors Structure and Corporate Tax Aggressiness of Listed Industrial Goods Companies in Nigeria
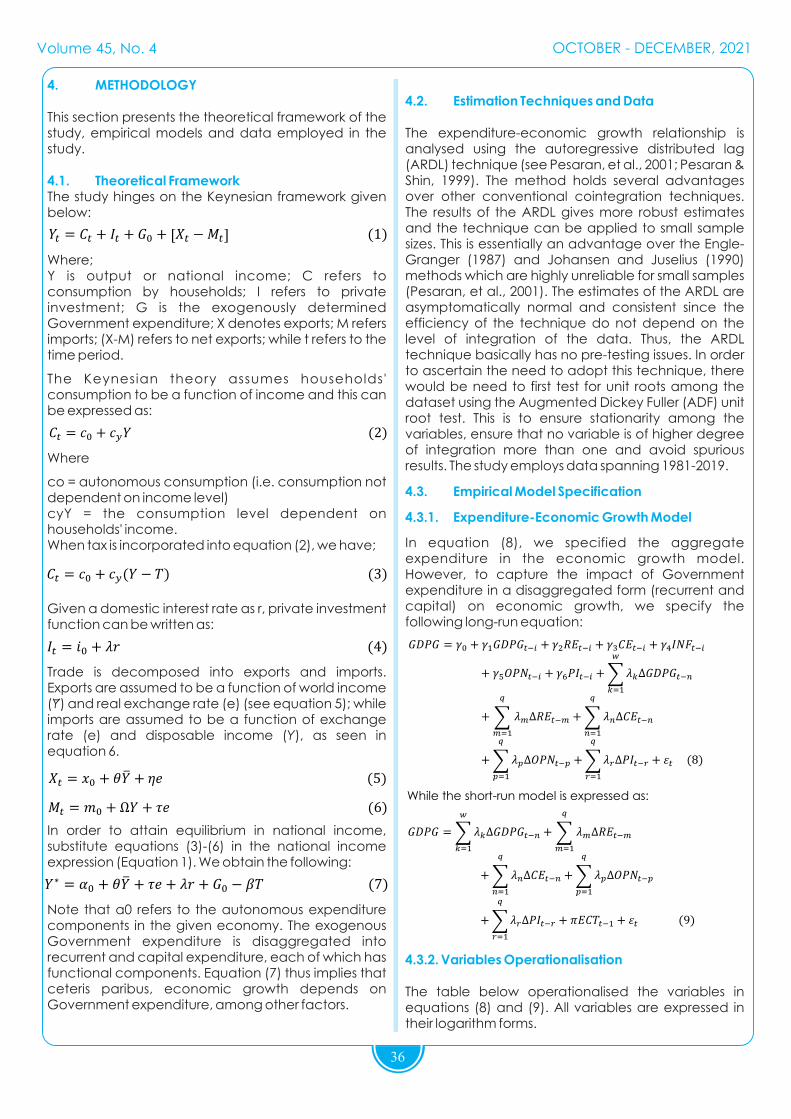
Is the Heterogeneity of Expenditure Relevant to Economic Growth? The Case of Nigeria
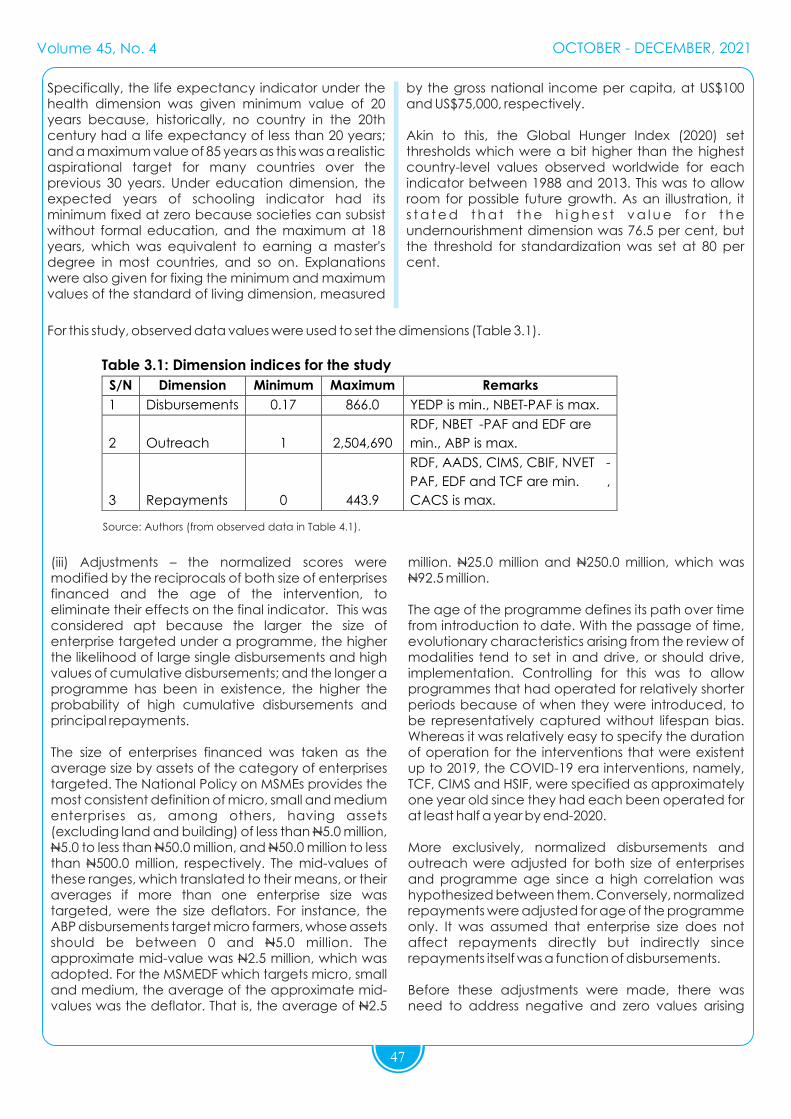
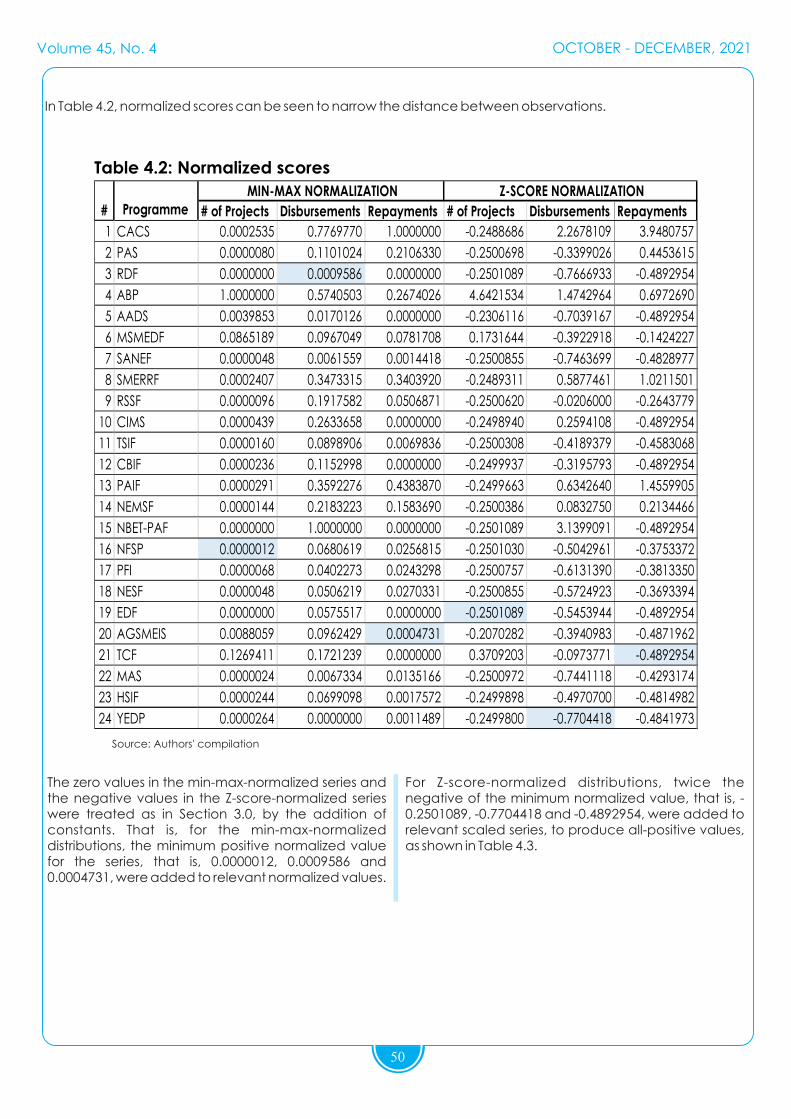
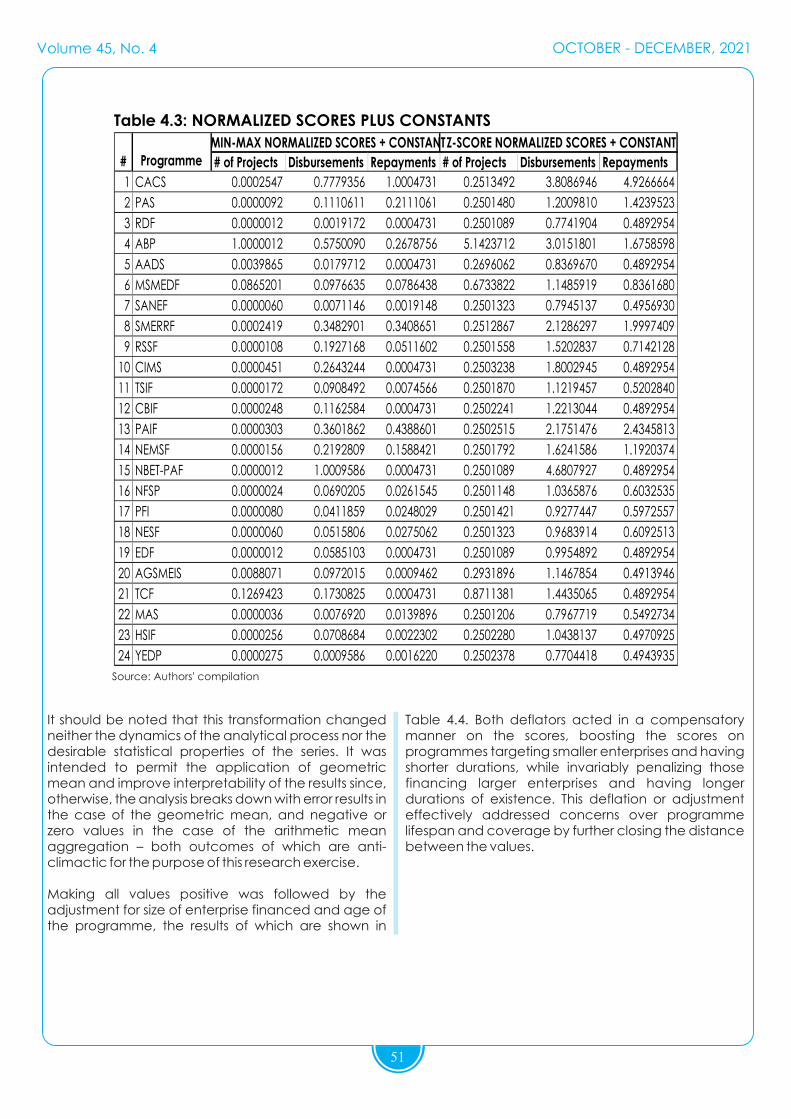
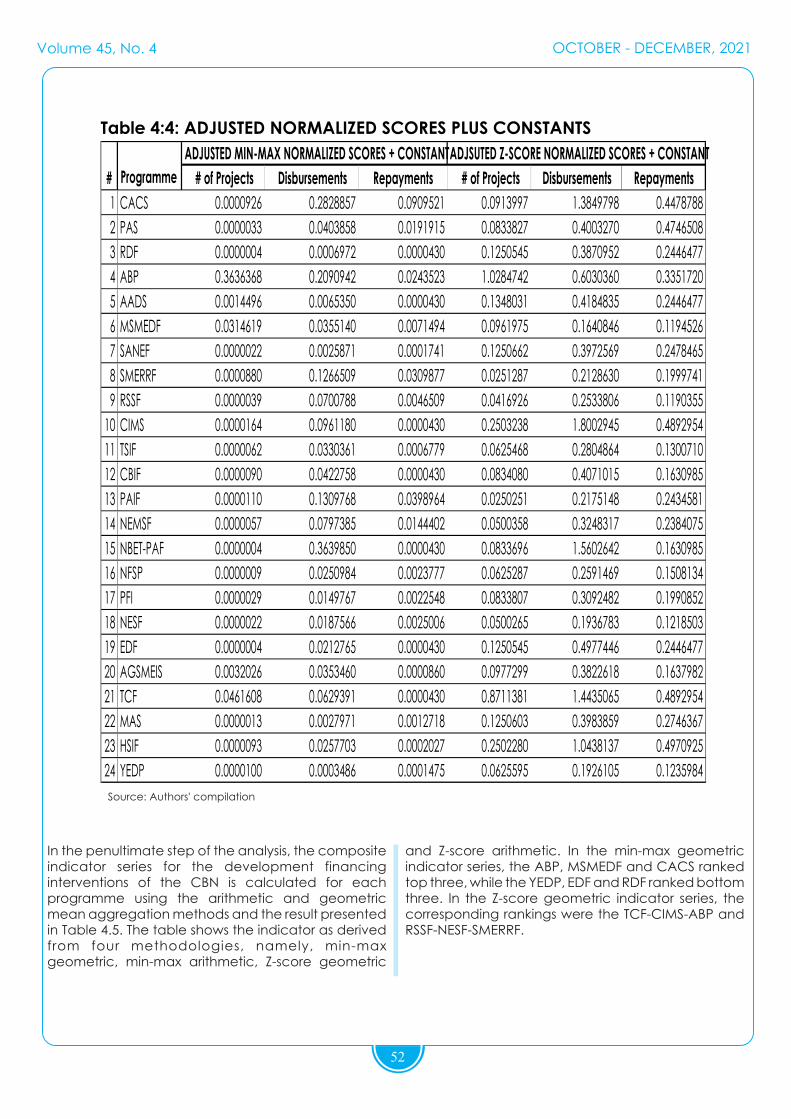
Activity Series of The Central Bank of Nigeria Development Finance Interventions
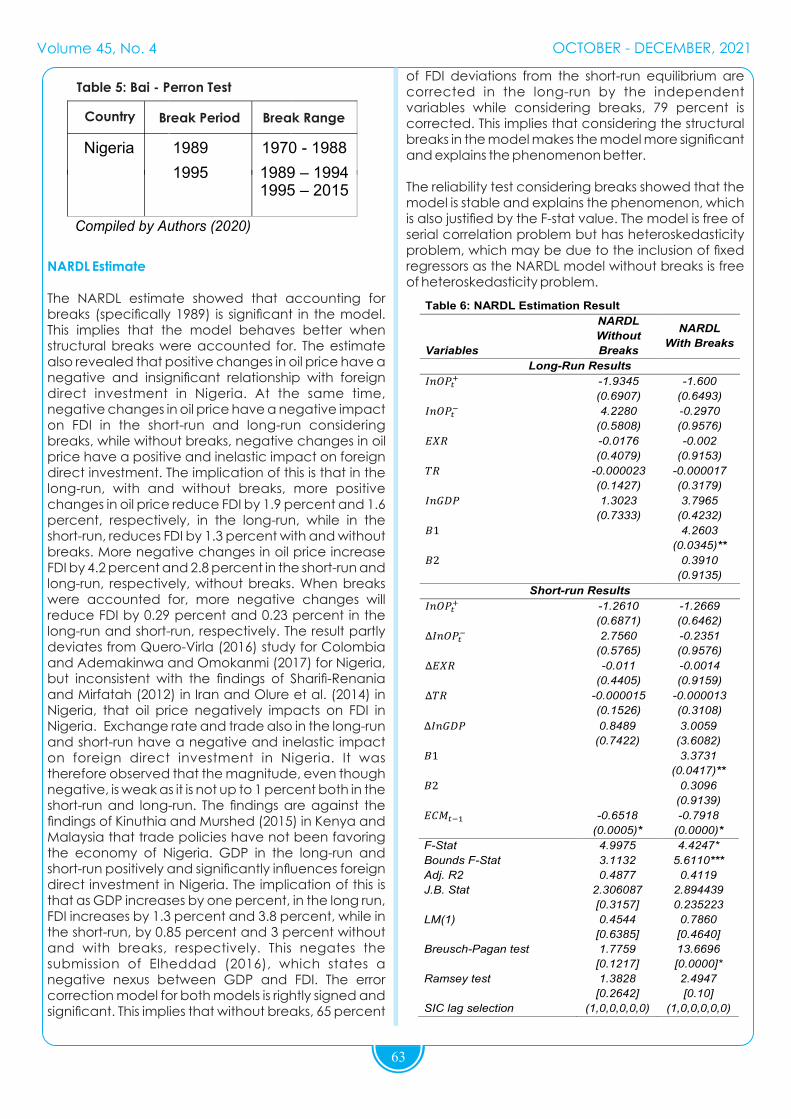
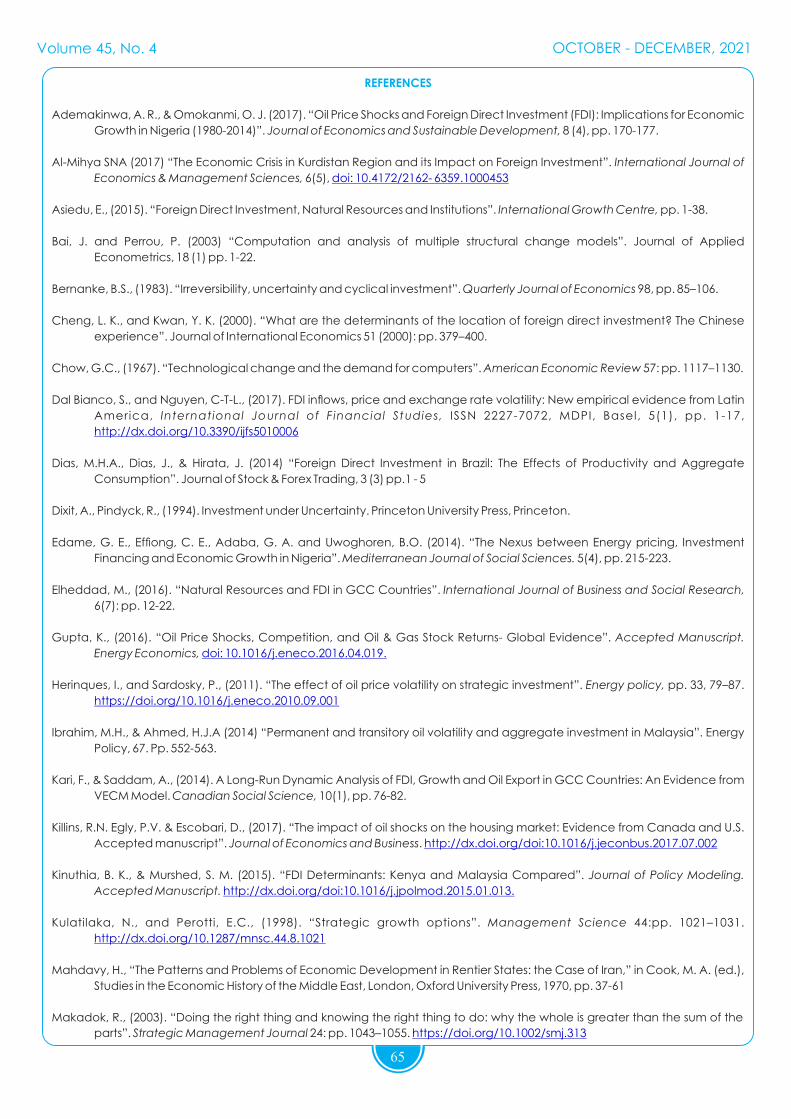
Oil Price and Foreign Direct Investment in Nigeria, New Evidence from Structural Breaks and a Nonlinear Analysis
Picture source: bangkokpost.com, fool.com
CONTENTS
Volume 45, No. 4 OCTOBER - DECEMBER, 2021
- Chairman
Michael A. Adebiyi
Nkiru E. Asiegbu - Member
Philip Y. Yusuf - Member
Samuel A. Okogbue - Secretary
Adebiyi A. Michael - Chairman
- Alt Chairman
Samuel C. Okojere - Member
Musa Jimoh - Member
Nkiru E. Asiegbu - Member
Philip Y. Yusuf - Member
Chibuzo A.Efobi - Member
Angela Sere-Ejembi - Member
Hassan Mahmud - Member
Adeniyi O. Adenuga - Member
Samuel A. Okogbue - Secretary
EDITORIAL ADVISORYCOMMITTEE
EDITORIAL BOARD
EDITORIAL STAFF
- Editor-In-Chief
Samuel Okogbue
Onyemakonor I. Ogbe
-
-
Editor
Deputy Editor
Kerma Mshelia - Editorial Asst. I
Mohammed M. Haruna - Editorial Asst. II
Ruqayyah F. Mohammed - Production Asst.
1
BULLION is a quarterly publication of the Central Bank of Nigeria. Views expressed therein do not necessarily reflect the opinion and thinking of the Bank's Management. Copies are available without charge through formal request to the Editor. Articles in the journal may be reproduced only with the expressed permission of the Editor or the article's author.
- by: David N. Odu ... 3
Osita C. Nwanisobi - Alt. Chairman
Osita C. Nwanisobi
Osita C. Nwanisobi
Aisha A. Balewa - Member
(Digital Only Banks) The Changing Face of
Global Banking: Challenges, Opportunities,
and AML/CFT Implications For Nigeria.
- by: Ebunoluwa O. Oyegoke Wasiu A. Yusuf
... 13
Does Technological Innovations Affect
Unemployment in Nigeria?
- by: Muhammad A. Abubakar ... 25
Board of Directors Structure and Corporate
Tax Aggressiness of Listed Industrial Goods
Companies in Nigeria
- by: Efayena O. Oba Ngozi P. Buzugbe
... 31
Is the Heterogeneity of Expenditure Relevant
to Economic Growth? The Case of Nigeria
- by: Xavier-Itam A. Okon George N. Ude
... 43
Activity Series of The Central Bank of Nigeria
Development Finance Interventions
- by: Shehu Muhammad ... 58
Oil Price and Foreign Direct Investment in Nigeria,
New Evidence from Structural Breaks and a
Nonlinear Analysis
3
Abstract
The drastic digitization brought about by evolution of technology in the world has changed almost every sphere of human life with the most recent effect being a move to cashless economy. while the role of digitization in the banking sector is altering customer demand and preferences, banks are becoming more digitally oriented to meet the forces of demand and supply. This has led to the birth of digital-only banks also called challenger banks or branchless banks as they operate without a physical location, only have a location for admin purposes or hosting their servers. This growing wave of consumer-oriented banking institution focuses on serving their clients exclusively through online means, no physical locations and focusing on real time data analytics. In this paper I will discuss digital-only banks as a changing face of banking in Nigeria, challenges and opportunities, regulatory concerns by the author i ty , Niger ia populat ion demographics and how the youths will benet from digital-only banks, their merits and demerits, their impact on Nigeria's economy as a developing country, and how they will change the face of doing business amongst the youths in Nigeria.
Keywords: Digitization, banking, digital-only-banks, digital strategy, customer demand, AML/CFT concerns, security, online, data analytics, scalability, Suspicious Transactions, PEP, Know Your Customer, Enhanced Due Diligence, Enhanced Customer Due Diligence, KYB.
Introduction
Before the global economic crisis of 2008-2009 the nancial sector and the banking industry had achieved high value for their shareholders
through a massive nancial gain. To that effect, cur rent growing systems and compet i t ive challenges had to seek alternative sources of value for the banking sector and that's when digital banking came into effect. The earliest form of digital banks has its roots in the advent of ATMs and cards launched in the early 1960s but their effect took place in the 1980s upon the introduction of the world wide web and digital networks when retailers were connected to suppliers as the need for online catalogs and inventory software system was in high demand. A digital-only bank came to provide banking facilities, exclusively via digital platforms like mobile and tablets connected to the internet offering the most basic banking services, no physical location and operates in a very simplied manner with the aid of electronic documentation, real-time data, and automated processes. In most cases requirements in opening an account with digital-only banks are the application link and few personal verication documents as the banks do not have physical address for the normal banking activity only location for admin and their servers. It's emergence to many parts of the world like Nigeria enabled a new degree of freedom to the banking new entrant's ecosystem providing a 'David vs goliath' dynamic which compelled them to iterate quickly as compared to the incumbent traditional banks. From their unique ability to access daily banking functions v ia mobi le devices, empower ing cashless transactions, it would appear digital-only-banks is not just the future of banking but a total banking evolution.
With the development of technology, banking sectors have given their customers easy access to mobile devices that have access to online and digital services. While looking at the high end banking expectations of millennials and coming generations digital-only banks emerge as the most inuential choice of these potential customers.
Badmus, G. (2019) asserts that digitization has made most physical banks lose out these opportunities on t h e i r e x p a n s i o n d u e t o t h e f a s t - m o v i n g technological transformation as most of their customers are willing to switch their services for this unique feature in bills payment, efcient sending of money, fast transfer speed, and access to loan products safely and conveniently without physical appearance in banks. Digital-only banks is a general term that covers a broad group of nancial service providers offering banking services exclusively through digital means and with no physical locations
The Changing Face of Global Banking: Challenges, Opportunities, and AML/CFT Implications for Nigeria
Volume 45, No. 4 OCTOBER - DECEMBER, 2021
4
anytime, anywhere banking. Human error in measurement and record-keeping wi l l be minimized. By maintaining records of the transaction electronically, it is possible to produce reports and review data at any stage and for various purposes. This shows that banks are not relying on investing in physical locations anymore as they see potential in the growth of digital-only banks services considering its more user-friendly to their customers. The key benets of these digital only banks are cost reduction, their agility through moving into the digital space, viability as their operations is incredibly successful, increase in revenues as they create a larger market audience for their services while attracting and retaining more customers.
Problem Statement
As the banking dynamics and environment changes so is the customer satisfaction changing bringing a challenge to banks on how well they are meeting their customer demands as well as exceeding expectations. While customer satisfaction is the most important factor in any organization the primacy of traditional banks relationship in Nigeria is under threat as inuence on digital-only banks is slowly gaining momentum. When customer demands are met their utility and satisfaction will increase otherwise with less satisfaction, they will look for services elsewhere. While technology has brought a new wave of digitization in the society, consumer behavior in banking is rapidly changing as every customer expects digital and retail banking at any time, place and anywhere. This has prompted many banking institutions to focus more on customer relationship management as less satised customers using traditional banking models will change their banking institutions to see what other banks have to offer.
Literature Review.
Majority of scholarly articles, research papers and literature on internet and digital banking suffers from narrow focus on electronic money. most ignore digital-only banks entirely while focusing on electronic money and substitution of banking models to customer through smart cards, mobile money and virtual currency. Most of them propose that electronic and digital banking consist of stored value cards, network money and digital banks while use of digital-only banks has been completely ignored. Despite this narrow scope of research, there are none the less few studies that address importance, challenges and opportunities of digital-only banks in Nigeria. I have identied this research gap and will discuss the possibility of digital-only banks ourishing in a developing country like Nigeria , challenges, opportunities , know your customer and
and are chartered as nancial institutions by the federal regulator, or the parent company is a chartered nancial institution. Most of digital-only banks are created by brick and mortar banks or afliated to the banks but their services are exclusively online as they don't have physical location like other banks offering digital banking services. According to Wang, Nnaji, &Jung, (2020) The nancial sector is considered one of the most affected sectors by the proliferation of a new wave of technology, mostly digital and online banking as banks of all sizes and manner are choosing to operate and run their businesses under a digital platform, in the sense that this new medium is offering unique and distinct advantages to all the parties involved. Digital-only-banking is not only simple and convenient to the user but offers superior customer experience through analyzing the customer experiences by use of social and geo-related insights. Among customer benets using digital-only banks include easy sign up process, faster bills payments, access to account through app, easy expenses management, and use of real data analytics. Nigeria has six digital-only banks which are ALAT, Kuda, Rubies, Eyowo, VFD, and sparkle. The number of digital-only banks users in the world is growing at an increasing rate while offering a competitive advantage to the public and private banking sectors. Its adoption by many users is based on a range of factors that are not limited to its reliability, a high degree of comfort, safety, user-friendly interphase, and the social impact amongst the users of these products (Wang, Nnaji, & Jung, 2020). This has made digital-only banks more of a norm rather than an exception in many developed and developing countries as it offers the banking industry a cheap way of providing services. The nance sector has virtually 100% cloud-based business that leverages the expertise of cutting-edge digital networks, rather than relying too much on stand-alone and obsolete technology. Digital-only banking systems such as Chime, N26, and Monza provide accounts checking to customers without the hassle of going to the branch Taiwo, (2018) Digital-only banking is very easy to do and it is convenient to use online services, mobile banking, ATM, and debit cards, it takes time and resources to go to the banks and set up, manage the accounts Taiwo, (2018) Banks had boards set up at their branches, dening the time required for different services. It takes time to even just cash a check. But digital banking is instant, with no time constraints. Digital-only banking has greatly lowered the operational costs of banks. This has made it possible for banks to charge lower service charges, and also to offer higher deposit interest rates. Lower operating costs mean more income for the banks. Chiemeke, and Chete, (2016) explained that the number of customers for banks would rise due to the increased convenience of
Volume 45, No. 4 OCTOBER - DECEMBER, 2021
5
Digital banks adoption among internet
users in selected countries, march 2020
% of respondents in each group
China 87%
India 87%
Russia 82%
South Africa 80%
Peru 74%
Nigeria 66%
Italy 41%
USA 57%
France 35%
Japan 30%
Worldwide 64%
Source. Global ntech adoption index
2020 www.insider.com
anti-money laundering regulations of digital-only banks by the regulating authorities in Nigeria.
Importance of digital-only banks in Nigeria
Trends for the adoption of digital-only banks are rapidly increasing after the surge of the covid-19 virus and the pattern might last well once the pandemic is over. For nancial institutions and the banking sector, this has presented a good opportunity that embraces the benets of digital-only banks while giving their customers the ability to bank, move funds and transact at their pleasure. This comes at a time when the world is faced with the advent and need of digital banking in nancial services. The pandemic has increased the need for use of digital-only banks as the government has put restrictions on the number and amount of withdrawals as well as long waiting times in banking halls. Kuda bank a digital-only bank in operation since 2019 with only 500 customers says their customer base is increasing daily a trend that began during the lockdown in Nigeria's main cities like Lagos and Abuja. Another digital-only bank sparkle CEO said that “seeing the impact of COVID, and the fact that we are headed to another wave as experts tell us, we as bankers need to build resilience into our business and that means being digital.
The Banks have created a challenge to the existing retail banks in developed economies, as the pace to market and digitization of banking services draws attention because of the potential to make daily banking easily available. Salami, (2018) asserts that with the surge of the covid-19 virus, many banks around the globe temporarily closed their operation centers and branches as their regular customers kept a social distance in their homes, taking advantage of cashless payments, and digital banking was their preferred payment option. However, Digital-only banks have a greater role in Nigeria than just a contest between digital banks and retail banks alone. The banks are always open, there is no point in complaining about the 8.00-4.00 pm banking hours, the customers can gain constant access to their funds 24/7 with more spending options for their cash.
According to EY's global ntech adoption index data presented by price water house coopers in 2020, nancial technology and digital-only banking services adoption has doubled in the last three years. March 2020 data indicates that 64% of digitally active consumers across 10 markets used digital banking services with 20% of the population using digital-only banks.
The survey indicated that global awareness of digital-only banks and nancial technology products in the world stands at 90%. Although the usage of these services is still heavily skewed towards a higher demographic segment in countries like Nigeria, hurdles like security issues and privacy exists but the growth has great potential to achieve a 90-99% success rate with consumer education.
Growth of digital banking has made the world witness a somewhat weighing of the future of bank branches as north America and European banks have been forefront in accelerating branch closure both in local and international market. While responding to evolving consumer psychology and their expectations, western countries have been operating on a wash-wash market with digital-challenger banks as the likes of Ally, Monzo, and N26 have been hitting headlines with their digital–only bank products. This comes at a time when fanfare is falling more intensely on North America and European banks as the wave is creating fan in unexpected places (Nel & Boshoff 2021). This was seen by the unlikely darling of money in Asian banks on 2018 when Kakao bank established an entity of Digital-only bank and in less than 24 hours of its launch they had nearly 300,000 users registered. Within a week the digital-only bank had transacted an amount of $245 million and at the same time more than $260 million in digital loans were issued. The digital-only bank currently has brought $5.75 trillion in deposits and over 5.2 trillion in loan has been issued. This performance has been rated successful by local and international news media.
Volume 45, No. 4 OCTOBER - DECEMBER, 2021
6
Referring to Nel & Boshoff, (2021) In a case of extend without overextending Africa has seen its fair share of local investors brining life into a digital-only bank. Zazu bank which is an intermediary of African Agri-tech start up announced its intention to establish Zambia rst Digital-only bank in 2017 and within the rst nancial year they had registered deposits amounting to $218,000.
The striking trend seems to be international banks expanding their market share to new territories by entering new market with purely digital-only bank products. A major banking product consumers survey by Accenture released in May 2020 says that “value for the money” is the single most reason consumers consider while dealing with nancial institutions while 39% of the respondents says that biggest priority in banking with a nancial institution is “able to manage my account in a way that suits me”. Digital-only banks despite few knowing of its existence is the most preferred banking option. Nigeria had its home-grown disruptor with its rst entry of digital-only bank in 2015 Lidya, the country rst fully-edged digital bank with its parent body (SunTrust bank of Nigeria) posted a prot after tax of naira 212.7 million ($656252) in its rst 2015/2016 nancial year.
Nigeria a developing country rich in mineral deposits and agriculture has a rich economy and is moving in the right direction as the government has invested heavily in ICT and technology. Internet connectivity has increased rapidly with a percentage of 3.5% in 20005 to 42% in 2020 while their GDP per capita has increased to 4500$ at the same period.
This move has revolutionized the Nigerian banking industry which started in the year 2004 with the introduction of the internet and mobile banking by the Nigerian central bank. The move from traditional to digital-only banks followed a great reformation of Nigerian banks which left only 25 banks in operation from the ones that initially existed. This was triggered by the customer's appetite for efcient services in the delivery of the existing banking services. Their convenience in Nigeria is queen as they offer the ability to access, move funds, check account balances, pay their utility and shopping bills, as well as the instant loan application. "Security is the number 1 priority in the banking sector," says Badmus, (2019) a banking expert, and his message extends to digital-only banks. With threats of insecurity existing everywhere in Nigeria due to high unemployment levels, and massive corruption digital banking makes it easy to take extra security precautions for individual cash in banks. Digital-only banks only applications allow the users to use biometric authentication in their login process with login options such as ngerprint and facial recognition.
The banks have made a digital transformation to the Nigerian economy as the digital shift allows households and individuals to gain access to their accounts, services that were in the past held by brick and mortar locations around the country. ICT departments in Nigerian banks have progressed their moves as more customers are gaining access to banking services online while trying to keep up with the adoption of the digital era.
Digital-only banks reduce costs involved in transactions as reinvestment of money into digital services helps in reducing the cost of operations for the traditional model of the banking system and the reduced cost helps in settling rent cost, upkeep of the banking facility, and reduction of physical exercise that comes along with brick and mortar. (Tarhini, Mgbemena, Trab, & Masa'Deh, 2015).
The digital-only -banks increase revenues as their accessibility creates a huger market audience for offering its services which ultimately increases the revenues for their businesses. The digital-only banks and other nancial institutions will be in a position to increase their revenues as well as the establishment of a customer base that will help increase demand for their customer base.
Digital-only banks have helped businesses attract and retain more customers in their businesses as the majority of customers tend to be committed and loyal to businesses and companies that are innovative and offer better services. They also help most businesses stay ahead of time and gives a competitive advantage.
CONCEPT OF DIGITAL-ONLY-BANKS, ONLINE BANKING AND BRICK AND MORTAR
Online Banking
The worldwide web has changed the dynamics and culture of doing business in different ways. As one can maintain an entire nancial portfolio through different online means that are provided for by this feature but have physical locations. This is simply a form of personal banking which can be conducted by use of the internet, but digital-only banks are more of an overarching term referring to all forms of nancial technology taking place with the aid of technology. While online banking only handles essential transactions, digital-only banks goes away deeper to mandate a comprehens ive re-engineering of banks internal systems as it encompasses all digital transactions. The internet-based account management service allows its different customers to check their account balances, transactions, and transfer of funds between other online users and accessing loans but
Volume 45, No. 4 OCTOBER - DECEMBER, 2021
7
have physical banks unlike digital banks where everything is done through mobile application including account opening. Referring to Cunha, (2020) this concept was developed in the late 1980s by presidential savings banks, online banking was envisioned for regular customer use by different banking institutions. The idea and concept were assimilated by other banks all over the world and currently, major banks in the world have adopted this concept The account management service allows the users to view their account balances, transfer funds, access, and initiate loans payment without necessarily having to go to the banks. Online bank accounts are capable of offering higher interest rates, particularly on savings accounts, generally lower fees, and quick access to your online accounts 24/7 is a huge benet for some customers
Brick and Mortar
In the banking industry "brick and mortar" means that the bank has several physical locations that their customers and users of their products can visit and conduct their businesses. The term refers to the traditional brick and mortar that was used to construct branches using steel and drywalls in the most visible times. They are used by banks and credit unions in Nigeria offering all services, but online services are optional to customers unlike digital-only banks where all transactions are done online. Digital -only -banks also referred to as challenger banks or branchless banks unlike brick and mortar have no physical location for banking services, as everything is done on an online platform, they only have a location for admin purposes and hosting of their severs. Unlike digital-only- banks they have better communication models as they are considered best in terms of cash deposits, and sending money to international channels (Agu, Simon, & Onwuka, 2016) Online banks are ideally suited to those who want to optimize the return of their savings. Traditional banks typically have a wide variety of offerings to sell to their customers. The greatest downside to brick-and-mortar banks is that online banks do not necessari ly deliver the same competitive monetary advantages (Salami, 2018). It lacks new features as it takes a while for some conventional banks to catch up with the technology unlike digital-only-banks where the user has ability to access daily banking functions through computers and mobile devices to cashless transactions. Some features, such as mobile check deposits, are not available at all conventional banks
Challenges Facing Digital-Only Banks.
Every industry is going to the digital platform and the banking industry is making much effort to cope with the competitive move. Despite digital-only-banks becoming a thing of the day and gaining more popularity, the industry still faces major challenges mostly in developing countries like Nigeria. These challenges are factors that are key stumbling blocks for digital-only banks from stabilizing and being accepted as a banking method for every bank account holder. They include.
1. Security: This is among the rst factors many customers consider when shopping for a banking option as keeping money safe is always a priority for a customer or any nancial body. The sad truth is that internet and computer hackers are still not taking chances when it comes to things on the internet. Having a secure bank and safety of money is a big challenge as IT departments in banks have to design the best system that cannot be b roken in to by any ma l ic ious m ind . Digital–only-banks can be a save heaven for hackers if the banking system is compromised.
2. Scalability: Digital-only-banks face a huge challenge of scalability with respect to traditional banks. They are efcient but have limited offerings which might restrict customer growth and that personal, one on one and personal interactions is mostly preferred by the older or less digitally savvy generation of the population when it comes to customer service.
3. Operations of fully digitized banks: There is a portion of people embracing digital-only banks, although there is a notable number of customers who still have not accepted it as a banking option citing trust issues. It's also quite difcult to convince people about digital-only banks as compared to the existing brick and mortar banks and their operating model. This has made it quite hard for digital banking to achieve 100% success and be completely digitized.
4. Evolution from ancient banking: Many people still are not yet aware of digital-only banks as most banking systems are using the traditional COBOL programming language in Nigeria rather than the modern programming languages. This is however an outdated programming language and does not suit the applications that are required in digital banking today. To upgrade these banking systems and install suitable programs is time-consuming and needs a lot of resources for a full digital migration.
Volume 45, No. 4 OCTOBER - DECEMBER, 2021
8
drives our digital offerings. The DISC model describes styles of people namely dominance, inuence, steadiness, and conscientiousness. Nigeria has an aggressive and technologically savvy youthful population that can easily access information to inform and educate themselves of the benets of digital-only banks. Majority of them don not always t on the traditional banking mold and where they choose to store their wealth.
2. More prots in output. With the use of digital-only banks, there is no more hustle and bustle while waiting for long lines in banks as the upcoming Nigerian generations are predicted to be more digitized as there is a specic time when someone wishes to withdraw money from his/her account from the bank. This will make banks offer a 27/7-hour service to the users of the products hence maximizing their prot margins. (Ojeka, & Ikpefan,2018).
3. A huge pool of customers and fastened services. For any healthy and stable economy money need to be in circulation in a business setting. This is the reason spending long hours in banking halls to transfer money and access loans serve as a disadvantage to the customer and the business itself. By use of digital-only banks, one can transact at the comfort of their homes getting the same speed and utility whether in Abuja or the farthest corner of the country like Okundi plantations in Ikom Local government area of Cross river state.
4. Digital-only banks have a better market
prediction. According to Wang, Nnaji, & Jung (2020) the setup of the banks is coded with an excellent programming language that has an accurate data collection mechanism. In any institution, data is very important as it's used by the researcher in predicting the market and offering the most modern service to the customers. Digital-only banks are promising a better banking experience for both the customer and banks hence beyond a shadow of no doubt we can conclude that the future of banking is a digital bank. (Sanusi,2010.
5. Breaking down silos and other mitigating risks. Ojeka, & Ikpefan, (2018) asserts that traditionally banks have been siloed to organizations as different departments have their own organizational goals that use disparate systems. This has inevitably led to stunted growth, limits the bank's scalability while decreasing the utility of their customers as many banks in Nigeria have a reputation of giving their customers huge run around while they are applying for new services.
5. The threat of non-nancial institutions: Some upcoming non-nancial institutions pose a threat to digital-only banks as they tend to offer products that digital-only- banks are supposed to be offering. Facebook in other countries has made it possible for users to send money from one user to the other without involving the bank a technology that might soon be adopted by Nigeria. considering it's not restricted by any nancial institution; it becomes hard for these institutions to be in competition with and cope with the stiff competition.
6. Sustainable competitive advantage: Among the most crucial challenge affecting digital-only banks are the workload and amount of digital banking initiatives that are increasing daily and have no huge impact on the business due to wrong guidance by the banking professionals. Tarhini, Mgbemena, Trab, & Masa'Deh, (2015). Says that Its however good to carry out a eld study when initiating such a project not capitalizing on initiating the products and cost features. Poor experiments by the banks offering digital services have led to poor adoption of the digital products and eventually leading to the initiatives.
7. Loyalty among traditional banking models: Despite moving into a post-loyalty era some consumers of the banking products are still tied to the traditional bonds offered by brick-and-mortar products. Sanusi (2010) says that this also presents a challenge when understanding the customer context in terms of the products they prefer as some organizations are experiencing huge problems while trying to superimpose digital solutions to traditional customers who have a little understanding of the products.
8. Automation and the future of digital-only b a n k s : A m o n g t h e m o s t i m p o r t a n t sociological factor that has been a big challenge in offering digital-only products are their impact and subsequent robotic process. While Nigeria has a proud legacy of large service sectors like mining, oil, and service sector, echoing the digitization of the banking sector needs care as there exist teething problems with other sectors which is an inevitable problem in business.
Opportunities.
1. Existence of disc customers. Being in a digital era it's not a big problem to explain technology even in the most remote areas of Nigeria as people have an idea of basic technology that
Volume 45, No. 4 OCTOBER - DECEMBER, 2021
9
qualied compliance ofcers who have a profound background in understanding the AML/CFT regulations and are aware of the dynamics criminals use in their ever-changing tactics. These ofcers design risk-based and technological approaches on gathering data, analyzing the data while screening different personalities like politically exposed persons (PEPs), business associates, monitoring Suspicious transactions, watch list screening, and clear observation on cybercrime trends.
To achieve this at 100% success Nigeria banks need to check out the existing AML/CFT controls given, and how they might improve on their operations, evaluate how many employees should be involved in the AML/CFT functions, and what are the related risk that exists in every digital bank sector. By following a non-siloed approach, the AML/CFT functions operate in silos and have their systems to manage suspicious reporting of crime and there's a more effective way to do by using AML/CFT applications with articial intelligence and machine learning that will inspect huge data volumes for the real-time tracking and PEP screening
AMF/CFT bodies are consistently taking deep research to identify various policies and measures that need to be undertaken to proactively deal with money laundering and threats of money laundering. For our Nigerian case, the government needs to appraise different vulnerabilities and tailor their research to highlighting these weaknesses while considering global standards that are in place for money laundering.
In the (KYC) programs and processes, regulators are obliged to check and update their policy guidelines to help the banks comply with the given rules that pertain to knowing their customers. Nigeria Central Bank and security and future commissions should update their code of conduct while introducing new onboarding rules in a face-to-face manner of capturing the identity of their customers. Referring to Badmus, G. (2019) With an aggressive and robust KYC process, and excellent accuracy tools, digital-only banks are in a position to determine the nature of customer and evaluate who has a high risk of being involved in terrorist nancing as well as fraud and money laundering, conduct continuous KYC customer verication with due diligence, be updated on the existing and evolving threats, as well as using analytics in facilitating accurate evaluation. The digital-only Banks' management team need to adverse their media checks in major languages like Ibo, Hausa, Yoruba and other tribes as it enables in search of adverse media and negative news about a personality who may pose a reputational risk to the organization (Oladejo, & Oladipupo, 2017). The key objective is random check to uncover any illegal
AML/CFT Compliance for Digital-only Banks
The central bank of Nigeria amended act of 2007 enumerates the functions and objectives of the country's AML/CFT regime, setting out policies that guide banks to conduct business under the given laws and regulations. Compliance with AML/CFT (Anti-Money Laundering / Combating Terrorist Financing) str ict national and international regulations would help digital banks in protecting the platform from nes and reputational harm . Money laundering (prohibition) act of 2012 as amended, terrorism prevention act 2012, economic and nancial crime commission act of 2004 gives the standard guidelines that all banks should comply with. Banks are therefore obliged to maintain the highest operating standards to ensure that their services and products are not used for malicious purposes like money laundering, terrorism nancing, illicit nancial ows and other nancial crimes.
Nigeria is no longer on the FATF (nancial action task force) list of countries having strategic AML deciencies as in 2018 FATF welcomed Nigeria signicant progress in improving its AML/CFT regulatory framework with no sanctions currently against this country. This makes it a good hub for investors wishing to establish digital-only banks. In other developing countries like pacic Asia, digital- only banks have been issued licenses for operations upon going through a thorough evaluation process which is the lead in this new frontier of digital services. This can be achieved in Nigeria through the development and execution of an AML/CFT enforcement program and providing qualied compliance personnel with a thorough knowledge of the AML / CFT regulations and comprehension of criminals' changing approaches as per Wang, Nnaji, & Jung, (2020) guidelines.
Even with no presence of physical premises where bank tellers and managers can check their customer identities, digital-only banks are bound by the rules and regulations of digital Onboarding and document verication as presented by any new customers. They must act as per the law by reporting to the regulator any irregularity or any Suspicious transaction as part of AML/CFT compliance. Digital banking licenses are usually subsumed under an existing break and mortar licenses but for the digital-only-banks, the operating licenses is presented as digital-only having no physical location for banking activities.
Referring to (Oladejo, & Oladipupo, 2017) In designing and implementation a well-structured AML/CFT compliance program, the banks are required to have professional, competent and well
Volume 45, No. 4 OCTOBER - DECEMBER, 2021
10
banking in Nigeria. The committee recognizes that the development of digital and online banking has not been matched with the required regulations and there is a need to address any issue related to the regulator and banking sector. The committee however has issued a document named “guidelines on electronic and digital banking in Nigeria" which has strict rules regarding technology, safety, and security standards. On digital-only banks regulation by the document, it gives clear guidelines which emphasize that networks used for transmission of money must be demonstrated and meet the standard guidelines that are specied for data security and integrity of the user. Banking regulation act requires that no entity can carry out banking operations in Nigeria without a valid banking license under banks and other nancial institution act. The document also provides rules that banks will be considered liable for fraud, card skimming, and counterfeit transaction until proven to a shadow of no doubt that the merchant is negligent.
Benets of digital-only banks to Nigerian youths.
Youth interaction with digital technology at a young age is fundamentally different from that of just the elder generation. Data by UNICEF indicates that 71% of young people in Nigeria are internet users as compared to 48% of the overall internet users in the world. Access to online information and services has become fundamentally important that some countries like Spain, Finland, and France have recognized internet access as a human right. With an ambiguous presence of technology among the youths, this has led to the coinage of the term “digital natives” a term that implies a unique ability to appropriately use digital technology for personal and business use (Badmus, 2019). Financial inclusion to the youths mostly in developing countries like Nigeria in the right context can be an enabler to contribute to their nancial empowerment and increase their productivity and well-being. Research indicates that young people form their nancial habits and spending patterns as early as the age of 7 years onwards. The prospect of jobs in this sector will be benecial for the young population which makes up 60 percent of the unemployed people in Africa and young people can take advantage of the opportunities created by the digital revolution (Tarhini, Mgbemena, Trab, & Masa'Deh, 2015). Should mobile users connectivity continue to grow, the user's ability to close the educational gap on the continent will increase.
Digital banks will help a huge population of youth in business and entrepreneurship as it will conveniently and affordably connect entrepreneurs with the bank, the supplier of goods and also penetration into new markets which prefer digital payments (Yusuf, &
activity or criminal who wishes to transact with the organization.
By doing this the economic and social effects of money laundering and the funding of terrorist acts, however, can be avoided and the nancial institutions can guard their businesses and the customers with the right attitude and resources, without disrupting business and experiencing reputational harm.
Regulatory concerns.
The banking sector comes with serious problems that have been deeply entrenched in the core nancial business model. While digital-only banks offer many benets to consumers and bankers great risk exist calling for attention of regulators. Financial regulators around the globe have been seeking to ensure that banks and other nancial institutions conduct their business in an orderly fashion and professionally to ensure that they do not facilitate illegal activities like money laundering and terrorism nancing through their services. In September 2014 JP Morgan admitted that emails, phone numbers, and addresses of 83 million account holders had been accessed by hackers in the world largest security breach. Following the hacking incidence, banks and regulators had to be honest with their c u s t o m e r s a b o u t t h e t r a d e - o f f b e t w e e n convenience and security in digital banking. This move has led to governments imposing strict and more stringent rules known as know your customers (KYC) as well as rules for tax reporting. Such rules have increased the compliance burden to many banks, and asset management companies across the globe as they have to deal with these strict rules which are easy for hackers and malicious experts to bypass. Regulatory barriers and the dominance of major banks are common in other countries, that have dominated mobile nance platforms rather than Telco's, only a few Digital-only banks like Kuda, that have been granted licenses for nancial services in Nigeria.
With no legal and explicit regulatory framework that regulates electronic transactions in Nigeria, under the banking and other nancial institution act of 2012 the Central Bank of Nigeria is empowered to control and regulate nancial transactions in the country. The Central Bank embodies various legislation and supervisory bodies which include Central Bank of Nigeria act of 2007, Nigeria deposit insurance corporation act, companies and allied matters act 2020 and the foreign exchange act. According to Yusuf, & Ekundayo, 2018) these acts gives power and authority to the Central Bank Governor, which was used in 2012 to constitute a technical committee that regulates the conduct of digital and electronic
Volume 45, No. 4 OCTOBER - DECEMBER, 2021
11
Ekundayo, 2018). By using such modern systems, the youths will be in a position to accelerate their business, register other online branches, as well as cost reduction due to traveling and incurring other logistical costs.
Digital-only bank services will help Nigerian youths improve on their savings models as well as access and payment of loan facilities which can be a major boost to their businesses. This is supported by fact that digital loan payment automatically provides the user of the bank with a credit history which gives them access to higher credit facilities.
Digital-only banks will give youths in marriages and entrepreneurship great control over their cash ows and incomes potentially benetting their business a n d e n t i r e h o u s e h o l d s e s p e c i a l l y i n t h e micromanagement of funds for budgets and children.
Conclusion.
Regardless of its path to growth in Nigeria and other parts of the world, digital-only banks have multiple challenges and opportunities that must be addressed to cement its operations in local and international nancial landscapes. Banking services and solutions have changed drastically as automation is currently the biggest focus that banks are concentrating on as technology is increasingly growing. With the convenience and economic advantage of digital-only banks, as experienced by the consumers, its market share in Nigeria is gaining traction and over time customer satisfaction will lead to better scalability. Regulators have done incredible job in making Nigeria a good business hub for investors in banking technology. Embracing digitization of banking services from a traditional model to digital-only banks, in our country Nigeria, it will create a good space for enhanced and convenient customer services, reduce human effort and error, helps save time and resources as well as building loyalty to the customers. Nigeria as a developing country and the establishment of digital-only banks will revolutionize the Nigerian market, create employment and jobs for the youth of Nigeria, decrease the unemployment rate, create space for banks expansion through reduced cost of
doing business, and in the long run boost the economy of Nigeria to a developed country.
Recommendations
Nigerians are fast learners and quick to adopt technology, and such an aggressive attitude present a good investment hub for investors in digital ecosystem and value adding solutions to nancial service providers. Nigeria having a stable economic fundamental, internet connectivity, good regulatory climate and easily accessible technology can p r o p e l d i g i t a l - o n l y - b a n k s a d o p t i o n a s transformation is no longer an option but a must considering the fact that 80% of global banks are already implementing digital transformation programs. This comes at a time when the world nancial sector is at the heart of growing wave of technological transformation and digital-only banks have a great future in the banking industry despite the challenges presented by their establishment. Better conditions for the bank can be achieved through moving from functional quantity to quality design quantity, creating seamless multichannel experiences, a well-structured end to end customer onboarding, removing internal silos, and increasing customer values with the digital-only bank services. Its however important to consider that in the digital era almost every online transaction needs KYC compliance, from banking, forex bureau to gambling operators as per the law. For successful running of digital-only- banks healthy and working atmosphere, the desired outcome is that all obliged entities entering the market accurately identify their customers with valid licenses given by regulator as digital only with no physical locations. A critical element to successful AML/CFT outcome is individual risk assessment at the organizational level and at the level of account opening. The standard procedure is the core of identication with AML compliance as well as clarication and codication in order to provide a stable working environment and for the benet of customers and regulators. With absence of adequate and legal regulatory measures to address all associated risk and challenges of digital-only banks, it might hinder customer trust and condence in using this digital banking products and services.
Volume 45, No. 4 OCTOBER - DECEMBER, 2021
12
REFERENCES
Agu, B. O., Simon, N. P. N., & Onwuka, I. O. (2016). Mobile banking–adoption and challenges in Nigeria. International Journal of Innovative Social Sciences & Humanities Research, 4(1), 17-27.
Badmus, G. (2019). A Global Guide to a Crypto Exchange Regulatory Framework. JL Pol'y & Globalization, 90, 9.
Bello, D. A., & Dogarawa, K. (2005). The impact of E-banking on customer satisfaction in Nigeria. University Library of Munich, Germany.
Chiemeke, S. C., Evwiekpaefe, A. E., & Chete, F. O. (2016). The adoption of Internet banking in Nigeria: An empirical investigation. Journal of Internet banking and Commerce, 11(3), 1-10.
Oladejo, M. O., & Oladipupo, A. U. (2017). Capital regulation and the performance of the Nigerian banks: Need for review. Journal of Emerging Trends in Economics and Management Sciences, 2(3), 215-224.
Ojeka, S. A., & Ikpefan, O. A. (2018). Electronic commerce, automation and online banking in Nigeria: Challenges and benets. International Journal of Innovation in the Digital Economy (IJIDE), 3(1), 11-26.
Nel, J., & Boshoff, C. (2021). “I just don't like digital-only banks, and you should not use them either”: Traditional-bank customers' opposition to using digital-only banks. Journal of Retailing and Consumer Services, 59, 102368.
Tarhini, A., Mgbemena, C., Trab, M. S. A., & Masa'Deh, R. (2015). User adoption of online banking in Nigeria: A qualitative study. Journal of Internet Banking and Commerce, 20(3), 1-8.
Salami, I. (2018). Terrorism nancing with virtual currencies: can regulatory technology solutions combat this? Studies in Conict & Terrorism, 41(12), 968-989.
Sanusi, L. S. (2010). The Nigerian Banking Industry: what went wrong and the way forward. Delivered at Annual Convocation Ceremony of Bayero University, Kano held on, 3(1), 2010.
Taiwo, A. (2018). Digital Banking in Nigeria: Issues and Challenges. Available at SSRN 3295514.
Wang, V., Nnaji, H., & Jung, J. (2020). Internet banking in Nigeria: Cyber security breaches, practices and capability. International Journal of Law, Crime and Justice, 62, 100415.
Yusuf, I., & Ekundayo, D. (2018). Regulatory non-compliance and performance of deposit money banks in Nigeria. Journal of Financial Regulation and Compliance.
Volume 45, No. 4 OCTOBER - DECEMBER, 2021
Volume 45, No. 4 OCTOBER - DECEMBER, 2021
INTRODUCTION
Background to the Study
The world marketplace has taken a new turn with t h e a d v a n c e m e n t o f t e c h n o l o g y . Technological innovation has changed the
nature of production and trade, as Industrialization is gradually becoming more capital-intensive, largely due to the discoveries of machineries and technology, as such, has an overwhelming effect on the labour force. New economy emergence has been characterized by increase in productivity and output level, largely dr iven by progress in technological innovations and inventions.
Innovation on its' own is a broad concept which allows for the development of extra or additional steps to increase production in stages. It is the ability to introduce or develop new ways of production of products and services which are useful for accomplishing goals and objectives. It is also a new process of achieving an old task. Therefore, technological innovation is the technological aspect of innovation which emphasizes the use of technology as the key determinant of growth. In the business world, technological innovation is simply a new and improved way o f ach iev ing o r accomplishing traditional tasks. Conventionally, the most important source of growth in economics is technological change (Todaro & Smith, 2013). The invent ion of new technology i s a form of technological innovation; progress in technology changes the process of production of rm's overtime (Perloff, 2012).
Technological change is a series of stages with multiple actors, relationships and feedback loops- from the invention, as new technology is created and prototyped, to innovation as it becomes c o m m e r c i a l l y v i a b l e ( U N I D O , I n d u s t r i a l Development Reports, 2011)’
A large percentage of the growth and increase in productivity across the globe is accounted for by improved technological innovation. An undeniable fact is that technology makes production easier, faster and less costly when compared to human ability, with regards to some cognitive and routine jobs. Technological change is revolutionary with each phase signicantly impacting on the world economies both posit ively and negatively. Developed countries have mostly utilized the t r a n s f o r m a t i o n a l b e n e t s e m b e d d e d i n technological innovation. China, for instance, is considered as the 'future market' by 2025, and Germany remains one of the key drivers of growth and development of the European economy. Technological innovation can be divided into four
ABSTRACT
This study examines the effects of technological innovations on unemployment in Nigeria using annual time series data 1980-2018, Autoregressive Distributed Lag a n d c o i n t e g r a t i o n b o u n d t e s t i n g a p p r o a c h . Technological innovations was proxied by the inow of FDI; importation of Machinery and Equipment as indicator for process innovation (ETC), Patent represents product innovation, while Total Factor Productivity serves as the exogenous technical progress in line with Solow. The result shows that the coefcient of the Inward Foreign Direct Investments (INFDI) is positive (3.85), which is signicant at 5%, indicating a strong positive effect of process innovation on Unemployment. Machinery & Equipment was also positive (2.87) and it's signicant at 5%. However, Patent (-1.20) has a negative and signicant effect on unemployment. By implication, process innovation (with Embodied Technological Change, potentially substitutes labour), therefore, raises unemployment, while product innovation reduces unemployment in Nigeria. There is need to invest more on in-house innovation via R&D activities by, upgrading the learning and skill acquisition standard of the country, and also supporting innovative ventures through discoveries, mentorship, provision of capital and macroeconomic stable environment.
Keywords: Technological innovation, Process innovation, Product innovation, Unemployment, ARDL
JEL: Classication: E24, O33
13
Does Technological InnovationsAffect Unemployment in Nigeria?
Ebunoluwa O. Oyegoke,
Wasiu A. YusufNile University of Nigeria, FCT Abuja
importation of technology hinders development in the long run thereby depriving the home country of the opportunity to be self-sufcient and self-reliant. It requires more capital and hence, leads to an increase in the unit cost of production which increases the prices of the nal goods and services. Certainly, the future of the product markets and the labour markets depend largely on the impact of technological development in years to come (as it has been) (Solow, 1957) (Romer, 1990). For countries to compete internationally and increase productivity and economic growth, their level of investment in technology through R&D activities will inuence their performance. In this digital age, every economy is a product of her level of research and development, innovation and technology. Modern economies and productivity are dependent on technological input and other factors of production. It is widely believed that, although improvement in digital technology results in high productivity, a contrasting view still holds of its' detrimental effect on the future of the labour market, with respect to the sustainability of the human labour, job security, and the future of employment of the generations to come.
Empirical ndings on how technological innovation affects employment are disintegrating. Some researchers have identied the second-order effect of technological innovation which creates new products and new demand, thereby creating new jobs (Miller & Atkinson, 2013) (Harrison, Ruperti, Jaumandreu, Mairesse, & Peters, 2008) (Vivarelli, 2014). On the other hand, others argue that although advancement in technology aids production by making it faster and easier, i t wi l l result in technological unemployment (Matuzeviciute et al 2017) (Keynes, 1933). Globally, advancement in technology has taken a new turn with the advent of the fourth industrial revolution (Industry 4.0).
There is the fear of job displacement in this era, which as a result of innovations, which can be described as daunting, and has received global attention in modern times. More evidently, the fourth industrial revolution might represent Schumpeter's 'Creative Destruction'. In Germany, the launching of the 4th Industrial revolution, (Industry 4.0) has birthed a new dimension of research, with a focus on Robots. The growing concern is the effect of robotization on employment: Recent studies conrm the use of robots in carrying out tasks that were conventionally performed by humans both in the workplace and at the home front (Brzeski & Burk, 2015).
Since the cyclical nature of an economy includes recession at one time and boom at another, job creation and destruction are therefore inevitable, and part of the economy's reaction to change. In developing countries, one major characteristic that is similar to all is that job growth remains stubbornly
14
main types, according to (Oslo Manual, 2005) they are Product innovation, Process innovation, Marketing, and Organizational innovation. However, the study focuses on determining the connection b e t w e e n t e c h n o l o g i c a l i n n o v a t i o n a n d unemployment, hence, the main concern is the rst categories: product and process innovation. Product innovation: is described as the birth, evolution and emergence of new breakthroughs, products, goods and services. (Matuzeviciute, Mindaugas, & Karaliute, 2017). Product innovation improves lives and allows for ease (Ramanauskienė,2010). A good example of product innovation is the ATM machine, telegraph, mobile phones, cars, etc. It opens new opportunities and a great chance for progress.
Process Innovation: this involves a new method, new technologies and new ways of production of goods and services. It is a new and improved way of performing an old task to achieve a better result and enhance overall performance. Automatic data processing and recording have replaced the old-fashioned way of 'back ofce' activities. Also, the increased use of articial intelligence and robotic use are parts of the process innovation of technological growth. Robots tend to be more precise than humans and cost less in the long run (Brzeski & Burk, 2015). Robots designed for production have self-learning abilities. These further stresses the importance of innovation, research and development, and technological advancement for economic growth and development. What d i s t inguishes the economies of developed and developing countries is 'technological innovation'. Technologically advanced countries continue to sustain and improve their economies especially, entrepreneurship by developing internal technology, suitable for the economic condition.
A good example is Singapore, which has been es tab l i shed as a hub fo r i nnovat ion and entrepreneurship and ranked by World Bank as number one with ease of doing business in the world. Singapore as a country has developed a technology plan which spans for ve years, the most recent was developed in 2016-2020, with S$19 billion budgeted for research and technological innovation up from $16.1billion from the previous year. (EEN, 2019). S ingapore has succeeded in proving that technological innovation may not necessarily lead to unemployment given that the unemployment rate is about 0.8% in 2018 and in 2017, it was 0.7%. This is still not far from the natural rate of unemployment in economics.
Most developing countries, on the other hand, keep relying on FDI, (foreign direct investment), that is, most Developing Countries (DCs) import technologies via investment in machinery and capital goods and foreign investments into their countries. The
Volume 45, No. 4 OCTOBER - DECEMBER, 2021
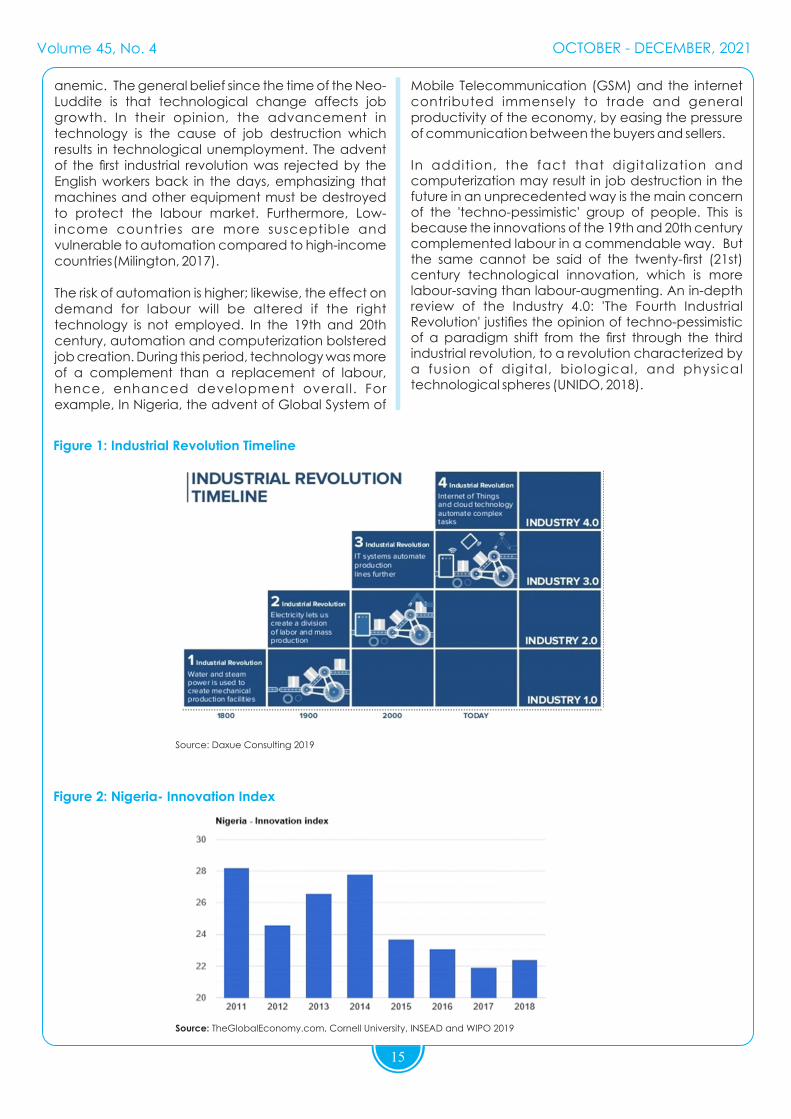
Mobile Telecommunication (GSM) and the internet contributed immensely to trade and general productivity of the economy, by easing the pressure of communication between the buyers and sellers.
In addition, the fact that digitalization and computerization may result in job destruction in the future in an unprecedented way is the main concern of the 'techno-pessimistic' group of people. This is because the innovations of the 19th and 20th century complemented labour in a commendable way. But the same cannot be said of the twenty-rst (21st) century technological innovation, which is more labour-saving than labour-augmenting. An in-depth review of the Industry 4.0: 'The Fourth Industrial Revolution' justies the opinion of techno-pessimistic of a paradigm shift from the rst through the third industrial revolution, to a revolution characterized by a fusion of digital, biological, and physical technological spheres (UNIDO, 2018).
15
anemic. The general belief since the time of the Neo-Luddite is that technological change affects job growth. In their opinion, the advancement in technology is the cause of job destruction which results in technological unemployment. The advent of the rst industrial revolution was rejected by the English workers back in the days, emphasizing that machines and other equipment must be destroyed to protect the labour market. Furthermore, Low-income countries are more susceptible and vulnerable to automation compared to high-income countries (Milington, 2017).
The risk of automation is higher; likewise, the effect on demand for labour will be altered if the right technology is not employed. In the 19th and 20th century, automation and computerization bolstered job creation. During this period, technology was more of a complement than a replacement of labour, hence, enhanced development overall. For example, In Nigeria, the advent of Global System of
Figure 1: Industrial Revolution Timeline
Source: Daxue Consulting 2019
Figure 2: Nigeria- Innovation Index
Source: TheGlobalEconomy.com, Cornell University, INSEAD and WIPO 2019
Figure 2: Nigeria- Innovation Index
Volume 45, No. 4 OCTOBER - DECEMBER, 2021
The Keynesian school of thought also raised concerns about the widespread technological unemployment by Keynes. According to Keynes,
“Due to our d i scovery of means of economising the use of labour outrunning the pace at which we can nd new uses for labour" (Keynes, 1933).
The Keynesian school of thought holds that the discovery of new machinery will possibly destroy the relevance of human labour by displacement of jobs initially performed by a human. Keynes postulations on technological innovation created the awareness of the discovery of machineries that accelerate and enhances productivity, however, might result in detrimental effect on the labour force.
Similarly, there is increasing evidence that the labour markets are hollowing out. According to (Frey & Osborne, 2017), using the occupation-based approach to test for the susceptibility of jobs in the US, the result shows that about 47 per cent of occupations in the US are potentially automatable to replacement by automation, a projection for the next 10 to 20 years to come. Results from a cross-country occupational structure differences shows that about 35.7 per cent of Finland corresponding share of employment is at the high-r isk of automation (Pajarinen & Rouvinen, 2014), out of a total of 30.9 million social insurance companies estimated in Germany labour force, 18.3 million of the jobs which were marginally employed in the analysis stands a high-risk of automation of about 59% (Brzeski & Burk, 2015).
METHODOLOGY
Sources of Data and Methods of Data Analysis
This study, employed secondary data which were sourced from: the National Bureau of Statistics (NBS), World Development Indicators (WDI) (World Bank, 2019)E, Penn World Table version 9, (Robert, Robert , & Timmer, PWT 9.0, 2015), Federal Ministry of Trade and Investment, and the Global Economy (The Global Economy, 2019). The variables employed for the study are:
I Unemployment growth rate (percentage of the labour force)
ii. FDI (foreign direct investment(inow)) (BOP current US$)
iii. PA (Patent) (Total number of registration)
iv. TFP (Total factor productivity in rate)
v. M_E (Machinery and Equipment importation in million Naira)
16
Undoubtedly, Nigeria has a long way to go in embracing the concept of innovation in totality, especially, product innovation which has been established to bolster job creation globally. However, there is emerging evidence of new technology gaining grounds. Therefore, given that the pace of technological development is radical, and the high percentage of jobs at risk in the country presently, how prepared is Nigeria for technological unemployment? Will technological innovation enhance or substitute labour in Nigeria? Is technological advancement a threat to the Nigerian labour force? Can the persistent rise in unemployment be attributed to technological change? If the new innovation and technology become cheaper, are we prepared for the future? The past and present literature on whether, technological innovat ion complements or substitutes labour is highly 'controversial'.
It is a tenet that has remained debatable and inconclus ive. Many scholars be l ieve that technological advancement results in mass job destruction, See( (Stuart , 2007), (Lanier, 2013) (Frey & Osborne, 2017), (Arntz, Gregory, & Zierahn, 2016), (Acemoglu & Restrepo, Robots and Jobs: Evidence from US Labour Market, 2017) (Citi, 2016); others believe that technical change is skill-biased, hence results in polarization of the middle-skill jobs, thereby leading to inequality, (Dachs, 2018) (Santos, 2016). On the other hand, the majority believe that advancement in automation and technology are no threat to employment, on the contrary, robots, machine productivity and automation are key drivers of human progress, (Miller & Atkinson, 2013) (Pankaj, 2018) (Danaher, 2017) (Piva & Vivarelli, 2018) In contemporary research studies, the issue of technological advancement and labour saving is 'inconclusive', that is, technological innovation is neither good nor bad on employment, wages and human labour at large (Acemoglu, 2010) (Michael et al, 2017).
In the case of Developing Countries like Nigeria, innovation has been characterized by more of Embodied Technological Change (ETC) than R&D given our overdependence on importation as well as our taste for foreign goods. Therefore, following the recent studies of (Matuzeviciute, Mindaugas, & Karaliute, 2017), (Bogliacino, 2014) (Dahlman & Chen, 2004), this study examines and assess the relationship between the unemployment and technological innovation in Nigeria, with focus on whether or not increase in technology has substituted or enhanced labour in Nigeria. The study will further examine the effects of product and process innovation on unemployment growth rate in Nigeria.
Volume 45, No. 4 OCTOBER - DECEMBER, 2021
could also proxy for process innovation in developing countries.
The patent which was described as the output of research and development activities; it is a variable of choice because it is one of the commonly used proxies for technological innovation by researchers. Patent and Intellectual Property Rights are being cons ide red as the bes t way to measu re technological diffusion and innovation, see (Jalles, 2010). Total Factor Productivity (TFP) is another proxy for innovation and has been included in this study based on (Solow, 1957) ndings, it accounts for the technological progress which is determined exogenously.
17
The unemployment growth rate is the dependent variable; it represents the total percentage of the labour force that is willing and able to work but couldn't get jobs. If the result shows a negative c o e f c i e n t , t h e n i n n o v a t i o n r e d u c e s unemployment, hence, and it's therefore a complement; however, if it's positive, then it's a substitute. The FDI is one of the ways through which developing countries experience the transfer of technological innovation into their countries, via importation of capital and intermediate goods, machineries and equipment, and other capital imports. It is a part of the Embodied Technological Change (ETC) as explained by (Barbieri, Piva, & Vivarelli, 2016) particularly for DCs. Hence inward FDI
Table 1: The summary of the model is given below:
Variables
Denition
Measurement
Dependent Variable Unemployment (unemploy) Total (% of labour force)
Independent variables Inward Foreign Direct Investment(FDIin) BOP current US$
Patent Registration Total Number registered per year Machinery and Equipment (M_E) Million Naira Total Factor Productivity(CTFP)
TFP at constant national prices (2011=1)
Source: Author's computation (2019
The model specication in a log linear form for long-run is given as:
0 1 1 2 1 3 1 4 1_t t t t t tUN LnFDIin TFP LnM Ea a a a a m- - - -= + RA + + + + (1)
Where: UN = Unemployment rate, PA = Patent, InFD = Foreign direct investment inow, TFP =
Total factor productivity, M_E = Machinery and Equipment, 0a = The intercept, while 1 4a a-
= the slope, tm = the random error
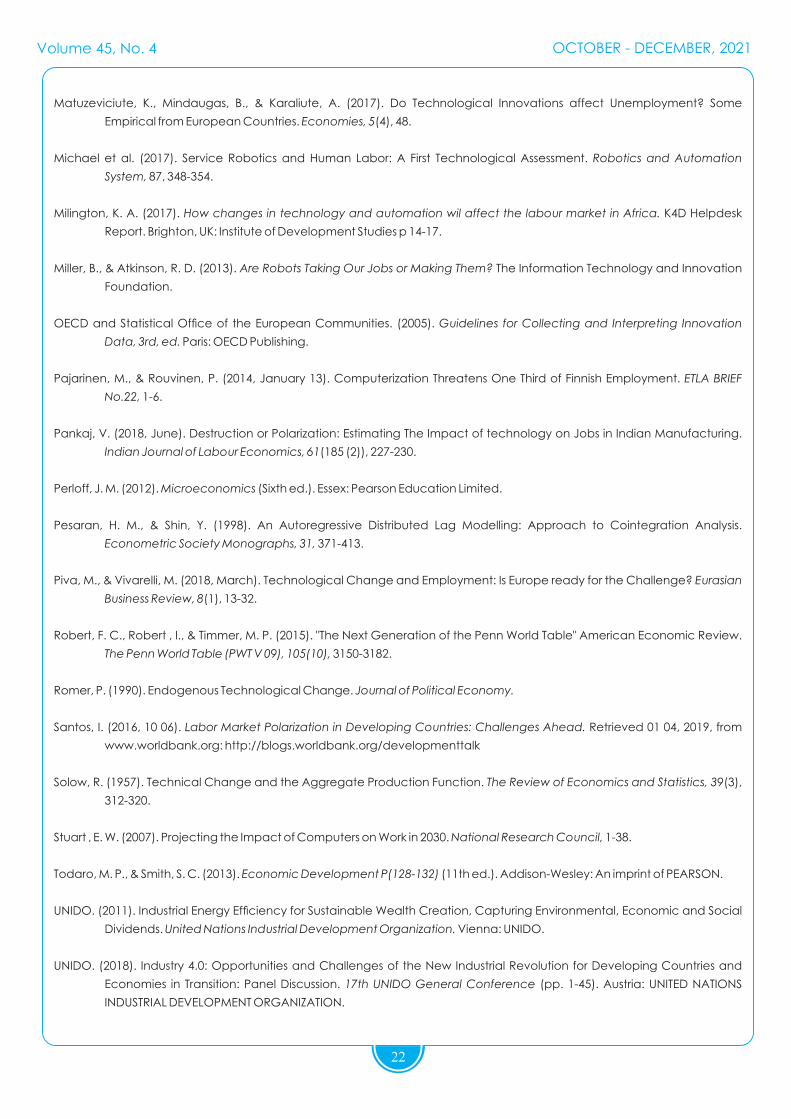
The ARDL estimation technique is a linear analytical tool used for time series models which specify the contemporary and the historical relationship between the endogenous and exogenous variables. The ARDL models are also well known for examining the cointegrating relationships among variables (Pesaran & Shin, 1998), irrespective of their orders of integration I(0(1)).
The model was analysed using ARDL cointegration technique. This ARDL method of estimation is preferred having satised the l(0) and l(1) condition among the series.
Short-run RECM (Restricted Error Correction Model) is given as:
31 2
4
0 1 1 1 1 11 1 1 1
11
ˆ ln
ln_
pp pq
t t i t i t i t i ti i i i
p
i t ti
UN C UN TFP FDIin
M E
a w a b g d
y
- - - - -= = = =
-=
D = + E T + D + DRA + D + D
+ D +
å å å å
å l(2)
While the UECM (Unrestricted Error Correction Model) is given as:
31 2
4
0 1 1 2 1 3 1 4 11 1 1 1
1 1 1 2 1 3 1 4 1 5 11
ln
ln _ ln ln _
pp pq
t i t t t ti i i i
p
t t t t t ti
t
UN UN TFP FDIin
M E UN TFP FDIin M E
a a a a a
b b b b b
m
- - - -= = = =
- - - - - -=
D = + D + DRA + D + D
+ D + + RA + + +
+
å å å å
å (3)
Volume 45, No. 4 OCTOBER - DECEMBER, 2021
Theoretically, process innovation, (ETC) via investment in capital equipment and machinery which is mainly imported through the mechanism of FDI (inow) and is expected to have a positive relationship with unemployment; Product innovation (proxy by patent) i s expected to reduce
unemployment, while process innovation increases unemployment. Total Factor Productivity (TFP) measures the residual growth, explains the long-run growth of the economy, and accounts for progress in product iv i ty, i t i s expected to relate with unemployment negatively.
18
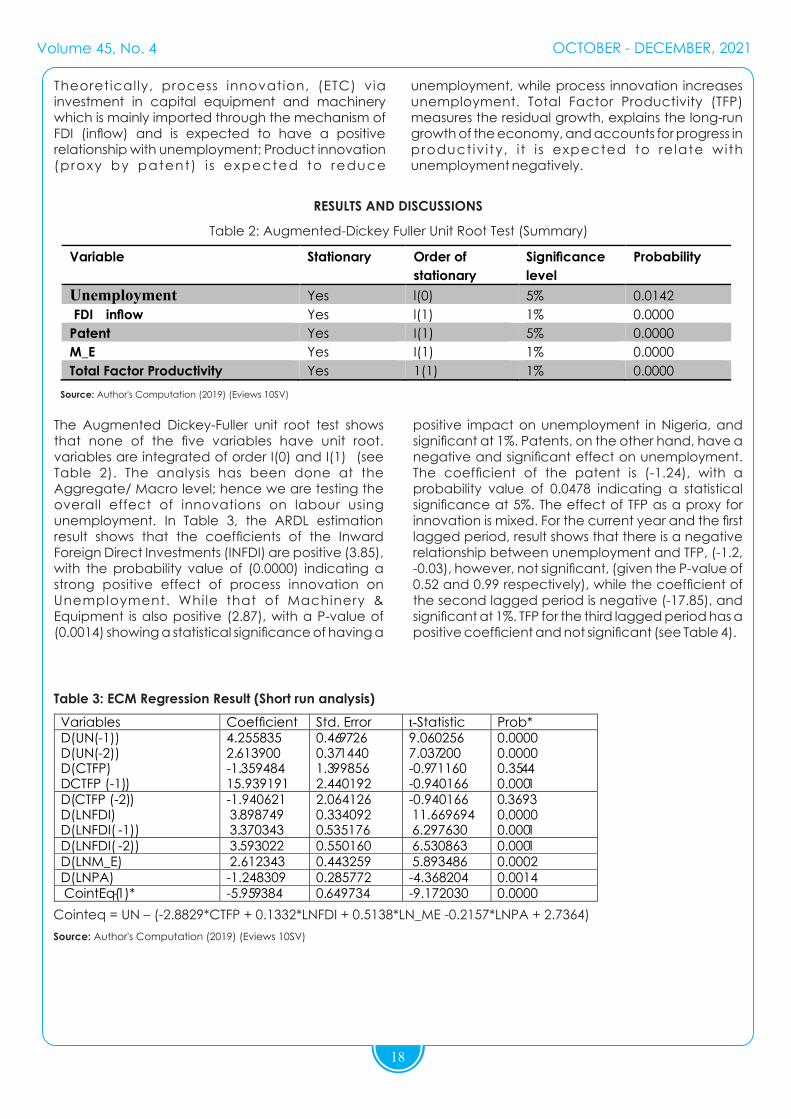
RESULTS AND DISCUSSIONS
Table 2: Augmented-Dickey Fuller Unit Root Test (Summary)
Variable Stationary Order of
stationary Signicance
level Probability
Unemployment Yes l(0) 5% 0.0142
FDI inow Yes l(1) 1% 0.0000
Patent Yes I(1) 5% 0.0000
M_E Yes I(1) 1% 0.0000
Total Factor Productivity Yes 1(1) 1% 0.0000
Source: Author's Computation (2019) (Eviews 10SV)
The Augmented Dickey-Fuller unit root test shows that none of the ve variables have unit root. variables are integrated of order I(0) and I(1) (see Table 2). The analysis has been done at the Aggregate/ Macro level; hence we are testing the overall effect of innovations on labour using unemployment. In Table 3, the ARDL estimation result shows that the coefcients of the Inward Foreign Direct Investments (INFDI) are positive (3.85), with the probability value of (0.0000) indicating a strong positive effect of process innovation on Unemployment. While that of Machinery & Equipment is also positive (2.87), with a P-value of (0.0014) showing a statistical signicance of having a
positive impact on unemployment in Nigeria, and signicant at 1%. Patents, on the other hand, have a negative and signicant effect on unemployment. The coefcient of the patent is (-1.24), with a probability value of 0.0478 indicating a statistical signicance at 5%. The effect of TFP as a proxy for innovation is mixed. For the current year and the rst lagged period, result shows that there is a negative relationship between unemployment and TFP, (-1.2, -0.03), however, not signicant, (given the P-value of 0.52 and 0.99 respectively), while the coefcient of the second lagged period is negative (-17.85), and signicant at 1%. TFP for the third lagged period has a positive coefcient and not signicant (see Table 4).
Table 3: ECM Regression Result (Short run analysis)
Variables Coefcient Std. Error t-Statistic Prob* UN (-1) UN (-2)
-0.600120 -1.616634
0.281849 0.429180
-2.129226 -3.766799
0.0591 0.0037
UN (-3)
-2.362768 0.820543
-2.879517
0.0164
CTFP CTFP ( -1)
-1.289368 -0.031525
1.937446 2.598596
-0.665499 -0.012132
0.5208 0.9906 CTFP ( -2)
CTFP( -3)
LNFDI
-17.85359
3.089202
3.854944
4.247951 2.419910
0.531331
-4.202850
1.276577
7.255259
0.0018 0.2306
0.0000
LNFDI( -1)
LNFDI( -2)
LNFDI( -3)
LNM_E
-0.004913
0.159177
-3.266146
2.866870
0.640807
0.553858
0.703969
0.654495
-0.007667
0.287397
-4.639614
4.380275
0.9940
0.7797
0.0009
0.0014
LNPA
-1.203407
0.533827
-2.254300
0.0478
C
15.2673
16.19734
0.942619
0.3681
R-squared 0.982016 Mean dependent var 10.54775Adjusted R-squared 0.958638 S. D. dependent var 2.889029S.E. of regression 0.587563 Akaike info criterion 2.065531Sum squared resid 3.452303 Schwarz criterion 2.752730Log likelihood -10.78638 Hannan-Quinn criter. 2.247845F-statistic 42.00472 Durbin-Watson 1.941776Prob(F-statistic) 0.000001
Source: Author's Computation (2019) (Eviews 10SV)
However, in the case of DCs, as earlier established empirically, for most DCs, the dominant form of technological innovation is the Embodied Technological Change (ETCs) via importation new technologies (Capital goods, machinery and others) from developed countries (Vivarelli, 2012). In general terms, since most of the technologies are imported, we can imply that technological spill-over and 'Catch-up' substantially account for innovations in DCs, therefore the predominant source is the process innovation which has a productive but job destruction effect on the host countries.
The result of this study further justies the predictions of (Vivarelli, 2015) (Vivarelli, 2012), that process innovation results in technological unemployment, as it is the case of Nigeria, there is a strong positive relationship between inward FDI (Proxy for technological innovation) and unemployment.
As FD I i now inc reases by one un i t , the unemployment rate in return increases by 3.85 units. Patents which represent the output of R&D activities in the country as described by (Vivarelli, 2015), and been considered as the reection of product innovation which has the job-creation effect, has been justied from the regression results. In other words, patent activities relatively in Nigeria have a complementary impact on labour. A unit increase in patent activities results in about 1.2-unit reduction in
The result also reveals that the Total Factor Productivity (CTFP) which according to (Solow, 1957) represents technological progress has a negative impact on unemployment, but not signicant. The coefcient of the TFP is (-1.289) with the probability value of 0.5208, which indicates its' insignicance statistically. Recall that TFP is described as an indicator of 'Technical Change' which accounts for the short-run and long-run economic growth (Solow, 1957), and has been proven empirically to reect actual technological growth (ceteris paribus) (Ceyhun & Cakir, 2014).
More so, evidence from the regression reveals that there is a strong and positive relationship between unemployment and inward FDI. A unit increase in the i n o w o f F D I i n t o t h e c o u n t r y i n c r e a s e s unemployment by 39%. This conforms to the a priori expectation, however, this is in contrast with the ndings of (Matuzeviciute, Mindaugas, & Karaliute, 2017) (Lipsey, Sjoholm, & Sun, 2010) (Fieldmann, 2013) that reveal that inward FDI is negatively related to the unemployment growth rate.
Perhaps, the difference in these ndings can be attributed to the development stage of the countries sampled, as well as the macroeconomic structure and its' effect on the labour force. Most of these empirical results are estimated on technologically advanced countries that invest heavily on in-house innovations hence, a negative effect is expected.
Volume 45, No. 4 OCTOBER - DECEMBER, 2021
positive and negative impact on the labour force, depending on the type of innovation. In quantitative terms, process innovation (proxy by inward FDI and importation of M_E) has labour-saving effects on the labour force in Nigeria, hence a substitute. While product innovation (proxy by patents) has a labour-augmenting effect on the labour force in aggregate terms, hence, a complement.
Recommendations
Technological unemployment can be avoided if the focus is more on labour-friendly innovations, rather than labour-saving. This is possible when in-house Research and Development activities (R&D) are encouraged at all levels. This will bolster job creation by enhancing the introduction of new products, rms and jobs.
Secondly, with regards to inward FDI, the introduction of new technology, as well as the importation of equipment and machinery, might be a key contributory factor to the upsurge of unemployment in most developing countries. More so, evident in the analysis is the sign of the positive effect of inward FDI on unemployment in Nigeria, these results underscore the need to stimulate innovation activities aimed at providing, increasing and stimulating employment in Nigeria.
Given the creative destruction effect of the introduction of new Embodied Technological Change (ETC), technology adaptation rather than outright adoption is more suitable for Nigeria. In other words, it is a fact that importation of technology is a crucial driver of technological innovation in Nigeria, however, adapting and modifying these new technologies will be instrumental in minimizing its' labour-saving effect.
Conclusively, the economy cannot thrive without technology, it is therefore expedient to carefully select the best type of technology most suitable for a country like Nigeria, with high level of youth unemployment. Advancement in technology is ever-increasing, but its' maximum impact is time-bound (World Trade Reports, 2017).
The wave of technology from the rst up to the third industrial revolution has had long-lasting effects on production, but full manifestation took a while, implying that the current wave of technological progress, especially the most feared fourth industrial revolution is perceived to have a potentially destructive nature, and at the same time, make production easier, faster, and cheaper. Therefore, the effect of technological innovation is ambiguous.
20
unemployment in Nigeria. Finally, importation of machinery and equipment which also represents the Embodied Technological Change (ETC) justies the job destruction effects of process innovation. The regression result shows that a unit increase in the i m p o r t a t i o n o f M a c h i n e r y i n c r e a s e s t h e unemployment rate by 2.87 units and is statistically signicant at 1% level of signicance.
Summary and Conclusion
This study examines the impact of technological innovation on unemployment in Nigeria. The primary focus of the study is to determine if technological change complements or substitutes labour in Nigeria. Findings suggest that the effects of technological innovation on the labour force are two folds: positive and negative, and these effects are inuenced mainly by the type of technological innovation employed at that time. The results show that technological innovation can lead to “technological unemployment” Product innovation, on the one hand, enhances labour while process innovation on the other hand potentially renders labour obsolete.
Technological innovation can be detrimental to the economy either directly or indirectly. The impact of technological innovation on labour and social growth of the country depends on the type of technological innovation, the economic institutional mechanism, structure of the country, the channel through which innovation is produced and acquired, human capital development, and a host of others. Economic research have revealed that as protable as technological innovations might be to productivity and development, they are not void of consequences. One major consequence of innovation is the direct effect on employment, which h a s b e e n i d e n t i e d a s " T e c h n o l o g i c a l Unemployment (as earlier discussed).
Therefore, in this study, we have contributed to the existing literature on the debate about the impact of technological innovation on unemployment. Most empirical research has been carried out at the micro-level and the sectoral level, only a few pieces o f r e s e a r c h h a v e b e e n d o n e o n t h e macroeconomic e f fect o f innovat ion on unemployment. Findings also are divergent on the results, while some suggest a strong positive impact, (Fieldmann, 2013), some ndings reveal that there is no clear evidence on the impact of innovations on unemployment (Matuzeviciute, et al 2017).
However, the regression results indicate that overall, there are short and the long-run relationship between technological innovation and the labour force, technological innovations, can have both
Volume 45, No. 4 OCTOBER - DECEMBER, 2021
21
REFERENCES
Bibliography
Acemoglu, D. (2010). When Does Labour Scarcity Encourage Innovation? Massachusetts Institute of Technology .
Acemoglu, D., & Restrepo, P. (2017). Robots and Jobs: Evidence from US Labour Market. National Bereau of Economic
Research(23285), 1-91.
Arntz, M., Gregory, T., & Zierahn, U. (2016). The Risk of Automation for Jobs in OECD Countries: A Comparative Analysis. OECD
Social Employment and Migration Working Papers, No. 189, 1-34.
Barbieri, L., Piva, M., & Vivarelli, M. (2016). R&D, Embodied Technological Change, and Employment: Evidence from Italian
Microdata. IZA DP, No. 10354, 1-34.
Bogliacino, F. (2014). Innovation and Employment: A Firm level Analysis with European R&D Scoreboard data. EconomiA:
Elsevier, 15(2), 141-154.
Brzeski, C., & Burk, L. (2015). The Robots Come, Consequences of Automation for The German Labour Market. ING DiBa
Economic Research.
Ceyhun, E., & Cakir, S. (2014, July). Technological Progress and Scientic Indicators: A Panel Data Analysis. Economics of
Innovation and New Technology, 24(3), 263-281.
Citi. (2016). Global Informed Public. Citi GPS: Global Perpective & Solution.Dachs, B. (2018). The Impact of New Technologies
on the Labour Market and the Social Economy. Science and technology Options Assessment.
Dahlman, C. J., & Chen, D. H. (2004, August). Knowledge and Development: A Cross-Section Approach. 3366.
Danaher, J. (2017, Februaury). Will Life Be Worth Living in a World Without Work? Technological Unemployment and The
Meaning of Life. Springer, 23(1), 41-64.
EEN. (2019). Enterprise Europe Network. Retrieved March 29, 2019, from Enterprise Europe Network: http://www.een-
Scaled explained SS 2.839293 Prob. Chi-Square (18)
0.9985
-10.0
-7.5
-5.0
-2.5
0.0
2.5
5.0
7.5
10.0
2009 2010 2011 2012 2013 2014 2015 2016 2017 2018
CUSUM 5% Significance
Figure 3: CUSUM Tests
Volume 45, No. 4 OCTOBER - DECEMBER, 2021
25
Abstract
Taxation plays a vital role in nancing all government projects and activities, as such, the studies of tax aggressiveness can assist policy makers and tax authorities in addressing companies' illegal tax schemes and taxing business more equitable in the sense that every entity pays their fair share of taxes. The study examines the effect of board structure on tax aggressive of selected industrial goods companies listed in Nigeria Stock Exchange from 20016-2020. Data were obtained from annual report and account of the companies under investigation. Descriptive statistics, ordinary least square regression technique were used to estimate the model. Hausman's specication test was also conducted to choose between xed and random effect, the test favoured random effect over xed effect. The result reveals that rm size (FSZ) and leverage (LEV) are negatively related to tax rate while board size (BSZ), independent directors (IND) and return on equity (ROE) are positively related to tax rate. It was also found that an independent director (IND) was statistically signicant at 1% level, while board size (BSZ) was negatively insignicant. The study concluded that board size (BSZ) has signicant role to play in reducing tax aggressiveness of listed industrial goods in Nigeria and as such the study recommends that regulatory bodies should enforce strict compliance to the provisions of the codes of best practices by Nigerian companies.
Key words: Tax aggressiveness, board structure, return on equity and industrial goods,
Introduction
Taxat ion plays a v i tal ro le towards the development of Nigerian economy. It provides revenue for government to nance all the
activities, ensures resources redistribution, and generates employment. Payment of tax is a civic duty and an imposed contribution by government on her subjects to enable her nance or run public utilities and perform other social responsibilities. Given this, tax system serves as a scal tool used by governments all around the world to achieve her pr imary object ives such as inf rast ructura l development, enhanced security, ensuring economic growth and sustainable development (Bebeji, Mohammed and Tanko, 2015). Although, there are a lot of anti-avoidance laws in most of the countries around the world, however, companies do employ tax experts (tax accountants) to help them in the preparation of false nancial statement in order to pay less tax to the authority concern. (Babayo, 2017)
Desai and Dharmapala (2006) opined that tax aggressive planning involves some levels of obfuscation and complexity to prevent its detection. Thus, if a rm opts for it, it gives room for managers to divert the rm's resource and low level of tax e n f o r c e m e n t s . T h e r e f o r e , c o r p o r a t e t a x aggressiveness seems to be one of the most challenging issues of our generation as it exposes a company to technical tax and reputational risk; and also represents a serious loss of revenue to the government. Recently in (2017), there was a lot of malpractices by corporate bodies were by companies adopted different aggressive ways to reduce their tax obligations. This became an alarming cry as the problem of tax aggressiveness (avoidance) bedevilled the tax system of both developed and developing countries. (Mustapha and Nasir, 2018)
The effort made by the government on the implementation of tax laws in Nigeria proved abortive as corporate tax departments were tuned as a prot centre managing a portfolio of tax issues with signicant emphasis on minimising the amount of tax to be paid. For instance, in the famous Enron case the company's tax department had been turned into a revenue centre, having its annual target. It was then revealed that when a company is being taxed aggressive, investors may not be the benefactors as the complicated transactions and professional cost used to avoid taxes were so expensive and cost the company much. As a result, the investors actually do not benet (Martinez, Ribeiro, & Funchal, 2015). It was also an issue of increasing concern to several parties in the UK, due to the fact that tax planning potentially had a
Board of Directors' Structure and Corporate Tax Aggressiveness of Listed Industrial Goods Companies in Nigeria
negative effect on the level of provision of public goods which then contributed to lots of social issues (Hanlon & Slemrod, 2006).
Furthermore, the lack of tax governance-related information made shareholders value tax planning differently. It is generally expected that shareholders prefer tax aggressiveness since ordinarily paying less tax implies that the rm saves money for its shareholders, This may lead to agency problems as the (board of directors) may not align with the shareholders (investors), thereby making the tax issues complicated (Duke, & Kanlpang, 2011).
As the proliferation of corporate scandal gain its stead in business operations across the globe, investors gradually lost condence in the Capital Markets. As such, Hanlon, and Slemrod (2006) asserts that on the average, a company's stock price declines when there is news about its involvement in tax aggressiveness. This led to great loss of investment by investors' as stock prices gradually declined from a bullish state to a bearish status. Also, Klein and Lefer (1981) argued that customers and suppliers might become wary of dealing with such rms associated with tax aggressiveness, thereby increasing future transaction costs and perhaps causing customers and suppliers to deal with other companies. This is because, engagement in unknown aggressive activity could head to prosecution and associated costs ( Khurana, & Moser, 2013). Desai and Dharmapala (2009) opined that tax aggressiveness may signal dishonesty been extended to the nancial accounting statements.
It is against this background that the study undertakes with a view to evaluate the effect of board of directors on the corporate tax aggressiveness of listed cement companies in Nigeria. The study is signicant in the sense that it would be of immense benet not only to the companies in the Nigerian industrial sector, but also to the Nigerian economy in its entirety in improving tax aggressiveness, enhancing value driving performance for company's survival and in evaluating investment. The study would motivate the regulators in promulgating better corporate governance regulations that would be more encompassing and contribute effectively to enhancing rm values and resolving agency conict.
Research Questions
From the above discussion, the following research questions became pertinent:
I. What is the effect of board size on tax aggressiveness in listed Industrial Goods?
ii. How effect does independent directors have on tax aggressive in listed Industrial Goods?
The study evaluates the effect of board of director's structure on tax aggressiveness of listed industrial goods in Nigeria for the period of twelve (12) years between (2007-2018). However the specic objectives are to:
I. evaluate the effect of board size on tax aggressiveness in listed Industrial Goods in Nigeria.
ii. assess the effect of independent directors on tax aggressiveness in listed Industrial Goods in Nigeria.
2. LITERATURE REVIEW
The study lies on stakeholder's theory as tax aggressiveness become an act aimed at reducing tax liabilities in a planned manner. It is thus important to understand that the interests of stakeholders are not adequately protected as a rm becomes tax aggressive. Companies tend to violate the codes of best practices suggesting that they should be eth ical ly and mora l ly respons ib le to the i r stakeholders; thus they tend not to be socially responsible by minimizing their tax liabilities. For instance, tax aggressiveness affects the stake of the government directly and the public indirectly; as reduction in tax liabilities shrinks government revenue which were to be used in providing infrastructures for the country, which in turn brings about enhanced economic growth and development. (Jiraporn, Kim, & Davidson (2005)
The stakeholders' theory provides that the rm is a system of stakeholders operating within the larger system of the host society that provides the necessary legal and market infrastructure for the rms' activities (Khurana, & Moser, 2013). The purpose of the rm is to create wealth or value for its stakeholders by converting their stakes into goods and services.
Martinez et al., (2015) investigated the effects of the Sarbanes-Oxley Act (SOX) on the tax aggressiveness of Brazilian rms listed on the BM & FBovespa between 2004 and 2012. The Partial regression analysis model was used to analyse the data collected. In practical terms, the result evidenced that the implementation of more stringent internal control does not inhibit aggressive tax practices of Brazilian rms. Thus, they concluded that despite the strong empirical evidence that better internal controls improve the quality of accounting results, these rules alone did not appear to have a signicant effect in reducing the tax aggressiveness of the rms during the period studied.
Bujie (2015) evaluated the effect of board characteristics on tax aggressiveness of listed banks in Uganda. The data was analysed using the regression model and the study nds relationships between corporate governance factors such as
Volume 45, No. 4 OCTOBER - DECEMBER, 2021
27
that the need for the implementation of international codes on corporate governance practices is imperative; as that call for greater independence of the board.
Zemzem, and Ftouhi (2013) investigated the effects of board of d i rectors ' character i s t ics on tax aggressiveness, using a sample of 73 French companies on the SBF 120 index for the period of 2006 to 2010. A regression analysis was used to estimate the data collected. The ndings of the study showed that the board size and the percentage of women in the board affect the activity of tax aggressiveness; while Return on assets and size of the rm were signicantly and positively associated. It was also revealed that the higher proportion of outside members and duality don't reduce the likelihood of tax aggressiveness. The study created a unique insight into board diversity and its impact on tax aggressiveness.
Based on the reviewed literature the following hypotheses were developed.
1HO : there is no signicant effect between board size and tax aggressiveness on listed industrial goods companies in Nigeria.
2HO : there is no s ignicant effect between independent directors and tax aggressiveness on listed industrial goods companies in Nigeria.
3. METHODOLOGY
Since the data is panel in nature the study adopts ex-post factor research design. Out of twenty two (22) listed Industrial goods in Nigeria, fteen companies were selected using simple convenient technique for the period of ve years from 2016-2020 indicating that seven (7) industrial goods companies does not have complete annual report and account for the period under investigation as a result of poor capital constraint and insecurity leading to their liquidation and opt them out as quoted companies in Nigeria. The data was estimated and analysed by employing multiple regression using STATA 16 statistical software.
Model Specication
The model connecting Tax aggressiveness with board structure is given as:
TA= f (Board characteristics) ………….............….....(1)
TA = f (BSZ, IND, ROE, FSZ, and LEV) ………..………. (2)
equation (2) can also be Specied as:
directors' average number of shares in the company, board independency, shareholder power, power of minority shareholders and the effective tax rate, but the relationship may be greatly affected by economic environment. The study concluded that corporate governance factors indeed affects the tax aggressiveness of the companies in Germany.
Khaoula (2013) examined the inuence of corporate governance on tax planning of selected American companies from 1996 to 2009. Multiple regression analysis was used to analyse the data gathered and the ndings of the study revealed directors constitute fundamental factors of corporate tax planning. However, the study found no signicant relationship between board size and the corporate effective tax rates. The ndings of the study support the positive effect of the incentive compensation plans on the CEO performance; and thus, concludes that the adopted compensations policy motivates the COEs to decrease the corporate scal charges. Jalali and Jalali (2013) determined the impact of board of directors' Structure on Tax Avoidance in companies Listed in Tehran Stock Exchange for the period 2010 to 2012. The logistic regression method was used in order to evaluate the data used. the study revealed that the independence of the board had a signicant relation with the aggressive tax policies. However, the ratio of non-executive members of the board did not show a positive and signicant relation with tax avoidance policies. Moreover, board change cannot formulate the tax avoidance policies. The study concluded that a board of increased number of non-executive members apply less aggressive tax policies and also that board changes is not-executive directors that are competent with adequate knowledge on board matters; this wil l enhance the integrity and independence of the board.
Stavroula (2015) studied the association between corporate governance practices and the extent of tax evasion for the Greek listed companies in Athens from 2000 to 2004; when they operated in an accounting environment characterized by a high level of book-tax conformity. A univariate analysis was used to estimate the data collected. The ndings of the study observed that tax evasion is lower when the chairman of the board is also the owner of the company. A strong negative association was reported between tax evasion and the percentage of shares held by the owner and its family members and also percentage of stock held by board members. The remuneration of board members through the distribution of prots was found to signicantly decrease the evasion of taxes whereas tax evasion is higher when board members are also employees of the company. The study concluded
Volume 45, No. 4 OCTOBER - DECEMBER, 2021
28
Where:
TA = Tax aggressiveness is measured by Tax Rate (TRT)
BSZ = Board size
IND = independent directors
ROE= Return on Equity
LEV=Leverage
FSZ= Size (Natural Log of Total Assets)
α=Constant Term
I =No of Firms
t= Time Period
= Error term
4. RESULT AND DISCUSSION
This section present the analysis of result and discussion of ndings, descriptive analysis of variables under investigation, correlation, xed and random effect test as well as Hausman tests were conducted below.
Table 1: Descriptive statistics
In order to examine the characteristics of the series, the descriptive statistics of the variables used in this study for the 15 Industrial Companies over the period twelve (12) years 2007 to 2018 are presented in Table 1. The mean values of tax rate(TRT), board size (BSZ), independent directors (IND), leverage (LEV), return on equity (ROE) and rm size (SZE) 0.75, 5.42, 1.00, 1.54, 0.01, and 6.20,while the median values are 0.22, 4.28, 1.00, 0.18, 0.02,and 4.00 respectively.
The descriptive statistics also shows that there are large margins between the minimum and maximum values of the series. This is an indication of enormous uctuations of the variables over the period considered. In other words, there are signicant changes in all the variables over the period as indicated by their standard deviation (TRT)12.01, (BSZ)1.11, (IND)1.00, (LEV)15.43, (ROE)0.11, and (SZE)1.22, respectively. This shows that the variables are not constant over time. Hence, the study examines their relationship and impact on the dependent variable (TRT). Meanwhile, dividing the standard deviation of each variable by its mean
value (coefcient of variability), gives the extent of changeability of the variable. In this case, TRT (dependent variable) has highest coefcient of variability. This means, TRT varies over the period (2007 to 2018) more than any other variable considered in this study. Therefore the choice of panel regression becomes necessary for the estimation of the model.
In data analysis, test of Multicollinearity via correlation is imperative. Multicollinearity implies interdependence among independent variables in a regression model. It is an economic problem that nullies the result of least square regression and leads to wrong statistical implications as well as misleading policy decisions in research. To examine the existence or otherwise of interdependence among the variables used in this study, a pair-wise correlation test was conducted. This shows the nature of relationship between each pair of the variables used. The result of the correlation as presented in the table above, shows that SZE and LEV are negatively related to TRT while all other variables are positively related to it. Equally, there are mixtures of positive and negative relationship among the variables. Yet, the coefcient of correlations is less than 0.5 for all the variables. Therefore, the correlation among the variables is very weak which indicate the absence of multicollinearity among the variables
Standard errors in parentheses ***, ** and * denote 1%, 5% and 10% level of signicance respectively
Table 2: Correlation Matrix
VARIABLE
BSZ
TRT
SZE
IND
LEV ROE
BSZ
1.000
TRT
0.163
1.000
SZE
0.144
-0.0225
1.000
IND
0.583
0.0086
0.312
1.000
LEV 0.102 -0.0016 0.0808 0.0346 1.000
ROE -0.109 0.059 -0.075 -0.155 -0.0123 1.000
Source: Authors Computation, (2020).
Table 3: Fixed and Random Effect Regression Result
VARIABLES
Fixed effect Random
effect
Board Size (BSZ)
-0.01132
(0.2114)
0.0149
(0.2170)
Independent directors
(IND)
1.3212***
(1.0549)
1.0289***
(0.1683)
Firm size (FSZ)
-0.1224
(0.2631)
-0.0754
(0.2358)
Return on Equity (ROE)
0.1316
(1.1235)
0.5711
(1.0276)
Leverage (LEV)
2.117e-06
(0.0131)
3.9791e-02
(0.0017)
Constant 8.909***
(1.9596)
15.037***
(2.6134)
R-squared 0.112 15
Source: Authors computation (2020).
Volume 45, No. 4 OCTOBER - DECEMBER, 2021
29
The result of the xed effect regressions for the investigation of the effect of board characteristics on corporate tax aggressiveness is represented in by TRT while the independent variables are Board size (BSZ), Independent directors (IND), Firm size (FSZ), Return on Asset (ROE) and Leverage (LEV).
The result in table 3 indicates that BSZ and FSZ are negatively related to tax rate (TRT), -0.01132 and - 0.1224, as seen in the coefcient of the variables 0.2114 and 0.2631 respectively. While (IND), (ROE) and (LEV) are positively related to TRT 1.3212, .1316 and 2.11 respectively as also revealed by the coefcient of the variables 1.0549, 1.1235, and 0.01331 respectively. However, an independent director (IND) is the variable that is statistically signicant. This implies that the variable independent directors (IND) have signicant impact on corporate tax aggressiveness measured by TRT of Listed industrial goods companies in Nigeria.
The extent of the impact of the variables is measured by the values of the coefcients of the variables in (table 3). By size, the estimates of the coefcients show that an increase in independent directors (IND) will respectively lead to 0.2114 and 0.2631 increases in the (TRT). By implication, listed industrial goods companies in Nigeria with higher number of independent directors (IND) would have higher tax rate (TRT). This indicates that independent directors (IND) have great impact on tax aggressiveness of listed industrial goods companies in Nigeria.
Meanwhile, the random effect result shows that FSZ is negatively related to (TRT) at -0.0754 with a coefcient of 0.2358 while Board size (BSZ), Independent directors (IND), return on equity (ROE) and leverage (LEV) (0.0149,1.0289,0.5711 and 3.9791) with coefcients of (0.2170, 0.1683, 0.0276 and 0.0017) are positively related to TRT. This is similar to that of the xed effect regression except for the FSZ that has negative relationship with TRT in the xed effect model earlier reported. Meanwhile, the random effect model shows that Independent directors are statistically signicant.
As seen in the table above, the signicance is indicated by asterisks. The statistical signicance implies that, IND is important determinants of TRT. Thus, the coefcient of the variable as stated above indicates that an increase in independent directors (IND 1.0289) will lead to increase in TRT of listed industrial goods companies. Therefore, the random effect regression shows that IND has signicant impact on the TRT and subsequently affect the extent of tax aggressiveness listed industrial goods companies in the Nigeria.
Hausman test was conducted to make a choice between Fixed and Random Effects Model estimates as shown on the table above the calculated p-value is lower than signicance level of 5%, we are not inclined to accept the null hypothesis that the differences between the estimated parameters yielded by the two estimation techniques are not systematic. As a result, random effects method produces better results for the model and is therefore adopted for this study.
RESULT INTERPRETATION
The existence of independent director on the board was examined and the study revealed a positive relationship between both variables, as the existence of independent director has a signicant impact on tax aggressiveness of quoted nancial service companies in Nigeria. This implies that the existence of a higher percentage of independent directors on the board increases the effective tax rate (tax aggressive activities are low). In other words, the presence of independent director impacts negatively on tax aggressiveness of Nigeria industrial goods companies; thus the null hypothesis is rejected. Therefore, nding this study in line with the work of (Mustapha and Nasir 2018), in Pakistan, but contradict the works of (Martinez et al, 2015) which showed that the existence of independent directors had no signicant effect on the corporate tax planning of Brazil.
5. CONCLUSION AND RECOMMENDATIONS
Based on the ndings, the study concludes that signicant relationship exists between board characteristics and tax aggressiveness of listed industrial goods companies in Nigeria. Therefore, the study recommends that the listed industrial goods companies in Nigeria should give less attention to the size of their board, and focus on the quality and integrity of the members of the board; in respect to her members having broad cognate experience and expertise on board matters. More so, they should adhere strictly to the provisions of the SEC and CBN code of corporate governance which provides that a company should have one (1) and two (2) independent di rectors respect ively. Th is i s necessitated as the presence of independent directors to ensure independence of the board.
Table 4. Hausman Test
Model
Test Summary
Chi-Sq. Statistic
Chi-Sq. d.f Prob.
One
Cross-section random
13.21
4 0.1535
Authors computation, (2020).
Volume 45, No. 4 OCTOBER - DECEMBER, 2021
REFERENCES
Babayo, U. K. (2015). The effect of board size and composition on the nancial performance of banks in Nigeria. African Journal of Business Management, 6(4), 159-181.
Bujie , I. K. (2015). The effect of board characteristics on the tax aggressiveness of banks in Uganda. African Journal of Management Sciences and Arts, 6(4), 530-544.
Central Bank of Nigeria. (2014, April 12). Code of Corporate Governance for Bank Post Conso l idat ion . Ret r ieved f rom http://www.cbn.org.ng
Desai, M. A. & Dharmsapala, D. (2009). Corporate Tax Avoidance and Firm Value: Journal of nancial Economics, 79(1), 145-179.
Duke, J., & Kankpang, K. A.(2011). Linking Corporate Governance with Organisational Performance: New Insights Evidence from Nigeria. Global Journal of Management and Business Research, 11(12), 46-57.
Hanalon, M., & Slemrod, J. (2006). What Does Tax Aggressiveness Signal? Evidence from Stock Price Reactions to News About Tax Aggressiveness: Journal of Public Economics, 93(1-2), 126-141
Hundal, S.(2011). Why Tax avoidance is among the biggest Issue of our generation. Retr ieved from http://www.liberalconsipracy.org.
Ibrahim, A. S., Hairu, A. A. & Siti, N.(2013). Ownership Structure and Corporate Tax Aggressiveness: A Conceptual Approach. International Accounting Business Conference(IABC). Munich.
Issama, L., Stagliano, R. & Jamal, E.(2015). Does Corporate Social Responsibility Affect Corporate Aggressiveness: Journal of clear Production, 2(3), 113-141.
Jalali, M.,& Jalali, F.(2013). Impact of Board of Directors's Structure on Tax Avoidance in the Companies Listed in Tehran Stock Exchange. Business Management and Strategy, 5(7), 64-70.
Jiraporn, P., Kim, Y. S., & Davidson, W. N. (2005). CEO compensation, shareholder rights and corporate governance: An empirical Analysis. Journal of Economics and Finance,29(3), 246-259.
Khaoula, A., & Ali, Z. M. (2013). The board of Directors and corporate tax planning: Emprical Evidence from Tunisia. International Journal of Accounting and nancial Reporting, 2(2),111-120.
Khurana, I., & Moser, W. J. (2013). Institutional shareholders' investment horizons and tax avoidance: American Accounting Association, 35(1), 101-125.
Klein, B., & Lefer, K. B. (1981). The role of market forces in assuring contractual performance. Journal of Political Economy, 89(1), 615-641.
Kraft, A. (2014). What really affects Germen rms' effective tax rate? International Journal of nancial Research, 5(3), 231-244.Landry, S., Deslandes, M., & Fortin, A. (2013). Tax Aggressiveness, Corporate Social Responsibility, and Ownership Structure.
Journal of Business Ethics, 75(3), 325-334.
Mustapha, B & Nasir, U. (2018). Corporate governance and Tax aggressiveness of listed nancial services In Nigeria: Journal of Law, Economics and Management Sciences, 1 (1), 125-139.
Martinez, A. L., Ribeiro, A. C., & Funchal, B. (2015). The Sarbanes Oxley Act and Taxation: A Study of the Effects on Tax Aggressiveness of Brazilian Firms. Strategic Management Journal, 43(3), 155-161.
Stavroula, K. (2015) Doe Corporate Governance Practices Restrain Tax Evasion? Evidence from Greece. Journal of Accounting and Taxation, 8(1), 1-10.
Zemzem, A., Ftouhi. K. (201). The Effects of Board of Directors' Characteristics on Tax Aggressiveness. Research Journal of Finance and Accounting, 4(4), 120-143.
With the Nigerian economy oscillating around financial quagmire and fast moving towards fiscal unsustainability, this study analysed the impact of
disaggregated expenditures on economic growth. Employing data from 1980 to 2019, the study established through the autoregressive distributed lagged technique that heterogeneity in expenditure is relevant to economic growth, with recurrent expenditure contributing insignificantly to economic growth, while capital expenditure negatively impact economic growth. Thus, among other policy options, the study suggested appropriate expenditure switching policies that prioritise capital expenditure over recurrent expenditure and that government should engage more in the provision of capital projects in the economy.
JEL Classification: E24; E52
Keywords: Fiscal, Expenditure, Recurrent Expenditure, Capital Expenditure, Economic Growth, ARDL
INTRODUCTION
No economy operates in a vacuum devoid of fiscal responsibilities. Economic activities require financial obligations to be undertaken.
This involves huge expenditure on activities such as security, health, agriculture, education, and other social and economic activities. The growth level of an economy largely depends on a well-articulated and coordinated expenditure framework taking into cognizance current economic realities.
Nigeria is not insulated from financial obligations and its burdens. Several years of maladministration and financial misappropriation has resulted in huge expenditure which are largely financed by domestic and external borrowings (Omotor, 2019; Ekpo and Udo, 2013). For instance, aggregate expenditure rose from N11.41 billion in 1981 to N701.05 billion in 2000. This figure stood at N9,286.39 billion in 2019. During this period, external and domestic debts rose from N2.33 billion and N11.19 billion respectively in 1981 to N3,097.38 billion and N898.25 billion respectively in 2000. External and domestic debts stood at N9,022.42 billion and N14,272.64 billion respectively in 2019 (CBN, 2019).
Several studies on the relationship between expenditure and economic growth in Nigeria have emphasised on the delimitating effects of huge Government expenditure on economic growth. As plausible as their findings sounds, other studies showed that such expenditures have impacted growth negatively (Udoh, et al., 2020; Nwaeze, et al., 2015; Obed, et al., 2017; Ewubara, et al., 2017; Ekpo and Udo, 2013; among others).
However, recent trend in the Nigerian Government spending accompanied by huge borrowing from local and international sources have raised fears that the country might be moving on a knife-edge towards insolvency. For example, orchestrated by the emerging COVID-19 pandemic, the Government launched the N500 billion ($1.3 billion) COVID-19 Intervention Fund. The country also had the Central Bank of Nigeria (CBN) N50 billion credit facility and N100 billion credit intervention (Central Bank of Nigeria, 2020). To fund these laudable projects and programmes, the Government resorted to borrowing $4.34 billion from the domestic stock market and $3.4 billion from the International Monetary Fund (IMF, 2020; Dixit, et al., 2020). Currently, the Government is proposing to access $1 billion and $2.5 billion from the African Development Bank and the World Bank, respectively (Dixit, et al., 2020; Osae-Brown and Soto, 2020).
The above trend raises several questions: What is the impact of aggregate expenditure on economic
Efayena O. Oba
Is the Heterogeneity of Expenditure Relevant to Economic Growth? The Case of Nigeria
Department of Economic University of Nigeria Nsukka
growth? Is the heterogeneity of expenditure relevant in the expenditure-economic growth relationship? These questions form the crux of the study. To answer those questions the study draw from the expenditure-growth studies. This paper contributes to the expenditure-economic growth discussions by focusing on the heterogeneity of the various components of aggregate expenditure as they impact economic growth.
The rest of the paper is organised as follows. Section 2 provides a brief overview of expenditure and economic growth trajectories in Nigeria. Section 3 deals with the literature review and Section 4 presents a review of the methodology employed in the study; Section 5 presents the empirical results; Section 6 presents policy recommendation; while Section 7 concludes the study.
In the last six decades, the Nigerian economy has experienced several social and economic upheavals, ranging from high unemployment rate, huge public debts, low capital investment, high poverty rate, to huge Government fiscal deficits, just to mention a few. Following Nigeria political independence in 1960, the Nigerian history has been an “oil-dependent” narrative. Between 1960 and 1974, Government fiscal deficits was not an economic issue even though the two coup d'états of 1966 and the civil war (1967-70) depressed economic growth between 1966 and 1967. The oil boom of 1973-1974 era as well as sharp oil price increase of 1979-1980 led to high Government expenditure with the aim of building the capacity of the oil industry. These programmes and projects led to huge financial burdens and did not significantly contributed to economic prosperity since the economy lacked the requisite capacity to handle such projects (Ajayi, 2003).
A slump in oil prices in the 1980s further damped economic growth, although this did not discouraged Government spending. Despite fiscal deficits due to revenues shortfall Government expenditures continued to grow. There has been an increasing trend in Government fiscal deficits since 1980. This figure rose from N3.90 billion in 1981 to N103.78 billion in 2000. At 2019 Government fiscal deficits stood at N4.913.82 billion (CBN, 2019). To finance these increasing fiscal deficits, the Government resorted to excess borrowing from domestic and external sources.
T radi t ional ly , Government expendi tu re i s decomposed into two: recurrent and capital expenditure. Each of is segmented into the following:
1. Administration (General Administration, Defence, Internal Security, National Assembly).
2. Social and Community Services (Education, Health, Other Social and Community Services)
3.Economic Services (Agriculture, Road & Construction, Transport & Communication, Other Economic Services)
It should be noted that Government intervention in the economy through fiscal policy is not only to correct for market failures, but also to ensure a level playing field for all stakeholders and avoid Government failures. The economy, if let alone to operate under the often – unrealistic competitive market assumptions would operate at sub-optimal level satisfying only a fraction of the population. Hence, Government spending in education, health, security, research, environmental issues, among others, lubricate the wheels of growth and development.
Government expenditures as a component of fiscal policy remain crucial for growth and development. Capital expenditures which involves investments such as roads, railways, power, hard infrastructure, and soft infrastructure like education and health are essential for growth. In the same vein, recurrent expenditures would enhance growth during periods of declining productivity and/or recession. However, the extent of the impact of expenditures on growth needs to be subjected to empirical test. The bulk of recurrent expenditure is for personnel cost. Government expenditures are also used in purchasing goods and services as well as interest payments.
Figures 1 and 2 show the trend in the sub-divisions of the recurrent and capital expenditure. Figure 1 shows that transfers and administration constituted the highest proportion of recurrent expenditure. By impl icat ion Niger ia recurrent expenditure predominantly covers defence internal security, national assembly, public debt servicing, pensions and gratuities, as well as contingencies/subvention. Negligible amount is allocated to economic, social and community services.
32
Volume 45, No. 4 OCTOBER - DECEMBER, 2021
33
Source: CBN Statistical Bulletin (2019).
In the case of capital expenditure, more financial resources are allocated to economic services. A look at the disaggregated expenditure shows that during 1981-1997 period, recurrent and capital expenditure were relatively moving in tandem. However, from 2000, recurrent expenditure increased at a faster rate. For instance, while capital expenditure was N239.45 billion in 2000, recurrent expenditure stood at N461.60 billion. At 2019, recurrent expenditure stood at N6997.39 billion, while capital expenditure was just
N2,289.00 billion (see figure 3). In all the years, recurrent expenditure has taken prominence over capital expenditure as can be seen in Table 1. In the 1981-90 era, the ratio of capital expenditure in total expenditure was 43.34 per cent while that of recurrent expenditure was 56.66 per cent. In the 2011-2019 era, the recurrent expenditure-total expenditure ratio was 79.32 per cent, with that of capital expenditure slightly above 20.0 per cent.
Source: CBN Statistical Bulletin (2019).
Volume 45, No. 4 OCTOBER - DECEMBER, 2021
34
Source: Authors' Compilation.
The growth of expenditure vis-à-vis that of GDP is also worth noting. Wide gyrations were observed in the growth of total expenditure when compared with that of GDP, indicative of fiscal deficits (see Figure 4). The implication of such movements in expenditure on economic growth is worth given empirical consideration.
-40.00
-20.00
0.00
20.00
40.00
60.00
80.00
100.00
120.00
198
1198
2198
3198
4198
5198
6198
7198
8198
9199
0199
11
99
2199
3199
4199
5199
6199
7199
8199
9200
0200
1200
2200
3200
42
00
5200
6200
7200
8200
9201
0201
1201
2201
32
01
4201
5201
6201
7201
8201
9
Figure 4. Nigeria: Growth in Expenditure and GDP, 1981-2019.
GDP Growth Growth in Total Expenditure
Source: CBN Statistical Bulletin (2019).
Table 1. Nigeria: Recurrent and Capital Expenditures as Ratios of Total Expenditure
(%), 2010-2019
Year Capital Expenditure/Total
Expenditure (%) Recurrent Expenditure/Total
Expenditure (%)
1981-1990 43.34 56.66
1991-2000
48.29
51.71
2001-2010
29.59
70.41
2011-2019
20.68
79.32
Interestingly, capital expenditures which are essential for growth and development grew negatively between 2014 and 2017 with marginal increases in value in subsequent years. A cursory examination of Nigeria's budget shows that since 2010, in no year was capital expenditure above 30.0 percent of total expenditure yet this component is vital for growth (CBN, 2019). The expenditures profile stresses more on allocation rather than outcomes.
3. LITERATURE REVIEW
Empirical studies on the expenditure-economic growth nexus are far from being conclusive, since these studies have produced conflicting results. While some of the studies have produced positive relationship (Kimaro, et al., 2017; Attari and Javed, 2013; Yasin, 2000), others have asserted a negative relationship (Sáez, et al., 2017; Nurudeen and Usman, 2010). Still others are neutral in their conclusion (Shahid et al., 2013; Egbetunde and Fasanya, 2013;
Schaltegger and Torgler, 2006).Gabor and Marton (2020) utilised the General Method of Moment (GMM), fixed effects panel and ordinary least squares (OLS) models on economic data of 25 EU countries in the period 1996 to 2017; Leshoro (2017) analysed data of 1976 to 2015 in South Africa using the ARDL technique; Guandong and Muturi (2016) employed the random effect panel analysis on South Sudan data covering 2006 to 2014; Al-Fawwaz (2016) used both the OLS and multiple regression models on expenditure and growth data of Jordan between 1980 and 2013; Shahid, et al., (2013) estimated Pakistani data between 1972 and 2009 using the ARDL model on disaggregated expenditure ( d e v e l o p m e n t e x p e n d i t u r e a n d c u r r e n t expenditure); while Yasin (2000) employed data of 26 Sub-Saharan African (SSA) countries between 1987 and 1997, utilising both the fixed and random effects estimation techniques. These studies established a positive impact of expenditure on economic growth. In addition, Barlas (2020) analysed Afghanistan data
Volume 45, No. 4 OCTOBER - DECEMBER, 2021
35
of 2004 to 2019 using the ARDL model and found that expenditure on education and infrastructure positively impact economic growth.
On the other hand, other studies showed that expenditure exerts a negative impact on economic growth. For instance, Barlas (2020) analysed Afghanistan data of 2004 to 2019 using the ARDL model and found that expenditure on security negatively impact economic growth. Ghosh and Gregoriou (2008) examined the impact of expenditure on economic growth in 15 developing economies utilising the GMM and found that capital expenditure impact economic growth negatively. The study of Chirwa and Odhiambo (2016) was undertaken in South Africa utilising the ARDL technique with a dataset spanning between 1970 and 2013. The study showed that in both the short-run and long-run, expenditure impact economic growth negatively.
Employing a panel data of 19 sub-Saharan Africa (SSA) countries between 1982 and 2000, Ndambiri et al., (2012) utilised the GMM technique and found that expenditure negatively impact economic growth. In the same vein, the study of Sáez et al., (2017) also employed panel data of selected EU countries spanning 1994 to 2012 and found that Government spending impact on growth negatively among the EU countries. Lupu, et al. (2018) constrained the scope of their study to 10 selected Central and Eastern European countries. Using data of 1995 to 2015 and 10 disaggregated expenditure categories in an ARDL framework, the study found a negative impact.
A wide range of literature have examined the effect of expenditure on economic growth in Nigeria. Some studies in Nigeria analysed the impact of disaggregated expenditure on economic growth. For instance, Onifade, et al., (2020) examined the impacts of capital expenditure and recurrent expenditure on economic growth. Employing the ARDL technique on economic data between 1981 and 2017, the study had mixed findings. Specifically, recurrent expenditure impacted economic growth negatively, whereas capital expenditure impacted economic growth positively, although the impact was not significant. Bonmwa and Ogboru (2017) utilised two models on recurrent and capital expenditure on economic data ranging from 1981 to 2016. The study found that Government expenditure did not significantly impacted economic growth. Specifically, while expenditure on administration and social services negatively impact economic growth, expenditure on economic services positively impact economic growth although their impacts were insignificant. Ogar, et al., (2019) investigated the impact of Government expenditure on economic growth. Expenditure was disaggregated into capital
and recurrent expenditures, while the study covered the 1980-2017 period using the VAR technique. Empirical findings showed that capital expenditure has an insignificant positive impact on economic growth. It also established that recurrent expenditure has an insignificant positive effect on economic growth in the short-run, whereas it exerts a negative and insignificant effect on economic growth in the long-run.
In the same vein, utilising disaggregated data between 1999 and 2016, Chineze (2018) found that health expenditure exerted a positive and significant impact on economic growth, while the other disaggregated expenditures did not. These findings showed that expenditure has differential effects on economic growth. This corroborated the conclusion of Ebong, et al., (2016) who approached the expenditure-growth hypothesis using sectoral expenditure in Nigeria. Using capital expenditure in the education, agriculture, health and infrastructure between 1970 and 2012 in a multiple regression model, the study found that whereas capital expenditure in the agricultural sector did not impact on economic growth in both the long-and short-run, capital expenditure in the education exerted a positive impact on economic growth. Both the long-and short-run effect of the capital expenditure on health was negative and insignificant. A previous study by Nurudeen and Usman (2010) using data between 1979 and 2007 established that sectorally, Government expenditure on transport and communication and health positively and significantly impacted economic growth.
In the case of Okoye, et al., (2019), their study had mixed findings. Using data from 1981 to 2017, the study found that while capital expenditure exerted positive effects on economic growth, recurrent expenditure negatively impacted economic growth. Whereas, Danladi, et al., (2015) in analysing the expenditure-growth model employed the ARDL technique on economic data ranging between 1980 and 2013 and found a positive impact exerted by expenditure on economic growth. This corroborated the study of Egbetunde and Fasanya (2013) which also employed the ARDL technique on data from 1970 to 2010.
A consideration of the reviewed studies in Nigeria showed that other than a few studies such as Bonmwa and Ogboru (2017) which utilised two models in analysing the impact of expenditure on economic growth, there is dearth in local studies on the heterogeneity of expenditure as it relates to economic growth. There is need to carry out a comparative analysis of the impact of aggregated and disaggregated expenditure on economic growth.
Volume 45, No. 4 OCTOBER - DECEMBER, 2021
36
4. METHODOLOGY
This section presents the theoretical framework of the study, empirical models and data employed in the study.
4.1. Theoretical Framework The study hinges on the Keynesian framework given below:
Where;Y is output or national income; C refers to consumption by households; I refers to private investment; G is the exogenously determined Government expenditure; X denotes exports; M refers imports; (X-M) refers to net exports; while t refers to the time period.
The Keynesian theory assumes households' consumption to be a function of income and this can be expressed as:
Where
co = autonomous consumption (i.e. consumption not dependent on income level)cyY = the consumption level dependent on households' income.When tax is incorporated into equation (2), we have;
Given a domestic interest rate as r, private investment function can be written as:
Trade is decomposed into exports and imports. Exports are assumed to be a function of world income (Y) and real exchange rate (e) (see equation 5); while imports are assumed to be a function of exchange rate (e) and disposable income (Y), as seen in equation 6.
In order to attain equilibrium in national income, substitute equations (3)-(6) in the national income expression (Equation 1). We obtain the following:
Note that α0 refers to the autonomous expenditure components in the given economy. The exogenous Government expenditure is disaggregated into recurrent and capital expenditure, each of which has functional components. Equation (7) thus implies that ceteris paribus, economic growth depends on Government expenditure, among other factors.
4.2. Estimation Techniques and Data
The expenditure-economic growth relationship is analysed using the autoregressive distributed lag (ARDL) technique (see Pesaran, et al., 2001; Pesaran & Shin, 1999). The method holds several advantages over other conventional cointegration techniques. The results of the ARDL gives more robust estimates and the technique can be applied to small sample sizes. This is essentially an advantage over the Engle-Granger (1987) and Johansen and Juselius (1990) methods which are highly unreliable for small samples (Pesaran, et al., 2001). The estimates of the ARDL are asymptomatically normal and consistent since the efficiency of the technique do not depend on the level of integration of the data. Thus, the ARDL technique basically has no pre-testing issues. In order to ascertain the need to adopt this technique, there would be need to first test for unit roots among the dataset using the Augmented Dickey Fuller (ADF) unit root test. This is to ensure stationarity among the variables, ensure that no variable is of higher degree of integration more than one and avoid spurious results. The study employs data spanning 1981-2019.
4.3. Empirical Model Specification
4.3.1. Expenditure-Economic Growth Model
In equation (8), we specified the aggregate expenditure in the economic growth model. However, to capture the impact of Government expenditure in a disaggregated form (recurrent and capital) on economic growth, we specify the following long-run equation:
4.3.2. Variables Operationalisation
The table below operationalised the variables in equations (8) and (9). All variables are expressed in their logarithm forms.
Volume 45, No. 4 OCTOBER - DECEMBER, 2021
37
Source: Authors' Compilation
5. Empirical Results and Discussion
· Preliminary Results: Unit Root AnalysisThe unit root test was carried out to check the nature of the dataset and avoid the issue of spurious
regression results. The study adopted the Augmented Dickey Fuller unit root test and the results are presented in Table 3. The choice of the ARDL technique is validated given the varying level of integration of the variables [I(0) and I(1)].
Source: Authors' Compilation
5.1. Empirical Results· Bound TestThe level of cointegration of the data necessitated the bound test which measures the joint significance of the variables (Pesaran, et al., 2001). The results of the bound test under the restricted deterministic trend
(Fλ), unrestricted deterministic trend (Fθ), and without deterministic trend (Fπ) is presented in Table 4. A comparison of the computed F-statistic and the critical F-statistics shows a cointegration or a long-run relationship among the variables at the 1.0 percent level of significance.
Source: Authors' Compilation
Table 2: Model Variables
Variable
Description
Source
GDPG
GDP growth (a proxy for economic growth)
World Bank Indicators (WDI)
CE Capital expenditure CBN Statistical Bulletin
RE Recurrent expenditure CBN Statistical Bulletin
OPN trade openness (total of exports and imports divided by GDP)
CBN Statistical Bulletin
PI Private investment CBN Statistical Bulletin γ0
–
γ6 Long-run multipliers
λk
–
λr
Short-run multipliers
ECTt-1
Captures the speed to recovery to equilibrium in the economic growth model.
Table 3: Unit Root Test
Variable @ Level @ 1st Differences Status
GDPG -3.27* -7.13*** I(0) INF -0.19 -3.19** I(1) OPN -1.99 -4.21** I(1) PI -0.87 -6.11*** I(1) RE -3.23** -8.58*** I(0) CE -0.89 -3.71** I(1)
· Long-run ResultsThe long-run results are presented in Table 5:
38
The results revealed a positive but insignificant impact of recurrent expenditure on economic growth. Specifically, a 10.0 per cent increase in Government recurrent expenditure increases economic growth by over 7.6 per cent although the increase is statistically insignificant. Capital expenditure significantly impact on economic growth negatively. For instance, a 10.0 per cent increase in government capital expenditure decreases economic growth by over 10.0 per cent. This implies that capital expenditure in Nigeria has not positively impact economic growth. This is possibly caused by the bureaucratic processes which allow for excesses in the implementation of capital projects. The findings of this study on the impact of recurrent and capital expenditure on economic growth in Nigeria is in consonance with the findings of Okoye, et al., (2019), but at variance with those of Onifade, et al., (2020) and Ogar, et al., (2019).The control variables (trade openness and private investment) did not evidently impact economic growth positively during the period under consideration.
· Short-run ResultsThe short-run results are presented in Table 6:
The short-run regression results presented in Table 6 showed that recurrent expenditure positively impacted economic growth in the current year, although the impact is statistically insignificant. The impact was negative in the lagged two period, with the second period being statistically insignificant. This result could be alluded to the implementation process of recurrent expenditure in Nigeria. The result could be an indication of misappropriation of public funds allocated to recurrent expenditure. The ripple effect of such misappropriation is a negative impact on economic growth. In addition, since recurrent expenditures are usually financed by loans and a sizable amount of recurrent expenditure is budgeted for payment of debt servicing, such expenditures will adversely impact economic growth in the long-run. The result also confirms the endogenous growth model by Barro (1990) that opined that recurrent expenditure constitutes the consumption component of aggregate expenditure. While the result negated the findings of Idris and Bakar (2017), it conformed to those of Gukat and Ogboru (2017).
Capital expenditure impact economic growth negatively in both the current and one lagged period, although only the current period coefficient is statistically significant. Although capital expenditure can be considered as a macroeconomic stabiliser and can be used effectively as countercyclical fiscal policy tool, the result showed that capital expenditure has not significantly stimulated economic growth. The high level of corruption and execution of white
elephant projects which have little or no effect on growth, are possible reasons for such negative effect.Trade openness was statistically significant in the current year and impacts economic growth negatively. The lag coefficient of trade openness is statistically insignificant and impacts economic growth positively. The coefficients of private investments in all time period were negative.
The one-period lagged ECM coefficient is negative and statistically significant at 1.0 per cent level of significance. The ECM (-1) coefficient of -0.213 implies economic growth adjusts to equilibrium at a rate of 21.3 per cent per annum. This is slow in terms of restoring back to equilibrium in the case of a distortion in economic growth. The value of the R-squared showed that the variables in the model explain over 66.0 per cent variation in economic growth in Nigeria. The significant F-statistic clearly showed that the model is correctly specified. The Durbin Watson statist ic shows that the model is void of autocorrelation and can be used for inferences.
5.2. Post-Estimation Tests· Test of Stability
The CUSUM and CUSUM squared tests result in figure 5 showed that the residual plot falls within the 5.0 per cent significant boundaries and thus, indicates stability of the estimated parameters.
Source: EViews 10 Output
39
Figure 5: CUSUM and CUSUM of Squares Test of Stability
Volume 45, No. 4 OCTOBER - DECEMBER, 2021
· Diagnostic Tests
The results of the various diagnostic tests showed that the model can be relied on for policy formulation
(table 7). These tests include: heteroskedasticity (using Breusch-Pagan-Godfrey), normality (using Jarque-Bera) and the serial correlation (using Breusch-Godfrey Serial Correlation LM Test).
40
Source: Authors' Compilation.
The results of the above listed tests as presented in table 7 showed that the residuals of the specified model were normally distributed; does not suffer from heteroskedasticity or serial correlation.
6. Recommendations
Given the relevance of the heterogeneity in expenditure, there is urgent need to re-evaluate the allocation process to ensure that financial resources are allocated to productive sectors of the economy. The government should ensure that the share of recurrent expenditure in total expenditures is kept within a reasonable proportion by blocking all leakages and wastages in public financing in the country.
One of the possible reasons for the insignificant impact of recurrent expenditure on economic growth is the high corruption level in addition to misappropriation of public funds. This re-emphasised the need for appropriate governmental authorities to rekindle the fight against corruption and financial misappropriation in the public sector. This will adequately check diversion of public funds to private use.
There is also need to expand the share of capital expenditure in order for the country to engage in more productive projects that will stimulate economic growth. Policies should be geared at creating a viable investment environment in Nigeria to attract local and foreign investments that will stimulate economic growth. The need to also enhance Nigeria's trading policies cannot be overemphasized. Such policies should be pursued to ensure more trade openness that will benefit the economy in the long-run with the right economic indicators in place.
Nigeria should pursue trade policies which will place the economy in an advantageous position. Through concerted efforts to diversify the economy, the trade openness of the economy will be further enhanced and this will stimulate economic growth.
7. Conclusion
With increasing Government expenditure in Nigeria through the period of analysis, this study analysed the impact of disaggregated expenditure in economic growth. The autoregressive distributed lagged model was employed to appraise this impact. Empirical findings showed that the impact of recurrent expenditure has not significantly impacted economic growth, while that of capital expenditure has negatively impacted economic growth. Although the results of the study were counter intuitive, they are justified given the economic scenario of Nigeria. An economy such as that of Nigeria which is bedeviled by high level of corruption and misappropriation of public funds will expected to have a slow growth trajectory. In addition, prioritising recurrent expenditure in the allocation is largely counter-productive since a huge proportion of recurrent expenditure is financed by loans which are now employed to service huge debt stocks. This has adverse effect on economic growth in the long-run. Thus, the results of this study indicate the importance of taking into account the heterogeneity of expenditure when analysing the expenditure economic growth nexus.
Ajayi, S. I. (2003). “External debt, Capital flight and growth in Nigeria”. In Okonjo-Iweala, N; Soludo, C.C. and Muhtar M, (eds). The Debt Trap in Nigeria: Towards a Sustainable Development Debt Strategy. Trenton: Africa World Press, Inc.
Al-Fawwaz, T. M. (2016). “The Impact of Government Expenditures on Economic Growth in Jordan (1980–2013)”, International Business Research, Vol. 9 No. 1, pp. 99–105.
Attari, M. I. J. and A. Y. Javed (2013). “Inflation, Economic Growth and Government Expenditure of Pakistan: 1980–2010”. Procedia Economics and Finance, Vol. 5, pp. 58–67.
Barlas, A. W. (2020). “The Impact of Government Expenditure on Economic Growth in Afghanistan”. Journal of Economics and Business, Vol. 3 No. 2, pp. 729-733.
Barro, R. J. (1990). “Government Spending in a Simple Model of Endogenous Growth”. Journal of Political Economy, Vol. 98 No. 5, pp. 103-125.
Bonmwa T. G. and I. Ogboru (2017). “An Empirical Analysis of Government Expenditure and Economic Growth in Nigeria”. Journal of Economics and Development Studies, Vol. 5 No. 4, pp. 122-134
Central Bank of Nigeria (2019). 2019 Statistical Bulletin. Central Bank of Nigeria Statistical Department, Abuja, Nigeria.
Central Bank of Nigeria (2020). Circular to Deposit Money Banks and the General Public on: Guidelines for the Operation of the N100 Billion Credit Support for the Healthcare Sector. 25 March, Central Bank of Nigeria, Abuja, Nigeria.
Chineze E. O. (2018). “A Disaggregated Analysis of the Impact of Government Expenditure on Economic Growth: Evidence from Nigeria”. Perspectives of Innovations, Economics and Business, Vol. 18 No. 1, pp. 14-24
Chirwa, T. G. and N. M. Odhiambo (2016). “What Drives Long-Run Economic Growth? Empirical Evidence from South Africa”. Economia Internazionale/International Economics, Camera di Commercio Industria Artigianato Agricoltura di Genova, Vol. 69 No. 4, pp. 429–456.
Danladi, J. D., K. J., Akomolafe, O. S., Olarinde and N. L. Anyadiegwu (2015). “Government Expenditure and Its Implication for Economic Growth: Evidence from Nigeria”. Journal of Economics and Sustainable Development, pp. 142-152.
Dixit, S., Y. K., Ogundeji, and O. Onwujekwe (2020). “How well has Nigeria responded to COVID-19? Brookings: Future Development”, 2 July, https://www.brookings.edu/blog/futuredevelopment/2020/07/02/how-well-has-nigeria-responded-to-COVID-19/
Ebong, F., F., Ogwumike, U., Udongwo, and O., Ayodele (2016). “Impact of Government Expenditure on Economic Growth in Nigeria: A Disaggregated Analysis”. Asian Journal of Economics and Empirical Research, Vol. 3 No. 1, pp. 113-121.
Egbetunde, T., and I. O. Fasanya (2013). “Public Expenditure and Economic Growth in Nigeria: Evidence from Auto-Regressive Distributed Lag Specification”. Zagreb International Review of Economics & Business, Vol. 16 No. 1, pp. 79–92.
Ekpo, A. H. and E., Udo (2013). “Public Debt, Growth and Poverty Reduction in a Failed State: Nigeria, 1970-2011”. Paper presented at the American Economic Association and the National Economic Association Conference, January 4-6, 2013, San Diego California, U.S.A.
Engle, R. F. and C. W. J. Granger (1987). “Co-integration and Error–correction: Representation and testing”. Econometrica, Vol. 55 No. 2, pp. 251-276.
Ewubare, D., A., Nteegah and G. Okpoi (2017). “Public Borrowing and the Nigerian Economy: An Autoregressive Distributed Lag Model (ARDL) Approach”. The International Journal of Social Sciences and Humanities Invention, Vol. 4 No. 5, pp. 3506-3514.
Gabor K. and A. Marton (2020). “The Long-Term Impact of Public Expenditures on GDP Growth”. Society and Economy, Vol. 42 No. 4, pp. 403–419.
Ghosh, S., and A. Gregoriou (2008). “The Composition of Government Spending and Growth: Is Current or Capital Spending Better?” Oxford Economic Papers, Vol. 60 No. 3, pp. 484–516.
Guandong, B. Y. D. and W. M. Muturi (2016). “The Relationship between Public Expenditure and Economic Growth in South Sudan”. International Journal of Economics, Commerce and Management, Vol. 4 No. 6, pp. 235–259.
Gukat, B. T. and I. Ogboru (2017). “An Empirical Analysis of Government Expenditure and Economic Growth in Nigeria”. Journal of Economics and Development Studies, Vol. 5 No. 4, pp. 122-134.
Idris, M. and R. Bakar (2017). “Public Sector Spending and Economic Growth in Nigeria: In Search of a Stable Relationship”. Asian Research Journal of Arts & Social Sciences, Vol. 3 No. 2, pp. 1-19.
41
Volume 45, No. 4 OCTOBER - DECEMBER, 2021
International Monetary Fund (2020). IMF executive board approves US$ 3.4 billion in emergency support to Nigeria to address t h e C O V I D - 1 9 p a n d e m i c . I n t e r n a t i o n a l M o n e t a r y F u n d , 2 8 A p r i l , a v a i l a b l e a t : https://www.imf.org/en/News/Articles/2020/04/28/pr20191-nigeria-imf-executiveboard-approves-emergency-support-to-address-covid-19.
Johansen S. and K. Juselius (1990). “Maximum Likelihood Estimation and Inference on Cointegration—with Applications to the Demand for Money”. Oxford Bulletin of Economics and Statistics, Vol. 52, pp. 169-210.
Kimaro, E. L., C. C., Keong and L. L. Sea (2017). “Government Expenditure, Efficiency and Economic Growth: A Panel Analysis of Sub-Saharan African Low Income Countries”. African Journal of Economic Review, Vol. 5 No. 2, pp. 34–54.
Leshoro, T. L. A. (2017). “An Empirical Analysis of Disaggregated Government Expenditure and Economic Growth in South Africa”. UNISA Economic Research Working Paper Series. Working Paper 10/2017.
Lupu, D., M. B., Petrisor, A., Bercu and M. Tofan (2018). “The Impact of Public Expenditures on Economic Growth: A Case Study of Central and Eastern European Countries”. Emerging Markets Finance and Trade, Vol. 54 No. 3, pp. 552–570.
Ndambiri, H. K., C., Ritho, S. I., Ng'ang'a, P. C., Kubowon, F. C., Mairura, P. M., Nyangweso, E. M., Muiruri, and F. H. Cherotwo (2012). “Determinants of Economic Growth in Sub Saharan Africa: A Panel Data Approach”. International Journal of Economics and Management Sciences, Vol. 2 No. 2, pp. 18–24.
Nurudeen, A., and A. Usman (2010). “Government Expenditure and Economic Growth in Nigeria, 1970–2008: A Disaggregated Analysis”. Business and Economics Journal, Vol. 4, pp. 1–11.
Nwaeze, C., M. Ogwuma, and C. Nwabekke (2015). “Impact of Nigeria's External Debt Management on Economic Growth in Nigeria 2003-2013”. Multidisciplinary Journal of Global Trends, Vol. 4 No. 8, pp. 10-23.
Obed, O. F. E., S. O., Idenyi, O. E., Obed and C. I. Anoke (2017). “Public Debt and Economic Growth in Nigeria”. Asian Research Journal of Arts & Social Sciences, Vol. 4 No. 3, pp. 1-16.
Ogar, A., I. E., Eyo, and O. F. Arikpo (2019). Public Expenditure and Economic Growth in Nigeria: VAR Approach. European Journal of Economic and Financial Research, Vol. 3 No. 3, pp. 36-60.
Okoye, L. U., A. E., Omankhanlen, J. I., Okoh, E., Urhie, and A. Ahmed. (2019). “Government Expenditure and Economic Growth: The Case of Nigeria”. Proceedings of SOCIOINT 2019 6th International Conference on Education, Social Sciences and Humanities 24–26 June 2019. Istanbul, Turkey, 1184–1194.
Omotor, D. G. (2019). “A Thrifty North and an Impecunious South: Nigeria's External Debt and the Tyranny of Black Political Economy”. 85th Inaugural Lecture delivered at the Delta State University, Abraka, October 31, 2019.
Onifade, S. T., S., Çevik, S., Erdoğan, S. Asongu, and F. V. Bekun (2020). “An Empirical Retrospect of the Impacts of Government Expenditures on Economic Growth: New Evidence from the Nigerian Economy”. Economic Structures, Vol. 9 No. 6, pp. 1-13.
Osae-Brown, A. and A Soto (2020). “Nigeria to Borrow $6.9 Billion To Counter Coronavirus Spread”. Bloomberg, 6 April, available at: https://www.bloomberg.com/news/articles/2020-04-06/nigeriato-borrow-6-9-billion-to-offset-virus-impact-on-economy
Pesaran, M. H. and Y. Shin (1999). “An Autoregressive Distributed Lag Modelling Approach to Cointegration Analysis”, in Storm, S. (ed.) Econometrics and Economic Theory in the 20th Century: The Ragnar Frisch Centennial Symposium, Chapter 11, Cambridge University Press, Cambridge.
Pesaran, M. H., Y. Shin and R. J. Smith (2001). “Bounds Testing Approaches to the Analysis of Level Relationships”. Journal of Applied Econometrics, Vol. 16 No. 3, pp. 289-326.
Sáez, M. P., S. Álvarez-García, and D. C. Rodríguez (2017). “Government Expenditure and Economic Growth in the European Union Countries: New Evidence”. Bulletin of Geography. Socioeconomic Series, Vol. 36, pp. 127–133.
Schaltegger, C., and B. Torgler (2006). “Growth Effects of Public Expenditure on the State and Local Level: Evidence from a Sample of Rich Governments”. Applied Economics, Vol. 38 No. 10, pp. 1181-1192.
Shahid, A., F., Rabbi, U., Hayat, and N. Ali (2013). “The Composition of Public Expenditures and Economic Growth: Evidence from Pakistan”. International Journal of Social Economics, Vol. 40 No. 11, pp. 1010–1022.
Udoh, B. E., K. L., Ekeowa, I. S., Okechukwu, O. O. C. Afamefuna, and A. J. C. Nwonye (2020). “Effect of Intergenerational Debt Burden on Economic Growth in Nigeria”. Humanities and Social Sciences Letters, Vol. 8 No. 2, pp. 133-144.
Yasin, M. (2000). “Public Spending and Economic Growth: Empirical Investigation of Sub-Saharan Africa”. Southwestern Economic Review, 59–68.
In pursuit of its developmental mandate of stimulating financial and economic development, the Central Bank of Nigeria (CBN) is aggressively
pursuing credit and interest rate policies to promote inclusive economic growth. This course of action aims to expand the availability, access, and affordability of credit for micro, small and medium enterprises (MSMEs) that are generally acknowledged to be engines of growth (Keskİn et al, 2010; African Development Bank, AfDB, 2011; Oduntan, 2014; Opafunso and Adepoju, 2014; Obi et al, 2018; PricewaterhouseCoopers (PWC), 2020; Erdin and Ozkaya, 2020).
With at least twenty-four MSMEs financing programmes (CBN, 2020), it is unarguable that the CBN operates one of the largest collections of development finance interventions or programmes among central banks. However, it is one thing to introduce a programme and another to ensure adequate activity levels under it, activity levels that are commensurate with expected outcomes. For the scope of our work, a pertinent question is how to determine the activity levels.
Experientially, the activity level in any CBN development finance intervention is primarily traceable by the amount disbursed, outreach or volume of projects/ enterprises financed, and amount repaid. These three indicators constitute the standard summary performance report for the interventions (CBN, 2020) and, in general, are considered immediate and convenient proxies for remote quantitative impact measures. When taken cumulatively, they serve as approximate measures of effort exerted in managing an intervention, the level of programme uptake by intended users, and their responsiveness to available policy incentives often championed in the programme guidelines and implementation framework.
Activity Series of the Central Bank of Nigeria's Development Finance Interventions
43
Abstract
The Central Bank of Nigeria (CBN) aggressively pursues credit and interest rate policies to promote inclusive economic growth. Through
this, it aims to expand availability, access, and affordability of financial capital for micro, small and medium enterprises (MSMEs). With at least 24 MSMEs financing programmes of its own, the Bank manages one of the largest suites of developmental programmes among central banks. This paper attempted to serialize and characterize these programmes, hence determine their activity status and discover patterns of implementation effort, patronage, and responsiveness of target enterprises to available incentives. Applying Z-score and min-max methods of normalization and geometric and arithmetic aggregation techniques, the study develops a composite indicator and establishes a broad ranking of programmes, based on cumulative loan disbursements, outreach (loan volumes) and principal repayments. Results showed that
Xavier-Itam A. Okon (Ph.D) Development Finance Department
Central Bank of Nigeria
George N. Ude
programmes specifically focused on agriculture and those introduced to rev the economy following the COVID-19 pandemic, dominated the activity series. Programmes specifically targeting youths and multi-sectors were among those with the least activity. It is recommended that the Bank identifies why some interventions are not optimal, work to reverse the trend and achieve stated objectives.
Keywords: Central Bank of Nigeria, CBN, composite indicator, development finance.
JEL: Classification: C43, E51, E58.
Development Finance DepartmentCentral Bank of Nigeria
Like the activity (or reactivity) series of metals, this paper attempts to characterize and serialize CBN's development finance interventions to determine their activity levels. By broadly distinguishing between the interventions along activity levels, it is possible to have specific insights for evidence-based policy formulation and reviews. It is equally possible, albeit to a lesser extent, given periodic or snapshot updates to the proposed framework, to assess “displacement” or “substitution” effects among the array of inter-related interventions. Both perspectives are required to maximize or, at least, optimize desirable intervention efforts and outcomes.
Applying Z-score and min-max methods of normalization and geometric and arithmetic index techniques to cross-sectional data on the interventions, the paper develops a composite indicator to establish a broad ranking of the programmes using three indicators: cumulative loan disbursements, outreach (loan volumes), and principal repayments. The composite indicator is made invariant to the number of years the programme has been in operation and the average size of enterprises financed in the programme by adjusting for both factors.
Following this introduction, the paper reviews theoretical and empirical considerations in Section Two, presents the methodology in Section Three, and discusses the results and findings in Section four. It concludes with recommendations in Section five.
2.0 Theoretical and Empirical Considerations
The Organization for Economic Cooperation and Development (OECD) posits that a composite indicator is a combination of individual indicators into a single index, having regard for an underlying model of the multi-dimensional concept being measured. It should, ideally, rely on a theoretical framework which allows individual indicators or variables to be systematically selected, combined and weighted to reflect the dimensions or structure of the phenomena being measured (OECD, 2004).
Individual indicators, also known as component indicators, components, or sub-indicators, must be combined contingent on certain theoretical considerations and statistical representations that culminate in one, unified indicator. These statistical representations maybe simple or complex, depending on the issue of interest, but the composite index is usually constructed as an average of indicators or sub-indices, an aggregate measure of a combination of factors.
The multidimensionality of development is the motivation behind major composite indicators that assess countries on performance in specified
parameters. Such indicators include the United Nations Human Development Index (3 dimensions), Global Entrepreneurship Index (14 pillars); Global Competitiveness Index (12 pillars); Gender Inequality Index (3 dimensions); Ease of Doing Business Index (10 pillars, 41 sub-indicators); Global Findex (6 dimensions); and the Nigeria Multidimensional Poverty Index (4 dimensions, 11 indicators).
The OECD-Joint Research Council handbook on the construction of composite indicators (OECD-JRC, 2008) opined that composite indicators could be misleading if poorly constructed or wrongly interpreted, as their “big picture” outcomes may prompt simplistic diagnostic or policy conclusions. Rather, such indicators should serve to initiate discussions and arouse public attention and their significance should be assessed with respect to subjects affected by the composite index.
According to Saisana (2004), composite indicators should be identified as “simplistic presentations and comparisons of performance in given areas to be used as starting points for further analysis and discussion”. To the extent that this is so, it is believed that they are useful for summarization of relative performance and ordinal rankings which may not necessarily imply an assessment of depth. Greco et al (2019) reviewed methodological issues of composite indices, particularly, weighting, aggregation, and robustness. They concluded that although composite indicators met the need for consolidation and aggregation of a plethora of indicators into a sole number that encompasses and summarises information, they should be interpreted with extreme caution, especially when important conclusions are to be drawn relying on these measures.
After a review of several international quality frameworks for developing statistics and composite indices, Farrugia (2007) summarized the desirable attributes of a composite indicator as:(i) accuracy – properly estimates or defines the quantities or characteristics it is intended to measure). (ii) simplicity and ease of comprehension. (iii) methodological soundness – logical connection between the different sub-indices and mutually-consistent methodology justif ied by sound conceptual principles. (iv) suitability for international and temporal comparisons – the variables are measured in a homogenous manner. (v) transparency – ready availability of the methodology upon which the composite index was constructed. (vi) accessibility – ready available of the composite index across time and space. (vii) timeliness and frequency – the length of time between publication of the composite index and the event or phenomenon it describes and the frequency
44
Volume 45, No. 4 OCTOBER - DECEMBER, 2021
45
with which the composite index is published; and (viii) flexibility – how relatively flexible the composite index is in allowing for changes in content, purpose, method, comparative application, and focus.
Moreira and Crespo (2016) asserted that composite indicators are mathematical combinations of a set of indicators whose extensive use had generated strong debate over conceptual and methodological arguments for and against the measurement approach. They reviewed the pros of composite indicators, including their multidimensionality; ease of interpretation compared to a battery of separate indicators; facilitation of comparisons of performance across space and over time, thereby attracting public interest; and the reduction of the size of a list of indicators without losing basic information.
On the other hand, their review of the disadvantages indicated that composite indicators always excluded some vital elements of the phenomenon; specific components may be quantified with the help of different variables; inability to reveal more than what a single variable alone reveals; inconsistency in the selection process of the variables; lack of clear rationale for the selected weighting and aggregation techniques; and an absence of practical value if they proffer no precise policy recommendation.
Gómez-Limón et al (2020) constructed a composite indicator to measure environmental sustainability using alternative weighting methods, namely, analytic hierarchy process, best-worst method and the point allocation method. The methodological approach adopted followed the sequence of ind icator se lect ion and data gather ing, normalization, weighting, and aggregation. They found that the values of the composite indicators from the different methods yielded similar rankings of the olive farms studied, with a high level of consistency.
The United Nations Development Programme (UNDP, 2020) calculated the Human Development Index (HDI) by creating the indices for the three dimensions – health, education and standard of living – using min-max normalization technique, aggregating the dimensional indices using geometric mean technique and, in the case of the inequality-adjusted HDI, adjusting for inequality in the dimensional indices earlier derived and taking the unweighted average of these inequality-adjusted dimensional indices (UNDP, 2020).
The Gender Inequality Index (GII), with three dimensions – reproductive health, empowerment and labour market – and five indicators, indicates the following calculation steps: treatment of zero and extreme values; aggregation of indicators, firstly, across dimensions within each gender using
geometric mean, and secondly, across gender groups using harmonic mean; calculation of the geometric mean of the arithmetic means for each indicator; and calculation of the GII by dividing the harmonic mean by the geometric mean and subtracting the resulting quotient from 1, i.e., unity (UNDP, 2018).
De Muro et al (2011) developed the Mazziotta Pareto Index (MPI) to measure the Millennium Development Goals (MDGs) and compared the MPI with the HDI and the Human Poverty Index (HPI). The MPI adopted a linear aggregation method that penalized observed units (countries or geographical areas, for instance) with “unbalanced” values of the indicators, thereby assuming imperfect substitutability between various dimensions of development or poverty. The MPI and the HPI were similar because they penalized in the same direction, whereas the MPI and the HDI were dissimilar since they latter did not penalize for unbalanced set of indicators.
The Food Insecurity Multidimensional Index (FIMI), which synthetizes four dimensions of food security, viz, availability, access, utilization, and stability of food, with twenty indicators, into a composite indicator, progresses from a multivariate analysis of each dimension for internal consistency, through min-max normalization, to the aggregation of indicators for each dimension and for the four dimensions. The methodology adopts arithmetic mean with equal weights for aggregation of the indicators and power-three mean for the dimensions, to derive the synthetic index of food insecurity (Napoli et al, 2011).
The Global Hunger Index (GHI), which measures and tracks hunger at global, regional, and national levels, is intended to raise awareness and understanding of hunger problem, offer a basis for comparison of levels of hunger between nations, and attract focus to areas where hunger is prevalent, and with the greatest need for additional efforts to eliminate it. Its four indicators – undernourishment, child wasting, stunting and mortality – along three equally-weighted dimensions, are determined from available data for each country, standardized against thresholds set slightly above the highest country-level values observed worldwide for that indicator, and the standardized scores are aggregated to derive the GHI (GHI, 2020).
Cornell University et al (2020) showed that, included in the Global Innovation Index (GII) are a total of eighty indicators under seven pillars and three indices: the innovation input sub-index averages scores in five pillars; the innovation output sub-index averages scores in two pillars; and the GII is the average of the input and output sub-Indices which are assigned equal weights.
Volume 45, No. 4 OCTOBER - DECEMBER, 2021
46
Extension of the composite indicator concept, which is steeped in the multidimensional approach to the measurement of development, to the assessment of socio-economic welfare and developmental programmes is not out of place. This is so because of the multi-faceted key performance indicators often associated with the measurement of progress in such programmes. Its application to the large portfolio of diverse MSME financing interventions of the CBN, could contribute to unravelling gaps and promoting opportunities for improvement in programme implementation. It would also permit a temporal comparison of achievements.
This extension is actualized by conceptualizing each intervention or programme as a country or region, and the dimensions as disbursements, outreach, and principal repayments. To keep the generalization simple, each dimension is hypothesized to have one indicator or component, as elaborated in the next section.
3.0 METHODOLOGY
Data on cumulative disbursements, number of projects and principal repayments in the enterprise financing interventions of the CBN were obtained from the Bank's Economic Report for the fourth quarter 2020. The financial data were reported in billions of naira unit and the interventions were: i. Commercial Agriculture Credit Scheme (CACS).ii. Paddy Aggregation Scheme (PAS).iii. Rice Distribution Facility (RDF).iv. Anchor Borrowers' Programme (ABP).v. Accelerated Agricultural Development Scheme
(AADS). vi. Micro, Small and Medium Enterprises Development
Fund (MSMEDF).vii. Shared Agent Network Expansion Facility (SANEF). viii. Small and Medium Enterprises Re-financing and
Restructuring Facility (SMERRF).ix. Real Sector Support Facility (RSSF).x. Covid-19 Intervention for the Manufacturing Sector
(CIMS).xi. Textile Sector Intervention Facility (TSIF).xii. CBN-BOI Industrial Facility (CBIF). xiii. Power and Airline Intervention Fund (PAIF). xiv.Nigeria Electricity Market Stabilization Facility
Assurance Facility (NBET-PAF).xvi. National Food Security Programme (NFSP).xvii. Presidential Fertiliser Initiative (PFI). xviii. Non-Oil Export Stimulation Facility (NESF).xix. Export Development Facility (EDF).xx. Agri-business/ Small and Medium Enterprises
xxiv. Youth Empowerment Deve lopment Programme (YEDP).
The three variables earlier mentioned constituted our dimensions and indicators. In other words, each dimension comprised one indicator, which was itself. Since each dimension had just an indicator, it was not necessary to conduct multivariate analysis of the principal component analysis type or the like. In this regard, the analysis followed this sequence of procedures:
(i) Normalization or scaling – This was carried out to transform data values to the same scale to give them equal importance or prominence. The resultant distribution is a standard normal distribution with mean of zero and standard deviation equal to one, which is a desirable statistical property for stability. Two widely used scaling methods, the Z-score and the min-max, were applied, to assess the robustness of the composite indicator to different normalization methods.
The Z-score is the difference between an observation and the mean of the distribution, divided by the standard deviation. It is given as:
(ii) Definition of dimension indices - to facilitate the min-max scaling, it was necessary to define the dimension indices, that is, the minimum and maximum values for each dimension. An option is to set such limits using values within the observed dataset. Another is to do so outside the observed data based on some histor ical evidence, behavioural assumptions about the phenomena, or empirical rationalizations. For instance, in calculating the HDI, the UNDP (2020) specified “natural zeros” and “aspirational targets” for the minimum and maximum values, respectively. It described these values as “goalposts” set to transform the indicators expressed in different units into indices between 0 and 1. These were not the observed extrema of the original distribution but theorized a priori values.
Volume 45, No. 4 OCTOBER - DECEMBER, 2021
47
Specifically, the life expectancy indicator under the health dimension was given minimum value of 20 years because, historically, no country in the 20th century had a life expectancy of less than 20 years; and a maximum value of 85 years as this was a realistic aspirational target for many countries over the previous 30 years. Under education dimension, the expected years of schooling indicator had its minimum fixed at zero because societies can subsist without formal education, and the maximum at 18 years, which was equivalent to earning a master's degree in most countries, and so on. Explanations were also given for fixing the minimum and maximum values of the standard of living dimension, measured
by the gross national income per capita, at US$100 and US$75,000, respectively.
Akin to this, the Global Hunger Index (2020) set thresholds which were a bit higher than the highest country-level values observed worldwide for each indicator between 1988 and 2013. This was to allow room for possible future growth. As an illustration, it s t a t e d t h a t t h e h i g h e s t v a l u e f o r t h e undernourishment dimension was 76.5 per cent, but the threshold for standardization was set at 80 per cent.
For this study, observed data values were used to set the dimensions (Table 3.1).
Table 3.1: Dimension indices for the study
S/N
Dimension
Minimum
Maximum
Remarks
1 Disbursements 0.17 866.0 YEDP is min., NBET-PAF is max.
2 Outreach 1 2,504,690
RDF, NBET -PAF and EDF are
min., ABP is max.
3
Repayments
0
443.9
RDF, AADS, CIMS, CBIF, NVET -
PAF, EDF and TCF are min. ,
CACS is max.
Source: Authors (from observed data in Table 4.1).
(iii) Adjustments – the normalized scores were modified by the reciprocals of both size of enterprises financed and the age of the intervention, to eliminate their effects on the final indicator. This was considered apt because the larger the size of enterprise targeted under a programme, the higher the likelihood of large single disbursements and high values of cumulative disbursements; and the longer a programme has been in existence, the higher the probability of high cumulative disbursements and principal repayments.
The size of enterprises financed was taken as the average size by assets of the category of enterprises targeted. The National Policy on MSMEs provides the most consistent definition of micro, small and medium enterprises as, among others, having assets (excluding land and building) of less than N5.0 million, N5.0 to less than N50.0 million, and N50.0 million to less than N500.0 million, respectively. The mid-values of these ranges, which translated to their means, or their averages if more than one enterprise size was targeted, were the size deflators. For instance, the ABP disbursements target micro farmers, whose assets should be between 0 and N5.0 million. The approximate mid-value was N2.5 million, which was adopted. For the MSMEDF which targets micro, small and medium, the average of the approximate mid-values was the deflator. That is, the average of N2.5
million. N25.0 million and N250.0 million, which was N92.5 million.
The age of the programme defines its path over time from introduction to date. With the passage of time, evolutionary characteristics arising from the review of modalities tend to set in and drive, or should drive, implementation. Controlling for this was to allow programmes that had operated for relatively shorter periods because of when they were introduced, to be representatively captured without lifespan bias. Whereas it was relatively easy to specify the duration of operation for the interventions that were existent up to 2019, the COVID-19 era interventions, namely, TCF, CIMS and HSIF, were specified as approximately one year old since they had each been operated for at least half a year by end-2020.
More exclusively, normalized disbursements and outreach were adjusted for both size of enterprises and programme age since a high correlation was hypothesized between them. Conversely, normalized repayments were adjusted for age of the programme only. It was assumed that enterprise size does not affect repayments directly but indirectly since repayments itself was a function of disbursements.
Before these adjustments were made, there was need to address negative and zero values arising
Volume 45, No. 4 OCTOBER - DECEMBER, 2021
48
from the normalization process. This is a condition precedent to geometric means aggregation, which breaks down in the presence of both. It also improves interpretability of the results, as negative or zero indicator values would be unseemly and confusing. All the values – not only the zero or negative values – in a normalized distribution or series would have to be treated similarly, to retain the normal distribution properties. The addition of a constant that is high enough to make the series positive suffices. Having noted this, the minimum positive normalized value for the series scaled by the min-max method was added to each normalized value while twice the negative of the minimum normalized value for the series scaled by the Z-score method was added to its series.
(iv) Aggregation – as is standard practice in the methodology, arithmetic and geometric mean aggregation methods were adopted to bring the three sub-indices together to produce a single indicator. The geometric mean is useful in reducing the effect of outliers which were not in short supply in the datasets here, especially in the outreach dimension with extremes of 1 and 2,504,690.
The arithmetic mean is the quotient from the summation of adjusted normalized scores and the number of values so summed up. That is,
Geometric mean analysis centred on the execution of (3.4) which is the nth root of the product of the adjusted normalized values, given as:
(v) Categorization – to summarize the activity level of the interventions, they were categorized, building on the composite indicators derived in the last stage, into broad groups, namely, remarkably high, high, moderate, low, and extremely low activity. It is known that the different methodologies applied to calculate the indicators would produce different indicator series and, hence, rankings of the programmes. It would also be preposterous to base subsequent discussion on the indicator from one or a few of the methods. To harmonize these series and obtain a single indicator value for clarity and ease of interpretation, the values of the indicator for each programme, as derived from the different methodologies, were summed up to derive a
magnitude value and this sum or magnitude value was the single composite indicator. This was then ranked for all interventions and the ranking partitioned into upper, upper middle, middle, lower middle and lower segments corresponding to the five broad act iv i ty groupings, s temming f rom determination of the 80th, 60th, 40th and 20th percentiles. The values derived in this stage defined the activity series and were used to characterize the programmes. The summation of indicators from all the methodologies and the mapping of the sum onto a 5-segment percentile scheme for characterization purposes marked the novelties of this study.
Volume 45, No. 4 OCTOBER - DECEMBER, 2021
4.0 Results and Discussion
4.1 Findings
The dataset for the study is presented in Table 4.1, which shows the cumulative number of loans (volume), disbursements and repayments.
22
The last two columns show the average asset base of enterprises targeted by each intervention and the age of the intervention. A total of 12.5 per cent (or three) of programmes financed a single project while about 30 per cent (or seven) recorded zero principal repayments within the study period.
Programmes with a single project financed were the EDF, where wholesale disbursement was to a development finance institution; and NBET-PAF, where funds were disbursed to a public institution as
obligor. The seven programmes for which there were no principal repayments included interventions such as the CBIF and the NBET-PAF, which were operational before the onset of COVID-19 and whose moratoria were extended in the wake of the pandemic. The wide ranges and standard deviations for all three series were generally suggestive of non-normal distributions which the normalization methods addressed.
# of Projects
(Outreach)
Disbursements
(₦'bn)
Repayments
(₦'bn)
Beneficiary
Average Asset
Base (₦'bn)
No. of Years in
operation (as @
Dec. 2020)
1 CACS 636 672.90 443.90 0.25 11
2 PAS 21 95.50 93.50 0.25 3
3 RDF 1 1.00 0.00 0.25 2
4 ABP 2,504,690 497.20 118.70 0.0025 5
5 AADS 9,983 14.90 0.00 0.0025 2
6 MSMEDF 216,704 83.90 34.70 0.0925 7
7 SANEF 13 5.50 0.64 0.025 2
8 SMERRF 604 300.90 151.10 0.25 10
9 RSSF 25 166.20 22.50 0.25 6
10 CIMS 111 228.20 0.00 0.25 0.5
11 TSIF 41 78.00 3.10 0.25 4
12 CBIF 60 100.00 0.00 0.25 3
13 PAIF 74 311.20 194.60 0.25 10
14 NEMSF 37 189.20 70.30 0.25 5
15 NBET-PAF 1 866.00 0.00 0.25 3
16 NFSP 4 59.10 11.40 1.0 4
17 PFI 18 35.00 10.80 0.25 3
18 NESF 13 44.00 12.00 0.25 5
19 EDF 1 50.00 0.00 0.25 2
20 AGSMEIS 22,057 83.50 0.21 0.0025 3
21 TCF 317,949 149.20 0.00 0.0025 0.75
22 MAS 7 6.00 6.00 0.25 2
23 HSIF 62 60.70 0.78 0.25 0.5
24 YEDP 67 0.17 0.51 0.0025 4
Total 3,073,179 4,098.27 1,174.74 5 98 Min 1 0.17 0.00 0.0025 0.5
Max 2,504,690 866.00 443.90 1.00
11.00
µ 128,049 170.76 48.95 0.21
4.07
δ 511,969 221.42 100.04 0.20
2.93
Deflator
#Intervention/
Programme
Cumulative
Source: CBN Economic Report Q4: 2020 and authors' compilation
Volume 45, No. 4 OCTOBER - DECEMBER, 2021
49
50
In Table 4.2, normalized scores can be seen to narrow the distance between observations.
Table 4.2: Normalized scores
# of Projects Disbursements Repayments # of Projects Disbursements Repayments
The zero values in the min-max-normalized series and the negative values in the Z-score-normalized series were treated as in Section 3.0, by the addition of constants. That is, for the min-max-normalized distributions, the minimum positive normalized value for the series, that is, 0.0000012, 0.0009586 and 0.0004731, were added to relevant normalized values.
For Z-score-normalized distributions, twice the negative of the minimum normalized value, that is, -0.2501089, -0.7704418 and -0.4892954, were added to relevant scaled series, to produce all-positive values, as shown in Table 4.3.
22
Volume 45, No. 4 OCTOBER - DECEMBER, 2021
51
Table 4.3: NORMALIZED SCORES PLUS CONSTANTS
# of Projects Disbursements Repayments # of Projects Disbursements Repayments
It should be noted that this transformation changed neither the dynamics of the analytical process nor the desirable statistical properties of the series. It was intended to permit the application of geometric mean and improve interpretability of the results since, otherwise, the analysis breaks down with error results in the case of the geometric mean, and negative or zero values in the case of the arithmetic mean aggregation – both outcomes of which are anti-climactic for the purpose of this research exercise.
Making all values positive was followed by the adjustment for size of enterprise financed and age of the programme, the results of which are shown in
Table 4.4. Both deflators acted in a compensatory manner on the scores, boosting the scores on programmes targeting smaller enterprises and having shorter durations, while invariably penalizing those financing larger enterprises and having longer durations of existence. This deflation or adjustment effectively addressed concerns over programme lifespan and coverage by further closing the distance between the values.
Volume 45, No. 4 OCTOBER - DECEMBER, 2021
52
Table 4:4: ADJUSTED NORMALIZED SCORES PLUS CONSTANTS
# of Projects Disbursements Repayments # of Projects Disbursements Repayments
In the penultimate step of the analysis, the composite indicator series for the development financing interventions of the CBN is calculated for each programme using the arithmetic and geometric mean aggregation methods and the result presented in Table 4.5. The table shows the indicator as derived from four methodologies, namely, min-max geometric, min-max arithmetic, Z-score geometric
and Z-score arithmetic. In the min-max geometric indicator series, the ABP, MSMEDF and CACS ranked top three, while the YEDP, EDF and RDF ranked bottom three. In the Z-score geometric indicator series, the corresponding rankings were the TCF-CIMS-ABP and RSSF-NESF-SMERRF.
Volume 45, No. 4 OCTOBER - DECEMBER, 2021
53
Table 4.5: Series of Composite Indicators for CBN Devfin Interventions
There were several areas of convergence, especially with respect to the ABP, CACS and NBET-PAF, all of which were consistently in the top six places in three of the indicator series. These were the programmes with the highest level of activity. The TCF and the CIMS, two COVID-19-era programmes, featured with prominence in the top third of three of the series, despite having been operated for less than a year. Contrarily, the YEDP and the export-oriented programmes were, largely, low in activity relative to others.
As expected, there were divergencies in the rankings arising from the salient differences in the normalization and aggregation methodologies. To meet our end, the series indicators were used to derive the activity series, that is, categorize the programmes by proceeding to sum them up for each programme, and the sums for all the programmes – the final
composite index - subjected to ranking on a 5-partition percentile system (Table 4.6). Note the 80th, 60th, 40th and 20th percentile values of 1.05, 0.50,0.40 and 0.30, which partitioned the series into the five categories.
Volume 45, No. 4 OCTOBER - DECEMBER, 2021
54
Table 4.6: Activity Series of CBN Devfin Interventions
MGM MAM ZGM ZAM
TCF 0.01336 0.03638 0.85054 0.93465 1.83 Remarkably High
ABP 0.12280 0.19903 0.59238 0.65556 1.57
CIMS 0.00702 0.03206 0.60414 0.84664 1.49
CACS 0.01999 0.12464 0.38416 0.64142 1.17 Upper
HSIF 0.00214 0.00866 0.50637 0.59704 1.11 1.05
NBET-PAF 0.00500 0.12134 0.27683 0.60224 1.01 High
Programmes in the remarkably high activity category are outreach-driven and had attracted the strongest rave reviews in recent times and, in a nutshell, represent the fullness of development finance practice by the CBN. They are generally synonymous with rapid growth and in all indices; accounted for 91.9, 39.2 and 48.0 per cent of outreach, disbursements, and principal repayments, respectively; and span all broad sectors: agriculture (ABP and CACS), industry (CIMS), services (HSIF) and multi-sector (TCF). The CACS is the oldest programme under study. But, notably, in this category are also two programmes of less than a year old, the COVID-19-era TCF for households and MSMEs and the HSIF for the health sector. Both made it into the group due to high intensity outreach and disbursements. Programmes here also received wide embrace because they focused on high employment-elastic
activities. For instance, the ABP, which rides on the contract farming model, financed small-scale farmers who constitute a huge proportion of the economically active labour force. It is often argued that there was a substitution effect of the ABP, TCF and CIMS on the Agricultural Credit Guarantee Scheme (ACGS), AGSMEIS and RSSF, respectively, the former three gaining prominence over the latter.
For the high activity category, its relative strength lay in disbursements. They provided 0.3, 25.2 and 8.5 per cent, respectively, of outreach, disbursements, and principal repayments. Representative activities were on-grid electricity power supply services (NBET-PAF), agriculture (PAS, AADS and MAS), and non-oil exports in general (EDF). The pace of expansion of operations in programmes in this group was lower than that for the remarkably high category. The agriculture
Volume 45, No. 4 OCTOBER - DECEMBER, 2021
55
interventions PAS and MAS specifically targeted aggregation activities in cereal value chains – rice and maize, respectively. With exception of AADS which was for small-scale primary producers, all programmes were for secondary and tertiary sector SMEs. In general, the low outreach which, in fact, was the lowest for all categories, seemed to symptomize the narrow or restrictive activities of coverage of the programmes. It was, noted, for instance, that despite its oligopolistic structure with implied free entry, existing structural rigidities and high investment costs tended to limit new entrants from obtaining operating licences to access the electricity market. This meant less potential SMEs to reach with available intervention financing, although the NBET-PAF did account for a disproportionately high proportion of disbursements. If there was any substitution effect, that was between NBET-PAF and EDF on the one hand, and NEMSF and NESF on the other hand.
Moderate category interventions covered financial agency services (SANEF), distribution services (RDF), multi-sectoral activities (AGSMEIS) and industry (CBIF). Collectively, they were responsible for 0.7, 4.6 and 0.1 per cent of outreach, disbursements, and principal repayments, respectively. 75 per cent of the programmes here, the highest of such proportion for any category, were implemented by external managing agents, with exception of the RDF. Also, as most of the programmes were introduced at most two years before the COVID-19 outbreak. subsisting moratoria on their facilities were simply extended by the Bank's extension of moratorium on all its intervention facilities. This was most likely the reason for the lowest proportion of repayments recorded among all groups, as uptake was rather slow before then. There appeared to be slow traction in outreach and disbursements for the financial inclusion intervention, SANEF, and the RDF which supports distribution of staple rice. There also seemed to be some substitution between the AGSMEIS and the MSMEDF because of similarity in their focus, making the older MSMEDF wane in significance.
In the fourth or low activity programmes category, the marked features were the high average programme age of six years, high repayments relative to outreach and disbursements, and the absence of a programme financing general smallholder agriculture directly. The NFSP is for large-scale agriculture; NEMSF and PAIF are for services, namely power sub-sector, with the latter also for aviation sub-sector; SMERRF, manufacturing sub-sector in general; and PFI and TSIF for specific manufacturing activities, fertilizer and textile and garments, respectively. Contributions to global outreach, disbursements and principal repayments were 0.03, 23.8 and 37.6 per cent, respectively. These are renowned programmes that have contributed
immensely to economic growth and are at advanced stages of implementation, hence are relatively repayments driven. As a matter of fact, the SMERRF was discontinued back in 2014; the only operational activities since then have been monitoring and ongoing repayments which should continue until the longest loan durations elapsed. Most activities covered by the interventions here are not the preponderant type, hence growth in outreach and disbursements is somewhat sluggish. This largely explains the significantly low outreach contribution. As a result, there are no immediately discernible displacements or substitutions to the lower activity category.
The extremely low activity interventions are so described because of their position at the end-2020 milestone relative to their high average age of 5.5 years, implying they are at about mid-age stage, given the conventional ten-year lifespan of most CBN interventions. They contributed 7.1, 7.2 and 5.9 per cent to outreach, disbursements, and principal repayments, respectively. Programmes in this category are all multi-sectoral and they are the MSMEDF, RSSF, the youth-focused YEDP and the export-oriented NESF. Over 99.9 per cent of the 7.1 per cent contribution to disbursements were contr ibuted by the MSMEDF whose huge disbursements were duly discounted, deflated, or penalized, by its seven years of operation to leave it in this category, an indication that, given its age, it should have been better in all indices.
4.2 Policy Implications
The high rankings produced by the COVID-19 era programmes (TCF, CIMS and HSIF) present an apt lesson on what intervention policies should be like. Their rapid uptake (within so short a time frame) was, unequivocally, a product of strong intervention effort (in programme formulation, implementation, and monitoring) and high responsiveness of intended users, i.e., the households and the enterprises. Some programmes were driven by outreach, others by disbursements, some by more than one indicator, etc. What, in turn, drove these indicators? From the findings, preponderance of an economic activity partly drove its outreach. Operating financial profile, reasonably approximated by size of enterprises, influenced disbursements. These indicators and their enablers were critical for success.
For the entire series and within specific categories, some programmes in certain sectors and those aimed at certain economic segments, generally ranked higher than others. In this regard, specific programmes for agriculture (ABP, CACS, PAS), health (HSIF), and power (NBET-PAF, NEMSF) readily ranked better and, to a lesser extent, multi-sectoral, multi-
Volume 45, No. 4 OCTOBER - DECEMBER, 2021
56
segment interventions (TCF, MSMEDF). It was obvious that many multi-sectoral programmes did not rank well (MSMEDF, RSSF, YEDP and NESF). Perhaps, this was because these generic programmes lacked the added push of sustained mobilization or clout by apex stakeholder organizations or interested public sector organizations, which programmes with specific focus, such as PAS, MAS, TSIF, NBET-PAF and PFI, for instance, had. Within specific categories, programmes managed by external parties looked to ranked better than those managed within the CBN. In all four categories (except extremely low category) having a mix of intervent ions with di f ferent management approaches, those overseen by external managing agents ranked better (TCF, NBET-PAF, SANEF, NEMSF). This, by no means, takes the credit off the CBN that has managed programmes such as the ABP, CIMS and HSIF, that are within the topmost, remarkably high activity category, of interventions. Some programmes evidently displaced or substituted others, because either the substituting programmes were more reflective of present-day realities or the substituted interventions were at a less active stage of their life cycle. In the instances of substitutionary relationships, should older programmes be retained in the face of the introduction of the newer? In the winding down substitution instance, what should appropriately constitute the lifespan of especially micro or small borrower programmes? In general, it is instructive that averagely older programmes, fast approaching their sunset, tended to settle into the bottom two groups, that is, low and extremely low categories.
5.0 CONCLUSION AND RECOMMENDATIONS
The study purposed to develop a composite indicator of activity level to establish a broad ranking of CBN development financing programmes, based on cumulative loan disbursements, outreach (loan volumes) and principal repayments. This was used to serialize and characterize these programmes and discover patterns of implementation effort, patronage, and responsiveness of target enterprises to available incentives. It was noted that this exercise was neither an attempt to assess intervention performance or substitute for impact evaluations but an effort to use publicly available information on the financing programmes and tested methodologies to rank the programmes based on activity status. If any of indicators, methodologies, scope, and study period were changed, this could result in completely different outcomes and interpretations.
At the programme onset or initiation stage, there is need to identify all the indicators that will drive a programme and their enablers. Efforts should then be
made to frequently report on these indicators and measures designed to emphasize them for greater implementation effectiveness. Since some interventions in specific sectors and economic segments did better, the managers may harness this information to strive towards specialization and increased efficiency. There is need to either refresh older programmes if they are not being wound down or ceded out to be managed by other institutions. The reason for the low ranking of most multi-sectoral programmes should be identified and addressed. Finally, programme life cycles should be monitored and assessed against specified milestones set at programme initiation and the role of regular impact assessment in this respect cannot be over-emphasized.
Volume 45, No. 4 OCTOBER - DECEMBER, 2021
REFERENCES
African Development Bank (2011). “Enhancing the Contribution of MSMEs to Economic Development: Main Barriers and Possible Interventions”. Discussion document, Tunis, March 9.
Central Bank of Nigeria (2020). Central Bank of Nigeria Economic Report. Fourth Quarter, Abuja: CBN. Accessed at https://www.cbn.gov.ng/Out/2021/RSD/Fourth%20Quarter%202020%20Economic%20Report_1.pdf on February 16, 2021.
Cornell University, INSEAD, and World Intellectual Property Organization (2020). The Global Innovation Index 2020: Who Will Finance Innovation? Ithaca, Fontainebleau, and Geneva.
De Muro, P., Mazziotta, M., and A. Pareto (2011). “Composite Indices for Multidimensional Development and Poverty: An Application to MDG Indicators”. Social Indicators Research, 104(1), 1-18.
Erdin, C. and G. Ozkaya (2020). “Contribution of Small and Medium Enterprises to Economic Development and Quality of Life in Turkey”. Heliyon, Vol. 6 No. 2. DOI:10.1016/j.heliyon.2020.e03215.
Farrugia, N. (2007). “Conceptual Issues in Constructing Composite Indices”, Occasional Papers on Islands and Small States, No. 2, at the International Conference on Small States and Economic Resilience, April 23 – 25, Valletta, Malta.
Global Hunger Index (2020). 2020 Global Hunger Index: One Decade to Zero Hunger: Linking Health and Sustainable Food Systems. Welthungerhilfe, Bonn and Concern Worldwide, Dublin.
Gómez-Limón, J. A., Arriaza, M., and M. D. Guerrero-Baena (2020). “Building a Composite Indicator to Measure Environmental Sustainability Using Alternative Weighting Methods”. Sustainability, 12(11), 4398. DOI:10.3390/su12114398.
Greco, S., Ishizaka, A., Tasiou, M., and T. Gianpiero (2019). “On the Methodological Framework of Composite Indices: A Review of the Issues of Weighting, Aggregation, and Robustness”. Social Indicators Research, 141, 61–94. https://doi.org/10.1007/s11205-017-1832-9.
Keskİn, H., Şentürk, C., Sungur, O., and H. M. Kİrİş (2010). “The Importance of SMEs in Developing Economies”. 2nd International Symposium on Sustainable Development, June 8 - 9 2010, Sarajevo.
Moreira, S. B., and N, Crespo (2016). “Composite Indicators of Development: Some Recent Contributions”. In V. Jeremic, Z. Radojicic M. Dobrota (eds), Emerging Trends in the Development and Application of Composite Indicators, 140-162. DOI:10.4018/978-1-5225-0714-7.ch007.
Napoli, M., De Muro, P., and M. Mazziotta (2011). “Towards a Food Insecurity Multidimensional Index (FIMI)”. Master in Human Development and Food Security, Università degli Studi Roma Tre.
Obi, J., Ibidunni, A. S., Tolulope, A., Olokundun, M. A., Amaihian, A. B., Borishade, T. T., and P. Fred (2018). “Contribution of Small and Medium Enterprises to Economic Development: Evidence from a Transiting Economy.” Data in Brief, Vol. 18, pp. 835 – 839.
Oduntan, K. O. (2014). “The Role of Small and Medium Enterprises in Economic Development: The Nigerian Experience.” International Conference on Arts, Economics and Management (ICAEM'14), March 22 – 23, Dubai, 75 – 78.
Opafunso, Z. O. and O. O. Adepoju (2014). “The Impact of Small and Medium Scale Enterprises on Economic Development of Ekiti State, Nigeria.” Journal of Economics and Sustainable Development, 5(16), 115 – 122.
Organization for Economic Cooperation and Development (2004). “The OECD-JRC Handbook on Practices for Developing Composite Indicators”. Paper presented at the OECD Committee on Statistics, June 7 - 8, OECD, Paris.
Organization for Economic Co-operation and Development and the Joint Research Centre (2008). Handbook on Constructing Composite Indicators: Methodology and User Guide. OECD Publishing: Paris.
PricewaterhouseCoopers International Limited (2020). “Building to Last: Navigating MSME Growth and Sustainability in a New Decade”. MSME Survey Nigeria Report. PricewaterhouseCoopers International Limited.
Saisana, M. (2004). “Composite Indicators – A Review”. Second Workshop on Composite Indicators of Country Performance”, February 26 – 27, OECD, Paris.
United Nations Development Programme (2018). National Human Development Report: Achieving Human Development in North East Nigeria. Abuja, Nigeria.
United Nations Development Programme (2020). Human Development Report Technical Notes: Calculating the Human Development Indices. Washington, DC.
The study employed Non-Linear Auto-Regressive Distributed Lag (NARDL) method to analyse the link between oil price and foreign direct investment in Nigeria (FDI) using annual data from 1970 to 2018. Bai-Perron (2003) test revealed two structural break periods (1989 and 1995) showing a long run relationship between oil price and FDI in Nigeria. The ndings, after NARDL estimation (short and long runs), showed that oil price, exchange rate and trade, negatively and insignicantly inuenced FDI, while GDP positively impacted on FDI, though insignicant too. The study concluded that though these variables slow down FDI, efforts should be geared towards channeling oil funds to other sectors to encourage foreign investors.
In a n y e c o n o m y , b o t h d e v e l o p e d a n d developing, the discovery of oil is always marked with a frolic advent of economic growth and
development due to the expected ow of revenue from this sector as more investments would be attracted into the economy (Edame et al., 2014). Investments in the oil sector are strategic because of the risk associated with the decision. Strategic investment is one of the most important decisions that businesses make since such investments can lead to competitive advantage through cost reduction and product differentiation, which in turn leads to value creation (e.g., Porter 1980; Makadok, 2003; & Henrique and Sardosky, 2011).
The risk associated with foreign investment decisions in this sector is a result of imperfect information, which is associated with uctuations in oil price. Pindyck (1991) and Dixit and Pindyck (1994) identied uncertainties rms faced to include oil price uctuations, factor input cost uncertainty, exchange rate uncertainty, or even regulatory uncertainty. Miller (1998) also noted that uncertainties do affect not only the expectations of an investment decision but also affect rms' worth. Henrique and Sardosky (2011) empirically marked uctuations in oil prices to be one of the problems of uncertainties that may affect rms' decisions both in the present and more concerned in the future. Barnanke (1983), in his model of explaining how oil price affects real options of investors, noted that the opportunity cost of a rm wait ing for new information regarding the uctuations in the oil price is the returns he/she gets on the early investment, but the value of waiting increases as the uctuations in the oil prices increases, while the incentive to investment falls.
To an economy, growth depends on a rm's decision on investment but declines when investors loose interest in the economy. Kulatilaka and Perotti (1998) and Henrique and Sardosky (2011) similarly identied the same problem in recent works of literature in line with Barnanke (1983) that when rms do not have a monopolistic power over investment opportunities and the market is not competitive enough to accommodate uctuations in oil prices and alternative costs of generating energy, rms are faced with two options: the option of waiting to resolve the uctuations in the prices of oil which will contribute to their production cost and an option to grow investment. This scenario, in most cases, is often noted with extreme seriousness by investors in developing countries such as Nigeria.
In line with Morey (1993) and Tang et al. (2010), Shahbaz et al. (2017) admitted that rise in genuine economic activities comes through supply and
1Shehu Muhammad
Oil Price and Foreign Direct Investment in Nigeria: New Evidence from Structural Breaks and a Nonlinear Analysis
Department of Social Science,Federal Polytechnic, Bida, Niger State
1Department of Social Sciences, Federal Polytechnic,Bida Niger State, Nigeria.Phone No: +234 (0) 8036367790
59
Colombia, Quero-Virlaa (2016) argued that oil price uctuation has a signicant impact on foreign direct investment.
Kari and Saddam (2014) posited that ndings for dynamic links between foreign direct investment, growth, and oil export in Gulf Cooperation Council (GCC) countries showed that oil price shocks repulse foreign direct investment and distort economic growth; whereas, a shock in foreign direct investment inow adversely affect oil export and the economic growth. For six oil-exporting GCC countries, Elheddad (2016) realised a negative relationship between natural resources abundance and foreign direct investment (FDI) and a negative correlation between foreign direct investment inow and GDP of the countries. Also, Asiedu (2013) opined that ndings for 99 developing countries showed that natural resources negatively inuence foreign direct investment, whereas good institutions lessen the negativity of natural resources on foreign direct investment.
Considering ination rate and foreign direct investment as the key macro-economic variables in South Asian Countries, Muhammad and Sayed (2012) submitted that a signicant positive link exists between ination rate and foreign direct investment. On the contrary, for the economy of Pakistan, Mehta (2014) discovered a negative impact of oil price uctuation on investment through ination and deteriorated economic growth. Using GARCH and SVAR in examining oil price volatility and investment responses in Thailand, Wadud and Huson (2014) proved in the economy of Thailand that oil price uctuation negatively affects the aggregate real investment of the economy. In India, Sadath and Acharya (2015) afrmed that the sales-growth-investment relationship becomes weak in the face of the rising prices of energy due to the cautious approach to investment adopted by the rms.
In investigating the role of product market competition in moderating the effect of oil price shocks and market uncertainty on stock return employing rm-level monthly data from 70 countries spanning from 1983 to 2014, Gupta (2016) analysis for 70 countries on oil price shocks and market uncertainty effect on stock returns, showed that macroeconomic stress negatively impacted on the rm-level returns. While oil price shocks positively impact rm-level returns, rms located in high oil-producing countries are more sensitive to global uncertainty and oil price shocks. On the other hand, rms located in non-competitive industries are less sensitive to oil price shocks; and rms located in non-competitive industries are less affected by the drop in oil price, compared with rms that are located in highly competitive industries.
demands and vice versa. The supply-side channel reveals that oil is a fundamental factor of production, and an increase in oil price implies an increase in the cost of production, which leads rms or industries to lower output, mostly in developing countries such as Nigeria.
However, Nigeria, considered as one of the major oil producers and oil being its mainstay, still lags in terms of growth and development. This deciency has been identied in existing studies to be a result of a low level of inow investment into the economy, which is caused by several uncertainties, including oil price. Thus, this study has deviated from concentrating on unidirectional effect of oil price on FDI to investigating both directional effect which can best be explained using Non-Linear Auto-regressive Distributed Lag (NARDL) method. Also, the study accounts for structural breaks, which to the best of my knowledge no study has examined its impact on foreign direct investment in the context of Nigeria.
The rest of the study is divided into four Sections, Section two comprises review of related studies, while Sect ion three shows the data source and methodology, Section four presents the analytical framework, while Section ve displays the conclusion and recommendations.
2.0 Literature Review
Various theories have discussed the feedback effect of a country depending on natural resources as its main source of income. The Dutch disease syndrome is an example of a theory among the theories. The Dutch disease syndrome explains the negative effect of discoveries that gives sharp rise to a country's currency, leaving other sectors less competitive in the global market. An example emphasised by the theory is large oil discovery in an economy using the Netherlands as an example. Other theories are Prebisch's (1949) “dependency theory, Mahdavy's (1970) “Rentier's theory,” among others.
Dal Bianco and Nguyen (2017) in Latin America conrmed the establishment of real options theory in Latin American countries, which indicates the negative impact of exchange rate volatility on foreign direct investment; and the absence of connection between foreign direct investment and oil price uctuation. The presumed instruments that attract foreign direct investment in Latin American countries are human capital and trade openness. In contention, Dias et al. (2014) posited that in Brazil, the exchange rate does not play any role in explaining foreign Direct Investment (FDI) inow. On the other hand, the productivity shocks of the United States economy hurt FDI inow due to the impact of productivity on the relative prices in the economies. In
Volume 45, No. 4 OCTOBER - DECEMBER, 2021
60
price of oil has a signicant inuence on the volume of foreign direct investment inow in the country; volatility in the country currency also contributed to the reduction in investment inow, and foreign investment took a smaller percentage of the total investment in the country. Ibrahim and Ahmed (2014) investigated the nexus between aggregate investment and oil price volatility for developed and develop ing count r ies us ing a genera l i sed autoregressive conditional heteroskedasticity (GARCH) model to decompose conditional oil volatility into permanent oil volatility and transitory oil volatility. While adopting the vector auto-regressive method (VAR) to allow feedback effects between aggregate investment and its determinants, the study evidenced adverse effects of conditional oil volatility, permanent oil volatility, and transitory oil volatility on aggregate investment and real output. Interestingly, contrary to the ndings for the developed markets (US and OECD), the real effects of permanent oil volatility tend to be stronger.
In Thailand, Raq, Salim, and Bloch (2009) employed a vector autoregressive (VAR) approach to investigate the impact of oil price volatility on economic activities using quarterly data between 1993Q1 and 2006Q4. They argued that a signicant variation in the economic activities of the country was explained by oil price volatility.
In a study on the determinants of FDI in the economy of Kenya and Malaysia, Kinuthia and Murshed (2015) used the Vector autoregressive method (VAR) to analyse the data spanning 1960 to 2009. They observed that the determinants of FDI were more favourable in the economy of Malaysia compared with that of Kenya. They concluded that the success story of Malaysia compared with Kenya was differentiated by its macroeconomic stabilisation and trade policies, as well as, infrastructure and institutional factors. Cheng and Kwan (2000) also veried the determinants of FDI in 29 regions of the Chinese economy from 1985 to 1995 using the GMM estimation technique. They submitted that in the regions in China, a large regional market, good infrastructure, and preferential policy had a positive effect, but wage cost harmed FDI.
In Nigeria, Ademakinwa and Omokanmi (2017) noted that oil price has a signicant positive inuence on foreign direct investment (FDI) and economic growth, but expected to harm foreign direct investment and economic growth due to the attribute of uncertainty and destabilisation of effective scal management of crude oil revenue. From a different view, Olure et al. (2014) argued that in the long-run, world oil price exhibited a negative relationship with foreign direct investment in Nigeria. They further discovered that gross domestic product, degree of trade openness,
Herinques and Sardosky (2011) observed that using Generalised Method of Moment (GMM) for a panel data set in the US, that there was a U-shaped relationship between oil price volatility and strategic rm investment decision in the US. Killins et al. (2017) study in Canada revealed that the reaction of housing markets to oil price shocks varies signicantly depending on whether the changes in oil price is prompted by demand or supply shocks in the oil market and on country oil trade status (i.e., net importer or net exporter). Using daily data to investigate the relationship between oil volatility and stock return volatility for 560 rms listed on the New York stock exchange, Narayan and Shama (2014) noted that oil price was a signicant and predictor of rm return variance. In the same vein, Narayan and Narayan (2016) further argued that in the United States (US), there was a robust effect of oil price speed of adjustment on macroeconomic variables in the economy.
In a study of foreign direct investment in Islamic oil-exporting countries, Razmi and Behname (2012) noticed a negative effect of oil extraction on foreign direct investment as a result of over-dependence on oil extraction, which plagues a high risk on these economies. In the economy of Russia, Sha and Liu (2014) found a positive impact of oil price and exchange rate on economic growth and foreign direct investment and other macroeconomic variables were found to have a signicant positive relationship with exchange rate except for export that exhibited a negative relationship with real effective exchange rate in the short-run. Shari-Renani and Mirfatah (2012), in evaluating the determinants of FDI inow in Iran using co-integration approach, discovered that trade openness, GDP, and exchange rate possess a signicant positive impact on FDI, while exchange rate and world crude oil prices exhibited a signicant negative impact on the ow of FDI in Iran. Moshiri (2015) further revealed that there was the existence of heterogeneous responses between energy price and income changes in different income groups in Iran.
Using Lagrangean Multiplier (LM) unit root test to investigate the nexus between foreign direct investment, oil prices, and global nancial crisis in Singapore; Wong et al. (2015) discovered that external shocks of oil price and foreign direct inow were closely related in the short-run, whereas the external shocks of foreign direct investment in Singapore were attributed to Mexican crisis, the Asian nancial crisis, the global fund crisis, and high oil prices. In analysing the economic crisis in the Kurdistan region and its impact on foreign direct investment, Al-Mihya (2017) deduced the following: foreign direct investment inow were adversely affected by the economic crisis; reduction in the
Volume 45, No. 4 OCTOBER - DECEMBER, 2021
61
exchange rate, ination rate, and world oil price justied the variations in Nigeria's foreign direct investment by 88 percent. Using the Ordinary Least Squares (OLS) estimation method, Udoh (2014) claimed that foreign direct investments have no signicant relationship with oil export and the entire Nigerian economy due to misappropriation of funds and poor administration.
It is well established in the literature that the focus, scope, and methodology used in the study is the main reason for the unanimous conclusion on the issue of oil price and foreign investment nexus. Of important note is that no study has accounted for structural breaks and also examined the periodical effect of oil price on FDI by decomposing oil price. This study, therefore, lls this gap by examining the asymmetry effect of oil price on foreign direct investment in Nigeria using NARDL and also accounted for structural breaks.
3.0 Data Source and Methodology
The data used in this study is secondary in nature and spans from 1970 to 2018, sourced from the World Development Indicators (WDI) (2019) and BP Statistics (2019). The data include, Foreign direct investment net inow (% of GDP) proxy for foreign direct investment (FDI), Ratio of the sum of import and export service to GDP at current LCU sourced from WDI proxy for trade (T), GDP per capita (Current LCU) proxy for gross domestic product (GDP), and ofcial exchange rate (LCU, per US$, period average) proxy for exchange rate. Oil price ($US per barrel) sourced from BP Statistics (2019) proxy as oil price (OP). This study followed the model of Chow (1967), Cheng and Kwan (2000) and Kinuthia and Murshed (2015) which considered the determinants of FDI. The model for this study is specied as:
Equation (i) represents the relationship between oil price and foreign direct investment in Nigeria. is foreign direct investment, OP is oil price, GDP is gross domestic product per capita, TR is trade, EXR is ofcial exchange rate of a naira to dollar, all at time t.Transforming equation (i) into log-nonlinear function, by decomposing oil price to capture the periodical changes; (positive periods) and (negative periods). Equation (ii) is specied as:
In order to account for the long-run and short-run dynamics between oil price uctuations and foreign direct investment in Nigeria, the NARDL model without breaks is specied as:
From equation 3, the NARDL with breaks model where the breaks are considered as xed regressors is specied as:
From equation (iii and iv), denotes changes in the variables in the short-run, is the optimal lag length, - error term at time. The parameters are the corresponding long-run mult ip l ier , and the parameters are the short-run dynamic of the NARDL model. is the parameter estimate of the error correction model. is a dummy variable for each of the break dened as otherwise, represents the time period; are the structural break dates where =1, 2, 3,……., is the coefcient of the breaks dummy.
4.0 Empirical Results
4.1 Descriptive Statistics
From the analysis, it was observed that the behaviour of the variables were well behaved within the time period under study. The mean values lie in between their minimum and maximum levels. The implication of this is that their reactions to unexpected shocks in the economy was not outrageous and was within expectation. Therefore, on average, FDI, OP, GDP EXR and TR averagely changed by 2.61 units, 1.37 percent, 3.88 percent, 54.5 units, and 36643.91 units within the period under study. The skewness result showed that oil price (OP) was negatively skewed, showing its uniqueness behaviour among other variables as FDI, GDP, EXR and TR had a long tail to the right. Following the Jarque-Bera outcome, it was also noted that the oil price and GDP were normally distributed, while FDI, EXR and TR were not bell shaped (i.e. not normally distributed). This was justied by the probability values which were expected to be greater than 10 percent in order to be normally distributed and shows the necessity to rely on asymmetric methods, as adopted by the study (see table 1).
Compiled by Authors (2020)
Volume 45, No. 4 OCTOBER - DECEMBER, 2021
62
From the correlation test, it was revealed that oil price and trade have a negative and inelastic correlation with foreign direct investment, while GDP and EXR were positively correlated, but insignicantly correlated with FDI in Nigeria within the period under study. The implication of this result is that changes in oil price and
Compiled by Authors (2020)
To test if the variables are free of unit root problem and are mean reverting in the long-run, the Ng-Perron test was employed. It was revealed from the result that the variables were stationary at I(0) and I(1). This implies that there is problem of unit root among the variables as all the variables were not stationary at I(0) (see table 3 for the result). This therefore necessitated the need to test if the variables have a long-run relationship using ARDL bounds test. Also, an
innovation in this study is the adoption of Bai-Perron (2003) structural break test which is capable of accounting up to ve possible breaks. The study adopted this method to minimise the possibilities of having a spurious conclusion.
Compiled by Authors (2020)
To examine the long-run relationship among the variables, the study took into consideration the decomposition of oil price into negative and positive periods. While analysing without breaks, the NARDL bounds test result was inconclusive as its F-statistic value falls between the lower and upper bounds class. This implies that probability of long-run relationship is ambiguous (see table 4).
Note: *,**,*** implies the level of signication at 10%,5%and 1%respectively
Note: *,**,*** implies the level of signication at 10%,5%and 1%respectively.
Table 4: NARDL Bounds Test
Energy and FDI Model
Model Estimation F-statistic Lower & Upper
Class bound @ 10%
Table 2: Correlation Result
Table 3: Unit Root Test
The structural break test showed two periods of breaks: 1989 and 1995. The study accounted for the breaks in the NARDL model as dummies which was treated as a xed regressors. The result of the structural break is reported in table 5.
Volume 45, No. 4 OCTOBER - DECEMBER, 2021
63
NARDL Estimate
The NARDL estimate showed that accounting for breaks (specically 1989) is signicant in the model. This implies that the model behaves better when structural breaks were accounted for. The estimate also revealed that positive changes in oil price have a negative and insignicant relationship with foreign direct investment in Nigeria. At the same time, negative changes in oil price have a negative impact on FDI in the short-run and long-run considering breaks, while without breaks, negative changes in oil price have a positive and inelastic impact on foreign direct investment. The implication of this is that in the long-run, with and without breaks, more positive changes in oil price reduce FDI by 1.9 percent and 1.6 percent, respectively, in the long-run, while in the short-run, reduces FDI by 1.3 percent with and without breaks. More negative changes in oil price increase FDI by 4.2 percent and 2.8 percent in the short-run and long-run, respectively, without breaks. When breaks were accounted for, more negative changes will reduce FDI by 0.29 percent and 0.23 percent in the long-run and short-run, respectively. The result partly deviates from Quero-Virla (2016) study for Colombia and Ademakinwa and Omokanmi (2017) for Nigeria, but inconsistent with the ndings of Shari-Renania and Mirfatah (2012) in Iran and Olure et al. (2014) in Nigeria, that oil price negatively impacts on FDI in Nigeria. Exchange rate and trade also in the long-run and short-run have a negative and inelastic impact on foreign direct investment in Nigeria. It was therefore observed that the magnitude, even though negative, is weak as it is not up to 1 percent both in the short-run and long-run. The ndings are against the ndings of Kinuthia and Murshed (2015) in Kenya and Malaysia that trade policies have not been favoring the economy of Nigeria. GDP in the long-run and short-run positively and signicantly inuences foreign direct investment in Nigeria. The implication of this is that as GDP increases by one percent, in the long run, FDI increases by 1.3 percent and 3.8 percent, while in the short-run, by 0.85 percent and 3 percent without and with breaks, respectively. This negates the submission of Elheddad (2016), which states a negative nexus between GDP and FDI. The error correction model for both models is rightly signed and signicant. This implies that without breaks, 65 percent
of FDI deviations from the short-run equilibrium are corrected in the long-run by the independent variables while considering breaks, 79 percent is corrected. This implies that considering the structural breaks in the model makes the model more signicant and explains the phenomenon better.
The reliability test considering breaks showed that the model is stable and explains the phenomenon, which is also justied by the F-stat value. The model is free of serial correlation problem but has heteroskedasticity problem, which may be due to the inclusion of xed regressors as the NARDL model without breaks is free of heteroskedasticity problem.
Table 5: Bai - Perron Test
Break Period Country Break Range
Volume 45, No. 4 OCTOBER - DECEMBER, 2021
64
B represents dummy for the identied break date as identied in the Bai Perron test presented in Table 6. T-statistics are presented in brackets and probability values are presented in parentheses. The critical values for the Lower and Upper Bounds are 3.03 and 4.06 respectively for the symmetric models at 10 percent signicance level. *, **, and *** indicate statistical signicance at 1 percent, 5 percent and 10 percent, respectively.Compiled by authors (2020)
5.0 Conclusion and Recommendation
The study investigates the link between oil price and foreign direct investment in Nigeria between 1970 and 2018. The non-Linear Autoregressive Distributed Lag method was used to estimate the parameters. Bai-Perron's (2003) test was used to account for the structural breaks. It was noted from the structural
break result that there are two break periods within the period under study. The break periods are 1989 and 1995, but 1989 is signicant when included in the model as a xed regressor. From the NARDL estimation, considering breaks, oil price negatively inuenced FDI in Nigeria in the short-run and long-run. The error correction model was rightly signed and was signicant at 5 percent, and it corrected about 79 percent of deviations of FDI in the short-run back to equilibrium in the long-run. The study concludes from the ndings that oil price uctuations are detrimental to FDI in Nigeria irrespective of positive or negative changes. From the ndings, the study recommended that adequate measures should be taken by considering the investment in other sectors of the economy to attract investors and create an atmosphere whereby they are not affected by the oil price.
Volume 45, No. 4 OCTOBER - DECEMBER, 2021
REFERENCES
Ademakinwa, A. R., & Omokanmi, O. J. (2017). “Oil Price Shocks and Foreign Direct Investment (FDI): Implications for Economic
Growth in Nigeria (1980-2014)”. Journal of Economics and Sustainable Development, 8 (4), pp. 170-177.
Al-Mihya SNA (2017) “The Economic Crisis in Kurdistan Region and its Impact on Foreign Investment”. International Journal of
The softcopy of the papers should also be submitted via email as electronic document, preferably Microsoft word document to either of the following email addresses: [email protected]([email protected]);
Areas of emphasis should be on topics within the following broad themes:
* Economic Growth and Development
* Monetary Policy
* Development Finance
* Issues in the Financial system
* Public Policy Analysis
* Development Studies
* Economic Diversification studies
* Issues in Real Sector Development
* Regulatory and Supervisory Development
* Foreign exchange management
* Other areas of research interest for BULLION
include developments in:
· FSS 2020
· Payment Systems
· Financial Inclusion
· Currency Management
· Internet Banking
· Mobile Money
The essence of this guideline is to help focus on areas we want covered. Note, this is not exhaustive. Please feel free to address all other issues you consider pertinent to the mandate of the Central Bank of Nigeria.
2. The article should not be more than twenty-five
(25) pages of 4000 – 7000 words in length. It should be typed with 1.15 line spacing option, with a margin of 1.25 and 1.13 inches on the left and right sides, respectively. The font type to
be used is “Arial” with font size “14” for
headings and size “12” for the body of the article.
3. The manuscript must be accompanied with a letter of submission written in English. Submission of a paper is assumed to imply that its contents represent original and unpublished work and is not under consideration elsewhere for publication.
4. There is neither a submission charge nor page fee. The complete names and address (postal and email) of the author or lead author in the case of co-authored papers should be clearly
indicated. Please note that papers with more
than two co-authors will not be accepted.
5. Papers may be rejected, accepted or returned for specified revisions.
6. All submitted manuscripts are referred to an Editorial Board comprising of an in-house editorial committee and external referees for peer-review of the paper. All comments by the referees will be sent to the author(s), including a decision of the Editorial Board to publish or not to publish the paper.
7. The purpose and scope of the article should be clearly stated in an abstract summarising the article's essential findings. The abstract should be typed on a separate page and should be
italicised and not more than 100 words in
length. In addition, the JEL classification code (s) as well as keywords should be clearly indicated on the abstract page.
8. The author's institutional affiliation and necessary background information on the article should appear at the foot of the first page. Footnote to the text should be listed at the end, followed by the list of references
10. References for quotations or statements should be in parentheses in the text, not as notes. e.g. Mordi (2010:20) or Mu'azu (2014). Where more than two authors are involved, cite senior author and use et al., for example, Johnson et al. (1988).
11. Citations listed under the reference sections must begin on a new page. All entries must be typed double-spaced, listed alphabetically by last name of senior author and chronologically for two or more articles by the same author. The typed layout must conform to the Havard style, as follows:
Mordi, C. N. O. (2010). “The Nigerian Financial Crisis: Lessons, Prospects and Way Forward”, CBN Bullion. Vol. 31 No. 3, July – September, pp. 1-10.
Adenuga, A. O. and O. Evbuomwan (2011). “Understanding the Bretton Woods Institutions (BWIs) with Particular Reference to the International Monetary Fund (IMF)” CBN Bullion. Vol. 35 No. 4, October – December, pp. 10-15.
12. All tabular materials should be separated from the text in a series of tables numbered consecutively in Arabic numerals preferably in Microsoft Excel. Each table should be typed double-spaced and identified by a short title at the top. Notes for table should be at the bottom of each table, before the source, and marked by lower case superscript letters. Appropriately placed tables should be indicated in the text.
13. Diagrams, graphs, charts, etc. must be separated from the text and clearly plotted on a white paper with all axes clearly positioned. They should be inserted appropriately in the text.
14. Where mathematical equations and formulae are used, they should be typed clearly, using MathType or Microsoft Equation Editor. The equations should be numbered consecutively in Arabic numerals.
15. All submissions should be accompanied with a clear digital soft copy passport size photographs of the author(s).
Your passport photo must be:
· clear and in focus
· in colour
· unaltered by computer software
· at least 600 pixels wide and 750 pixels tall
· at least 50KB and no more than 10MB
· contain no other objects or people
· be taken against a plain light-colored background
· be in clear contrast to the background
· not have 'red eye’
In your photo you must:
· be facing forwards and looking straight at the camera
· have a plain expression and your mouth closed
· have your eyes open and visible
· not have anything covering your face
· not have any shadows on your face or behind you
Do not wear sunglasses or tinted glasses. You can wear other glasses if you need to, but your eyes must be visible without any glare or reflection.
Digital Passport photos is a mandatory requirement to be published
Thank you.
Volume 45, No. 4 OCTOBER - DECEMBER, 2021
Volume 45 No. 4 October - December, 2021
Godwin I. Emefiele Governor(Chairman)
Folashodun A. Shonubi Deputy Governor(Operations)
Aishah N. Ahmad Deputy Governor(Financial System Stability)
Edward L. Adamu Deputy Governor(Corporate Service)