59

Publication Data © March 2014 WECF e.V., Germany ISBN 9 783 981 31 7060 Copyright: WECF 2014 Copying parts of this publication is allowed on the condition that the source is mentioned Editors: Margriet Samwel, WECF Claudia Wendland, WECF All figures and tables are developed by the authors, unless mentioned Photos by the editors, unless mentioned Project Partners:
JHR, Republic of Macedonia, www.detstvo.org.mk
Aquademica, Romania, http://www.aquademica.ro/
This publication was made possible with the financial support of the German Federal Environment Foundation (DBU). Diese Publikation wurde gefördert von der Deutsche Bundesstiftung Umwelt (DBU). This publication was made possible with the support of the Donald Kuenen Foundation for the advancement of environmental expertise in Central and Eastern Europe. The content of this publication does not necessarily reflect the opinion of the donors.
www.wecf.eu WECF – Women in Europe for a Common Future The Netherlands / France / Germany
WECF The Netherlands PO Box 13047 3507-‐LA Utrecht The Netherlands Tel.: +31 -‐ 30 -‐ 23 10 300 Fax: +31 -‐ 30 -‐ 23 40 878
WECF France BP 100 74103 Annemasse Cedex France Tel.: +33 -‐ 450 -‐ 49 97 38 Fax: +33 -‐ 450 -‐ 49 97 38
WECF e.V. Germany St. Jakobs-‐Platz 10 D -‐ 80331 Munich Germany Tel.: +49 -‐ 89 -‐ 23 23 938 -‐ 0 Fax: +49 -‐ 89 -‐ 23 23 938 -‐ 11
A WECF publication 2014 A WECF publication 2014
Contents
Foreword I Acknowledgements II How to Use the WSSP Compendium? III
Part A – How to accomplish a water and sanitation safety plan? Module A1 Introducing Water and Sanitation Safety Plans 1
Module A2 WSSP for Small-‐Scale Water Supplies: boreholes, dug-‐wells and springs 9
Module A3 WSSP for Small-‐Scale Piped Water Distribution Systems 17
Module A4 Step-‐by-‐Step: 10 Suggested Activities for Developing a WSSP 27
Module A5 Practicing Simple Water Quality Tests 31
Module A6 Mapping the Village / Visualisation of the Analysis Results 39
Module A7 Risk Assessment of Small-‐Scale Water Supply and Sanitation Systems 47
Module A8 Conducting Interviews 59
Part B – Background information for developing WSSP Module B1 Drinking Water Sources and Abstraction 1
Module B2 Drinking Water Treatment, Storage and Distribution 11
Module B3 Drinking Water Distribution – Pipes 25
Module B4 Drinking Water Quality 35
Module B5 Sanitation and Wastewater Treatment 49
Module B6 Water Protection 63
Module B7 Regulations on Water 77
Module B8 Rainwater Management 87
Part C – How to involve schools? Module C1 Introducing Water and Sanitation Safety Plans to Schools 1
Module C2 About Water 13
Module C3 Hand Washing 21
Module C4 Sanitation in Schools 29
Module C5 Utilisation of Water in our Daily Life 37
Module C6 Water Saving 47
A WECF publication 2014 A WECF publication 2014
Foreword
Public health, safe water supply and safe sanitation are very much interrelated and are neglected or in their relevance underestimated, particularly in rural communities. Better protection and management of drinking water sources and sanitation facilities are possible, if weaknesses and strengths are identified. For the identification of possible sources of hazards and risks, the knowledge about an adequate quality of water and sanitation, the pathways of contamination and the associated risks, as well as the prevention of risks are essential. A water and sanitation safety plan (WSSP) can be one way to obtain and maintain safe drinking water and sanitation systems and to minimise related diseases. The management of a safe drinking water supply system, whether it is on a small or large scale, concerns many stakeholders.
On community level, the concerned stakeholders, local authorities, water operators, schools, citizens can play together an important role in improving the management of the local drinking water supplies and sanitation facilities. This compendium gives guidance and background information for managing and planning safe water and safe sanitation for small rural communities in the pan-‐European countries.
The presented Compendium aims to enable communities to develop a WSSP for small-‐scale water supplies, e.g. dug wells, boreholes, springs and piped centralised water supply systems, and as well as to assess the quality of sanitation facilities such as school toilets. The users of this WSSP compendium should facilitate them to develop step-‐by-‐step a WSSP for their community in a multi stakeholder process and in cooperation with authorities, schools, citizens and other stakeholders.
We hope, that local authorities, water operators and schools will largely use this compendium as a practical tool to improve the public health situation -‐ not only in Macedonia and Romania, but in other countries of the pan-‐European Region as well!
Sascha Gabizon International Director WECF DE/NL/F
Natasa Dokovska Executive Director JHR Republic of Macedonia
Monica Isacu Executive Director Aquademica Romania
I
A WECF publication 2014 A WECF publication 2014
Acknowledgements
After the Water Safety Plan (WSP) approach had been created by WHO, the WECF senior water professional Margriet Samwel understood the rich potential of WSP, also for small communities and developed the manual “Developing water safety plans involving schools” and now available in English, Armenian, Azerbaijan, Romanian, Russian and Georgian) especially for small scale water supplies in the pan-‐European Region. The manual has been applied in the WECF network in 8 countries of Eastern Europe and the Caucasus during the last 6 years.
Some stakeholders had become enthusiastic but requested to provide them with more background information. In addition, the issue of sanitation turned out to be often neglected, although it is of special importance for public health in rural communities as well. The present compendium is thus a consistent further development based on the experience within the WECF network.
Authors
Natasa Dokovska, Journalists for Human Rights
Monica Isacu, Aquademica
Diana Iskreva, Earth Forever
Friedemann Klimek, WECF
Bistra Mihaylova, WECF
Doris Möller, WECF
Margriet Samwel, WECF
Claudia Wendland, WECF
Aglika Yordanova, Ecoworld 2007
Translators
Pamela Lawson
Susan Paardekam
Yolande Samwel
Alexandra Wormald
II

A WECF publication 2014 A WECF publication 2014
How to Use the WSSP Compendium?
The Water & Sanitation Safety Plan (WSSP) compendium consists of three parts:
Part A: How to accomplish a water and sanitation safety plan?
Part A, consists of 8 modules, explaining the approach of developing water and sanitation safety plans (WSSP) for small-‐scale water supplies, and provides basic and practical guidance for developing a WSSP. Two modules focus mainly on WSSP for non-‐piped water supplies and on small-‐scale piped distribution systems. Furthermore this part introduces the practical activities in 10 steps to be carried out by a WSSP team and leading to a local WSSP. Several forms for the practical activities, doing risk assessments of the water supply or toilets, doing interviews of different stakeholders and processing the collected information and results as well as examples are provided.
The main target groups of part A are local authorities and water operators, but also teachers and NGOs.
Part B: Background information for developing WSSP
Part B, consists of 8 modules, providing technical and regulatory information on for example possible drinking water sources, water treatment and distribution, sanitation and wastewater treatment, water protection and water quality, management of storm water and water related regulations.
The main target groups of part B are persons who appreciate more background information on water and sanitation related issues. These can be local authorities and water operators, but also teachers, NGOs and interested citizens.
Part C: How to involve schools?
Part C, consists of 6 modules, and is an additional part, especially for youth and schools. It includes theoretical lessons on general water issues such as the water cycle, and also specific information on school sanitation, water and hygiene. The development of a WSSP is explained especially in terms of involving pupils and citizens. Exercises and suggestions for practical and interactive actions in combination with the tool box are detailed.
Part C targets mainly teachers, but also youth group leaders, NGOs or local authorities.
Remarks
Most of the modules finish with a list of practical WSSP related activities, the expected results or outputs, and a list with references and further readings.
The contents of the presented WSSP compendium are not definite and can be adjusted and developed according to the local situation and possibilities for implementation.
In part C, the use of the toolbox is also recommended to carry out the exercises.
III

1
Module C1
Introducing Water and Sanitation Safety Plans to Schools Authors: Margriet Samwel, Claudia Wendland
Summary In this module the principles of developing a water and sanitation safety plan (WSSP) for small-‐scale systems, with the involvement of schools, their pupils and the community, are explained. Several steps and tasks are presented on how to develop a WSSP with schools. The WSSP team to be established, and the community will also play an important role. The 10 main steps and hints for developing a WSSP are presented and suggestions are given on how to realise this task. Reference will also be made to other modules, which will provide more detailed information on the issue, and/or frameworks for reporting analyses and conducting interviews and risk and quality assessments of local water sources and sanitation systems (such as school toilets).
The 10 WSSP steps presented are:
Step 1: Workshop for teachers; set up a WSSP working team and program Step 2: Description of the local drinking water system(s) and sanitation facilities Step 3: Identification of relevant stakeholders and regulations Step 4: Documenting and village mapping Objectives Step 5: Risk assessment and water tests Step 6: Sharing information, mobilising the community Step 7: Development of an action plan Step 8: Report and share the planned actions Step 9: Implementation of the planned actions Step 10: Monitor, improve or adjust the WSSP activities
Objective
From this module, the reader should gain a knowledge and understanding of the aims and approaches of developing a WSSP. The reader should be given the tools to facilitate and support the involvement of schools in developing a WSSP for small-‐scale systems in their community.
Key words and terms Small-‐scale water supplies, small-‐scale sanitation, hygiene, safety, risk assessment, monitoring, analysis, control and eliminating hazards and risks, minimising health risks, action plans.
Mod
ule
4

Module C1 ___________________________________________________________________________
2 A WECF publication 2014
Introducing Water and Sanitation Safety Plans to Schools
1. Why the involvement of youth via schools?
Children and young people are open to accepting new knowledge and participating in new activities. The know-‐how that children learn at a young age will guide them through their whole life, especially in the case of interactive learning, where children can grasp a concept using all of their senses. Children can multiply knowledge within their society, as they share and transfer it with and between their parents, siblings and friends.
Children can be the drivers for the development of water and sanitation safety plans (WSSP) for small-‐scale systems in their communities or schools, but the support of teachers, parents and authorities is also needed. With the cooperation of all stakeholders, children can be taught to share information and will be given a broader perspective on their environment and community. A major advantage of WSSPs is that children and other stakeholders can discover and gather information about the environmental situation in their community together. This ‘learning by doing’ approach has proven a very effective way to internalise knowledge.
Children learning to appreciate water as a valuable resource (Photo by Margarita Torres)
Depending on the age of the children, the available time and the level of involvement of teachers and other stakeholders, an approximate final outcome of the WSSP will be outlined below. Parts of the proposed programme can be selected and even changed and adapted to suit the local circumstances. Certain activities will be indispensable for a basic knowledge of the quality and risks of water supply and sanitation systems (e.g. school toilets) This action plan proposes a programme for children’s involvement in the monitoring of the quality of drinking water in toilets belonging to their school, other public toilets, and in the general environment of their village. This programme will have several outcomes, such as: • Understanding of the water supply system and the risks and dangers of pollution • Understanding of toilet systems and their advantages and disadvantages • Awareness-‐raising about possible water borne diseases and the link between sanitation, hygiene and health • Knowledge about the quality of local drinking water and sanitation systems • Insight into the seasonal fluctuations of nitrate concentrations in the water • Awareness-‐raising about the relationship between water quality and the environment • Rising about potential health risks from unsafe drinking water and poor sanitation and hygiene practices. • Environmental awareness among children and citizens, through active participation • Cooperation with local authorities and other stakeholders • Capacity-‐building of local youth and citizens • Strengthening the demand for active water protection measures and access to safe sanitation • Action planning towards improving the water and sanitation situation in the school and community

Module C1 ____________________________________________________________________________
A WECF publication 2014 3
2. How to develop a Water and Sanitation Safety Plan (WSSP) with schools?
The methodology of developing a WSSP within schools is the same as the general methodology explained in Part A of this Compendium. In this part of the Compendium, there are some additional activities proposed which are specific to schools, such as the assessment of the school’s water and sanitation situation.
The procedure for carrying out the programme should be discussed in the school with the children and teachers. Ideally, parents and local authorities should be informed about the project and be involved in it too. For the purpose of covering different aspects of the water supply and sanitation system, a team of people with different background and expertise will benefit the development of a WSSP. Finally, the results of the WSSP school program will depend a lot on the available time, the level and the age of the pupils. However, much can be achieved simply by raising awareness about the situation within the school and community. What follows are some thoughts and the most important steps for developing a WSSP, presented in more detail.
Awareness-‐raising: Possible interaction between a pit latrine and the environment. Drawn by pupil of primary school, Romania
2.1. The toolbox
There are core activities for developing a WSSP, such as conducting for example Nitrate quick tests or investigating the pH or colour of the water, and in which tools are needed. Therefore, it will be convenient to have a (tool) box for each class or group to gather the tools needed and related to the WSSP lessons. The toolbox consists of practical tools, which can be combined according to the needs and circumstances. Furthermore educational and/or practical tools can be stored in the box. The content of the toolbox can be: • Clear drinking glass of 2 dl or 3 dl • Nitrate quick test strips – with a range from 0-‐500 mg/l • pH –indicator strips • Colour strip or white paper for observing the colour or turbidity of the water • Puzzle poster of “bad” and “good wells”, other pictures or drawings e.g. “The water cycle” • Precipitation measure beaker • Thermometer • Towel or tissues, notebook, pens, scissors, etc.

Module C1 ____________________________________________________________________________
4 A WECF Compendium 2014
3. Steps and hints for developing a WSSP for small-scale systems
Although, in general, school staff have a lot of knowledge and skills, there will undoubtedly be situations where a consultancy or interview with a local authority, or water and sanitation or health expert, will be beneficial for obtaining advice and information. Therefore, the school will not develop the WSSP alone but rather, by a WSSP team, together with different stakeholders from the community. It is important to have regular team meetings, to share information, to communicate progress and challenges and, overall, to work in a transparent way. Finally, the results of all the activities and investigations should be shared and discussed, not only by the WSSP team or school, but also by the citizens of the community. The local media are often interested and willing to publish articles in the newspaper, or conduct interviews for radio or television. Furthermore, exhibitions in the school or town hall, public meetings, or special national or international days dedicated to water and/or toilets, are excellent occasions for presenting the WSSP results and raising awareness among the broader public. Below, 10 basic steps for developing a WSSP for small-‐scale systems are summarised and presented. The estimated time need for conducting the steps, and the module numbers for more information related to the activity mentioned, are given.
Step Time frame Week
Activity Compendium Reference
Tool/ Interaction
Cooperation partner
1 W. 1 -‐ 3 Set up a WSSP working team and develop a WSSP program
C1,
A1, A2, A3
Public meeting, contacting local authorities, water operator and schools staff
Local authorities, water operator, community, NGO, school staff and secondary school pupils
2 W. 2-‐5
W4-‐ continue
Description of the local drinking water system(s) and sanitation facilities; Nitrate monitoring of local water sources
B1, B2, B3, B5 A5
Visiting/interviewing the water supplier/ operators and local authorities; Field visits Nitrate quick tests
Authorities, water operator, school, citizens, NGO
3 W. 3-‐6 Identification of relevant stakeholders for the water supply and sanitation systems and services.
A1, A8, B5, B8 Interviewing water supplier/ operators, and local (regional) authorities; Internet search; mapping the stakeholders
Authorities, water operator, school (secondary pupils), NGO
4
W 5-‐8 Documenting and village mapping: visualisation of the water and sanitation systems; Stakeholder mapping
A6 Information collected from the different steps
Local authorities, school
5 W. 9-‐14 Risk assessment of local water supply and sanitation
C3, C4 A5, A7, A8, B1, B2, B3, B4, B5, B6
Sanitary inspection forms, interviews, field visit of water protection zones, water sources and toilets. Collecting results of water analyses. Hand washing exercise.
Authorities, water operator, school, citizens, NGO laboratory,
6 W. 15-‐20 Visualisation of the results and findings; sharing of information,
A1 and A6 Information collected from steps 4 and 5; Exchange with other schools, Exhibitions, meetings; Working
Partner schools, journalists, authorities and community, NGO
Module C1 ____________________________________________________________________________
A WECF publication 2014 5
Table 1. Overview of 10 steps for developing WSSP for scale-‐scale systems
3.1. Step 1: Workshop for teachers; set up a WSSP working team and program
The set-‐up of the appropriate working team is an important first step for the WSSP programme. The team consists of teachers, NGO supporting staff, persons responsible for water and sanitation in the community, and, perhaps, representatives of the local youth and community. The WSSP team should be composed of an equal number of males and females, and should involve minorities and vulnerable groups.
As a start, the kick-‐off workshop will take place. Here, the aim of the project and compendium will be introduced to the whole team, in particularly the teachers who will work with the youth and relevant local authorities. The workshops last ca. 2 days, during which the background of the WSSP, the Compendium and the 10 steps of the WSSP programme will be explained in detail and some practical activities will be conducted. A ‘Training of Trainers’ methodology will be used, so that teachers and participants will be able to develop a WSSP programme tailored to their specific conditions, community and school.
For further planning, it is important to discuss the forecast WSSP activities with educational authorities or the school director. The question must be asked: will the curriculum permit time for WSSP activities during school lessons, or only after school finishes?
After a local WSSP working team is established, a WSSP programme should be developed. Ideally, a preliminary program will be made for a time frame of one school year. For the implementation of the WSSP, the most relevant activities should be defined, as well the persons responsible for carrying out the activities. Further, someone should be identified who can document and report on the meetings, WSSP activities, results and experiences. Furthermore, the time frame outlining what should be done and when, as well as the related costs, should be estimated.
Moreover, issues like the communication of activities and the sharing information with other classes or schools and communities must be discussed. Particular activities, experts or field visits may also be needed.
3.2 Step 2: Description of the local drinking water system(s) and sanitation facilities
The team starts with a description of the local water supply system. In cases where the community uses water from wells and/ or springs, the number and location of these water sources should be investigated. If needed, and with the support of local authorities, pupils and teachers might also make an inventory of the local water supply and local sanitation solutions (see module A2 and A3). What kind of supply is there? Are there dug wells, boreholes or public taps? Which water source is used and how deep is the tapped water layer? Where are the water points? What is the distance between them and the houses of consumers? Which households have access to the water point or supply?
mobilising community
with the media
7 W. 21-‐25 Development of an action plan for improving the situation
Meetings and discussions with all stakeholders
All relevant stakeholders
8 W. 26-‐27 Report and share the planned action
Exchange with other schools; sharing information with the community and authorities
NGO media
9 W. 28-‐... Implementation of the action plan
Cooperation and collaboration with all relevant stakeholders
All relevant stakeholders
10 Continu-‐ously in the future
Monitor, improve or adjust the WSSP activities
All relevant stakeholders, WSSP team

Module C1 ____________________________________________________________________________
6 A WECF Compendium 2014
If centralised piped water is available then the whole system should be looked at, from the point where the water comes from, to the method of abstraction and, the volume and location of water reservoirs (if applicable, also the water treatment system and distribution (network) of the water), to the households where the water is supplied. An overview of the households or public institutions served by the piped network or by other water sources should be made. What type of toilet do households have? Are there public toilets? Much of this information can be represented on a map. Using an existing map for identification and mapping purposes is very useful. If no map is available, an overview of the village, its water supply points and sanitation systems should be drawn up. Furthermore, if applicable, it would make sense to identify the location of the sewage network, the wastewater treatment plant and the location the point of release of the wastewater into the environment. If no sewage system is used, than the type of public toilets and how the content of these toilets is stored, treated, used or released into the environment should be looked at. For this task and for the processing of the information gathered, it is very useful to present it on a map (see module A6 and step 4)
3.3. Step 3: Identification of relevant stakeholders and regulations
An investigation of the current situation concerning the responsibilities and management of the water supply system will be useful for identifying who is doing what. The NGO involved and the local administration could potentially support this process by facilitating the gathering of information from the different stakeholders. Questions such as: ‘who officially has the task of monitoring, cleaning and maintaining the water system?’ should be posed. Is there any system or institution analysing the water quality and, if yes, with whom are its results shared? Is there any budget available for operation and maintenance; is there any contribution from the local citizens for water consumption? Who makes the decision about the budget etc.? Particular attention should be paid to the role of women, as they are often responsible for the household budget, as well as health and sanitation issues. Local and national joint actions can be developed, by creating an atmosphere of understanding and cooperation, by knowing the different tasks and responsibilities, and by bringing consumers, water suppliers and all other stakeholders closer together. An important part of this step is investigating the relevant regulations and laws applicable for the local water supply and sanitation systems. In other words, how frequently should water quality be monitored, and which substances should be analysed? What should be done in case the water does not comply with the set standards? For more information, see modules B4 and B 8. Structures of the responsibilities of the whole system can be summarised in an overview of responsibilities or in a ‘network diagram’, for example (see module A6). Other graphs listing, ranking and connecting institutions, groups or individuals, communication systems and information sources that influence the community’s decision-‐making on water supply can also be used.
3.4. Step 4: Documenting and Village mapping
A component of the WSSP is the documentation of the collected information and the making of results and plans visible to all stakeholders. All the collected information should be documented, objective, understandable and made available in reports. The documentation might be in a notebook or computer-‐ the most important thing is that the task is adequately done.
Water mapping
Depending on the issue at hand, the results can be made visible in graphs or maps (see, also, module A6). In many cases, the administration of the community or the institution responsible for water supply will have a village map, one which possibly indicates water sources, water networks (if applicable) or other water-‐related information.
Module C1 ____________________________________________________________________________
A WECF publication 2014 7
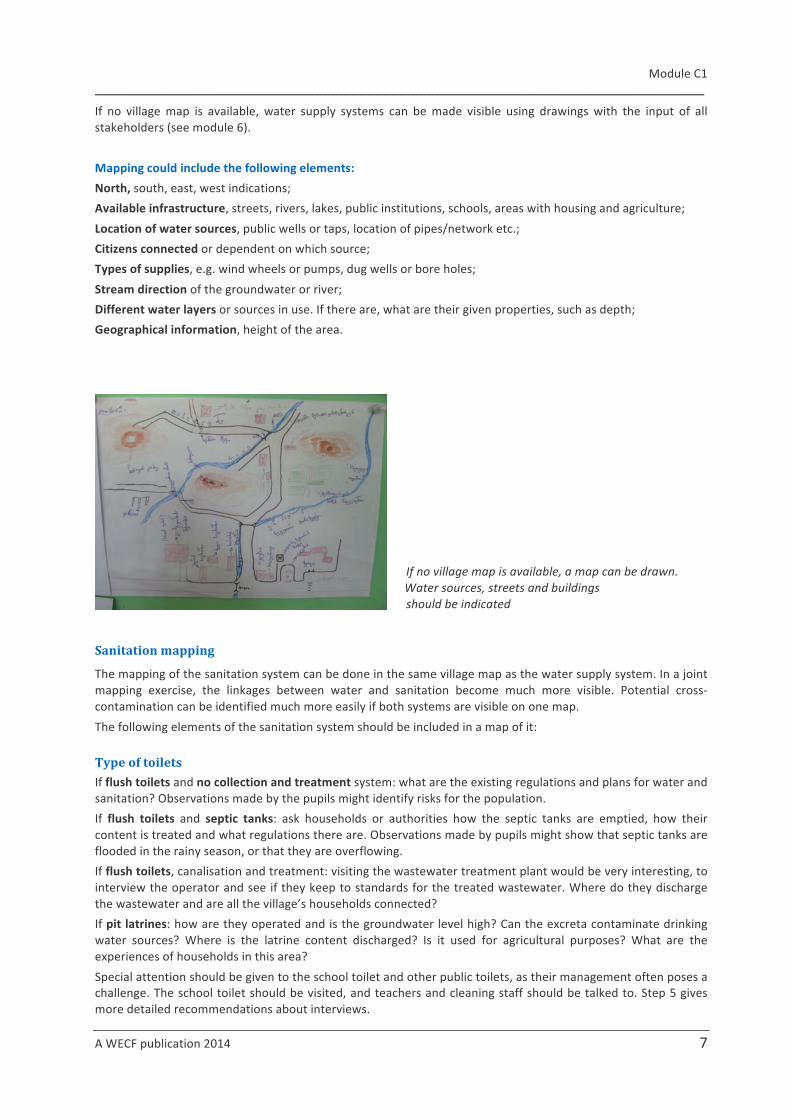
If no village map is available, water supply systems can be made visible using drawings with the input of all stakeholders (see module 6). Mapping could include the following elements:
North, south, east, west indications; Available infrastructure, streets, rivers, lakes, public institutions, schools, areas with housing and agriculture; Location of water sources, public wells or taps, location of pipes/network etc.; Citizens connected or dependent on which source; Types of supplies, e.g. wind wheels or pumps, dug wells or bore holes; Stream direction of the groundwater or river; Different water layers or sources in use. If there are, what are their given properties, such as depth; Geographical information, height of the area.
If no village map is available, a map can be drawn. Water sources, streets and buildings should be indicated
Sanitation mapping
The mapping of the sanitation system can be done in the same village map as the water supply system. In a joint mapping exercise, the linkages between water and sanitation become much more visible. Potential cross-‐contamination can be identified much more easily if both systems are visible on one map. The following elements of the sanitation system should be included in a map of it: Type of toilets
If flush toilets and no collection and treatment system: what are the existing regulations and plans for water and sanitation? Observations made by the pupils might identify risks for the population. If flush toilets and septic tanks: ask households or authorities how the septic tanks are emptied, how their content is treated and what regulations there are. Observations made by pupils might show that septic tanks are flooded in the rainy season, or that they are overflowing. If flush toilets, canalisation and treatment: visiting the wastewater treatment plant would be very interesting, to interview the operator and see if they keep to standards for the treated wastewater. Where do they discharge the wastewater and are all the village’s households connected? If pit latrines: how are they operated and is the groundwater level high? Can the excreta contaminate drinking water sources? Where is the latrine content discharged? Is it used for agricultural purposes? What are the experiences of households in this area? Special attention should be given to the school toilet and other public toilets, as their management often poses a challenge. The school toilet should be visited, and teachers and cleaning staff should be talked to. Step 5 gives more detailed recommendations about interviews.

Module C1 ____________________________________________________________________________
8 A WECF Compendium 2014
3.5. Step 5: Risk assessment and water tests
Two basic elements in developing a WSSP are the investigation of current water and sanitation quality, and the risks and hazards (dangers) for the water supply and sanitation systems. Hazards can occur temporarily, during turns in the weather (rainfall or snow-‐melt); during the season when the fields are fertilised; or continuously, because the content of pit latrines and septic tanks may infiltrate the soil or because toilets, wells, pipes or reservoirs are badly maintained. Making observations and conducting interviews with relevant persons can identify many risks and hazards. Water quality can only be assessed by water analyses, whereas the quality of toilets can be investigated principally through observation. Information about water tests and the assessment of water supplies and sanitation will be provided below. However, it is advisable to also see the modules referenced.
3.5.1. Water tests
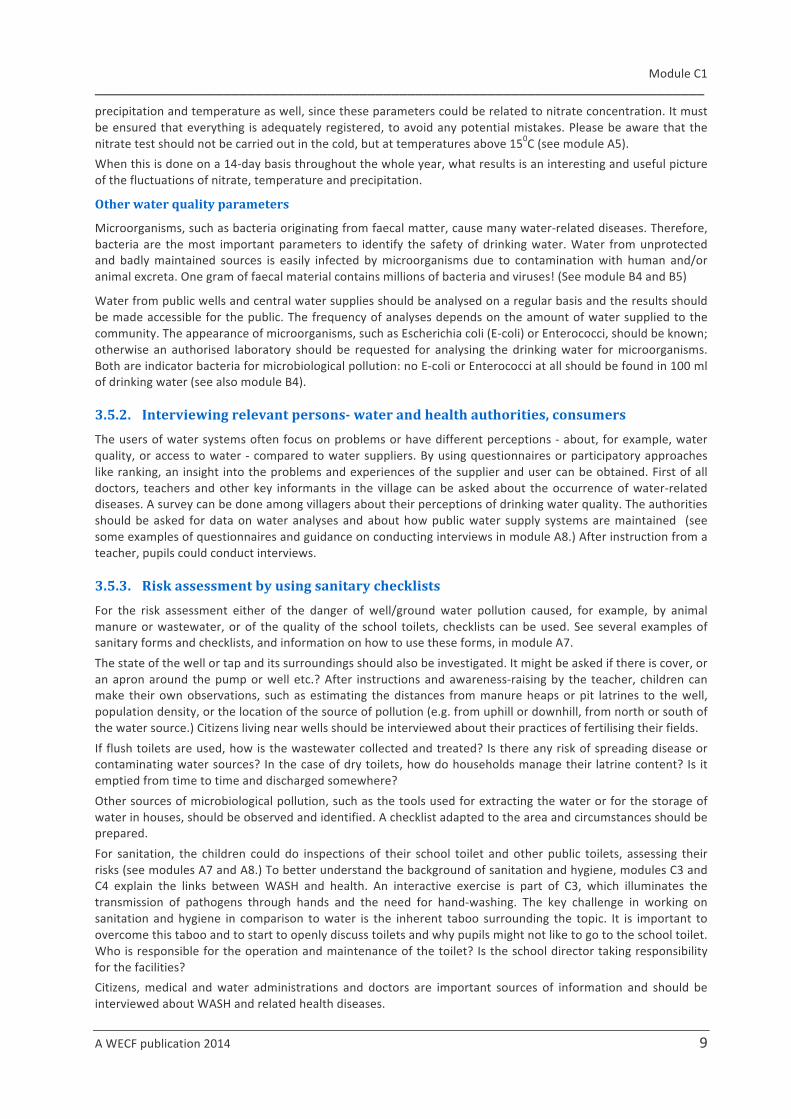
In general, operators of public water supplies should conduct regular tests on the quality of water supplied to consumers. Therefore, the first step would be to contact the local authority responsible for water quality and ask for a copy of their analysis report. Besides studying “official” analysis reports, it is very interesting for pupils to conduct water tests themselves. Quick tests can be a good way of obtaining an indication of the water quality, and easy to carry out. After pupils are instructed on how to do the tests and report the results, pupils can do this task also. For example, nitrate pollution can quickly be detected in water samples by using nitrate test strips.
Nitrate pollution can quickly be detected in water samples by using nitrate test strips
Nitrate monitoring of water sources
Monitoring water sources for nitrate contamination can be done in two different ways. First, a good overview of the existing nitrate concentration of the well water should be obtained. Water sources should be chosen in such a way that they could be considered representative of all water sources. This that means that sources from different parts of the village, which are potential sources of drinking water for the public, must be analysed. It is preferable to test these different water samples in the same season, e.g. during spring or summer. Pupils can take the sample to school or the tests can be carried out directly on the spot. The depth of the water source should be noted. Other observations on water quality, like colour, turbidity, or others, should be reported. Physical parameters such as soluble sediments (turbidity) indicate possible microbiological pollution.
The locations of the investigated wells and the test results must be noted, and can be transferred to the map. For reporting and mapping see modules A5 and A6.
Secondly, it can be very informative to monitor nitrate levels in the same wells throughout the year. For example, high, low and medium nitrate-‐polluted wells can be chosen for seasonal monitoring. The test results of a whole year give an overview of seasonal fluctuation, which might be useful for the WSSP. Depending on the particular soil layers, the leakage of nutrients into the groundwater by precipitation, manure fertilisation or nitrogen can be assessed clearly using such a monitoring programme. It is good, therefore, to measure
Module C1 ____________________________________________________________________________
A WECF publication 2014 9
precipitation and temperature as well, since these parameters could be related to nitrate concentration. It must be ensured that everything is adequately registered, to avoid any potential mistakes. Please be aware that the nitrate test should not be carried out in the cold, but at temperatures above 150C (see module A5). When this is done on a 14-‐day basis throughout the whole year, what results is an interesting and useful picture of the fluctuations of nitrate, temperature and precipitation.
Other water quality parameters
Microorganisms, such as bacteria originating from faecal matter, cause many water-‐related diseases. Therefore, bacteria are the most important parameters to identify the safety of drinking water. Water from unprotected and badly maintained sources is easily infected by microorganisms due to contamination with human and/or animal excreta. One gram of faecal material contains millions of bacteria and viruses! (See module B4 and B5)
Water from public wells and central water supplies should be analysed on a regular basis and the results should be made accessible for the public. The frequency of analyses depends on the amount of water supplied to the community. The appearance of microorganisms, such as Escherichia coli (E-‐coli) or Enterococci, should be known; otherwise an authorised laboratory should be requested for analysing the drinking water for microorganisms. Both are indicator bacteria for microbiological pollution: no E-‐coli or Enterococci at all should be found in 100 ml of drinking water (see also module B4).
3.5.2. Interviewing relevant persons- water and health authorities, consumers
The users of water systems often focus on problems or have different perceptions -‐ about, for example, water quality, or access to water -‐ compared to water suppliers. By using questionnaires or participatory approaches like ranking, an insight into the problems and experiences of the supplier and user can be obtained. First of all doctors, teachers and other key informants in the village can be asked about the occurrence of water-‐related diseases. A survey can be done among villagers about their perceptions of drinking water quality. The authorities should be asked for data on water analyses and about how public water supply systems are maintained (see some examples of questionnaires and guidance on conducting interviews in module A8.) After instruction from a teacher, pupils could conduct interviews.
3.5.3. Risk assessment by using sanitary checklists
For the risk assessment either of the danger of well/ground water pollution caused, for example, by animal manure or wastewater, or of the quality of the school toilets, checklists can be used. See several examples of sanitary forms and checklists, and information on how to use these forms, in module A7. The state of the well or tap and its surroundings should also be investigated. It might be asked if there is cover, or an apron around the pump or well etc.? After instructions and awareness-‐raising by the teacher, children can make their own observations, such as estimating the distances from manure heaps or pit latrines to the well, population density, or the location of the source of pollution (e.g. from uphill or downhill, from north or south of the water source.) Citizens living near wells should be interviewed about their practices of fertilising their fields. If flush toilets are used, how is the wastewater collected and treated? Is there any risk of spreading disease or contaminating water sources? In the case of dry toilets, how do households manage their latrine content? Is it emptied from time to time and discharged somewhere? Other sources of microbiological pollution, such as the tools used for extracting the water or for the storage of water in houses, should be observed and identified. A checklist adapted to the area and circumstances should be prepared. For sanitation, the children could do inspections of their school toilet and other public toilets, assessing their risks (see modules A7 and A8.) To better understand the background of sanitation and hygiene, modules C3 and C4 explain the links between WASH and health. An interactive exercise is part of C3, which illuminates the transmission of pathogens through hands and the need for hand-‐washing. The key challenge in working on sanitation and hygiene in comparison to water is the inherent taboo surrounding the topic. It is important to overcome this taboo and to start to openly discuss toilets and why pupils might not like to go to the school toilet. Who is responsible for the operation and maintenance of the toilet? Is the school director taking responsibility for the facilities? Citizens, medical and water administrations and doctors are important sources of information and should be interviewed about WASH and related health diseases.
Module C1 ____________________________________________________________________________
10 A WECF Compendium 2014
3.6. Step 6: Sharing information, mobilising community
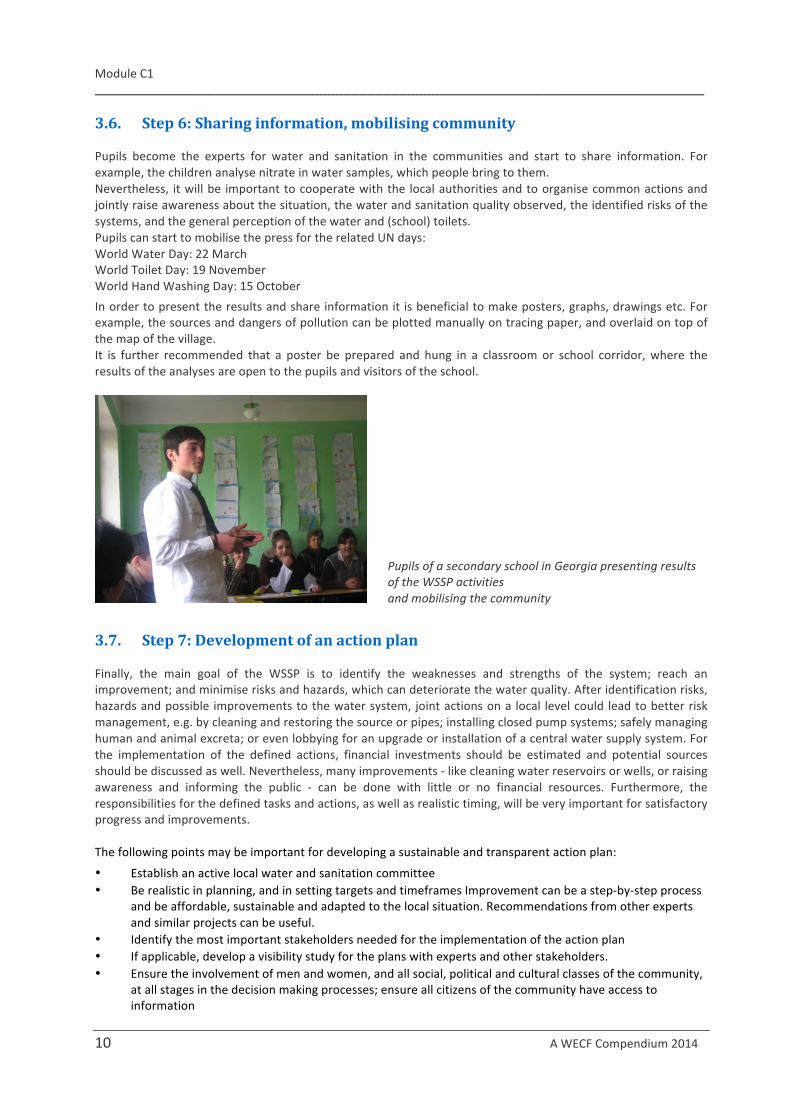
Pupils become the experts for water and sanitation in the communities and start to share information. For example, the children analyse nitrate in water samples, which people bring to them. Nevertheless, it will be important to cooperate with the local authorities and to organise common actions and jointly raise awareness about the situation, the water and sanitation quality observed, the identified risks of the systems, and the general perception of the water and (school) toilets. Pupils can start to mobilise the press for the related UN days: World Water Day: 22 March World Toilet Day: 19 November World Hand Washing Day: 15 October In order to present the results and share information it is beneficial to make posters, graphs, drawings etc. For example, the sources and dangers of pollution can be plotted manually on tracing paper, and overlaid on top of the map of the village. It is further recommended that a poster be prepared and hung in a classroom or school corridor, where the results of the analyses are open to the pupils and visitors of the school.
Pupils of a secondary school in Georgia presenting results of the WSSP activities and mobilising the community
3.7. Step 7: Development of an action plan
Finally, the main goal of the WSSP is to identify the weaknesses and strengths of the system; reach an improvement; and minimise risks and hazards, which can deteriorate the water quality. After identification risks, hazards and possible improvements to the water system, joint actions on a local level could lead to better risk management, e.g. by cleaning and restoring the source or pipes; installing closed pump systems; safely managing human and animal excreta; or even lobbying for an upgrade or installation of a central water supply system. For the implementation of the defined actions, financial investments should be estimated and potential sources should be discussed as well. Nevertheless, many improvements -‐ like cleaning water reservoirs or wells, or raising awareness and informing the public -‐ can be done with little or no financial resources. Furthermore, the responsibilities for the defined tasks and actions, as well as realistic timing, will be very important for satisfactory progress and improvements. The following points may be important for developing a sustainable and transparent action plan:
• Establish an active local water and sanitation committee • Be realistic in planning, and in setting targets and timeframes Improvement can be a step-‐by-‐step process
and be affordable, sustainable and adapted to the local situation. Recommendations from other experts and similar projects can be useful.
• Identify the most important stakeholders needed for the implementation of the action plan • If applicable, develop a visibility study for the plans with experts and other stakeholders. • Ensure the involvement of men and women, and all social, political and cultural classes of the community,
at all stages in the decision making processes; ensure all citizens of the community have access to information

Module C1 ____________________________________________________________________________
A WECF publication 2014 11
• Ensure the operation and maintenance of a planned installation by skilled staff and an adequate water protection policy
• Estimate potential financial sources for the implementation of the plans • Ensure a cost-‐covering operation and maintenance of the system • Use the results of the WSSP to lobby for financial support at local, regional and national levels; involve the
media
3.8. Step 8: Report and share the planned actions
A crucial part of the WSSP is the adequate documentation of the collected information and making the results and plans visible to all members of the community. The information collected on the water and sanitation systems and the improvements required should be objective and available made in reports, and, depending on the issue, the results can be made visible in graphs or maps. See also step 6 and Module A6. Furthermore, the WSSP team should document the agenda of meetings and decisions made, as well as the financial aspects of the implementation of the WSSP program. The WSSP program should be transparent and accessible to all.
Reporting the results, sharing and discussing information with all will increase the effectiveness of a WSSP
2.9. Step 9: Implementation of the action plan
The most crucial element of the WSSP is the implementation and effectiveness of the identified plans. Sometimes the measures will have an immediately visible effect -‐ for example, if the catchment area or well is cleaned -‐ but the effect on water quality may not be directly apparent. Such actions as increasing restrictions on human activities in the water protection zones may have their first measurable effects on water quality after 1 or even 3 years. Other measures -‐ for example the disinfection of water, or boiling it -‐ will have a direct effect on the safety of that water. Therefore, it is advisable to consider the effect of the planned measures and actions, and to rank and perform those actions with the highest priority and highest effectiveness in minimising health risks
2.10. Step 10: Monitor, improve or adjust the WSSP activities
To know the effectiveness of the measures and actions taken it is necessary to control and monitor their results, and to assess risks not only before, but also after, the implementation of the actions. This can, again, be done by water analyses, by observations and using sanitary inspection forms, etc. It is possible that certain actions will be successful, but others may be less so and might need to be adapted to new situations.
Therefore, the activities of the WSSP team should be made as part of a continuous process of monitoring, risks assessment, adaption of the situation and documenting and sharing information.

Module C1 ____________________________________________________________________________
12 A WECF Compendium 2014

1 2
3
Module C2
About Water Author: Friedemann Klimek
Summary This module consists of 3 parts: A. Water Properties B. Water Cycle C. Ground and Drinking Water Water is one of the most important and ubiquitous molecules on the surface of our planet and in living organisms. It has very specific properties which are responsible for its very broad utilisation in nature and our daily life. Life could not exist without water. A brief overview of some water properties (A. Water Properties) are presented to encourage observation of them in daily life. Associated experiments are also suggested. In lesson B. Water Cycle, local and global water cycles are generally distinguished. Regarding groundwater, specific aspects of regional and local conditions and climate characteristics are summarized. In lesson C. Ground and Drinking Water, the occurrence of different types of natural drinking water sources are presented. A few examples of springs in Bulgaria are given.
Objectives The pupils achieve physical and chemical background of water and carry out related experiments. They can describe important aspects of the water cycle and link these aspects to their own local water sources and water supply. They become more aware of the influence (changing) climate and varying weather conditions have on the local water supply. The pupils can distinguish between different types of natural drinking water sources, do experiments to see how soil cleans water and do first water tests to identify the water quality.
Key words and terms Density, freezing and melting point, specific heat capacity, polarity and solubility, pH, surface tension; water cycle, evaporation, condensation, precipitation, infiltration, storage, runoff, groundwater, surface water; soil structure, soil type, aquifer, groundwater, spring
Preparation/materials
Material Preparation
Little glass bottles (2), 2 plastic sticks Pupils should bring several water samples.
Freezer, thermometer, Bunsen burner (or hot water burner)
Model of water molecule
Salt, sugar, oil, soap, glasses, towels (or tissue)
Paper clips, screws, cork, ice cubes Ice cubes have to be prepared before.
Paper and pens for drawing, scissors
Charcoal (cotton wool), silt, gravel, big plastic bottles with a cap

Module C2 ___________________________________________________________________________
_________________________________________________________________________________________________________________
14 A WECF publication 2014
About Water A - Water Properties
Introduction
Do the pupils know about any living organism which can exist without needing water at least every now and then? Is there any flower that does not fade, any animal that does not die without water? Every species on earth, whether it is a big animal like an elephant or a small insect like a bee or an ant, depends on water. Human beings not only depend on water to survive but they consist of 60-‐70 % water. Water bodies are also important habitats for living creatures (e.g. sea, swamp, lakes and rivers). Water is a very important element in our daily life. We need water for the production of goods for (daily) consumption (clothes, food, etc.), transportation (rivers, sea, etc.) or recreation (swimming, skiing, ice-‐skating). Water is also essential for everyday activities like cooking, drinking and cleaning. Water is a very crucial element for life and especially for our wellbeing and prospering. To gain a deeper understanding of our drinking water’s vulnerability, it is helpful to know some of its properties. These properties are sometimes very astonishing (and at first glance more or less hidden) and show us an admirable, vibrant and vivacious element.
1. Water properties
Density
Water has an approximate density of 1 g/cm3 in its liquid state. However, this changes when water freezes. The volume expands during the phase transition from water to ice and so the density lowers to around 0,9 g/cm3. Therefore, ice seems to be “lighter” than water because it floats on the water surface. As the volume of water increases when freezing, it develops a huge power as well. For example, water pipes can burst during winter if not properly insulated.
States of matter
Our temperature scale of “degree centigrade” uses the freezing and boiling point of water for scaling. At both points water changes its state of matter. The graphic below names all the changes of water’s states of matter. Water is the only molecule on earth which shows all three states of matter in a natural environment.
Graph 1: Water – states of matter.
Source: http://en.wikipedia.org/wiki/State_of_matter

Module C2 ___________________________________________________________________________
_________________________________________________________________________________________________________________
A WECF publication 2014 15
Specific heat capacity
Water has a very high specific heat capacity (4,186 kJ/ kg*K) in comparison to a lot of other materials like metals (e.g. steal 0,477 kJ/ kg*K) or other liquids (e.g. oil 1,67 kJ/ kg*K). Water needs – as it can store much more energy – a lot of energy to get heated. In return it keeps this energy and slowly cools down. Therefore, large water bodies can serve as a local energy reservoir and we can use water for heating (hot water bottle). The Black Sea works as a large heating source in winter (higher temperatures at the coast of the Black Sea than in the inland).
Polarity/Solubility
Water has a molecular structure with a positive and a negative part (see graphic). This property is responsible for the solubility or insolubility of other substances in water. Polar molecules like sugar, salt and ethanol can easily be dissolved in water. Oil is nearly insoluble and floats as a thin layer on the water surface. However, if we use soap or a similar detergent we can “dissolve” substances like oil or fat.
Model of a water molecule. Source: www.uni-‐duesseldorf.de
Surface tension
The above mentioned polarity of water molecules causes strong forces between them. The forces between molecules (surface tension) cause also the curve (meniscus) in the surface of a liquid close to the surface of a glass or other object. The meniscus of oil is different than the meniscus of water. The forces between the water molecules are lower than between water and the glass, and the forces between oil molecules are higher than between oil and the glass. In the illustration below, water and oil shows the effect of building respectively a concave and convex meniscus when poured into a glass. Intermolecular forces are also responsible for water-‐building drops. In the nature and daily life we can see effects of the surface tension liquids. For example some animals can “walk” on the water surface (e.g. water strider). The addition of some drops of a detergent interrupts the strong connection between the water molecules and destroys the surface tension.
Surface tension of different liquids (water and oil)
pH
pH is a measure that describes how acid or alkaline the (watery) environment is. It ranges from 1 (very acid) to 7 (neutral) to 14 (very alkaline). For many biological and chemical processes, a specific pH is important. If it differs too much from the optimum for a specific reaction, the process will not work. For example, our stomach needs a pH of around 1 (which is provided by the stomach acid) to digest food properly.

Module C2 ___________________________________________________________________________
_________________________________________________________________________________________________________________
16 A WECF publication 2014
2. Exercises and activities
Let the pupils describe which results they expect from the following experiments, why they expect them and what they observed doing the experiments:
Density
• Different materials (screws, cork, wood, ice) show different behaviour when put into a container with water. They float or sink in water depending on their density.
• Freezing water in a small glass bottle. The bottle will be cracked when ice is formed and expands. Fill 2 glass bottles with water and close it with a cap. Put them into the freezer. Next time when taking the bottles out (after a few hours) they should be broken.
States of matter
• Where can we find the different states of matter (water, ice, steam) in our natural (or artificial) environment?
Polarity/Solubility • Show with an electrostatic chargeable material like plastic sticks ( e.g. 2 plastic pens, or wool) that flowing
water (tap) can be deflected by electric voltage. • Solubility of different materials: salt, sugar, oil. What happens if soap is used? Surface tension
• What does the surface look like when water is filled into a thin, flat bottomed flask? • Children stand together and each child takes the hands of two other children (no row!) This should
demonstrate the forces between the water molecules and that they tend to built “round” structures e.g. a meniscus (or drop). An object (e.g. book, glass) that each child should hold in one hand (in the other one still holding a hand of another child) demonstrates the effect of a detergent to lessen the surface tension.
• A paper clip can float on the water surface. If the children are not able to put the clip carefully on the water surface they can use some absorbent paper. The addition of some drops of detergents will destroy the surface tension and the clip will sink to the ground.
pH
Measurement of pH of different liquids: Vinegar, soap, Cola, rainwater, mineral water, drinking water, orange, apple
General questions
• A person weights 100kg. How much of him/her is water? • In which states of matter does water exist? • At which temperature does water freeze and boil? • At which temperature does sea water freeze and boil?
WSP related activities • If you think of your home environment, in which situations do you come into contact with different
states of water matter? • In which months of the year is the soil in your environment probably frozen? Does the weather
influence the groundwater quality or quantity in your community?
3. Text sources and further reading
Water Science for Schools, U.S. Geological Survey (USGS), (2012). Available from http://ga.water.usgs.gov/edu/ Water Structure and Science, (2012). Available from http://www.lsbu.ac.uk/water/

Module C2 ___________________________________________________________________________
_________________________________________________________________________________________________________________
A WECF publication 2014 17
B - Water Cycle
4. Water cycle - global
The water cycle starts in the ocean because it is the largest water reservoir on earth. It covers 71% of the earth's surface. Solar energy heats the water, particularly in the tropics. Through evaporation, especially at the sea surface and to a lesser extent also on the mainland, humidity is created. Because this vaporised water is lighter than air, it rises into the atmosphere. In higher altitudes, the air cools down and the water vapour condenses. This creates clouds. The wind transports the moist air and clouds to the mainland.
When humid air meets cold air layers, it is lifted (warm front); it is also lifting when it meets mountain flanks (convection). When air rises, it cools down. Cold air can hold less moisture than warm air can. If the clouds are already saturated with condensed water to a certain extent, precipitation occurs and the water falls to the ground as rain, snow or hail. The form of precipitation depends on the local temperature. When the water falls to the ground, it can infiltrate the soil and seep into the groundwater layer, or it can flow on the surface directly into the next creek or river.
Via a spring or well, the groundwater reaches the surface again and flows through a river system back into the ocean. In the polar-‐regions and high mountain ranges, a part of the precipitation is stored in solid form as ice or snow, where it could pass through as melted water into the ocean again (Figure 1).
Figure 1: Water cycle Source: http://library.thinkquest.org
5. Water cycle – local
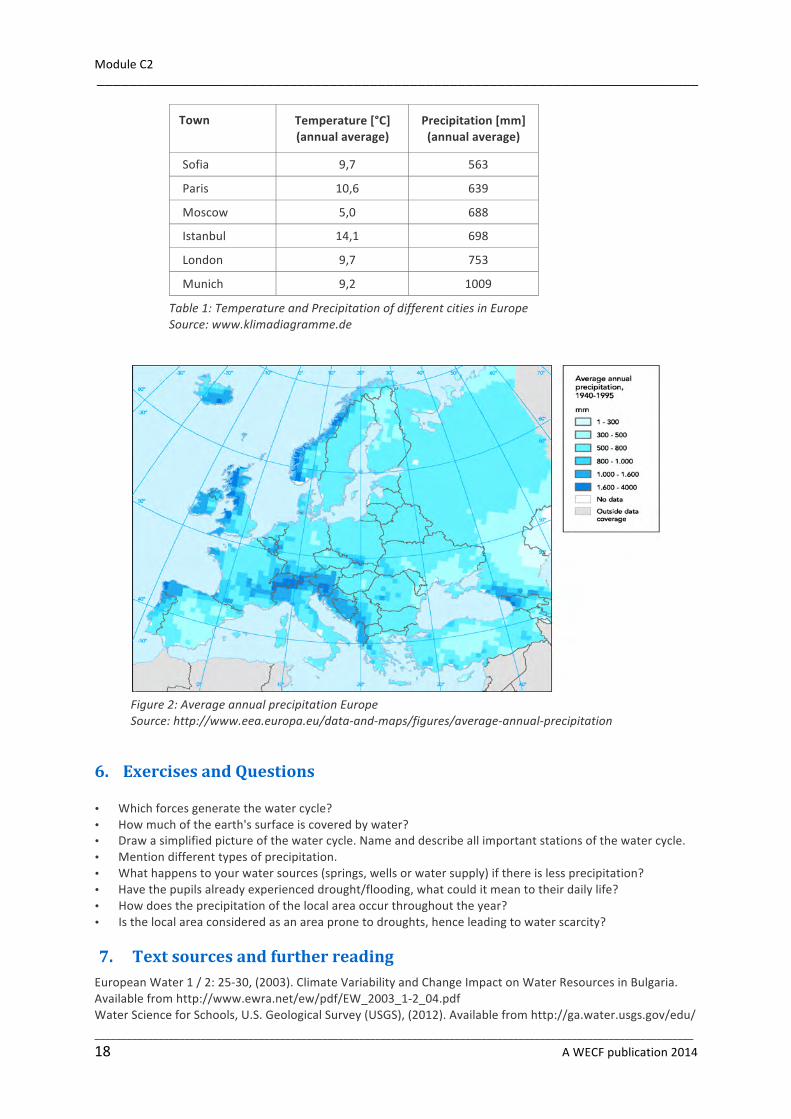
The local water cycle depends on geographical aspects like latitude, distance to the sea, main wind direction, temperature profile (on a yearly basis) and topography. Please see annual average temperature and precipitation in some European cities (Table 1 and Figure 2).
Module C2 ___________________________________________________________________________
_________________________________________________________________________________________________________________
18 A WECF publication 2014
Town Temperature [°C] (annual average)
Precipitation [mm] (annual average)
Sofia 9,7 563
Paris 10,6 639
Moscow 5,0 688
Istanbul 14,1 698
London 9,7 753
Munich 9,2 1009
Table 1: Temperature and Precipitation of different cities in Europe Source: www.klimadiagramme.de
Figure 2: Average annual precipitation Europe Source: http://www.eea.europa.eu/data-‐and-‐maps/figures/average-‐annual-‐precipitation
6. Exercises and Questions
• Which forces generate the water cycle? • How much of the earth's surface is covered by water? • Draw a simplified picture of the water cycle. Name and describe all important stations of the water cycle. • Mention different types of precipitation. • What happens to your water sources (springs, wells or water supply) if there is less precipitation? • Have the pupils already experienced drought/flooding, what could it mean to their daily life? • How does the precipitation of the local area occur throughout the year? • Is the local area considered as an area prone to droughts, hence leading to water scarcity?
7. Text sources and further reading European Water 1 / 2: 25-‐30, (2003). Climate Variability and Change Impact on Water Resources in Bulgaria. Available from http://www.ewra.net/ew/pdf/EW_2003_1-‐2_04.pdf Water Science for Schools, U.S. Geological Survey (USGS), (2012). Available from http://ga.water.usgs.gov/edu/

Module C2 ___________________________________________________________________________
_________________________________________________________________________________________________________________
A WECF publication 2014 19
C- Ground and Drinking Water
8. Groundwater
The following text describes the flow of water, starting from the point where it soaks into the soil to the point where it appears on the earth's surface; e.g. a spring or in a well. Groundwater, as mentioned in module 3B (water cycle), is generated by precipitation infiltrating (rainfall, snow) into the soil. Gravity forces water to seep deeper and deeper through the soil and move through the groundwater system where it eventually makes its way back to the surface.
Soil is – simply put – a mixture of bedrock, clay, silt, organic material, air, water and many different organisms. It also has many different layers (Figure 1). There is a large variety of different soil types and each one has unique characteristics, including its colour, texture, structure, depth and minerals. The composition and depth of the soil influences the compounds of the groundwater. There is an intense exchange of substances between water and soil components resulting in, for example, mineral-‐rich or mineral-‐poor water with different hardness’s. Soil can act as a filter and can absorb substances like minerals (fertiliser), pesticides or acids. As water passes through the soil it can take up beneficial substances, like minerals, but also harmful substances such as arsenic, nitrate or pesticides.
As water seeps deeper, it sometimes encounters an impermeable layer. It flows horizontally along this layer filling all the cracks, crevices and pores like a sponge. This water-‐filled layer is called an aquifer. When the aquifer water returns back to the surface, the groundwater forms a spring.
Depending on the local geographical conditions, there are different types of springs and aquifers which require different technical devices to extract water from the ground. An interesting type of spring or well is the artesian well. It is a well in geographical depression where the groundwater is exposed to a certain pressure. This pressure is high enough that the water comes to the surface without pumping (Figure 2). The depth of groundwater can vary and can reach hundreds of metres deep into the earth. Another term for groundwater is aquifer, however, this term is usually used to describe water-‐bearing formations capable of providing enough water for people’s needs (industry). Often the different layers of aquifers structure the ground deep in the earth. Usually, the deeper the groundwater reaches, the more protected the water is. The different layers in the ground enhance the filter effect by purifying the water, as mentioned above, by soil. Aquifers near the surface are prone to pollution. Severe pollution of groundwater is mostly caused by man. Thus, the protection of water is essential (see module B6 for information on water protection). The recharge of local springs depends largely on the local geology and climate. As aquifers store only a certain amount of water, the local water supply depends largely on the precipitation received in past weeks or months. If there is less precipitation and/or higher temperatures, the wells and springs could dry up.
Figure 1: soil layers

Module C2 ___________________________________________________________________________
_________________________________________________________________________________________________________________
20 A WECF publication 2014
9. Drinking Water
According to the Protocol on Water and Health of UNECE and WHO “Drinking water means water which is used, or intended to be available for use, by humans for drinking, cooking, food preparation, personal hygiene or similar purposes,” drinking water or potable water is water of sufficiently high quality that it can be consumed or used especially for drinking and cooking with low risk of immediate or long-‐term harm. It has to be very pure. There can be various sources of drinking water depending on local conditions. Drinking water can originate from groundwater (springs, wells), surface water (rivers, lakes, reservoirs, sea), rainwater or even mist. The usage of surface water can be necessary if local groundwater is scarce or inexplorable. Surface water is much more vulnerable to contamination by anthropogenic and natural activities and should always be analysed and treated adequately. Though 71% of our planet is covered in water, only a fraction can be used as drinking water (Table 1).
Water volume [km³] Percentage [%]
Total 1,384,120,000 100.00
Saltwater (sea) 1,348,000.000 97.39
Freshwater (total) 36,020,000 100 2.60
Freshwater
Water in polar ice, sea ice, glaciers 27,820,000 77.23 2.01
Groundwater, soil moisture 8,062,000 22.38 0.58
Water in rivers and lakes 127,000 0.35 0.01
Water in the atmosphere 13,000 0.04 0.001
Table 1: Water volume of the earth Source: Marcinek & Rosenkranz 1996, Data according to Baumgartner und Reichel 1975; bfw.ac.at/300/pdf/globaler_wasserkreislauf.pdf
Figure 2: Aquifers and wells
Source: http://www.douglas.co.us/water/What_is_an_Aquifer$q.html

Module C2 ___________________________________________________________________________
_________________________________________________________________________________________________________________
A WECF publication 2014 21
Only 1 % of all freshwater can be used as drinking water! This is an equivalent of 0.0026 % of the total water volume!
To make this a little bit more quantifiable here is a comparison: If a bath tub is full of water (150 l) and this stands for the whole water reservoir of our world, then roughly 4.2 l (½ bucket) are freshwater and of these • 3.2 l are ice (poles and glaciers), • 1 l is groundwater and only • 0.02 l (a brandy glass) are surface water bodies (lakes, rivers), • 0.004 l (a thimble!!) are theoretically usable as drinking water.
10. Experiment
Build your own water filter
• Cut the bottom of the plastic bottle. Turn it around (the cap is now at the bottom), put charcoal in first, then silt and add some gravel at the top.
• Create some “dirty water” (soil + water and stir it) • Remove the cap of the bottle and place the bottle on a glass. Fill some of the dirty water into the bottle
which is now the filter and see what happens. What does the dripping water look like? • Fill one bottle with pure garden soil and one with clay as explained above. Put some water on the top of
the soils and observe what happens. Try to explain why.
WSSP related activities
• Which types of water sources are found in the local environment? • In which geographical situation is the local area situated? • Which soil layers are found and how do they protect the water? • Which source is the drinking water taken from? How deep is the source?
11. Text sources and further reading
UNECE, WHO (2000). Protocol on Water and Health. Available from http://www.unece.org/fileadmin/DAM/env/documents/2000/wat/mp.wat.2000.1.e.pdf
UN-‐Statistics Water Resources, (2012). Available from http://www.unwater.org/statistics_res.html
Nelson, Stephen A., Tulane University, (2011). Groundwater. Available from http://www.tulane.edu/~sanelson/geol111/groundwater.htm

Module C2 ___________________________________________________________________________
_________________________________________________________________________________________________________________
22 A WECF publication 2014

Module C3
Hand Washing Authors: Diana Iskreva, Claudia Wendland
Summary Hand washing with clean water and soap is the single most effective technique to protect public and individual health. It can prevent distribution of diseases like flu, diarrhoea, hepatitis A, cholera, and etc. Worldwide each year 1.5 million children die from diarrhoea. Hand washing with soap could reduce child deaths from diarrhoea by 44%. In this module, the relation between water, wastewater, hygiene and human health is discussed connecting new information with information of previous modules. Some historical data about WASH are given as well.
Objectives The pupils are informed about the importance of hand washing in order to prevent a number of health risks they might face in their every day life; they are encouraged to create the habit of hand washing; and furthermore, to inform the community and in particular schools about the importance of hand washing and its role to prevent diseases.
Keywords and terms Hand washing, faecal-‐oral mechanism, private hygiene, public health, pathogens
Preparation/materials
Material Preparation
Sink, water, soap, towel Check that soap and a towel are there
Paper and pens for drawing
“Gltterbug“ potion, “Glitterbug” powder To be ordered at http://www.handhygieneeurope.com
UV lamp Can be bought/ordered anyway
Module B2 ___________________________________________________________________________
_________________________________________________________________________________________________________________
24 A WECF publication 2014
Hand Washing 1. Hand-washing: the most important component of personal hygiene
Hands must always be washed at so called critical times, especially after visiting the toilet, before processing food or drinks, and before putting anything into your mouth in order to prevent the potential transmission of diseases. Hand washing is the most important component of personal hygiene for the prevention of public and personal health. Hands are washed with clean water and soap. Hands are first wetted with water, soaped and then intensively brushed. At the end they have to be rinsed with clean water. If absolutely clean material for drying is missing, it is better leave the hands dry by themselves. In case dirty material is used to dry the hands, hand washing does not have any positive effect.
Be aware of the fact that dirty computer keyboards, door handles, and etc. might contain more microorganisms than a toilet ring of a well-‐maintained toilet.
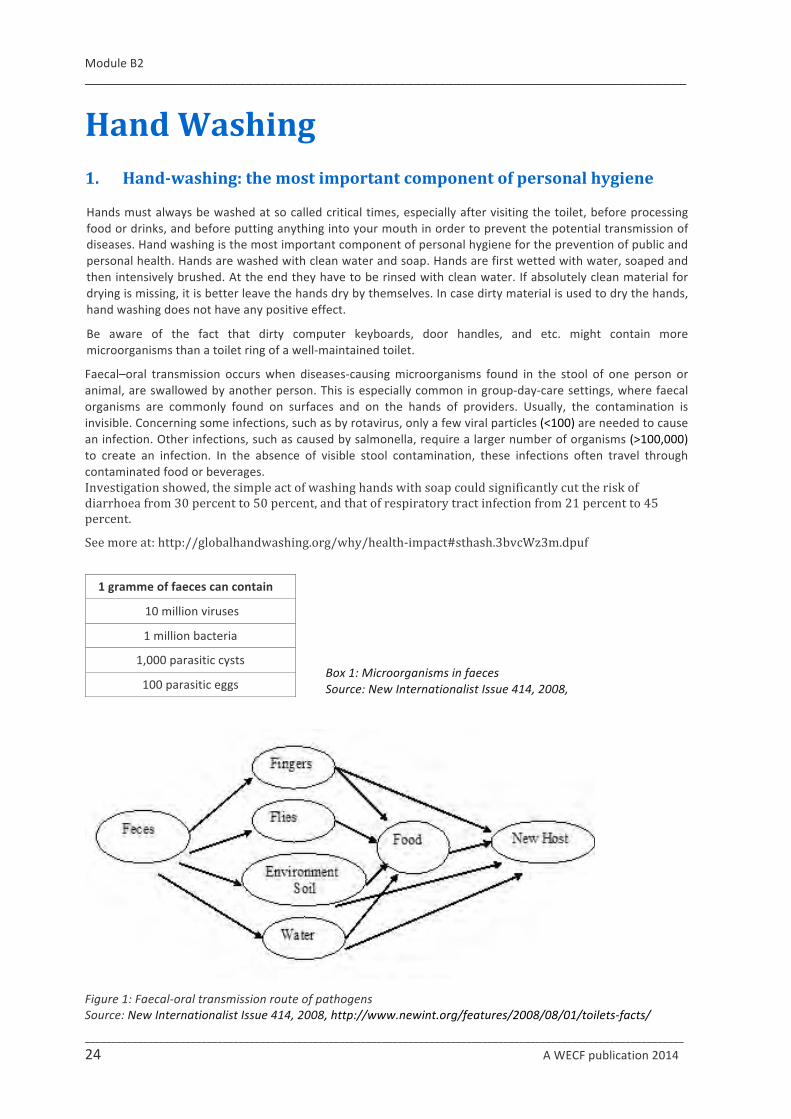
Faecal–oral transmission occurs when diseases-‐causing microorganisms found in the stool of one person or animal, are swallowed by another person. This is especially common in group-‐day-‐care settings, where faecal organisms are commonly found on surfaces and on the hands of providers. Usually, the contamination is invisible. Concerning some infections, such as by rotavirus, only a few viral particles (<100) are needed to cause an infection. Other infections, such as caused by salmonella, require a larger number of organisms (>100,000) to create an infection. In the absence of visible stool contamination, these infections often travel through contaminated food or beverages. Investigation showed, the simple act of washing hands with soap could significantly cut the risk of diarrhoea from 30 percent to 50 percent, and that of respiratory tract infection from 21 percent to 45 percent.
See more at: http://globalhandwashing.org/why/health-‐impact#sthash.3bvcWz3m.dpuf
1 gramme of faeces can contain
10 million viruses
1 million bacteria
1,000 parasitic cysts
100 parasitic eggs
Box 1: Microorganisms in faeces Source: New Internationalist Issue 414, 2008,
Figure 1: Faecal-‐oral transmission route of pathogens Source: New Internationalist Issue 414, 2008, http://www.newint.org/features/2008/08/01/toilets-‐facts/
Module B2 ___________________________________________________________________________
_________________________________________________________________________________________________________________
A WECF publication 2014 25
Many common infections spread through faecal–oral transmission include diarrhoeal diseases, Cholera, Thyphoid fever, Coxsackievirus (hand-‐foot-‐mouth disease) and helminth infestions. Pathogens that can be found to cause this diseases are (exemplary): Adenovirus, Campylobacter, Enteroviruses, E. coli, Giardia lamblia, Hepatitis A, Pinworms, Poliovirus, Rotavirus, Salmonella, Shigella, Tapeworms, Toxoplasma.
Well-‐known epidemics are, for example, E. coli in Germany (2011), Hepatitis A (Bulgaria, 2010), the Plague in Europe in the Middle Ages.
2. Importance of eating clean food, drinking clean water and using clean water for bathing
Swimming pools and water parks can also be places where faecal–oral transmission of diseases occur. If the water is not visibly contaminated and is adequately chlorinated, getting water in the mouth is usually not enough to cause an infection; the risk is greatly increased by swallowing. Never swallow water in sea/rivers/pools and water-‐play areas or from irrigation pumps.
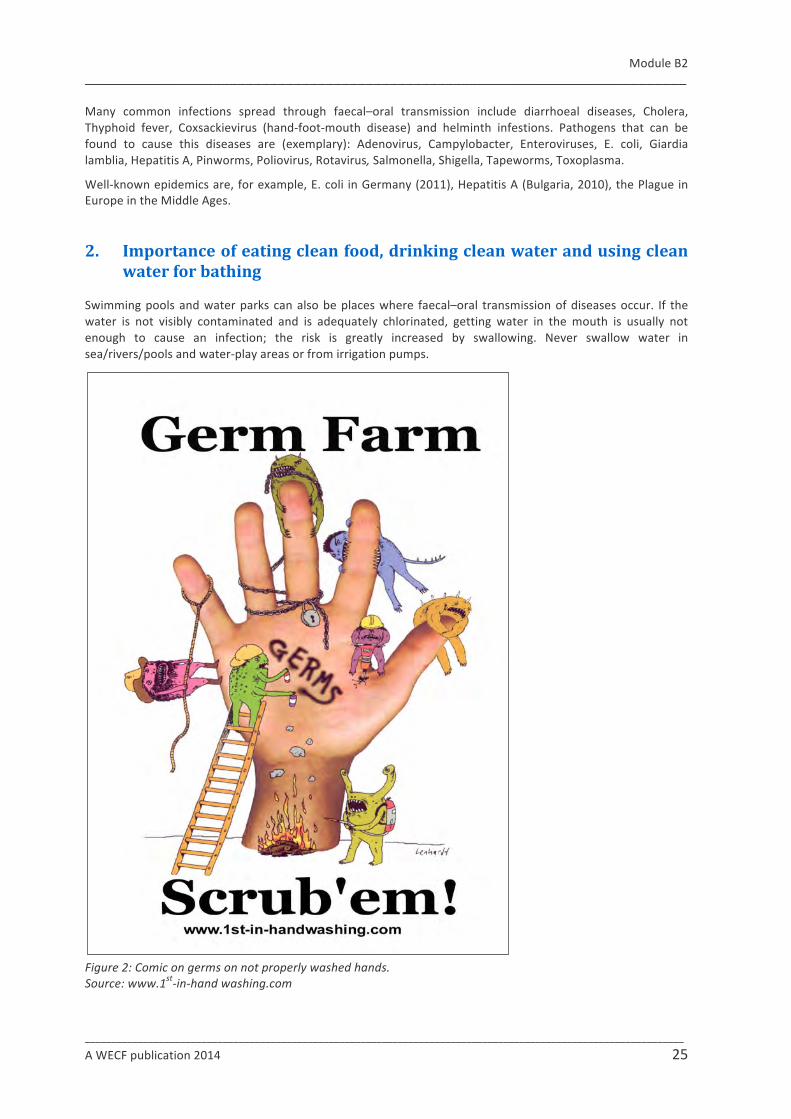
Figure 2: Comic on germs on not properly washed hands. Source: www.1st-‐in-‐hand washing.com
Module B2 ___________________________________________________________________________
_________________________________________________________________________________________________________________
26 A WECF publication 2014
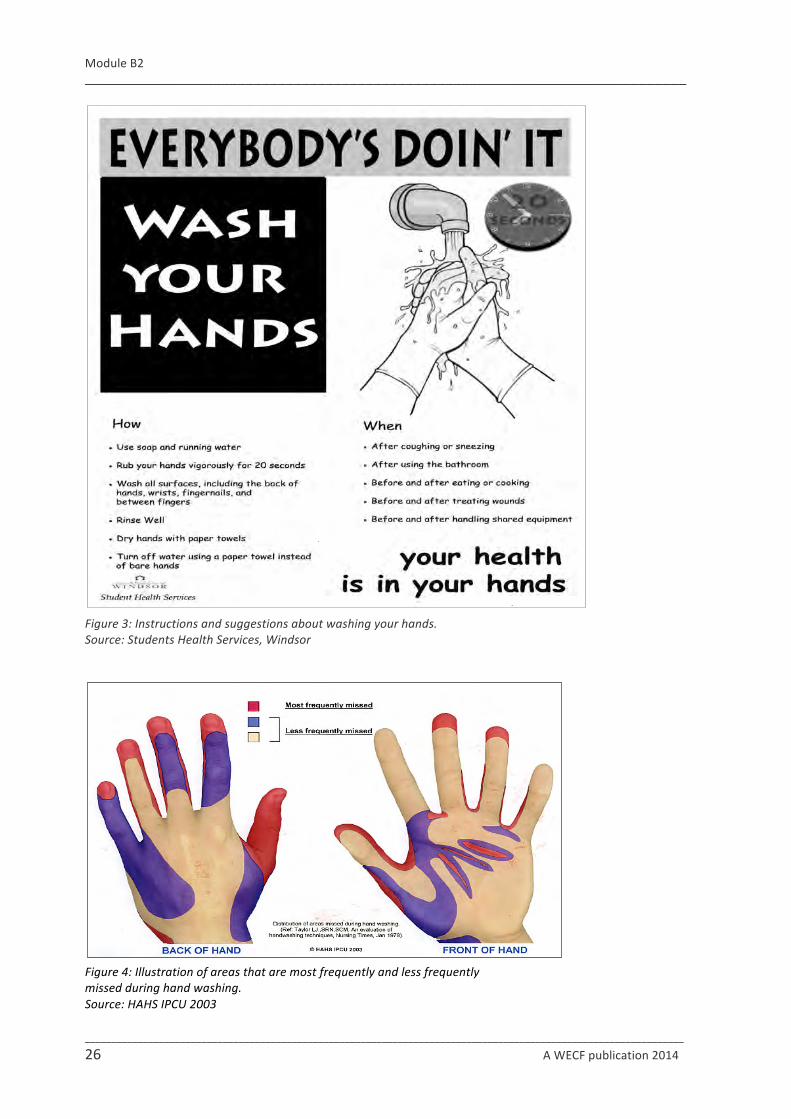
Figure 3: Instructions and suggestions about washing your hands. Source: Students Health Services, Windsor
Figure 4: Illustration of areas that are most frequently and less frequently missed during hand washing. Source: HAHS IPCU 2003

Module B2 ___________________________________________________________________________
_________________________________________________________________________________________________________________
A WECF publication 2014 27
Figure 5: Illustration how to wash properly Source: http://www.handhygieneeurope.com
3. Exercises and Questions
• What does the abbreviation WASH stand for? • Take the children to the hand washing facility in the school and show them all the steps of correct hand
washing. Pictures above (Figure 2, 3, 4 and 5) can be copied and hung up in the room and used as a basis for further discussions.
• Meet an expert from the community who will demonstrate how to prepare homemade soap. • Discuss the importance of safe water for human health. In which situations is safe water essential, and why
is hand washing so important? • Explain what is meant by the faecal-‐oral transmission of pathogens. • How many bacteria, viruses, pathogenic cysts and eggs can be found approximately in 1 gramme of faeces? • A questionnaire could be prepared together with the pupils, including the following questions:
- When is Global Hand Washing day? - Why is hand washing important? - Describe the correct hand washing technique. - Which diseases are prevented by hand washing? - How many pathogens may be found on hands after using toilet? - What does the faecal-‐oral mechanism explain? Make a drawing of it. - What is the most important practice to prevent hepatitis A? - How many children approximately die of diarrhoea each year in the world?

Module B2 ___________________________________________________________________________
_________________________________________________________________________________________________________________
28 A WECF publication 2014
- What is the importance of soap? - When is it critical to wash hands? - How important is it to use clean bathing water? - Parents and other persons from the community could be invited to the presentation of the results
where gained knowledge is also demonstrated. By this, the pupils contribute to the awareness raised on this topic.
Interactive hand washing exercise
You need the “glitterbug” potion and powder and a UV lamp. The potion and the powder represent pathogenic bacteria. You give some potion and powder to a pupil who is supposed to apply it on his/her hands. Then the pupils should give a hand to another pupil and touch it somewhere. Then she/he washes her hands like she/he always washes her/his hands. With the UV lamp, you can detect where the bacteria have been spread and if the pupil has washed her hands well. It will only glow when not washed properly or touched any surface which has not been cleaned.
WSP related activities • Discuss if schools and other public institutions provide appropriate facilities for hand washing. • Discuss where in the local environment pathogens are more likely to spread. What are the reasons for
this and how could the situation be improved? • Which actions could the participants take in order to raise awareness about the importance of hand
washing?
4. Reference and Further reading
To order “glitterbug” material: Hand Hygiene Europe http://www.handhygieneeurope.com
Hygiene expert, (2010) Hand Washing. Available from http://www.hygieneexpert.co.uk/hand-‐washing.html
New Internationalist Issue 414, (2008). Toilets -‐ The Facts. Available from http://www.newint.org/features/2008/08/01/toilets-‐facts/
UNICEF, (2008). Water, Sanitation and Hygiene, Hygiene promotion. Available from http://www.unicef.org/wash/index_43107.html
UNICEF. Fast Facts and Figures About hand washing. Available from http://www.unicef.org/india/reallives_6533.htm
UNICEF, (2011), Global Handwashing Day October 15. Available from http://www.globalhand washingday.org/
Water Supply and Sanitation Collaborative Council (WSSCC), (2012). Water Supply and Sanitation. Available from http://www.wsscc.org/
WHO, (2008). Global Handwashing Day. Available from www.who.int/gpsc/events/2008/Global_Handwashing_Day_Planners_Guide.pdf
UNICEF, (2012). State of the World’s Children. Available from http://www.unicef.org/sowc/index_61804.html
Module C4 ___________________________________________________________________________
29 A WECF publication 2014
Module C4
Sanitation in Schools Authors: Claudia Wendland, Diana Iskreva
Summary WASH in schools comprises safe water, sustainable sanitation and hygienic behaviour in schools. Many schools, particularly in rural areas, lack adequate drinking water, sanitation and hand washing facilities, which pose a risk to public health. The ability of children to learn can be affected by lack of adequate WASH conditions in different ways: these include diarrhoeal diseases and helminth infections.
Different types of toilets are explained as flush toilets and pit latrines are not the only technological solutions. The key criteria for acceptance of school toilets by pupils are cleanliness, lack of bad smell and privacy.
It is well known that operation and maintenance are a challenge in any school even if the infrastructure is adequate. That is why in this module, awareness is raised about the importance of especially sanitation in schools, suitable solutions, and in which way to take action.
Objectives The pupils understand the importance of WASH in schools, the linkage to health and environment, how to break the taboo and talk about school sanitation and discuss related problems. The reader knows how to start an action to improve the WASH situation at their school if needed.
Keywords and terms WASH, school sanitation, hygiene, public health, pathogens
Preparation
Create a good and open atmosphere: Sanitation in schools is very important but at first glance not a very attractive topic. It is a taboo to talk about toilets for many people and pupils as well. That is why it is very important to create a very good and open atmosphere so that pupils will feel free to openly talk about their opinion and attitudes in order to reach useful results in this module.
Mod
ule
4
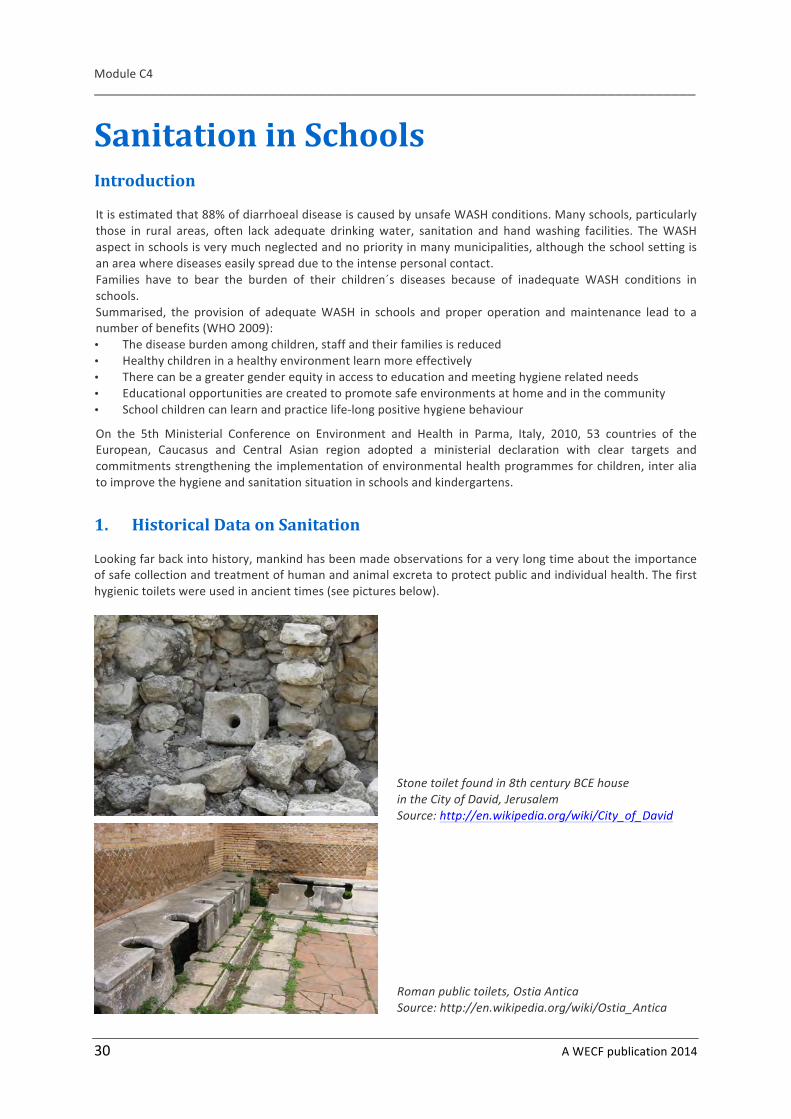
Module C4 ___________________________________________________________________________
30 A WECF publication 2014
Sanitation in Schools Introduction
It is estimated that 88% of diarrhoeal disease is caused by unsafe WASH conditions. Many schools, particularly those in rural areas, often lack adequate drinking water, sanitation and hand washing facilities. The WASH aspect in schools is very much neglected and no priority in many municipalities, although the school setting is an area where diseases easily spread due to the intense personal contact. Families have to bear the burden of their children´s diseases because of inadequate WASH conditions in schools. Summarised, the provision of adequate WASH in schools and proper operation and maintenance lead to a number of benefits (WHO 2009): • The disease burden among children, staff and their families is reduced • Healthy children in a healthy environment learn more effectively • There can be a greater gender equity in access to education and meeting hygiene related needs • Educational opportunities are created to promote safe environments at home and in the community • School children can learn and practice life-‐long positive hygiene behaviour
On the 5th Ministerial Conference on Environment and Health in Parma, Italy, 2010, 53 countries of the European, Caucasus and Central Asian region adopted a ministerial declaration with clear targets and commitments strengthening the implementation of environmental health programmes for children, inter alia to improve the hygiene and sanitation situation in schools and kindergartens.
1. Historical Data on Sanitation
Looking far back into history, mankind has been made observations for a very long time about the importance of safe collection and treatment of human and animal excreta to protect public and individual health. The first hygienic toilets were used in ancient times (see pictures below).
Stone toilet found in 8th century BCE house in the City of David, Jerusalem Source: http://en.wikipedia.org/wiki/City_of_David
Roman public toilets, Ostia Antica Source: http://en.wikipedia.org/wiki/Ostia_Antica

Module C4 ___________________________________________________________________________
A WECF publication 2014 31
We can learn about the importance of toilets and health-‐behaviour, for example, from museums about toilets, like in India and Germany. It might be interesting for you to know that the most sophisticated toilet was built for spaceships. The spacecraft Soyuz had an on-‐board toilet facility since its introduction in 1967. In 2008 Russia sold the technology to NASA for their International Space Station for 19 million USD. The system recycles urine into water. In some countries there are very strict rules that prescribe specific behaviour for the protection of public and private health. In India, the left hand is the dirty hand, and the right hand is the clean hand. In Japan, it is strictly forbidden to sneeze and clean your nose in public, and hands have to be washed immediately after.
2. Different types of toilets
2.1. Water flush toilets
Flush toilet: The standard toilet is the flush toilet, flushed with different volumes of flush water. Common toilets use up to 10 liter per flush, but new water saving toilets use only 3-‐5 liter. Toilets, which use less water -‐only 1 l per flush, are vacuum systems, which you might know from the airplane or a modern train.
Vacuum toilet using one liter per flush
There are many people, also water professionals, who criticise the fact that people flush their excrements with high quality drinking water, which needs high efforts to treat the wastewater afterwards to discharge it into the environment. That is why there is some development towards modern waterless or dry toilets. See for more information in detail in module B5.
2.2. Pit latrines
You might know the traditional pit latrines, which do not use any water for flushing. They are applied in areas where there is no reliable water supply and are usually located far away in the garden, because they often smell badly. They are difficult to keep hygienic and might pollute the groundwater with excreta substances in case of high groundwater level because the excreta are not collected and treated.

Module C4 ___________________________________________________________________________
32 A WECF publication 2014
Traditional pit latrine
2.3. Composting toilets
A composting toilet does not use any flush water. It is a dry toilet system where the human excreta are biologically decomposed by aerobic compost bacteria. The human excreta are commonly mixed with sawdust or wood shavings to support the biological aerobic processing, absorb liquids and to reduce the odor. Therefore the toilets can also be placed indoor. Composting toilets are used as an alternative to flush toilets in settings where there is no reliable water supply or a waste treatment facility available or to capture nutrients in human excreta. The produced compost can be used for gardening or agriculture.
Composting toilet in Finland (Photo Kati Hinkkanen)
2.3. Urine diverting toilets
Modern toilets have been developed with urine diversion so that the urine and faecal matter can be collected separately. There are also dry toilets with urine diversion, which ensures that the toilet does not smell and can also be implemented indoors (in contrast to a pit latrine). Instead of using water for flushing, these toilets are “flushed” with dry material such as ash, soil or shredded wood to prevent odor. Urine contains high concentrations of nutrients such as Nitrogen and Phosphorus and can serve as fertilizer in agriculture. The faecal matter is collected underneath the toilet in a chamber, stored and post-‐composted afterwards. Since 2002 many demonstration models for modern sustainable dry sanitation such as urine diverting dry toilets (UDDT or Ecosan) were constructed for households, schools and town halls in the pan European countries. The UDDTs were introduced in particular in regions were centralised piped water and/or sewerage systems were lacking. For households mostly seat models, for public places squatting models are used. The WHO guidelines on safe use of human excreta in agriculture (2006) are applied for the treatment and safe re-‐use of the separated urine and faecal matter.
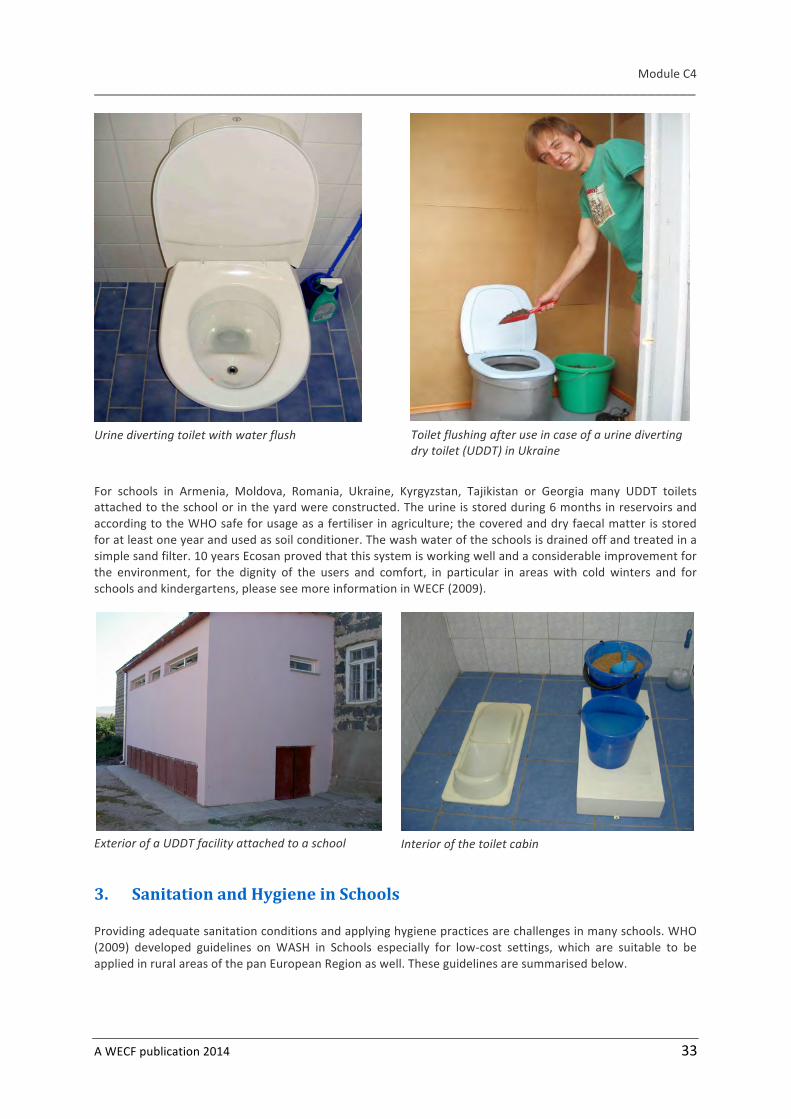
Module C4 ___________________________________________________________________________
A WECF publication 2014 33
Urine diverting toilet with water flush
Toilet flushing after use in case of a urine diverting dry toilet (UDDT) in Ukraine
For schools in Armenia, Moldova, Romania, Ukraine, Kyrgyzstan, Tajikistan or Georgia many UDDT toilets attached to the school or in the yard were constructed. The urine is stored during 6 months in reservoirs and according to the WHO safe for usage as a fertiliser in agriculture; the covered and dry faecal matter is stored for at least one year and used as soil conditioner. The wash water of the schools is drained off and treated in a simple sand filter. 10 years Ecosan proved that this system is working well and a considerable improvement for the environment, for the dignity of the users and comfort, in particular in areas with cold winters and for schools and kindergartens, please see more information in WECF (2009).
Exterior of a UDDT facility attached to a school
Interior of the toilet cabin
3. Sanitation and Hygiene in Schools
Providing adequate sanitation conditions and applying hygiene practices are challenges in many schools. WHO (2009) developed guidelines on WASH in Schools especially for low-‐cost settings, which are suitable to be applied in rural areas of the pan European Region as well. These guidelines are summarised below.
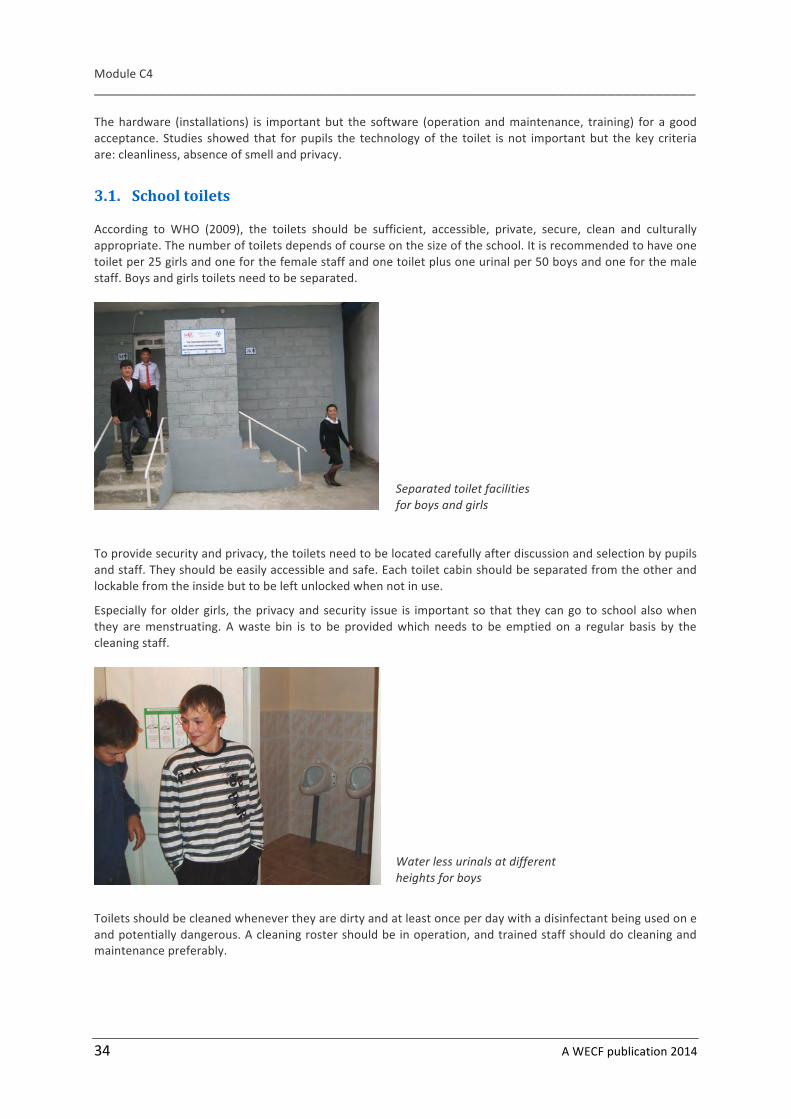
Module C4 ___________________________________________________________________________
34 A WECF publication 2014
The hardware (installations) is important but the software (operation and maintenance, training) for a good acceptance. Studies showed that for pupils the technology of the toilet is not important but the key criteria are: cleanliness, absence of smell and privacy.
3.1. School toilets
According to WHO (2009), the toilets should be sufficient, accessible, private, secure, clean and culturally appropriate. The number of toilets depends of course on the size of the school. It is recommended to have one toilet per 25 girls and one for the female staff and one toilet plus one urinal per 50 boys and one for the male staff. Boys and girls toilets need to be separated.
Separated toilet facilities for boys and girls
To provide security and privacy, the toilets need to be located carefully after discussion and selection by pupils and staff. They should be easily accessible and safe. Each toilet cabin should be separated from the other and lockable from the inside but to be left unlocked when not in use.
Especially for older girls, the privacy and security issue is important so that they can go to school also when they are menstruating. A waste bin is to be provided which needs to be emptied on a regular basis by the cleaning staff.
Water less urinals at different heights for boys
Toilets should be cleaned whenever they are dirty and at least once per day with a disinfectant being used on e and potentially dangerous. A cleaning roster should be in operation, and trained staff should do cleaning and maintenance preferably.

Module C4 ___________________________________________________________________________
A WECF publication 2014 35
3.2. Hygiene
Sufficient water points and hand wash facilities should be available in the school to allow convenient access to and use of water for drinking, personal hygiene, cleaning and if necessary for food preparation and laundry. The toilets should have hand washing facilities close by. Basic hygiene measures taken by staff and pupils should not be compromised by lack of water or soap or lack of access to hand washing facilities. If possible, all water provided to the school should be of drinking water quality. Hygiene education should be part of the school curriculum and positive hygiene behaviours are systematically promoted among staff and pupils. One of the important routine is hand washing at critical times, especially after toilet use and before eating. The teachers and other staff and their behaviour highly influence the behaviour of pupils and need to be positive role models.
Cleaning staff is very important
3.3. WASH clubs
WASH clubs (or sanitation club, health club, environment club or an ecosan club) are committees set up in the schools, consists of pupils meeting on a regular basis to raise awareness on WASH issues in the schools and develop planning and action to constantly improve the WASH situation in the school. The members are preferably from different classes and ages in order to ensure the sustainability over time and are supported by a teacher. The WASH club can train peers on hygiene, can change the attitude of pupils towards WASH issues, can propose ideas how to improve operation and maintenance of the WASH situation, where to get soap and toilet paper. The WASH club might have a special responsibility to report to the school director directly about the WASH situation on a regular basis.
Examples of activities by a WASH school club (toilet day contest, toilet information)
Module C4 ___________________________________________________________________________
36 A WECF publication 2014
4. Questions and Exercise
• When are the first built toilets dated back to? • Why is school sanitation important? • When is the UN World Toilet Day?
4.1. Assessing and discussing the existing school toilet conditions
• (Special note for the teacher): Take care that the topic of sanitation is still a Taboo to talk about. Create a good open atmosphere with the pupils in order to achieve good results.
You go together to the school toilet and do an on-‐site spot check. Use the quality assessment form in Module A7 and maybe add specific questions and comments, which are important for you. Do a survey with your schoolmates and use the questionnaire in Module A8! Summarise the results and discuss them with the teacher and the school director, what needs to be changed?
4.2. Set up a WASH club in the school
Initiate the setup of a WASH club in the school and support the pupils in their activities.
WSSP related activities • Discuss if schools and other public institutions provide appropriate sanitation facilities. • Discuss where in the local environment pathogens are more likely to spread. What are the reasons for this
and how could the situation be improved? • Which actions could pupils take in order to raise awareness about the importance of sanitation? • Which action could pupils take in order to improve the sanitation conditions in the school?
5. Reference and Further reading
UNECE/WHO (2010) Parma declaration. Available from http://www.wecf.eu/download/2010/03/parma_eh_conf_edoc05-‐1rev2.pdf UNICEF, (2011), Global Handwashing Day October 15. Available from http://www.globalhandwashingday.org/ UNICEF, (2012). State of the World’s Children. http://www.unicef.org/sowc/index_61804.html UNICEF (2011) WASH in Schools Monitoring Package. Available from http://www.unicef.org/wash/files/WASH_in_Schools_Monitoring_Package_English.pdf Water Supply and Sanitation Collaborative Council (WSSCC), (2012). Water Supply and Sanitation. Available from http://www.wsscc.org/ WECF (2009) Sustainable and Safe School Sanitation http://www.wecf.eu/download/2009/wecf_school_sanitation_english.pdf WHO (2009) Water, Sanitation and Hygiene Standards for Schools in Low-‐costs Settings. Available from http://www.who.int/water_sanitation_health/publications/wash_standards_school.pdf

Mod
ule
4
Module C5
Utilisation of Water in Our Daily Life Author: Friedemann Klimek
Summary Water is utilised for a variety of purposes in everyday life. Domestic water used for body care and household purposes is most familiar. Domestic water consumption varies among countries, also within Europe. In brief, this lecture describes for what purposes humans utilise water. This module gives an overview of water consumption in Europe, which puts it in an international context. The first part illustrates water consumption in Europe and the different sectors of water use. The second part focuses on 'Virtual Water' and the 'Water Footprint' by explaining their concepts and giving some examples.
Objectives The readers gain knowledge of the amount of water used for different purposes and especially in their immediate environment and abroad. The reader gets an idea of different terms of water, the concept of 'virtual water' and the 'water footprint', and how water consumption and the water footprint are connected to water use and scarcity.
Key words and terms Water consumption, sectorial water use, water abstraction, virtual water, water footprint
Preparation/materials
Material Preparation
Copies of table 4 at the end of this module
Remarks • This module is directly linked with module C6 • The suggested activities are very suitable to implement in cooperation with or by students of
a secondary school or university
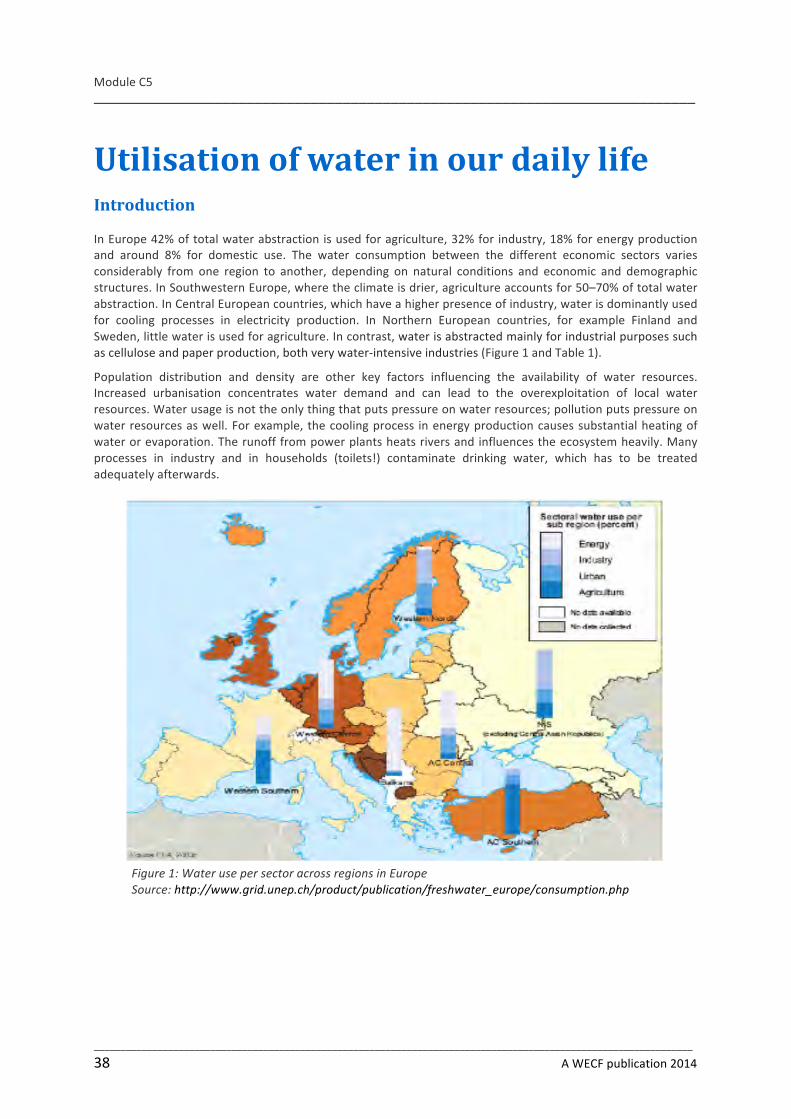
Module C5 ___________________________________________________________________________
_________________________________________________________________________________________________________________
38 A WECF publication 2014
Utilisation of water in our daily life Introduction
In Europe 42% of total water abstraction is used for agriculture, 32% for industry, 18% for energy production and around 8% for domestic use. The water consumption between the different economic sectors varies considerably from one region to another, depending on natural conditions and economic and demographic structures. In Southwestern Europe, where the climate is drier, agriculture accounts for 50–70% of total water abstraction. In Central European countries, which have a higher presence of industry, water is dominantly used for cooling processes in electricity production. In Northern European countries, for example Finland and Sweden, little water is used for agriculture. In contrast, water is abstracted mainly for industrial purposes such as cellulose and paper production, both very water-‐intensive industries (Figure 1 and Table 1).
Population distribution and density are other key factors influencing the availability of water resources. Increased urbanisation concentrates water demand and can lead to the overexploitation of local water resources. Water usage is not the only thing that puts pressure on water resources; pollution puts pressure on water resources as well. For example, the cooling process in energy production causes substantial heating of water or evaporation. The runoff from power plants heats rivers and influences the ecosystem heavily. Many processes in industry and in households (toilets!) contaminate drinking water, which has to be treated adequately afterwards.
Figure 1: Water use per sector across regions in Europe Source: http://www.grid.unep.ch/product/publication/freshwater_europe/consumption.php

Module C5 ___________________________________________________________________________
_________________________________________________________________________________________________________________
A WECF publication 2014 39
1. Sectorial use of water
Within the total freshwater withdrawal of a country or defined groups of water users, water is used in different sectors. A distinction between sectorial uses of water is helpful especially when a decision must be made to save water (module C6). Three sectors are distinguished: domestic, industrial and agricultural water use. Table 1 gives an overview of water use in some European countries.
Table 1: Water use (Domestic / Industrial / Agricultural) per year for selected European countries Source: Eurostat. 2005. Updated 7/2005 and Global Water Intelligence
1.1. Domestic water use
Water required for drinking and domestic purposes is the smallest proportion of the total water demand. In European countries, household level water consumption ranges between around 80 litres/person a day in Lithuania and around 250 litres/person a day in Spain (Figure 2). On a global scale, the variation is much bigger. People in arid zones, for example in Africa, have an average water consumption of only 20 litres/person a day-‐-‐ an extreme contrast to the 300 litres/person a day in the USA.
Figure 2: Household water use in selected European countries Source: http://www.grid.unep.ch/product/publication/freshwater_europe/consumption.php
Total Fresh water With-‐drawal
Per Capita With-‐drawal
Domestic Use
Indus-‐ trial Use
Agri-‐cultural Use
Domes-‐tic Use
Industrial Use
Agricultural Use
2005 Popula-‐ tion
Region & Country Year
km3/yr
m3/p/yr
%
%
%
m3/p/yr
m3/p/yr
m3/p/yr
Millions
Bulgaria 2003 6.92 895 3 78 19 27 700 168 7.73
Romania 2003 6.50 299 9 34 57 26 103 171 21.71
Spain 2001 37.70 802 9 13 78 72 104 625 47.15
Germany 2001 38.01 460 7 73 20 57 312 91 82.69
Europe 2005 350.00 8 50 42
Spain
Norway
Netherlands
France
Switzerland
Luxembourg
Austria
Hungary
Denmark
Germany
Poland
Slovenia
Belgium
Estonia
Lithuania
0 50 100 150 200 250 300
Household Consumption in Europe
Litres per day per person
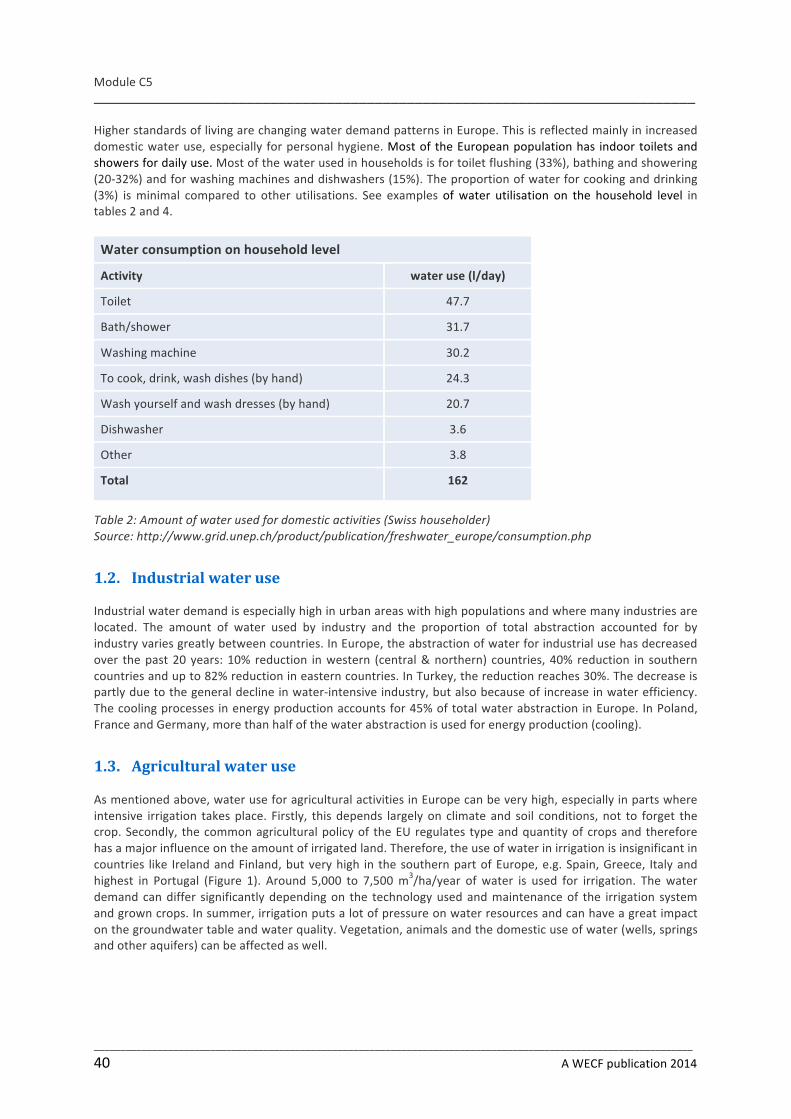
Module C5 ___________________________________________________________________________
_________________________________________________________________________________________________________________
40 A WECF publication 2014
Higher standards of living are changing water demand patterns in Europe. This is reflected mainly in increased domestic water use, especially for personal hygiene. Most of the European population has indoor toilets and showers for daily use. Most of the water used in households is for toilet flushing (33%), bathing and showering (20-‐32%) and for washing machines and dishwashers (15%). The proportion of water for cooking and drinking (3%) is minimal compared to other utilisations. See examples of water utilisation on the household level in tables 2 and 4.
Table 2: Amount of water used for domestic activities (Swiss householder) Source: http://www.grid.unep.ch/product/publication/freshwater_europe/consumption.php
1.2. Industrial water use
Industrial water demand is especially high in urban areas with high populations and where many industries are located. The amount of water used by industry and the proportion of total abstraction accounted for by industry varies greatly between countries. In Europe, the abstraction of water for industrial use has decreased over the past 20 years: 10% reduction in western (central & northern) countries, 40% reduction in southern countries and up to 82% reduction in eastern countries. In Turkey, the reduction reaches 30%. The decrease is partly due to the general decline in water-‐intensive industry, but also because of increase in water efficiency. The cooling processes in energy production accounts for 45% of total water abstraction in Europe. In Poland, France and Germany, more than half of the water abstraction is used for energy production (cooling).
1.3. Agricultural water use
As mentioned above, water use for agricultural activities in Europe can be very high, especially in parts where intensive irrigation takes place. Firstly, this depends largely on climate and soil conditions, not to forget the crop. Secondly, the common agricultural policy of the EU regulates type and quantity of crops and therefore has a major influence on the amount of irrigated land. Therefore, the use of water in irrigation is insignificant in countries like Ireland and Finland, but very high in the southern part of Europe, e.g. Spain, Greece, Italy and highest in Portugal (Figure 1). Around 5,000 to 7,500 m3/ha/year of water is used for irrigation. The water demand can differ significantly depending on the technology used and maintenance of the irrigation system and grown crops. In summer, irrigation puts a lot of pressure on water resources and can have a great impact on the groundwater table and water quality. Vegetation, animals and the domestic use of water (wells, springs and other aquifers) can be affected as well.
Water consumption on household level
Activity water use (l/day)
Toilet 47.7
Bath/shower 31.7
Washing machine 30.2
To cook, drink, wash dishes (by hand) 24.3
Wash yourself and wash dresses (by hand) 20.7
Dishwasher 3.6
Other 3.8
Total 162

Module C5 ___________________________________________________________________________
_________________________________________________________________________________________________________________
A WECF publication 2014 41
2. Virtual water and water footprint
Household water can originate from almost anywhere, from a tap to a nearby well/borehole. Prior to use (for e.g. for baking bread or growing vegetables) it is clearly visible as water. In contrast, water that is used to manufacture commodities, goods or services, is not tangible to consumers in the end product. When buying fresh vegetables or fruits from a market or grocery store, it can be difficult to imagine the amount of water that was used to grow them. This kind of water is called 'virtual water'. Thus, virtual water plays an important role in everyday water consumption. The two aforementioned paragraphs on industrial and agricultural water use belong to this water classification (for us as consumers). A broader, comparatively new concept is the ‘water footprint’ for different kinds of products, consumer groups, geographical units, etc. Box 1 explains some important terms regarding the concepts of 'virtual water' and the 'water footprint'.
2.1. An Example: The water footprint in beverage production
The food and beverages processing industry requires a huge amount of water. One of the main problems is the amount of wastewater produced in the food plants. Water is used for several purposes: as an ingredient, a cleaning agent, for boiling and cooling purposes and for transportation and conditioning of raw materials. The production of a soft drink includes the following process steps: bottle making (from PET resins to PET-‐bottle
Box 1 – Terms regarding water footprint
Virtual water. This term defines a specific 'type' of water (like rain water, drinking water or waste water). It describes water used for the production of a good or service, which is not visible as water in the final product. Virtual water refers to freshwater “embodied” in the product; not in a real sense, but in a virtual sense. The virtual water content of a product stands for the volume of fresh water consumed or polluted for producing a product, measured over its full production chain. Examples: the production of 1 kg wheat costs 1,300l water, the production of 1 kg beef costs 15,500l water, Jeans (1,000g) contain 10,850 litres of embedded virtual water. (Table 3)
Water footprint. The water footprint is a multi-‐dimensional indicator of freshwater use that calculates both direct and indirect water use of a consumer or producer. Like the virtual water content, the water footprint refers to the embodied water in a product. In addition, the water footprint also accounts for which type of water is being used and when and where that water is being used. The water footprint is a geographically explicit indicator, not only showing volumes of water use and pollution, but also considering the locations. Water use is measured in terms of water volumes consumed (evaporated) and/or polluted per unit of time. The water footprint of an individual, community or business is defined as the total volume of freshwater that is used to produce the goods and services consumed by the individual, community or business. A water footprint can be calculated for a particular product, for any well-‐defined group of consumers (e.g. an individual, family, village, city, province, state or nation) or producers (e.g. a public organization, private enterprise or economic sector).
The above terms consist of the following three components: Blue water. Fresh surface or groundwater, i.e. the water in freshwater lakes, rivers and aquifers. Green water. The precipitation on land that does not run off or recharge the groundwater but is stored in the soil or temporarily stays on top of the soil or vegetation. Eventually, this part of precipitation evaporates or transpires through plants. Green water can be made productive for crop growth (but not all green water can be taken up by crops because there will always be evaporation from the soil and not all periods of the year or areas are suitable for crop growth). Grey water. The grey water footprint measures the volume of water flow, aquifers and rivers polluted by humans.

Module C5 ___________________________________________________________________________
_________________________________________________________________________________________________________________
42 A WECF publication 2014
forms), bottle cleaning (by air), syrup preparation, mixing, filling, labelling and packing. The highest contribution to the water footprint of a soft drink comes from its supply chain, mainly from its ingredients (95%). A smaller fraction stems from packaging and labelling materials (4%), particularly from its bottle. In production processes, the amount of water consumed is very small compared to its supply chain (1%), which is mainly water incorporated into the product. Sugar is one of the main water-‐consuming ingredients in soft drinks. Three different sugar types are typically used in soft drinks: sugar beet, sugar cane and high fructose maize syrup (HFMS). Type and origin of sugar input significantly affect the total water footprint of the soft drink. For example, the total water footprint of the soft drink is 310 litres when the sugar originates from cane sugar from Cuba, 170 litres when the sugar comes from beet sugar from the Netherlands, and 180 litres with HFMS from USA (Figure 3). The following table illustrates the estimated amount of virtual water used in the production of certain consumer goods:
The hidden water use (virtual water)
Commodity Water consumed (l)
1 litre of beer 7
1 litre of gasoline 10
1 cola 70
A single bath 200
1 kg of paper 320
1 kg of bread 1,000
1 kg of potatoes 1,000
Television set 1,000
1 kg of meat 4,000 to 10,000
One pair of jeans 8,000
Table 3: Hidden Water use in domestic goods Source: http://www.grid.unep.ch/product/publication/freshwater_europe/consumption.php
2.2. A global 'virtual water balance'
The link to the Water Safety Plan: With the aforementioned concepts of virtual water and water footprint, it is easier to compare the amount of water actually used for different approaches. This can be done for certain products, geographical locations, time scales, consumer groups, etc. Figure 4 shows the 'global virtual water balance' per country. In combination with other figures, it is much easier to make conclusions about which country places a lot or a little amount of pressure on its water resources.
Two factors determine the magnitude of the water footprint of national consumption: • The volume and pattern of consumption • The water footprint per ton of consumed products.
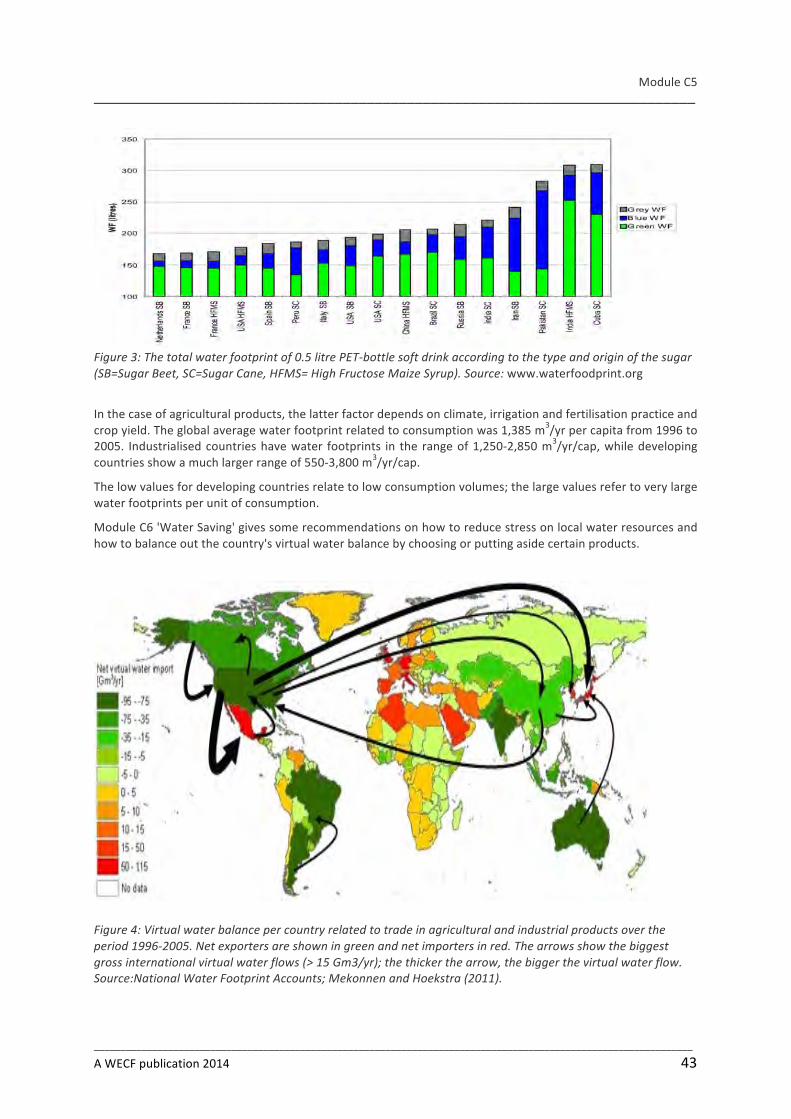
Module C5 ___________________________________________________________________________
_________________________________________________________________________________________________________________
A WECF publication 2014 43
Figure 3: The total water footprint of 0.5 litre PET-‐bottle soft drink according to the type and origin of the sugar (SB=Sugar Beet, SC=Sugar Cane, HFMS= High Fructose Maize Syrup). Source: www.waterfoodprint.org
In the case of agricultural products, the latter factor depends on climate, irrigation and fertilisation practice and crop yield. The global average water footprint related to consumption was 1,385 m3/yr per capita from 1996 to 2005. Industrialised countries have water footprints in the range of 1,250-‐2,850 m3/yr/cap, while developing countries show a much larger range of 550-‐3,800 m3/yr/cap.
The low values for developing countries relate to low consumption volumes; the large values refer to very large water footprints per unit of consumption.
Module C6 'Water Saving' gives some recommendations on how to reduce stress on local water resources and how to balance out the country's virtual water balance by choosing or putting aside certain products.
Figure 4: Virtual water balance per country related to trade in agricultural and industrial products over the period 1996-‐2005. Net exporters are shown in green and net importers in red. The arrows show the biggest gross international virtual water flows (> 15 Gm3/yr); the thicker the arrow, the bigger the virtual water flow. Source:National Water Footprint Accounts; Mekonnen and Hoekstra (2011).

Module C5 ___________________________________________________________________________
_________________________________________________________________________________________________________________
44 A WECF publication 2014
3. Exercises and questions
• Please complete the following table 4. • How much water do you use on a daily base? And for which purpose? • Think about 2 or 3 goods you use: how much virtual water was used to produce them (Internet search).
Which countries do they originate from (have a look at the map (Figure 4). Are these countries net water importers or exporters?
• In which steps of the production of a PET-‐bottle for a soft drink is water used? • Where do you have production sites of drinks (juices, soft drinks, etc.) in your vicinity in Bulgaria? What
does that mean for the (water) environment (water abstraction, water pollution, water treatment, etc.)? • Is “virtual water” exported in your region or village? Make a list of products. • Make suggestions on how the consumption of virtual water could be minimised. • Calculate your own water footprint: www.waterfootprint.org and discuss it in class.
Table 4: Average water consumption per person and day in litre Source: Compilation of different sources
WSSP related activities
• How much water do the households and the enterprises in your village consume? And for which purpose? Do a short survey (ask the water supplier).
• Make an estimate on how much water is used for irrigating crops for livestock; which source of water is used?
• Is there a water shortage in your village? If yes, how is this shortage noticeable? • Make suggestions on how the water usage in the village could be reduced.
Average water consumption per person and day in litre
Family Bulgaria Germany
Drinking 1
Cooking 3
Dishwasher 2
Showering, Bathing 40
Body care 6
Washing machine 20
Room cleaning 4
Toilet 40
Car washing 3
Watering (flowers) 1
Watering (garden) 6
Other
Total 126
Module C5 ___________________________________________________________________________
_________________________________________________________________________________________________________________
A WECF publication 2014 45
4. Text sources and further reading
Arjen Y. Hoekstra, Ashok K. Chapagain, Maite M. Aldaya, Mesfin M. Mekonnen (2011): The water footprint assessment manual. Setting the global standard; Earthsacan. Available from http://www.waterfootprint.org/?page=files/WaterFootprintAssessmentManual European Environmental Agency (EEA), (2009). Water resources across Europe — confronting water scarcity and drought. Copenhagen, Denmark. Available from http://www.eea.europa.eu/publications/water-‐resources-‐across-‐europe Mekonnen, M.M. and Hoekstra, A.Y. (2011): National water footprint accounts: the green, blue and grey water footprint of production and consumption, Value of Water Research Report Series No.50, UNESCO-‐IHE. Available from http://www.waterfootprint.org/Reports/Report50-‐NationalWaterFootprints-‐Vol1.pdf UNEP, (2004): Freshwater in Europe – Facts, Figures and Maps; Châtelaine, Switzerland. Available from http://www.grid.unep.ch/product/publication/freshwater_europe/consumption.php Virtual water, water footprint, (2012). Available from http://www.waterfootprint.org, http://en.wikipedia.org/wiki/Virtual_water)

Module C5 ___________________________________________________________________________
_________________________________________________________________________________________________________________
46 A WECF publication 2014

Module C6
Water Saving Authors: Diana Iskreva, Claudia Wendland
Summary Water is a limited resource of enormous importance for nature and all living creatures on earth. Climate change and population growth add to the burden on water resources. It is vitally important to conserve water, establish water efficient measures and decrease water scarcity. In this module, water-‐saving methods and techniques for households are discussed in detail and examples of water-‐saving methods are given. Also, the personal responsibility of each human being to protect water resources is generally addressed.
Objectives The pupils can explain which human activities are responsible for the most extensive water usages. They can describe sources of possible water loss within a water supply network and the households. Furthermore, they are able to make suggestions on how to save water in daily life.
Key words and terms Water conservation, water efficiency, water saving, water re-‐use
Preparation/materials
Materials Preparation
Bucket
Measuring bowl
Electronic clock or stop-‐watch
Precipitation beaker
A few centilitres of food colouring Could be e.g. from beetroot juice
Module B2 ___________________________________________________________________________
_________________________________________________________________________________________________________________
48 A WECF publication 2014
Water saving Introduction
Water is fundamentally important, not only for human beings, but for all other living creatures on earth and the environment. Water plays a substantial role in numerous processes on the planet and is essential for living and non-‐living elements. We are responsible for preserving quality water for future generations.
DON´T HOG ALL THE WATER! THINK 7 GENERATIONS AHEAD Source: http://www.harvesth2o.com/
1. Water conservation
Water is a limited resource. Climate change reduces the availability of water in our geographical area as average annual temperatures increase and average annual precipitation decreases. Population growth also adds to the increasing burden on the planet’s water resources. We all need to take responsibility for monitoring our water consumption and apply water-‐efficient solutions in our households, schools, offices, and factories. It is extremely important to introduce water-‐efficient irrigation systems into our yards and farms. More than 70% of consumed water serves the needs of agriculture, especially concerning irrigation water (see also module C5). In our households, the biggest potential for saving water is through the efficient use of water in toilets and bathrooms. Residents of households need to consider options for reusing the water used for toilet flushing, e.g. reusing the flushed water for the irrigation of the garden and lawn. Also, the consideration of not using drinking water for flushing the toilet, which is common, should be an appropriate action. Leaks are another very large burden to our supply system and also burden the financial status of our households. Only one leaking tap can contribute to thousands of litres of water loss per year. Saving water also means saving energy and other resources. By doing this, we protect natural resources and help animals and plants that also need water to sustain their lives.
2. Water conservation
Water conservation is the process of applying measures for the efficient use of water. This includes actions, changes in behaviour, devices, technologies and improved designs to reduce the loss of water (by wasting or leakages), and to increase water reuse. More efficient water use leads to a reduced demand for water. The key for efficiency is reducing the wasting of water rather than restricting use. Examples of water conservation steps include: fixing leaking taps, taking showers rather than baths, installing displacement devices inside toilet cisterns, and using dishwashers and washing machines with full loads.
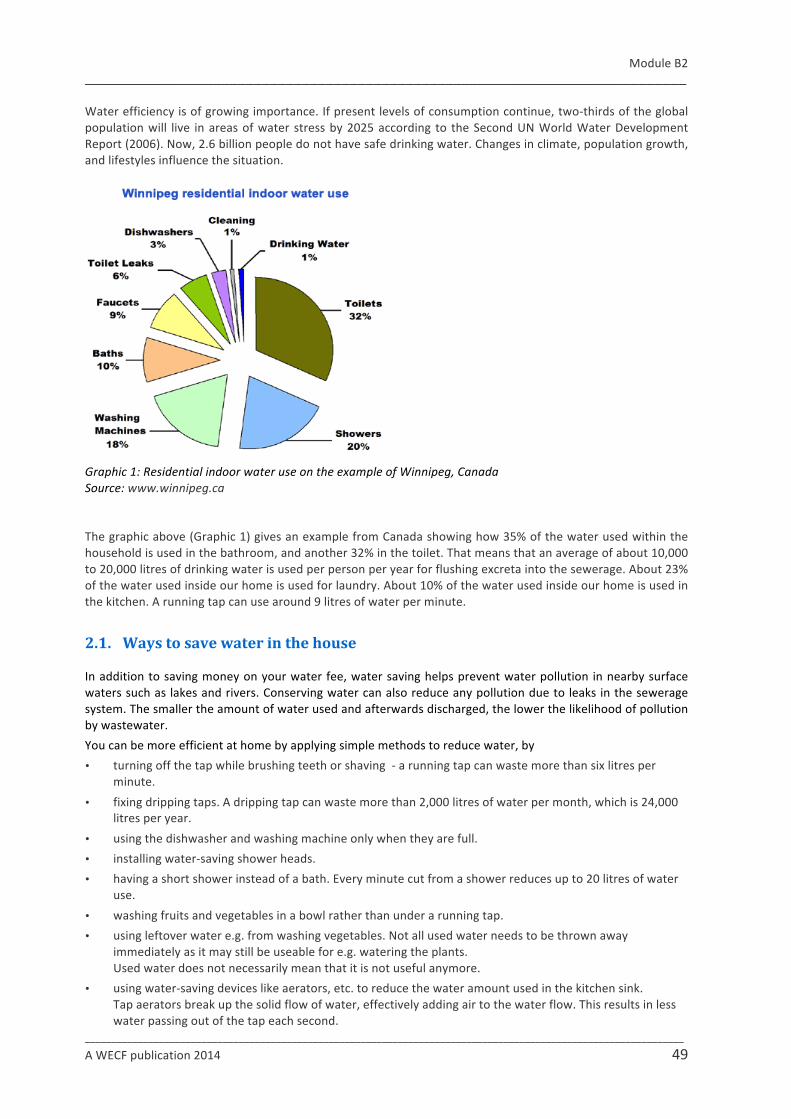
Module B2 ___________________________________________________________________________
_________________________________________________________________________________________________________________
A WECF publication 2014 49
Water efficiency is of growing importance. If present levels of consumption continue, two-‐thirds of the global population will live in areas of water stress by 2025 according to the Second UN World Water Development Report (2006). Now, 2.6 billion people do not have safe drinking water. Changes in climate, population growth, and lifestyles influence the situation.
Graphic 1: Residential indoor water use on the example of Winnipeg, Canada Source: www.winnipeg.ca
The graphic above (Graphic 1) gives an example from Canada showing how 35% of the water used within the household is used in the bathroom, and another 32% in the toilet. That means that an average of about 10,000 to 20,000 litres of drinking water is used per person per year for flushing excreta into the sewerage. About 23% of the water used inside our home is used for laundry. About 10% of the water used inside our home is used in the kitchen. A running tap can use around 9 litres of water per minute.
2.1. Ways to save water in the house
In addition to saving money on your water fee, water saving helps prevent water pollution in nearby surface waters such as lakes and rivers. Conserving water can also reduce any pollution due to leaks in the sewerage system. The smaller the amount of water used and afterwards discharged, the lower the likelihood of pollution by wastewater. You can be more efficient at home by applying simple methods to reduce water, by • turning off the tap while brushing teeth or shaving -‐ a running tap can waste more than six litres per
minute. • fixing dripping taps. A dripping tap can waste more than 2,000 litres of water per month, which is 24,000 litres per year. • using the dishwasher and washing machine only when they are full. • installing water-‐saving shower heads. • having a short shower instead of a bath. Every minute cut from a shower reduces up to 20 litres of water
use. • washing fruits and vegetables in a bowl rather than under a running tap. • using leftover water e.g. from washing vegetables. Not all used water needs to be thrown away
immediately as it may still be useable for e.g. watering the plants. Used water does not necessarily mean that it is not useful anymore.
• using water-‐saving devices like aerators, etc. to reduce the water amount used in the kitchen sink. Tap aerators break up the solid flow of water, effectively adding air to the water flow. This results in less water passing out of the tap each second.

Module B2 ___________________________________________________________________________
_________________________________________________________________________________________________________________
50 A WECF publication 2014
Graphic 2: Water-‐efficient house Source: www.thinkwater.act.gov.au
Since the flush toilet is, with almost a third of the total volume, the major water consumer in the house, special attention has to be paid to the water efficiency of the toilet. What you can do:
• Put a plastic bottle or other displacement device into the toilet cistern to reduce the flush volume. • Check for toilet leaks. A barely visible leak into your toilet bowl can waste more than 4 000 litres of water
per year. Visible constant leaks (creating a hissing sound) can waste 95 000 litres per year. • Reusing grey water to flush the toilet or use a waterless or low flush-‐toilet (see also module B5). • Do not use the toilet as an ashtray or wastebasket. It uses additional flush water and contributes to water
pollution. If there is the possibility to change the toilet system, you could select a low flush toilet or a dual flush toilet that need much less water for flushing. There are also waterless toilets, such as the urine-‐diverting dry toilets (UDDT, also called Ecosan toilets), which are very useful in water-‐scarce regions or in regions where no sewage or water-‐supply system exists. A special urine-‐diverting toilet seat or squatting slab is used for a proper diversion of the urine from the faeces. With an Ecosan toilet urine and faecal matter are stored and treated separately. See graphic 3. No water is needed for flushing because faeces are stored in a dry condition and covered with ashes or saw dust, making sure that bad odours and flies are kept away. After a certain storage and/or composting period, the products are used as a fertiliser in the fields. See also module B5 and C3.
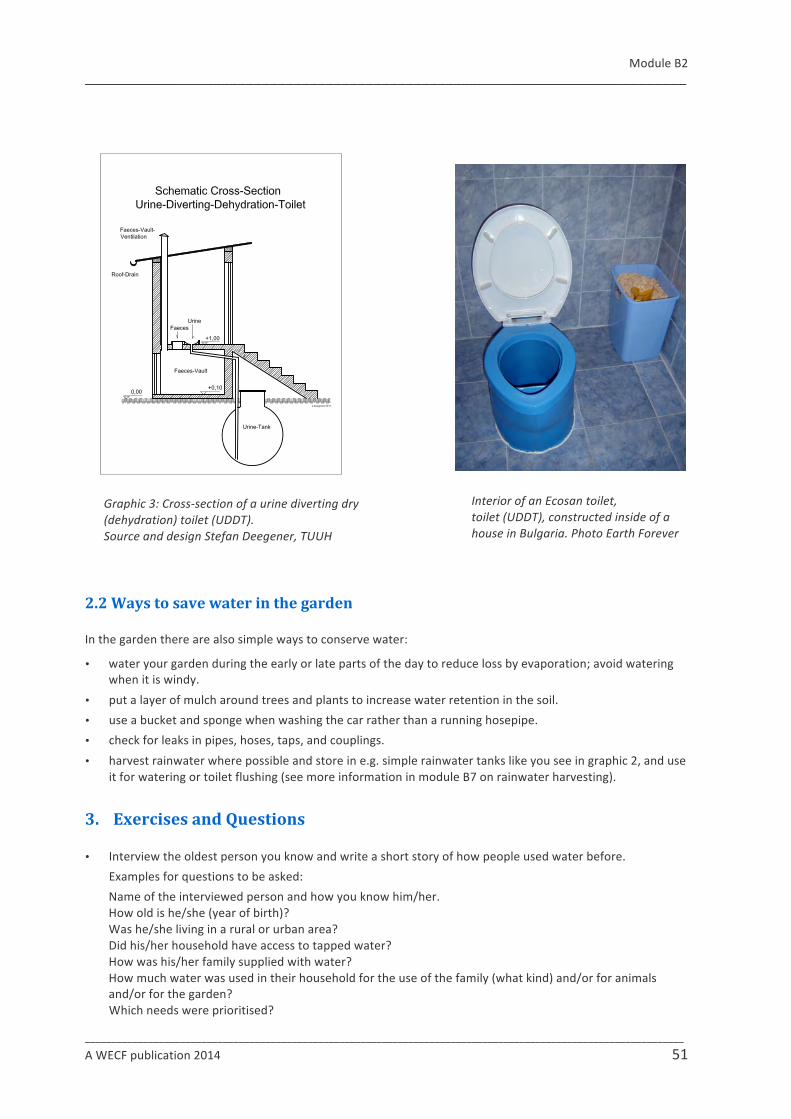
Module B2 ___________________________________________________________________________
_________________________________________________________________________________________________________________
A WECF publication 2014 51
Graphic 3: Cross-‐section of a urine diverting dry (dehydration) toilet (UDDT). Source and design Stefan Deegener, TUUH
Interior of an Ecosan toilet, toilet (UDDT), constructed inside of a house in Bulgaria. Photo Earth Forever
2.2 Ways to save water in the garden
In the garden there are also simple ways to conserve water:
• water your garden during the early or late parts of the day to reduce loss by evaporation; avoid watering when it is windy.
• put a layer of mulch around trees and plants to increase water retention in the soil. • use a bucket and sponge when washing the car rather than a running hosepipe. • check for leaks in pipes, hoses, taps, and couplings. • harvest rainwater where possible and store in e.g. simple rainwater tanks like you see in graphic 2, and use
it for watering or toilet flushing (see more information in module B7 on rainwater harvesting).
3. Exercises and Questions
• Interview the oldest person you know and write a short story of how people used water before. Examples for questions to be asked: Name of the interviewed person and how you know him/her. How old is he/she (year of birth)? Was he/she living in a rural or urban area? Did his/her household have access to tapped water? How was his/her family supplied with water? How much water was used in their household for the use of the family (what kind) and/or for animals and/or for the garden? Which needs were prioritised?
Module B2 ___________________________________________________________________________
_________________________________________________________________________________________________________________
52 A WECF publication 2014
Had they been collecting rainwater in their households? How was the rainwater collected? How often and to which amounts? What was rainwater used for? Which amounts of water do they collect now and what are they using it for? What is his/her advice for young people concerning protection and usage of water?
• Make some observations at home: How much water is used for flushing the toilet and for irrigation? Approximately how much water is wasted if the tap is open while brushing the teeth? Which kind of everyday activities consume the largest amounts of water? What can people do to reduce the usage?
• Check your toilets for leaks: Put a little food colouring (e.g beetroot juice) in your toilet tank. If, without flushing, the colour begins to appear in the bowl within 30 minutes, you have a leak that should be repaired immediately. Most replacement parts are inexpensive and easy to install.
• Measure weekly or monthly the amount of precipitation with a precipitation beaker. • Measure how much water will run from the tap while brushing teeth or while shaving. • How much water runs out of the tap in 1 minute? (Save the water used for this experiment in order to use
it for another use as well.)
WSSP Activities
Gather information from the water supplier in order to assess the quantity of water: How much water (cubic meter) is yearly/monthly supplied into the network? How much water is yearly/monthly used and paid by the consumer?
How much drinking water is non-‐accountable – is lost by leakages within the network?
Interview a consumer on his/her daily or yearly water need from the water supply and/or from a well. Make an inventory/estimation of how many taps or flush-‐toilets within the households are leaking (by interviews, observations).
Make an estimation of the amount of yearly precipitation within the area of the village.
Relate the level of precipitation/evaporation to the water usage in the village.
Find out if the water supplier or local experts have information about the balance between the groundwater use and the amount of renewed groundwater.
4. References and further reading
Act Government, (2012). Think water act water. Available from http://www.thinkwater.act.gov.au/
Centre for Science & Environment, (2012). Water harvesting. Available from http://www.rainwaterharvesting.org/whatiswh.htm
Energy Saving Trust, (2012). Water. Available from http://www.energysavingtrust.org.uk/In-‐your-‐home/Water
UNESCO, (2006). 2nd UN World Water Development Report, United Nations Educational, Scientific and Cultural Organization. Available from http://unesdoc.unesco.org/images/0014/001454/145405E.pdf
WHO, (2012). Water Sanitation Health. Available from http://www.who.int/water_sanitation_health/en/ Ecosan
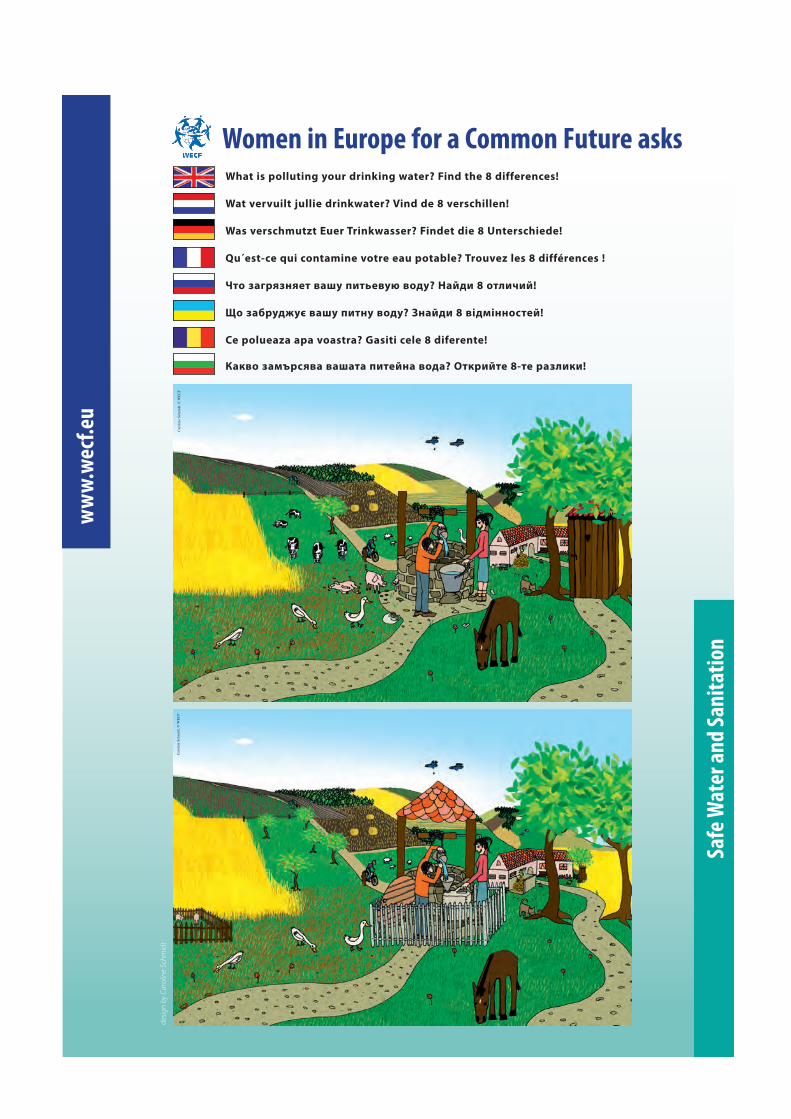
Module B2 ___________________________________________________________________________
_________________________________________________________________________________________________________________
A WECF publication 2014 53
Car
olin
e Sc
hmid
t, ©
WEC
FC
arol
ine
Schm
idt,
© W
ECF
What is polluting your drinking water? Find the 8 differences!
Wat vervuilt jullie drinkwater? Vind de 8 verschillen!
Was verschmutzt Euer Trinkwasser? Findet die 8 Unterschiede!
Qu´est-ce qui contamine votre eau potable? Trouvez les 8 différences !
!"# $%&'($)(*" +%,- ./"0*+-1 +#2-? 3%42/ 8 #"5/6/4!
7# $%8'-29-: +%,- ./")- +#2-? ;)%42/ 8 +i2<i))#="*4!
Ce polueaza apa voastra? Gasiti cele 8 diferente!
>%?+# $%<@'=(+% +%,%"% ./"*4)% +#2%? A"?'/4"* 8-"* '%$5/?/!
Women in Europe for a Common Future asks
ww
w.we
cf.eu
Safe
Wat
er an
d San
itatio
n
W-183-WS Plan.indd 38 11.05.2009 11:17:52 Uhr


