Publikation Nr 87/2 ISSN 02809265 CHALMERS TEKNISKA HÖGSKOLA Institutionen för Tillämpad termodynamik och strömningslära CHALMERS UNIVERSITY OF TECHNOLOGY Department of Applied Thermodynamics and Fluid Mechanics ─────────────────────── EFFECTS OF REYNOLDS NUMBER AND A LOW-INTENSITY FREESTREAM TURBULENCE ON THE FLOW AROUND A CIRCULAR CYLINDER By Christoffer Norberg ──────────────── Göteborg Maj 1987
Transcript
Publikation Nr 87/2 ISSN 02809265
CHALMERS TEKNISKA HÖGSKOLA
Institutionen för Tillämpad termodynamik och strömningslära
CHALMERS UNIVERSITY OF TECHNOLOGY
Department of Applied Thermodynamics and Fluid Mechanics
───────────────────────
EFFECTS OF REYNOLDS NUMBER AND A LOW-INTENSITY FREESTREAM
TURBULENCE ON THE FLOW AROUND A CIRCULAR CYLINDER
By
Christoffer Norberg
────────────────
Göteborg Maj 1987
1
CONTENTS
Page
SUMMARY 2
INTRODUCTION 3
EXPERIMENTAL ARRANGEMENT AND INSTRUMENTATION 5
RESULTS AND DISCUSSION 8
STROUHAL NUMBER 9
Presentation of results 9
Accuracy 13
End conditions and vibration 13
Onset of vortex shedding 14
Transition in stable regime? 14
Tu-effects at low Re 18
Proposals for Re-dependence at low Re 18
Transition regime 20
Subcritical regime 20
TRANSITION FREQUENCY 22
MEASUREMENTS IN THE SUBCRITICAL REGIME 26
Mean pressure distributions 26
Vortex formation distance and wake width 28
Axial correlations 33
BASE PRESSURE COEFFICIENTS 37
Mean base pressure coefficient 37
RMS base pressure coefficient 41
CONCLUSIONS 42
ACKNOWLEDGEMENTS 44
REFERENCES 44
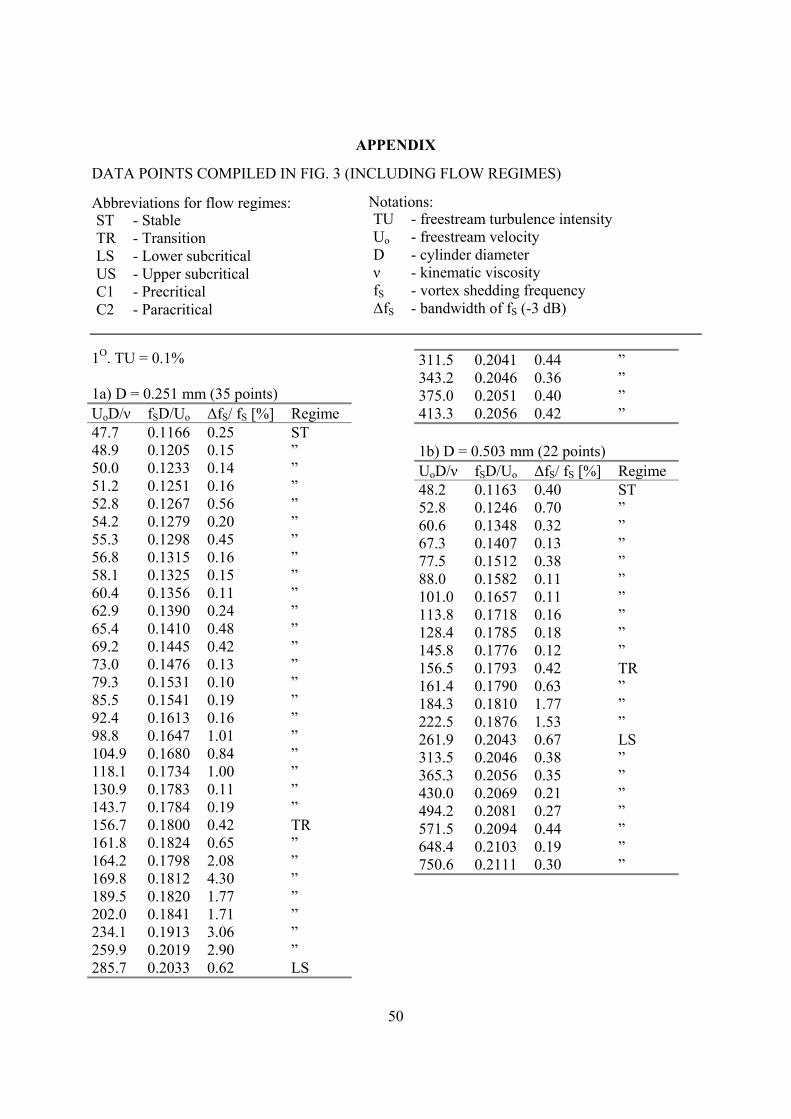
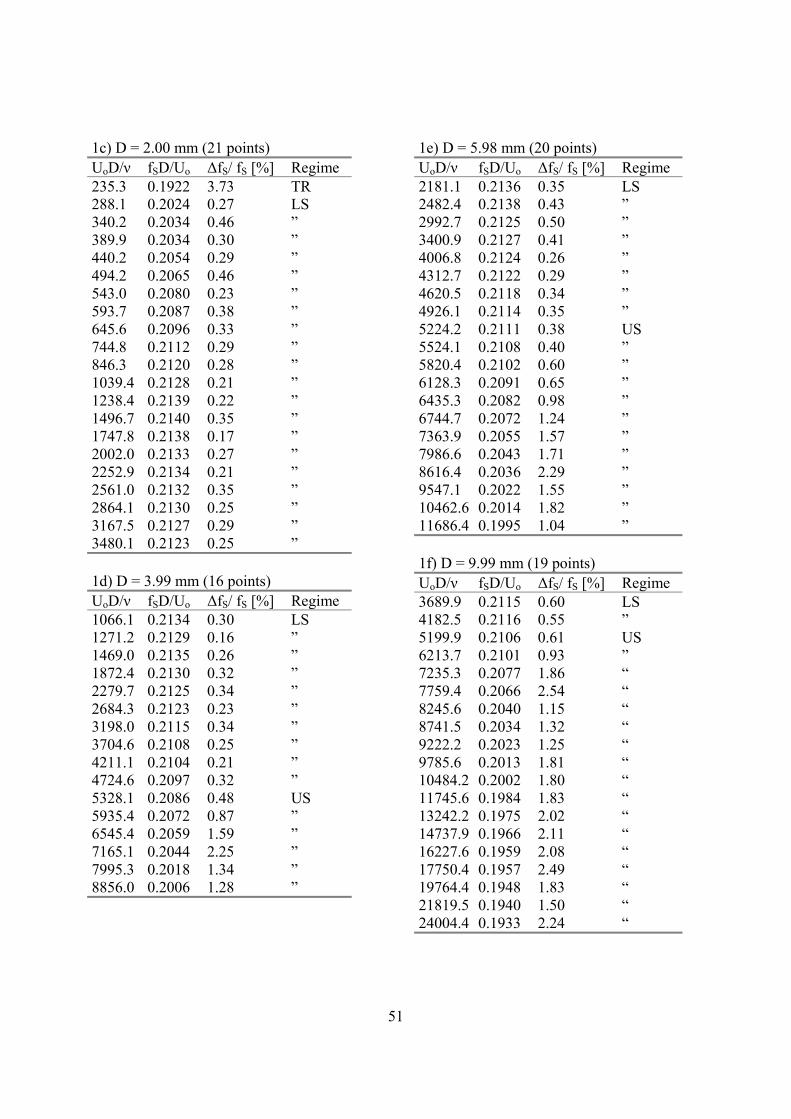
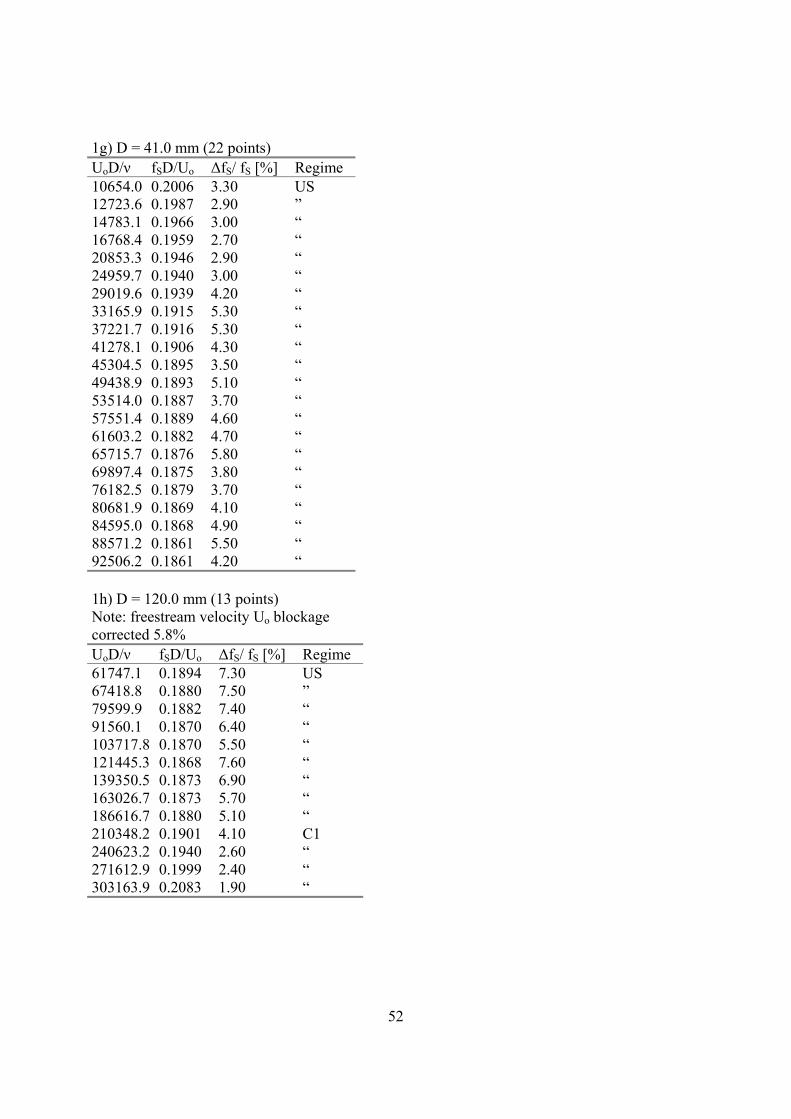
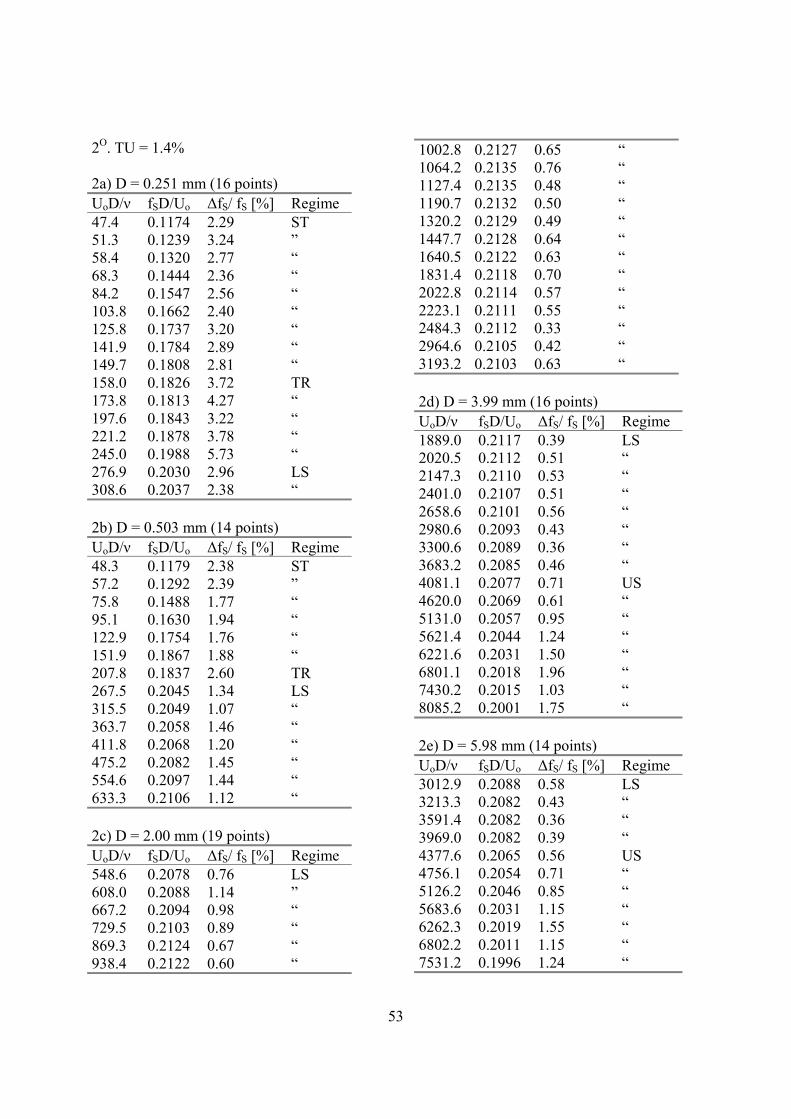
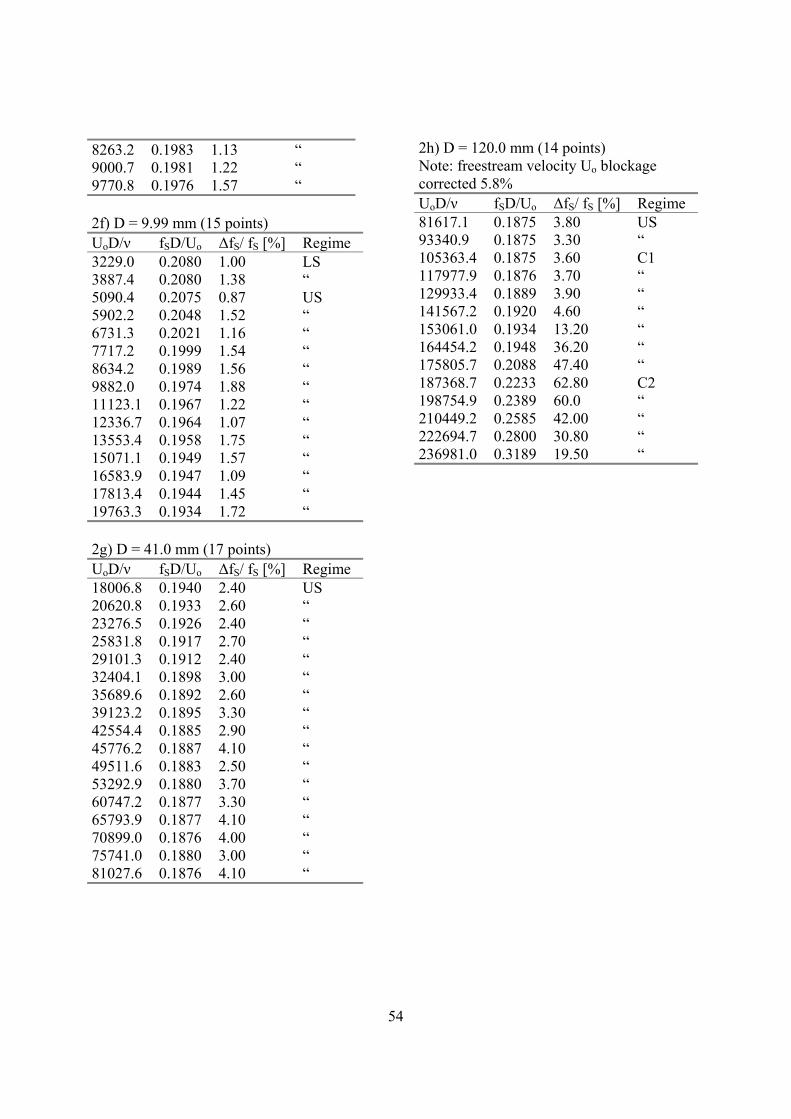
APPENDIX (DATA POINTS COMPILED IN FIG. 3) 50
2
SUMMARY
This paper presents experimental results from measurements on circular cylinders of different
diameters in cross flow. The Reynolds number was varied from about 50 to 2·105. The
combined effects of Reynolds number and a low-intensity freestream turbulence (Tu =1.4%)
on the variation of different coefficients, e.g., Strouhal number, mean and RMS pressure
coefficients, are presented. The results indicate that the flow is rather insensitive to an
increase in the turbulence intensity at Reynolds numbers less than about 103. In this
investigation, this is probably due to the large relative scales of the freestream turbulence at
these Reynolds numbers (quasi-stationary flow). At higher Reynolds numbers (greater than
about 103), the influence of turbulence is significant, especially concerning the pressure forces
on the cylinder. It was found that the flow seems to exhibit a basic change at a Reynolds
number of about 5·103 (4·103 with turbulence). For instance, the relative Strouhal bandwidth
changes by about one order of magnitude around this Reynolds number. A sub-division of the
subcritical regime at this Reynolds number is proposed.
3
INTRODUCTION
The observation by Strouhal in 1878 [1], that the frequency (f) of the Aeolian tone [2]
produced by his hand-driven whirler was proportional to the relative air velocity (U) and
inversely proportional to the wire diameter (D) marks the beginning of the scientific study of
the vortex shedding phenomenon. In 1908, Bénard [3] demonstrated that the periodic
phenomenon was associated with a staggered vortex street formed behind the cylinder and the
stability of the vortex configuration was investigated in a theoretical study by von Kármán [4]
in 1912. That the dimensionless group fD/U, later called the Strouhal number [5], actually is a
function of the Reynolds number was pointed out by Lord Rayleigh, in 1915 [6].
Here and in the following, the Reynolds number (Re = Uo D/v) is defined on the diameter of
the cylinder (D), the freestream velocity (Uo) and the kinematic viscosity of the fluid (v).
The flow past a circular cylinder displays a series of flow regimes when going from low to
high Reynolds numbers. When comparing different sources it should be remembered that the
flow has been shown to be sensitive to disturbances and in particular to conditions at the end
of the cylinder and to freestream turbulence [7-11]. At a Reynolds number of about 5 the flow
behind the cylinder exhibits two symmetrical standing eddies [12]. With increasing Reynolds
number the separated region elongates in the streamwise direction and when the ”bubble
length” is about two diameters [13], a wake instability occurs and the wake starts to ”wobble”
in a sinusoidal manner. Experiments on the determination of the upper limit of wake stability
indicate a critical Reynolds number of about 34-40 [12-15]. From Re = 50 to about 150-200,
the so-called stable regime [16], a stable laminar vortex street is generated [15, 16]
(eventually the wake becomes unstable far downstream [17]). Evidence of different modes of
laminar motion within the ”stable” regime has been put forward by Tritton [18], Berger [19],
Gerrard [13] and more recently by Sreenivasan [20]. It should be noted that some of these
apparent changes might be due to some ”non-uniformity in the flow” [21], end effects [7] or
vibration of the cylinder [22].
With increasing Re, irregular disturbances in the vicinity of the vortex formation region [13,
23] appear at Re = 150-200. This marks the beginning of the transition regime [16]. It has
been suggested [13, 23] that a three-dimensional distortion of the initially straight vortex lines
eventually leads to turbulence in this regime. More regular vortex shedding reappears at Re ≈
300-400. Above Re ≈ 300-400, the so-called subcritical regime, the transition to turbulence
occurs before the separated layers roll up, the vortices once formed being turbulent [23]. In
4
this regime, the transition to turbulence is preceded by sinusoidal oscillations that appear in
the separated shear layers. Bloor [23], who first discovered this phenomenon, associated it
with “transition waves” and showed that (i) the ratio of transition wave frequency to
fundamental frequency increased approximately proportional to the square root of the
Reynolds number, (ii) the transition moves upstream with increasing Reynolds number (the
transition has almost reached the shoulder of the cylinder at Re = 5·104) and (iii) the
formation region increases up to a maximum of about 3 diameters behind the cylinder axis as
Re increases from about 400 to 1300 and it then decreases with increasing Re (the wake being
formed about one diameter behind the cylinder axis at Re ≈ 5·104). A recent investigation by
Wei and Smith [24] indicates that the “transition waves” detected by Bloor is identical to
three-dimensional structures called “secondary vortices”. It is suggested that the three-
dimensional distortion of these vortices that follows immediately after their formation may
provide the mechanism for the transition to turbulent Strouhal (fundamental) vortices. It has
recently been shown; see Blevins [25]; that the vortex shedding in the upper subcritical
regime consists of coherent strings of events whose frequencies wander about the nominal
shedding frequency. When the transition occurs immediately after separation the flow will
exhibit a high potential for reattachment. The so- called precritical regime with a steep fall in
the drag coefficient with increasing Re begins at a Reynolds number of about 2·105
(dependent on surface roughness, free stream turbulence etc.). In the so-called paracritical
regime with laminar separation, reattachment and, subsequently, turbulent separation only
weak vortex shedding occurs. Reappearance of strong periodicity in the wake is found for Re
greater than about 3·106. For a more complete discussion on different flow regimes, the reader
is referred to e.g. [11, 26-29].
The data in this paper will be restricted to Reynolds numbers ranging from Re ≈ 50 to about
2·105. Special attention will be given to the Reynolds number range between say 2·103 and
104 (i.e. within the “disturbance-sensitive Reynolds number range” [10]) and to the effects of
a low-intensity freestream turbulence.
The given results complement an earlier paper [30].
5
EXPERIMENTAL ARRANGEMENT AND INSTRUMENTATION
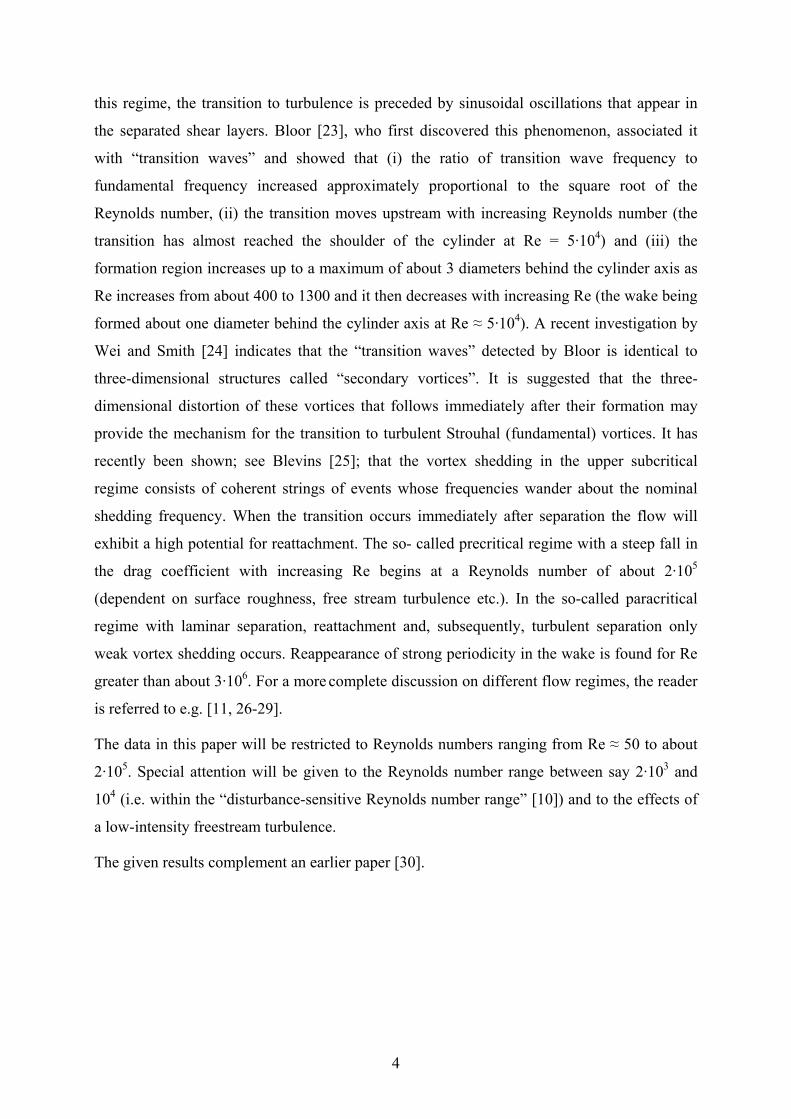
The experiments were carried out in a closed-circuit low-speed wind tunnel, see Fig. l.
Fig. 1 The wind tunnel.
The settling chamber contains a honeycomb and three gauze screens and is followed by a 6:1
contraction into a 2.9 m long, 1.25 m high and 1.80 m wide test section. The corner fillets of
0.3 x 0.3 m2 are somewhat diminishing in the flow direction in order to compensate for
boundary layer growth. Effects of freestream turbulence could be studied by inserting a grid at
the entrance of the test section. The grid was of bi-planar type with square meshes and
circular rods (mesh size = 14.2 mm, bar diameter = 4 mm). The cylinders used in the
experiments were all mounted horizontally with their axes perpendicular to the flow and at a
position half-way between the roof and the floor and 1.5 m downstream of the grid centre
plane. At this position, with the grid, the turbulence intensity was 1.35-1.39% and the eddy
size (Λ) 11.3-12.1 mm in the velocity range 7-27 m/s [30]. The turbulence intensity without
any grid was less than 0.06% in the velocity range 2-35 m/s. In the following, the cases with
and without grid will be referred to as having Tu = 1.4% and 0.1%, respectively. The
diameters of the cylinders used in the experiments varied from 0.251 to 120.0 mm, see
Table 1.
6
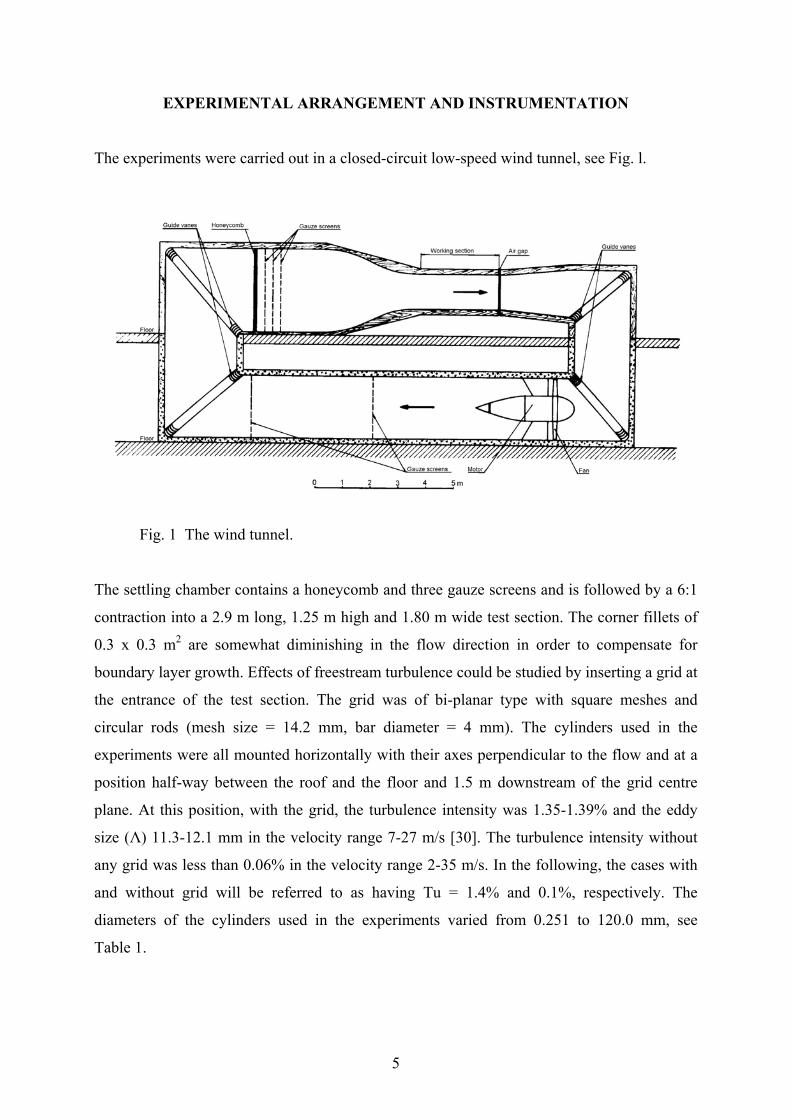
Table 1 Data for cylinders of different diameters D. L/D – Length between end plates to diameter ∆A/Ao - Model blockage ratio, Ao = 2.09 m2 D/H - Wall blockage ratio, H = 1250 mm Λ - Longitudinal integral length scale
D [mm] L/D ∆A/Ao D/H Λ/D REMARK
0.251 1912 0.9 0.02 ~50 Solid (music wire)
0.503 954 0.9 0.04 ~25 Solid ( -- “ -- )
2.00 240 1.0 0.2 ~6 Solid (steel rod)
3.99 120 1.0 0.3 ~3 Solid ( -- “ -- )
5.98 80 1.0 0.5 2.0 Hollow
9.99 48 1.1 0.8 1.2 Solid (steel rod)
20.0 24 1.4 1.6 0.6 Solid/Hollow, see [32]
41.0 11.7 4.0 3.3 0.3 Solid/Hollow, see [31]
120.0 8.83 10.8 9.6 0.1 Hollow, see [30]
The mounting arrangement with end plates separated 480 mm (L) apart, originally designed
for the cylinder having D = 41 mm [31], was used for all cylinders except for the one with D
= 120 mm (see [30] for details on this cylinder). Both mean and fluctuating pressures could be
measured with the cylinders having 20, 41 and 120 mm, see [30-32]. A pressure tap of 0.4
mm diameter was drilled, at the mid-span position, through the 0.4 mm thick wall of the
cylinder with D = 5.98 mm (referred to as D = 6 mm). The rotation of the cylinder about its
axis (with a rod from outside the tunnel) enabled the measurement of mean pressures around
the perimeter. The angle from the stagnation point (α) was determined from the symmetry in
the mean pressure distributions to an accuracy of about 1o. The cylinders with D = 2, 4 and 10
mm were smoothly machined steel rods with diameter tolerances of about 0.002 mm. The
music wires (D = 0.25 and 0.50 mm) were stretched across the test section through holes in
the side walls and then clamped to the passages through the end plates. The diameters of the
music wires were measured with a microscope (Leitz Wetzlar) to an accuracy of about 2 µm.
The diameters of the cylinders with D = 2, 4 and 10 mm were calibrated against standard
reference lengths (C. E. Johansson).
7
The passages through the end plates were sealed to prevent leakage flow. Care was taken in
order to align the cylinders perpendicular to the mean flow direction.
The freestream velocity (Uo) was measured with a Pitot-static tube (United Sensor) positioned
0.77 m downstream of the grid centre-plane. The pressure differences for velocity
determination were read on a liquid manometer (Uo > ~ 5 m/s) to an accuracy of about 0.02
mm alcohol or measured with a micromanometer (Furness Control Ltd.) to an accuracy of
about 1% (1.5 m/s < Uo < ~ 5 m/s). The overall relative error in the determination of the
freestream velocity was estimated to be < 0.5% for velocities greater than 5 m/s and < 1% for
velocities less than 5 m/s. The micromanometer was employed in the measurements of mean
pressures around the cylinders. The reference pressure in the determination of the mean
pressure coefficients (CP) was taken as the static pressure from the Pitot-static tube.
In the wake surveys the hot wire (Dantec P05) and its support were mounted on a wing-
shaped profile standing on a coordinate table and a vertical mechanism grounded to the floor.
In the correlation studies the wing-shaped profile was omitted and hot wires of a smaller size
(Dantec P15) were used. The computed cross-correlation coefficients were based on 256 to
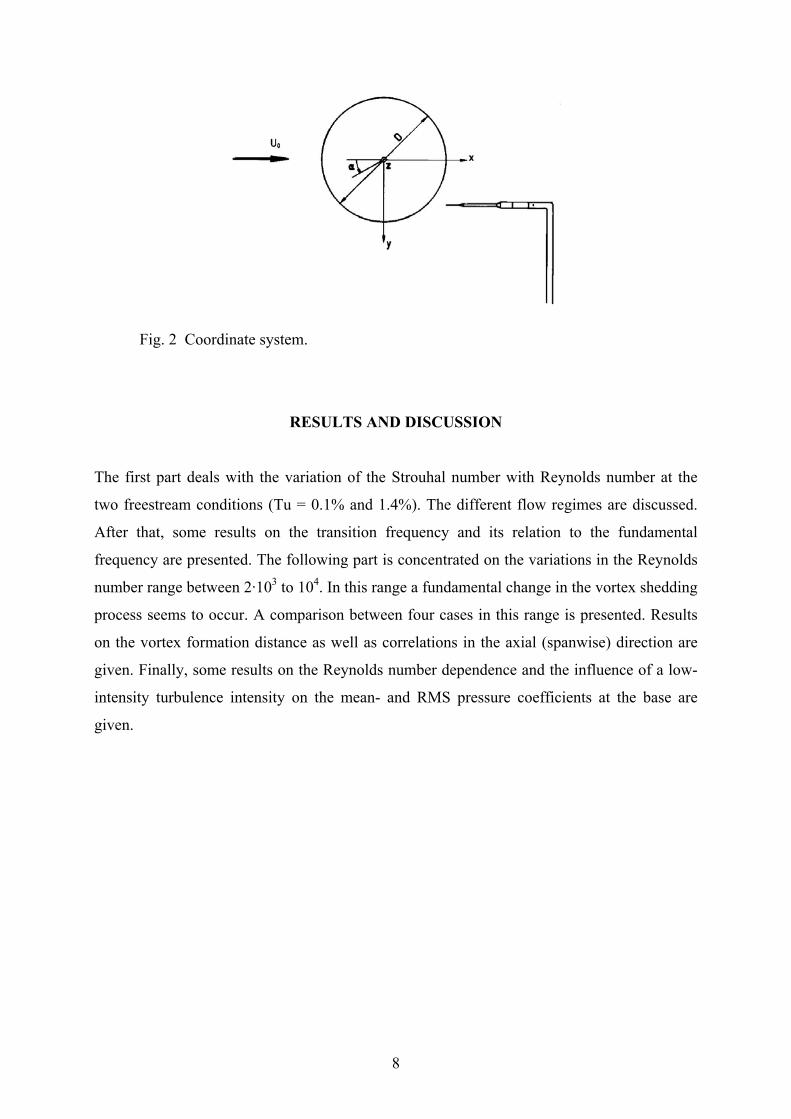
512 ksamples at each point of measuring. The origin of the coordinate system used is on the
cylinder axis mid-way between the end plates; x denotes the oncoming flow direction and y
the direction normal to the cylinder axis (downwards), see Fig. 2.
The shedding frequency (fS) was calculated from the frequency given by the arithmetic mean
of the two frequencies where the spectral level was 3 dB lower than the peak value in the
calculated spectra. The difference between the two frequencies (∆fS) was used as a measure of
the bandwidth of the peak. The analysing bandwidth was about 0.3% of the shedding
frequency for diameters up to 10 mm and about 0.2 Hz for D = 41 and 120 mm.
Further details on experimental arrangements and instrumentation can be found in [30].
8
Fig. 2 Coordinate system.
RESULTS AND DISCUSSION
The first part deals with the variation of the Strouhal number with Reynolds number at the
two freestream conditions (Tu = 0.1% and 1.4%). The different flow regimes are discussed.
After that, some results on the transition frequency and its relation to the fundamental
frequency are presented. The following part is concentrated on the variations in the Reynolds
number range between 2·103 to 104. In this range a fundamental change in the vortex shedding
process seems to occur. A comparison between four cases in this range is presented. Results
on the vortex formation distance as well as correlations in the axial (spanwise) direction are
given. Finally, some results on the Reynolds number dependence and the influence of a low-
intensity turbulence intensity on the mean- and RMS pressure coefficients at the base are
given.
9
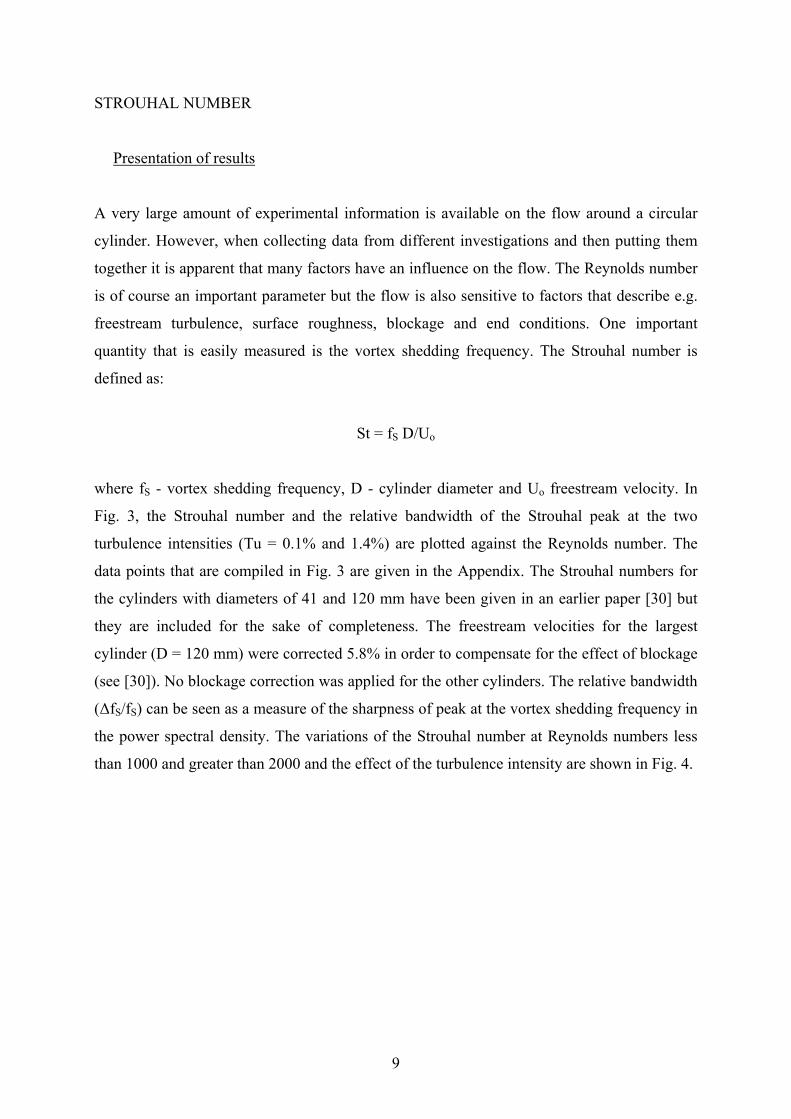
STROUHAL NUMBER
Presentation of results
A very large amount of experimental information is available on the flow around a circular
cylinder. However, when collecting data from different investigations and then putting them
together it is apparent that many factors have an influence on the flow. The Reynolds number
is of course an important parameter but the flow is also sensitive to factors that describe e.g.
freestream turbulence, surface roughness, blockage and end conditions. One important
quantity that is easily measured is the vortex shedding frequency. The Strouhal number is
defined as:
St = fS D/Uo
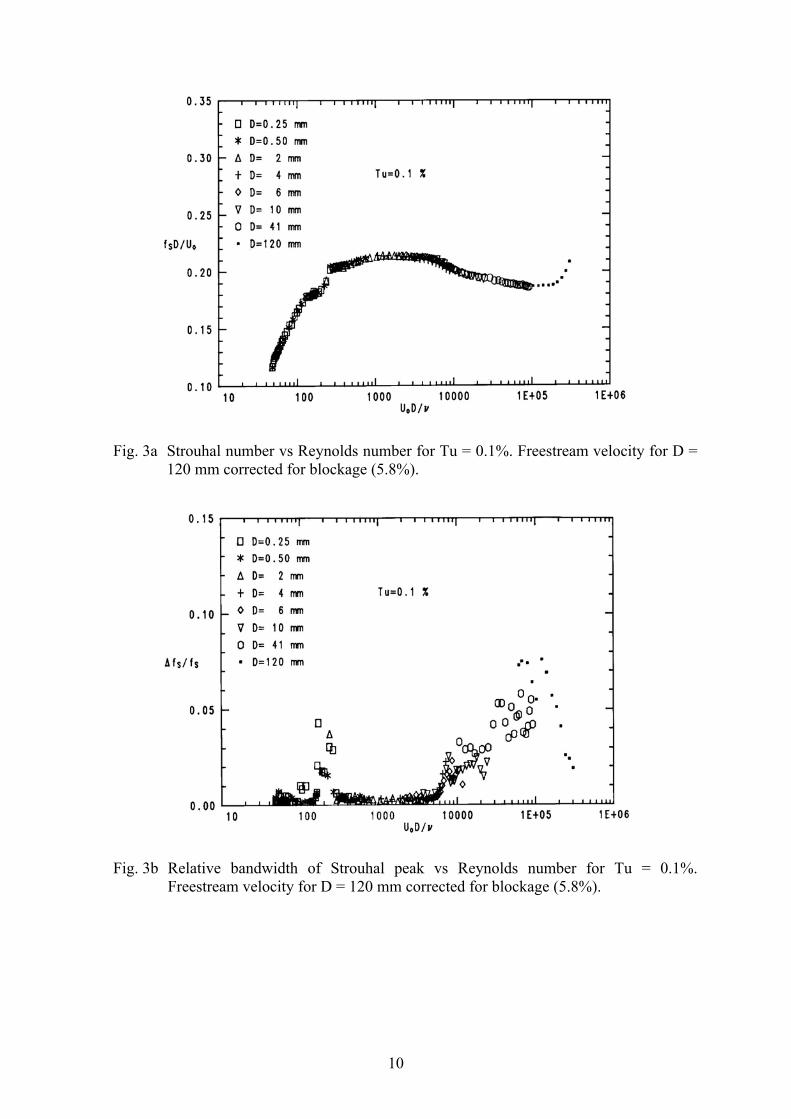
where fS - vortex shedding frequency, D - cylinder diameter and Uo freestream velocity. In
Fig. 3, the Strouhal number and the relative bandwidth of the Strouhal peak at the two
turbulence intensities (Tu = 0.1% and 1.4%) are plotted against the Reynolds number. The
data points that are compiled in Fig. 3 are given in the Appendix. The Strouhal numbers for
the cylinders with diameters of 41 and 120 mm have been given in an earlier paper [30] but
they are included for the sake of completeness. The freestream velocities for the largest
cylinder (D = 120 mm) were corrected 5.8% in order to compensate for the effect of blockage
(see [30]). No blockage correction was applied for the other cylinders. The relative bandwidth
(∆fS/fS) can be seen as a measure of the sharpness of peak at the vortex shedding frequency in
the power spectral density. The variations of the Strouhal number at Reynolds numbers less
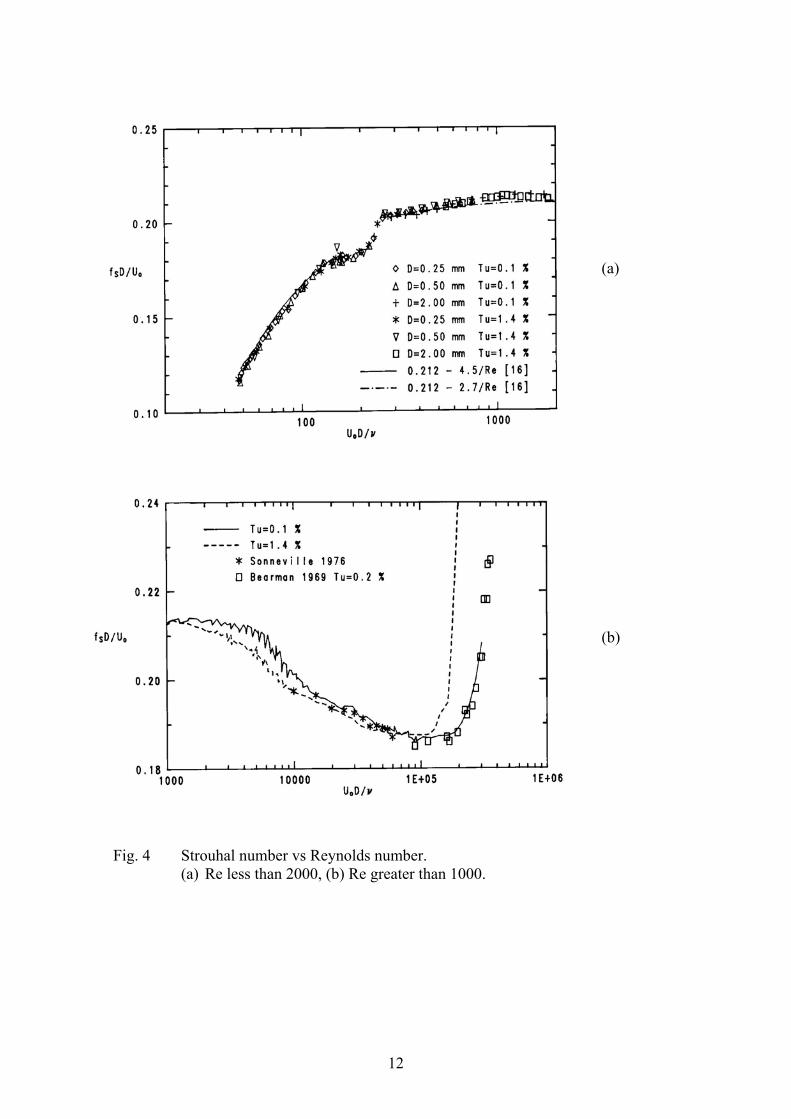
than 1000 and greater than 2000 and the effect of the turbulence intensity are shown in Fig. 4.
10
Fig. 3a Strouhal number vs Reynolds number for Tu = 0.1%. Freestream velocity for D =
120 mm corrected for blockage (5.8%).
Fig. 3b Relative bandwidth of Strouhal peak vs Reynolds number for Tu = 0.1%.
Freestream velocity for D = 120 mm corrected for blockage (5.8%).
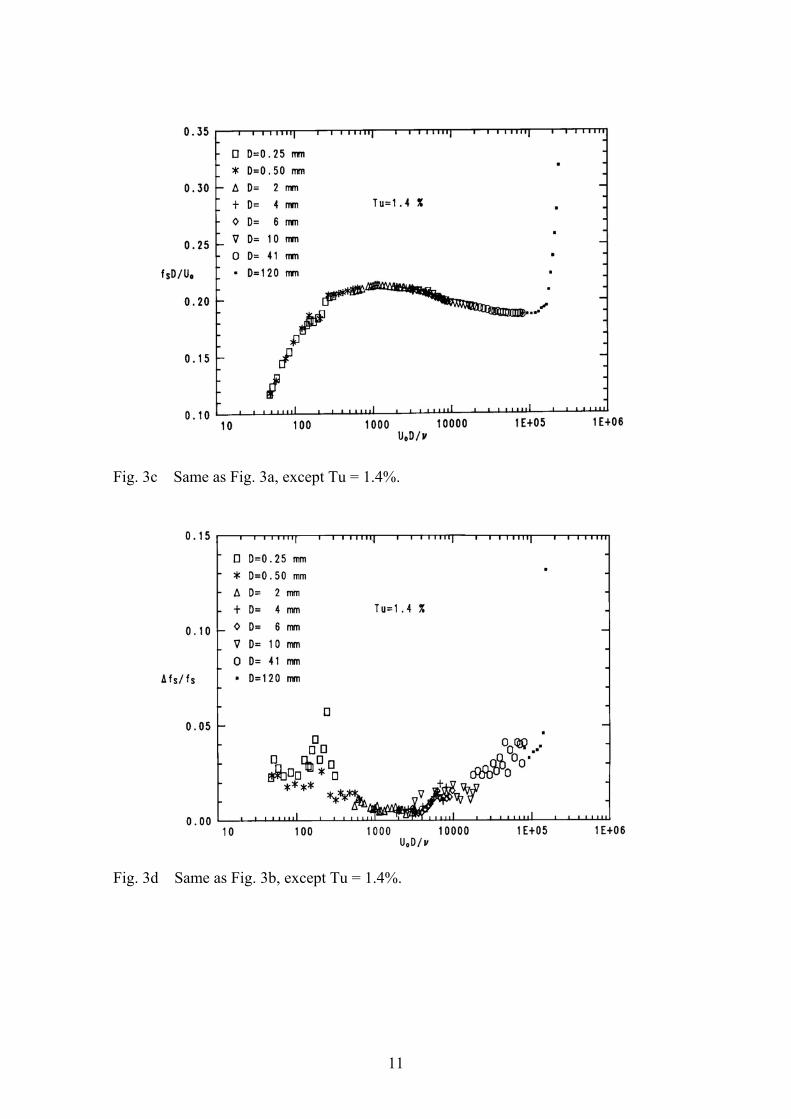
11
Fig. 3c Same as Fig. 3a, except Tu = 1.4%.
Fig. 3d Same as Fig. 3b, except Tu = 1.4%.
12
(a)
(b)
Fig. 4 Strouhal number vs Reynolds number. (a) Re less than 2000, (b) Re greater than 1000.
13
Accuracy
The maximum relative error in the determination of the Strouhal number can be estimated as:
With the accuracy of the given quantities, as given earlier, the relative error is less than 2.5%.
This value is a conservative estimate, which includes random as well as fixed (systematic)
errors. The results for the different diameters, in the overlapping regions, show an excellent
continuity. Thus, it can be expected that the fixed errors are very small. As judged from the
scatter of the data, the random errors also seem to be small (less than 1%). Thus a more
realistic estimate of the accuracy of the given Strouhal numbers is about 1.5% (total relative
error). It should be noted that the accuracy of the Strouhal frequency is determined from the
analysing bandwidth and not from the relative bandwidth of the Strouhal peak (which
amounts to several percent in some cases with a relative large scatter).
End conditions and vibration
All measurements of the Strouhal frequency in this investigation were made at the mid-span
position. The importance of end conditions has been pointed out by Gerich and Eckelmann
[7]. They concentrated on the flow at Reynolds numbers less than about 250 and found that
the cylinder end boundaries, whether they are end plates or simple free ends, alter the vortex
shedding near the boundaries. In the boundary-affected regions (6 to 15 diameters in length)
the Strouhal number was found to be 10-15% less than in the unaffected regions. Based on the
results given by Gerich and Eckelmann and available data on axial correlation lengths (see
e.g. [33]), the present aspect ratios are considered to be sufficiently large. Also the use of end
plates of proper design [8] is expected to improve the end conditions.
The Strouhal number for a vibrating cylinder, due to lock-in [34], is lower than the
corresponding value for a stationary cylinder. Only for the cylinders having D = 6 and 10 mm,
the calculated first and second mode natural frequencies were in coincidence with the
shedding frequencies. No evidence of any synchronisation behaviour was observed in these
cases. For the cylinders with diameters up to 4 mm the first and second mode natural
frequencies were much lower than the shedding frequencies. Aeroelastic coupling of the
14
vortex wake with vibration modes of high order has recently been observed by Van Atta and
Gharib [22] (Re less than 160). As discussed further below, the frequency measurements with
the music wires (D = 0.25 and 0.50 mm) indicated a very slight wake-cylinder coupling at
some occasional velocities. Nevertheless, it is believed that the present data truly represent the
case with a stationary cylinder.
Onset of vortex shedding
The critical Reynolds number, Rec, at which the vortex shedding started (i.e. the onset value
for periodic shedding) was about 48 the onset value of the Strouhal number being about
0.117, see Figs. 3 and 4a. There was no effect on Rec within the experimental accuracy, from
the different flow conditions. It is interesting to note that Camichel et al. [35], in a
visualization study dating back to 1927, found more or less the same critical values as in this
study (Rec = 47-48, St = 0.117). Kovásznay [15] found a critical value of 40 and he also noted
that the transition did not have any hysteresis. That the critical value was the same for
increasing and decreasing velocities was also observed in this investigation. Nishioka and
Sato [36] have shown that the critical Reynolds number increases with decreasing aspect ratio
and they found that Rec ≈ 48 for aspect ratios greater than about 40. The hot wire
measurements by Kohan and Schwarz [37] and Friehe [38] also indicated a critical Reynolds
number of about 50. Water visualizations by e.g. Taneda [39] and Gerrard [13] show that the
wake begins to oscillate far downstream in a sinusoidal fashion at a Reynolds number of
about 30-34 and that the alternate shedding starts at Re ≈ 45-55. The shedding seemed to be
initiated by elongations of the gathers that appear in the twin vortices behind the cylinder.
Tritton [15] denoted this type of shedding the “low-speed mode”.
Transitions in the stable regime?
Tritton observed a sudden decrease in the Strouhal number at a Reynolds number of about 90.
A visualization indicated that this “irregularity” was connected to a shift into a mode in which
the shedding came directly from the cylinder and he denoted this type of shedding the “high-
speed mode”. Berger [19] later confirmed the findings by Tritton. Gaster [21], however, did
not observe any “Tritton jumps” in his frequency measurements with a circular cylinder. In
his experiments with tapered cylinders having a circular cross section and later [40] with a
circular cylinder in non-uniform flow he found discontinuities like those observed by Tritton.
15
This lead him to the conclusion that non-uniformities in the oncoming flow are responsible
for the observations of the different flow modes. Tritton then repeated his measurements
using another apparatus [41]. He then again observed a discontinuity but now at a higher
Reynolds number (Re = 110). Transitions around a Reynolds number of 100 have been
observed in other investigations, see e.g. [13, 20, 36]. Gerrard [13] suggested that the decrease
in the base pressure coefficient around Re = 100 (see [11]) corresponds to an increase in the
flow motions in the base region and that this is an indication of that convection becomes
dominating over diffusion. Friehe [38] presented continuous recordings of the vortex
shedding frequency versus freestream velocity for a number of diameters in different flow
conditions. He found several “Tritton jumps” at different Re in the Reynolds number range 50
to 180. He noticed that in some cases the “jumps” were very small and therefore hard to
detect from the variations in the shedding frequency.
Within the experimental accuracy, the present Strouhal numbers are seen to vary continuously
with Reynolds number in the stable regime (Re less than about 160) and therefore no
conclusion about the presence of any “jumps” can be drawn, see Figs. 3 and 4a.
In the frequency measurements with the cylinders having D = 0.25 and 0.50 mm the hot wire
was situated at x/D ≈ 10, y/D ≈ 3.3. At this position the velocity variations in the stable
regime, with no additional turbulence, were regular and it was often very difficult to
distinguish the hot wire signal from the signal from a sine-wave generator. Occasionally and
only at certain velocities, the steady regular motion seemed to be slightly disturbed. Lissajous-
figures observed on an oscilloscope showed in these cases a somewhat “shaky” appearance
and a closer examination of the spectral density of the velocity fluctuations, see e.g. Fig. 5,
revealed a two-frequency behaviour.
16
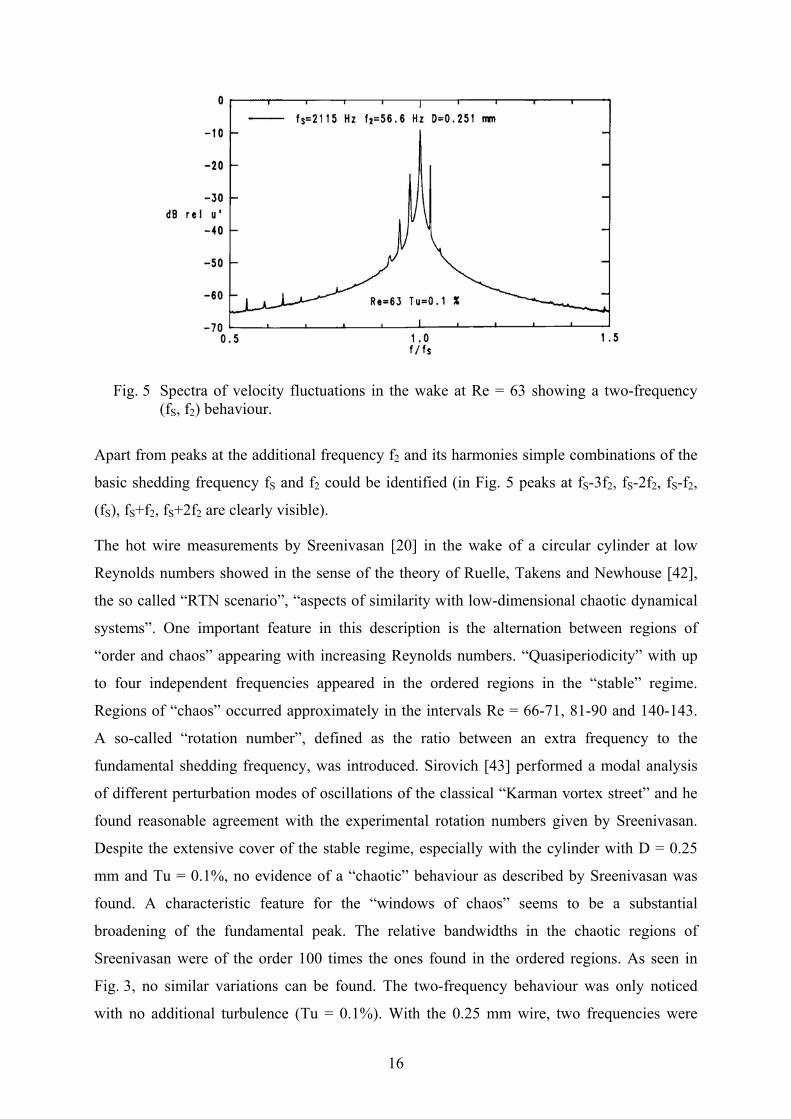
Fig. 5 Spectra of velocity fluctuations in the wake at Re = 63 showing a two-frequency
(fS, f2) behaviour.
Apart from peaks at the additional frequency f2 and its harmonies simple combinations of the
basic shedding frequency fS and f2 could be identified (in Fig. 5 peaks at fS-3f2, fS-2f2, fS-f2,
(fS), fS+f2, fS+2f2 are clearly visible).
The hot wire measurements by Sreenivasan [20] in the wake of a circular cylinder at low
Reynolds numbers showed in the sense of the theory of Ruelle, Takens and Newhouse [42],
the so called “RTN scenario”, “aspects of similarity with low-dimensional chaotic dynamical
systems”. One important feature in this description is the alternation between regions of
“order and chaos” appearing with increasing Reynolds numbers. “Quasiperiodicity” with up
to four independent frequencies appeared in the ordered regions in the “stable” regime.
Regions of “chaos” occurred approximately in the intervals Re = 66-71, 81-90 and 140-143.
A so-called “rotation number”, defined as the ratio between an extra frequency to the
fundamental shedding frequency, was introduced. Sirovich [43] performed a modal analysis
of different perturbation modes of oscillations of the classical “Karman vortex street” and he
found reasonable agreement with the experimental rotation numbers given by Sreenivasan.
Despite the extensive cover of the stable regime, especially with the cylinder with D = 0.25
mm and Tu = 0.1%, no evidence of a “chaotic” behaviour as described by Sreenivasan was
found. A characteristic feature for the “windows of chaos” seems to be a substantial
broadening of the fundamental peak. The relative bandwidths in the chaotic regions of
Sreenivasan were of the order 100 times the ones found in the ordered regions. As seen in
Fig. 3, no similar variations can be found. The two-frequency behaviour was only noticed
with no additional turbulence (Tu = 0.1%). With the 0.25 mm wire, two frequencies were
17
clearly distinctable at Re = 63 (see Fig. 5) and at Re = 131, the corresponding rotation
numbers being 0.027 and 0.020, respectively. With the 0.5 mm wire one additional frequency
was present at Re = 101 and 156 (f2/fS = 0.023 and 0.054, respectively). The rotation numbers
of Sreenivasan (given in [43]) show an increase with Reynolds number from about 0.03 at Re
= 50 to about 0.08 at Re = 110. Thus it seems that only the ratio of 0.027 at Re = 63 (Fig. 5)
compares favourable with the data of Sreenivasan. It is interesting to note that the data of
Sreenivasan shows breaks in the variation of the shedding frequency with Reynolds number in
coincidence with the windows of chaos. Similar breaks and “windows of chaos” were
apparently not present in this study. The recent paper by Van Atta and Gharib [22] has shown
that the appearance of additional frequencies and regions of “chaos” have a clear connection
to an aeroelastic coupling to excited cylinder vibration modes. The additional frequencies that
were found in the measurements by Van Atta and Gharib, at Reynolds numbers less than 160,
were all simply related to the natural frequencies of the cylinder. The broadening of the
fundamental peaks in the “windows of chaos” was found to be due to switching between
different competing coupling modes of vibration. Varying the damping of the wires could
easily change the nature and degree of the aeroelastic coupling. They also found that the
Reynolds numbers at the locations of discontinuities varied as the tension (i.e. natural
frequency) was varied. The measurements by Van Atta and Gharib suggest that the Strouhal-
Reynolds number variation, in the Reynolds number range considered, would have no
discontinuities if there were absolutely no vibration of the cylinder.
The additional frequencies for the 0.25 mm wire were 56.6 Hz and 113.2 Hz (113.2/56.6 ≈ 2)
while the additional frequencies observed with the 0.50 mm wire were 23.1 Hz and 91.6 Hz
(91.6/23.1 ≈ 4). The near integer values of the ratios support the explanation of aeroelastic
coupling given by Van Atta and Gharib. Unfortunately, the natural frequencies of the
stretched music wires were not measured directly. Nevertheless, a rough calculation, taking
the approximate tension applied into account, indicated that the fundamental vibration
frequencies were of the same order as the lowest additional frequencies (i.e. 20-60 Hz). The
fact that aeroelastic coupling is a source to irregularities in the Strouhal-Reynolds number
relation puts a question to whether real transitions actually occur in the flow around a
stationary cylinder in the stable regime. Further measurements and theoretical achievements
are needed in order to clarify this matter.
18
Tu-effects at low Re
It is important to note that the Strouhal numbers for Reynolds numbers less than about 1000,
see Fig. 4a, were unaffected by the presence of a low-intensity freestream turbulence. Thus it
must be concluded that due to the relatively large scales of the freestream turbulence at these
Reynolds numbers (see Table 1) the vortex shedding frequency varies in accordance with a
quasi-stationary process. If this is correct the variations in the vortex shedding frequency
would produce a relative bandwidth of the Strouhal peak proportional to the freestream
turbulence intensity divided by the mean Strouhal number. Apart from the increase in the
relative bandwidth in the transition regime (Re = 160 - 260), see Fig. 3, this seems to be the
case. Hussain and Ramjee [41] also noticed that freestream turbulence of moderate levels (Tu
= 0.3-8%, Λ/D ≈ 2-10) not affected the shedding frequency. It is important to point out that
the freestream turbulence might change the Strouhal number at other scales and intensities.
Proposals for Re-dependence at low Re
There exists a number of investigations on the Reynolds number - Strouhal number relation.
Table 2 summarizes some of the proposals of the relationship. They are on the form:
St = A - B/Re + C·Re
19
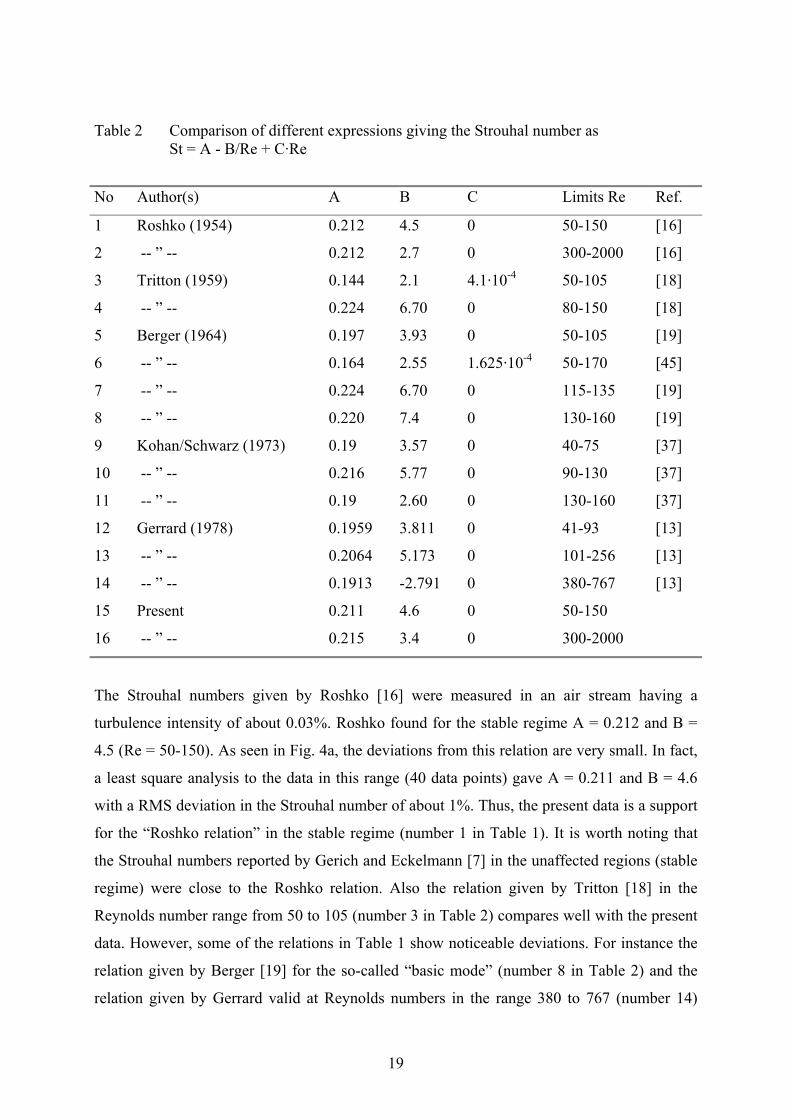
Table 2 Comparison of different expressions giving the Strouhal number as St = A - B/Re + C·Re
No Author(s) A B C Limits Re Ref.
1 Roshko (1954) 0.212 4.5 0 50-150 [16]
2 -- ” -- 0.212 2.7 0 300-2000 [16]
3 Tritton (1959) 0.144 2.1 4.1·10-4 50-105 [18]
4 -- ” -- 0.224 6.70 0 80-150 [18]
5 Berger (1964) 0.197 3.93 0 50-105 [19]
6 -- ” -- 0.164 2.55 1.625·10-4 50-170 [45]
7 -- ” -- 0.224 6.70 0 115-135 [19]
8 -- ” -- 0.220 7.4 0 130-160 [19]
9 Kohan/Schwarz (1973) 0.19 3.57 0 40-75 [37]
10 -- ” -- 0.216 5.77 0 90-130 [37]
11 -- ” -- 0.19 2.60 0 130-160 [37]
12 Gerrard (1978) 0.1959 3.811 0 41-93 [13]
13 -- ” -- 0.2064 5.173 0 101-256 [13]
14 -- ” -- 0.1913 -2.791 0 380-767 [13]
15 Present 0.211 4.6 0 50-150
16 -- ” -- 0.215 3.4 0 300-2000
The Strouhal numbers given by Roshko [16] were measured in an air stream having a
turbulence intensity of about 0.03%. Roshko found for the stable regime A = 0.212 and B =
4.5 (Re = 50-150). As seen in Fig. 4a, the deviations from this relation are very small. In fact,
a least square analysis to the data in this range (40 data points) gave A = 0.211 and B = 4.6
with a RMS deviation in the Strouhal number of about 1%. Thus, the present data is a support
for the “Roshko relation” in the stable regime (number 1 in Table 1). It is worth noting that
the Strouhal numbers reported by Gerich and Eckelmann [7] in the unaffected regions (stable
regime) were close to the Roshko relation. Also the relation given by Tritton [18] in the
Reynolds number range from 50 to 105 (number 3 in Table 2) compares well with the present
data. However, some of the relations in Table 1 show noticeable deviations. For instance the
relation given by Berger [19] for the so-called “basic mode” (number 8 in Table 2) and the
relation given by Gerrard valid at Reynolds numbers in the range 380 to 767 (number 14)
20
gave Strouhal numbers that were about 6% lower than the present data. Berger’s relation was
claimed to be valid for extremely low turbulence intensity in the free stream (Tu less than
0.05%). The deviation from Berger’s relation cannot be explained unless the origin and
perhaps the scale of the “turbulence” at these low intensities are completely different. Also the
effect on the Strouhal numbers from vibrations at small amplitudes cannot be excluded in
some of the earlier measurements. Van Atta and Gharib [22] noticed that the deviations from
the “Roshko relation” (1) were small when there was absolutely no vibration of the cylinder.
Bloor [23] noticed that the extent of the stable regime was increased when the freestream
turbulence intensity was changed from about 1% to 0.03%. Berger and Wille [26] suggested
that the different Strouhal - Reynolds number relations (see Table 2) are due to different
turbulence intensities in the oncoming flow. The present results (Tu = 0.1-1.4%) do not
support this explanation. The experiments by Gerrard were performed with cylinders towed in
still water. In this case the rather low aspect ratios used might explain the discrepancy (see
Gerich and Eckelmann [7]).
Transition regime
It is generally recognized (see Berger and Wille [26]) that the transition regime extends from
Re ≈ 150-200 to Re ≈ 300-400. As shown by Hama [46], a transverse waviness appears close
behind the cylinder at the beginning of the transitional regime. According to Bloor [23], the
transition to turbulence occurs after the vortices have rolled up, the transition mechanism
being due to a three-dimensional distortion. Definite breaks in the Strouhal number variation
occurred at Re ≈ 160 and at Re ≈ 265, see Fig. 4a. As seen in Fig. 3, these breaks are
accompanied with significant changes in the relative bandwidths. It is assumed that these
breaks distinguish the beginning and end of the transition regime. In the paper by Gerrard [13]
the transition regime is discussed in more detail.
Subcritical regime
The visualizations by Gerrard [131 show that the flow in the Reynolds number range from
about 250 to 500 changes to a mode of shedding which is similar to the “vortex formation
model” as described by Gerrard in [47]. Gerrard [13] also noted that the instabilities of the
shear layers preceding a transition to turbulence appear around Re = 350. The frequency of
the “transition waves” (see Bloor [23]) or “secondary vortices” (see Wei and Smith [24]) is
21
discussed in the following section. It appears that a change in slope in the Strouhal number
variation takes place at a Reynolds number of about 800, see Fig. 3. The significance of this
change is uncertain and further measurements are needed in order to clarify this matter.
Roshko [16] denoted the range of Reynolds number above the transition regime the “irregular
range” and he proposed a relation for the Strouhal numbers valid from Re = 300 to 2000
(relation 2 in Table 2). From Fig. 4a, it can be seen that the deviations from this relation are
small but that the present Strouhal numbers lie slightly above at Reynolds numbers greater
than about 600. A least square fit to the present data gave the relation (16) given in Table 2
(50 points, RMS deviation 0.5%).
It is evident from Fig. 4b that the Strouhal number above Re ≈ 1000 is dependent on the
turbulence intensity. The Strouhal numbers are lower at the higher turbulence intensity in the
Reynolds number range from about 103 to 105 the difference being greatest at around Re =
5·103. The Strouhal bandwidths show a marked increase at around a Reynolds number that
apparently is depending on the turbulence intensity. At Tu = 0.1% the increase starts at about
Re = 5·103 while at Tu = 1.4% the same phenomenon occurs at about 4·103, see Fig. 3. Above
these Reynolds numbers the Strouhal number decreases significantly. The high sensitivity to
freestream disturbances in this range is reflected in the curve for Tu = 0.1% in Fig. 4b. The
lower bound for this curve is due to the Strouhal numbers measured with the cylinder having
D = 4 mm (see Fig. 3a). At these Reynolds numbers, it can be suspected that the freestream
disturbance level was slightly higher at corresponding higher velocities than for the other
diameters. The whole region between the end of the transition regime at Re ≈ 300 to the
beginning of the critical regime at Re ≈ 2·105 (dependent on e.g. turbulence intensity) is often
referred to as the subcritical regime [29]. In the following the subcritical regime will be sub-
divided at about Re = 5·103 (Tu-dependent, see above) into a lower subcritical and an upper
subcritical regime. As seen in Fig. 3, the relative bandwidths in the lower subcritical regime
are much smaller than in the upper subcritical regime. It is noticeable that there seems to be a
correlation between the increasing relative bandwidths and the increase in the mean and
fluctuating forces on the cylinder in the upper subcritical regime, see [30]. In the Reynolds
number range from 103 to 104 only a few Strouhal number measurements have been reported.
The measurements by e.g. Roshko [16] are in a qualitative agreement with the present data.
There is a favourable agreement between the present Strouhal numbers at Tu = 0.1% and the
compatible measurements by Bearman [48] and Sonneville [49], see Fig. 4b. Further
discussion on the variations in the subcritical regime will be given in a later section. It is
22
noticeable that the Strouhal bandwidths, see Figs. 3b and 3d, when entering the critical
regime, show a decrease at Tu = 0.1% but an increase at Tu = 1.4%.
TRANSITION FREQUENCY
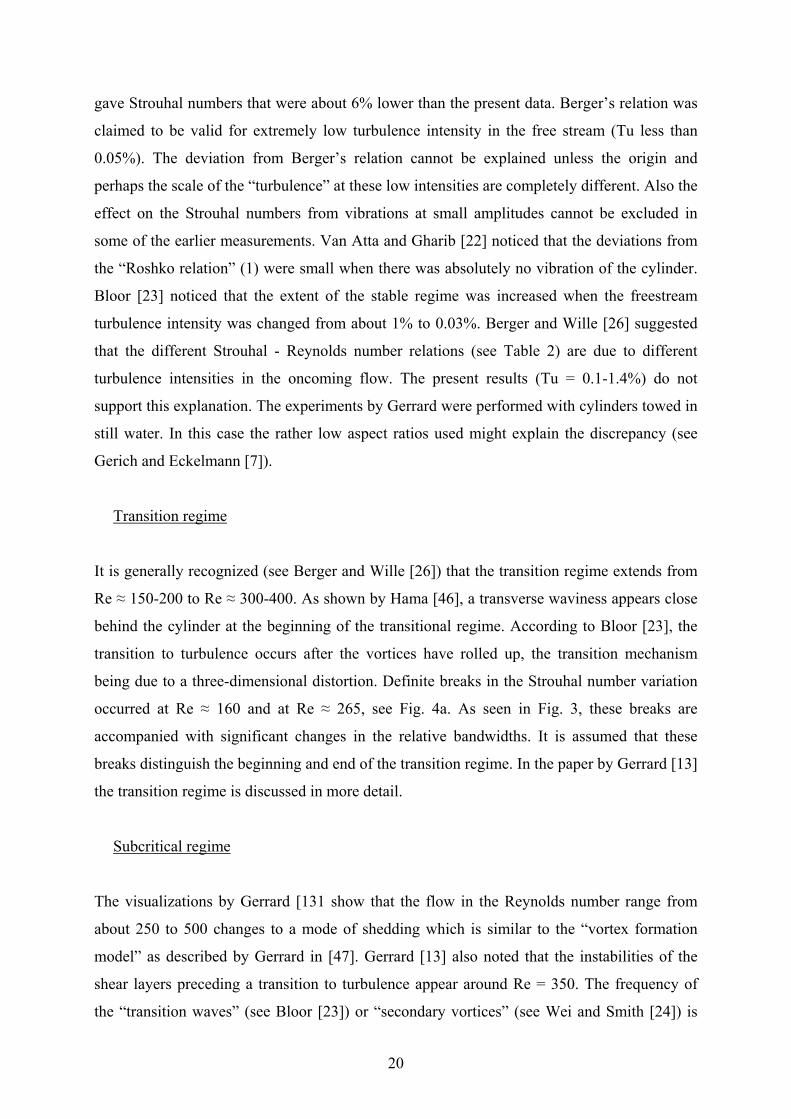
In Fig. 6, simultaneous velocity variations measured with two hot wires separated two
diameters in the axial direction (Re = 5·103 Tu = 0.1%) are shown.
Fig. 6 Traces of velocity fluctuations measured with two hot wires separated two
diameters apart in the axial direction. Note: upper trace displaced two RMS-units upwards.
Both hot wires were located at the relative position 0.5 diameters behind and 0.7 diameters
below the cylinder axis (x/D = 0.5, y/D = 0.7, see Fig. 2). At this position, evidence of the so-
called “transition waves” [23] or “secondary vortices” [24] are clearly recognized. By
counting the number of oscillation periods the transition frequency can be estimated to be
about 8 times the vortex shedding frequency in this case. However, the frequency of these
oscillations is not so well defined as the vortex shedding frequency. The appearance and the
frequency of the oscillations seem to vary from time to time. The broad-band nature of the
shear layer oscillations can be seen in Fig. 7.
23
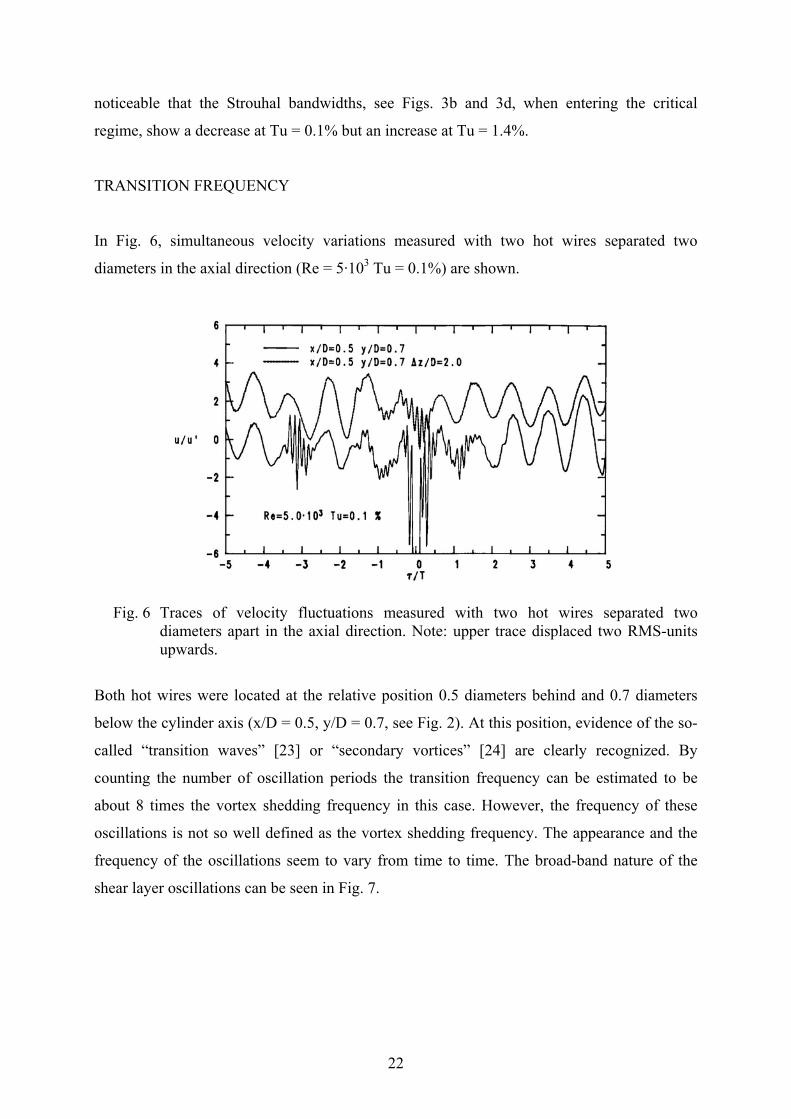
Fig. 7 Spectra of velocity fluctuations at x/D = 0.6, y/D = 0.7 for Tu = 0.1%, D = 6 mm.
It is evident from Fig. 7 that the ratio of the transition frequency to the shedding frequency
increases with Reynolds number. The broadening of the peaks at fS and 2·fS when passing Re
= 5·103 is also evident from this figure. The center frequency of the shear layer oscillations
(fT) was determined in the same way as for the vortex shedding frequency (arithmetic mean
between the two frequencies where the levels are 3 dB down from the peak value). The
present measurements were restricted to the case with Tu = 0.1% (D = 6 and 41 mm) and the
ratios found are shown in Fig. 8. With additional freestream turbulence the center frequencies
were in some cases difficult to determine from the spectra. It was however noticed, in the
cases in which it was possible, that the influence of the turbulence intensity was negligible
(i.e. within the experimental accuracy).
24
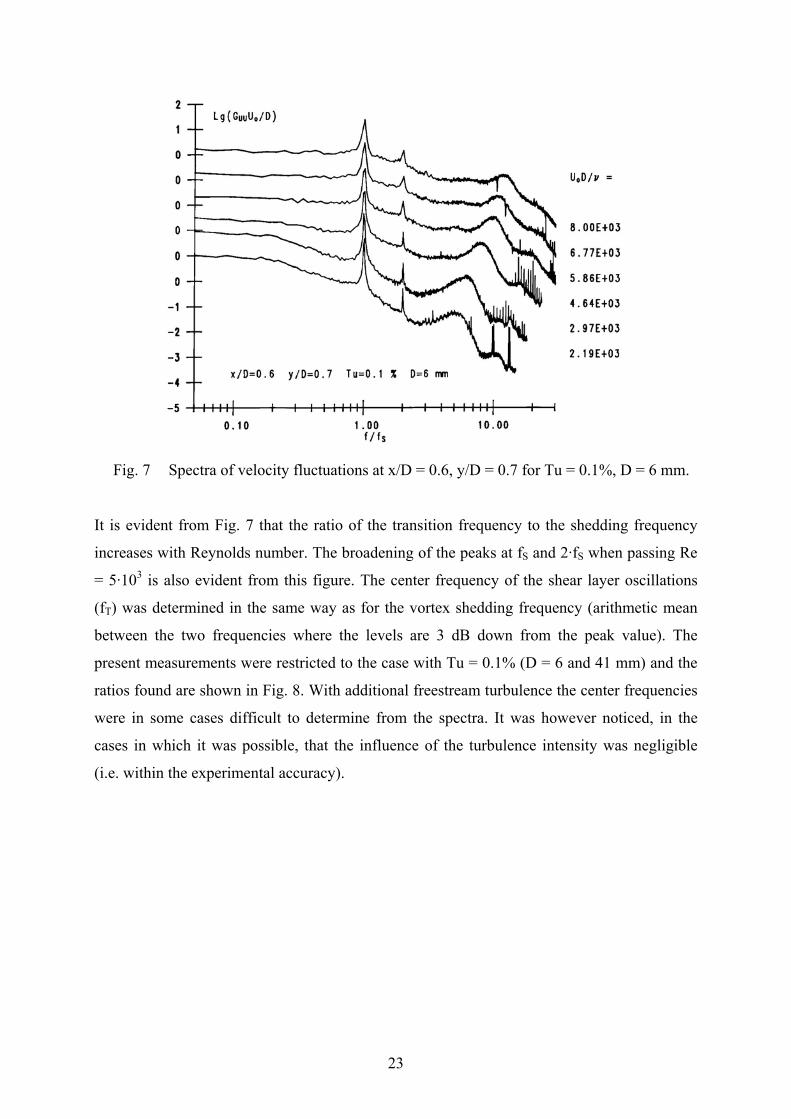
Fig. 8 Transition frequency to Strouhal frequency vs Reynolds number.
1Flow-visualization, 2Hot wire data [24].
Bloor [23] found that the ratio fT/fS appeared to be proportional to the square root of the
Reynolds number, i.e., fT/fS ~ Re0.5. This relationship was justified by the following
arguments: (i) transition frequency scales on the ratio between the freestream velocity and the
boundary layer thickness; fT ~ Uo/δ, (ii) δ/D ~ Re0.5 (see e.g. [50]) and (iii) fS ~ Uo/D
(Strouhal number relatively constant). The recent measurements by Wei and Smith [24]
indicate, however, that fT/fS is proportional to a power of the Reynolds number greater than
0.5. They found a 0.87 power relation from flow-visualization observations and a 0.77 power
relation from hot wire measurements, see Fig. 8. They also noted that a regression fit to the
data points reported by Bloor [23], see Fig. 8, actually gave a 0.73 power relation. They
argued that it was more reasonable to expect that the transition frequency should scale on the
momentum thickness characteristic for the middle of the linear growth region of the shear
layers. Unal and Rockwell [51] found, using this scaling, that the vortex formation, at least up
to Re = 5040, was in accordance with linear stability theory [52]. In addition to the data
presented in Fig. 8, Unal and Rockwell reported fT/fS ≈ 8 at Re = 5040. The present ratios
indicate that the exponent in a fitted power relation changes with Reynolds number; the
increase (or exponent in a power relation) being greatest at Re ~ 5·103. Extrapolating the
present data, as given in Fig. 8, up to Re = 105 would give a ratio of about 40. This value is
much lower than the value 60 reported by Maekawa and Mizuno [53] at this Reynolds
number. The hot wire measurements by Peterka and Richardson [54] and later by Yamanaka
25
et al. [55] were concentrated on the high sensitivity to (acoustical) disturbances at frequencies
around the transition frequency; a phenomenon which was first noticed by Gerrard [10].
Peterka and Richardson observed a sub-harmonic peak in the velocity spectra measured in the
shear layer when the forcing was applied around the (natural) transition frequency. They did
not observe any sub-harmonic peak with no forcing applied. Some evidence of a raised
spectral level around a frequency at fT/2 can be found in the spectra at the higher Re in Fig. 7.
There is also evidence (perhaps more clear) of peaks at frequencies around 2·fT (1st
harmonic). The existence of sub-harmonics and harmonics may imply that the vortical
structures interact in a non-linear way and according to Peterka and Richardson the most
probable mechanism behind sub-harmonic peaks is vortex fusion. It is noticeable that no
evidence of a non-linear coupling between the vortex shedding frequency and the transition
frequency are seen in the spectra. Interactions between the “secondary vortices” and the
fundamental vortices as well as feedback mechanisms between the “secondary vortices” were
observed by Wei and Smith [24]. Wei and Smith hypothesized that the initial development of
the “secondary vortices” is due to a three-dimensional distortion of an initially straight line
vortex filament in a way similar to the mechanism described by Hama [56]. It is quite
remarkable that similar interactions as some of those observed by Wei and Smith, which
apparently have strong three-dimensional ingredients, were observed in the numerical study
by Braza et al. [57] (two-dimensional computation). Gerrard [13] observed that the “transition
waves” were in phase on the two sides of the wake but also in phase along the length of the
cylinder. However, the evidence (flow-visualization) for the phase-match in the spanwise
direction was not totally convincing (at least not to the author of this paper!). The flow-
visualizations by Wei and Smith [24], see also [58], show the existence of “axial vortex pairs”
or “spanwise pockets” [58] whose extent in the axial direction decreased with increasing Re.
It is reasonable to believe that the coupling of these structures in the axial direction also
decreases with increasing Re. The measurements with two hot wires separated in the axial
direction, see Fig. 6, showed that the bursts originating from the “secondary vortices” or the
“transition waves” only in occasional cases were felt simultaneously and the probability for
coincidence decreased drastically with increasing axial separation. As pointed out by Wei and
Smith [24], the variations felt by a stationary probe might be misleading when trying to
investigate structures which develop in space in a complicated way. It appears that the
different phenomena related to the transition mechanisms in the shear layers and the coupling
to the vortex shedding process need further elucidation.
26
MEASUREMENTS IN THE SUBCRITICAL REGIME
The investigation by Schiller and Linke [59] dating back to 1933 was the first to show that
large changes occur in the near wake behind a circular cylinder in the Reynolds number range
from about 103 to 104. They found a substantial reduction in size of the “dead air space”
behind the cylinder with increasing Re in this region. This reduction was accompanied by an
upstream movement of the position of laminar to turbulent transition in the shear layers.
These findings were later confirmed by Bloor [23]. That the flow in this region is highly
sensitive to disturbances, especially if they match the transition frequency, was demonstrated
by Gerrard [10]. Also, the freestream turbulence was shown to be of great importance, see
also [11]. It is therefore not surprising that the data reported in this sensitive Reynolds number
range show a large scatter and it is quite clear that further measurements are needed.
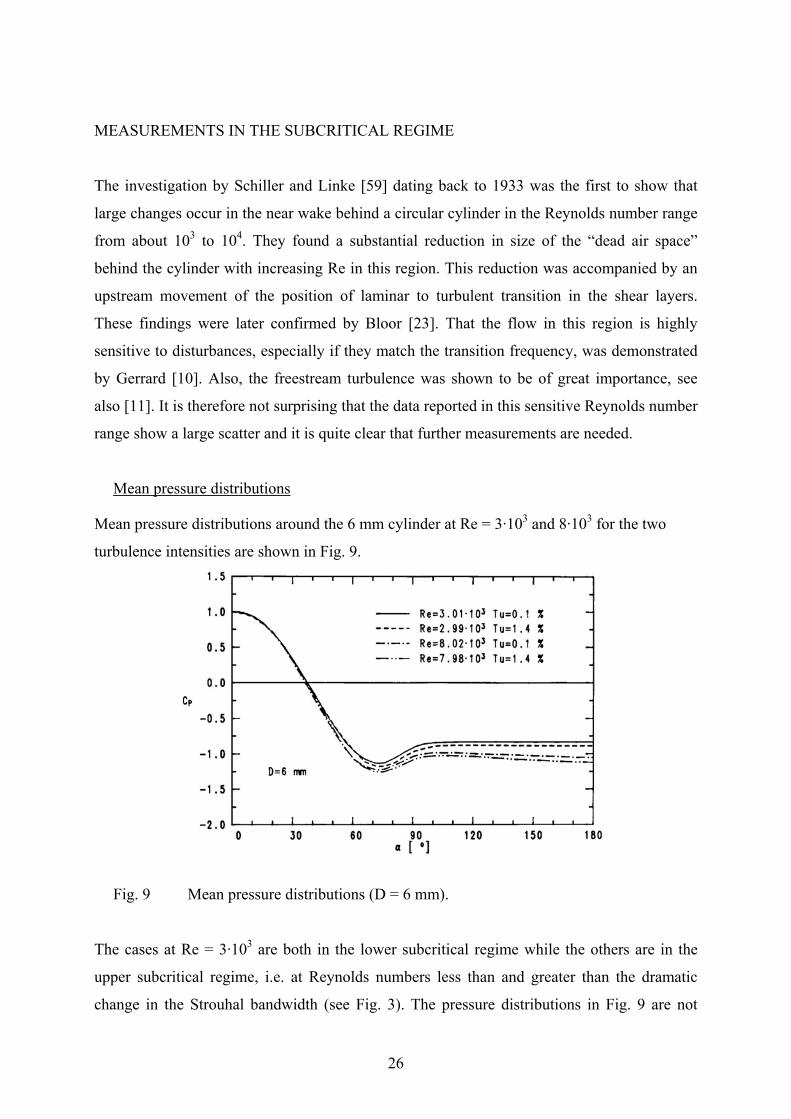
Mean pressure distributions
Mean pressure distributions around the 6 mm cylinder at Re = 3·103 and 8·103 for the two
turbulence intensities are shown in Fig. 9.
Fig. 9 Mean pressure distributions (D = 6 mm).
The cases at Re = 3·103 are both in the lower subcritical regime while the others are in the
upper subcritical regime, i.e. at Reynolds numbers less than and greater than the dramatic
change in the Strouhal bandwidth (see Fig. 3). The pressure distributions in Fig. 9 are not
27
corrected for either blockage or finite angle resolution. The effects of blockage are small for
this diameter. For instance the correction method of Allen and Vincenti [60] gave a maximum
correction of the freestream velocity of less than 0.3%. The corresponding maximum
corrections for the mean drag coefficient (CDp) and the base pressure coefficient (CPb) were
0.6% and 1.2%, respectively. The angle occupied by the pressure tap was 7.7o in this case and
this will of course modify the pressure averaging especially in regions with strong pressure
gradients. With this angular resolution the measurements by Schiller and Linke [59] indicated
that the angle (α) should be reduced by about 1.6o on the frontal part. Regarding the individual
effects of Re and turbulence intensity on the CP-distributions a division into three angular
regions around the cylinder is appropriate. Up to about 30 degrees from the stagnation point
(α = 30o) the mean pressure coefficients are more or less identical. In the region α ≈ 30o-60o
the mean pressure coefficients are lower at the higher Reynolds number the effect of the
turbulence intensity being negligible. Finally, in the region between α = 60o to α = 180o, the
effects of both Reynolds number and turbulence intensity are substantial. The base pressure
coefficients (CPb) at Re = 8·103 were about 25% lower than at Re = 3·103 and an increase in
the turbulence intensity at the two Reynolds numbers gave a decrease in CPb of 6-7%. The
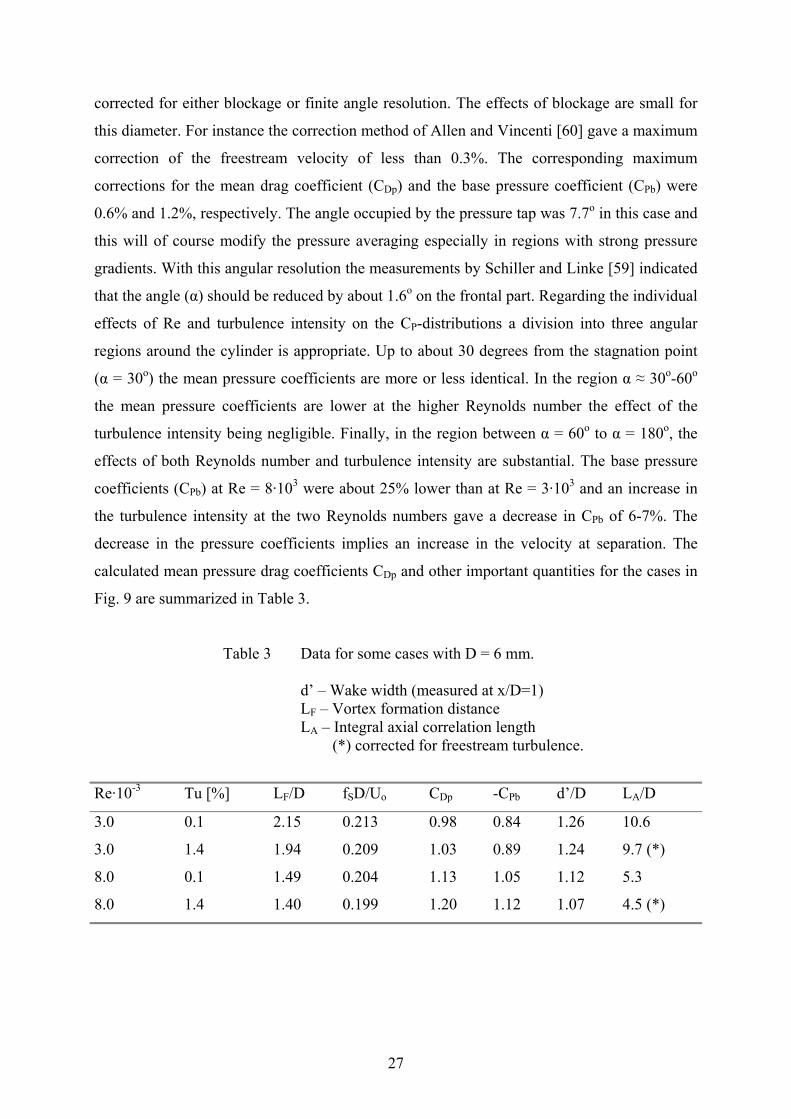
decrease in the pressure coefficients implies an increase in the velocity at separation. The
calculated mean pressure drag coefficients CDp and other important quantities for the cases in
Fig. 9 are summarized in Table 3.
Table 3 Data for some cases with D = 6 mm. d’ – Wake width (measured at x/D=1) LF – Vortex formation distance LA – Integral axial correlation length (*) corrected for freestream turbulence.
Re·10-3 Tu [%] LF/D fSD/Uo CDp -CPb d’/D LA/D
3.0 0.1 2.15 0.213 0.98 0.84 1.26 10.6
3.0 1.4 1.94 0.209 1.03 0.89 1.24 9.7 (*)
8.0 0.1 1.49 0.204 1.13 1.05 1.12 5.3
8.0 1.4 1.40 0.199 1.20 1.12 1.07 4.5 (*)
28
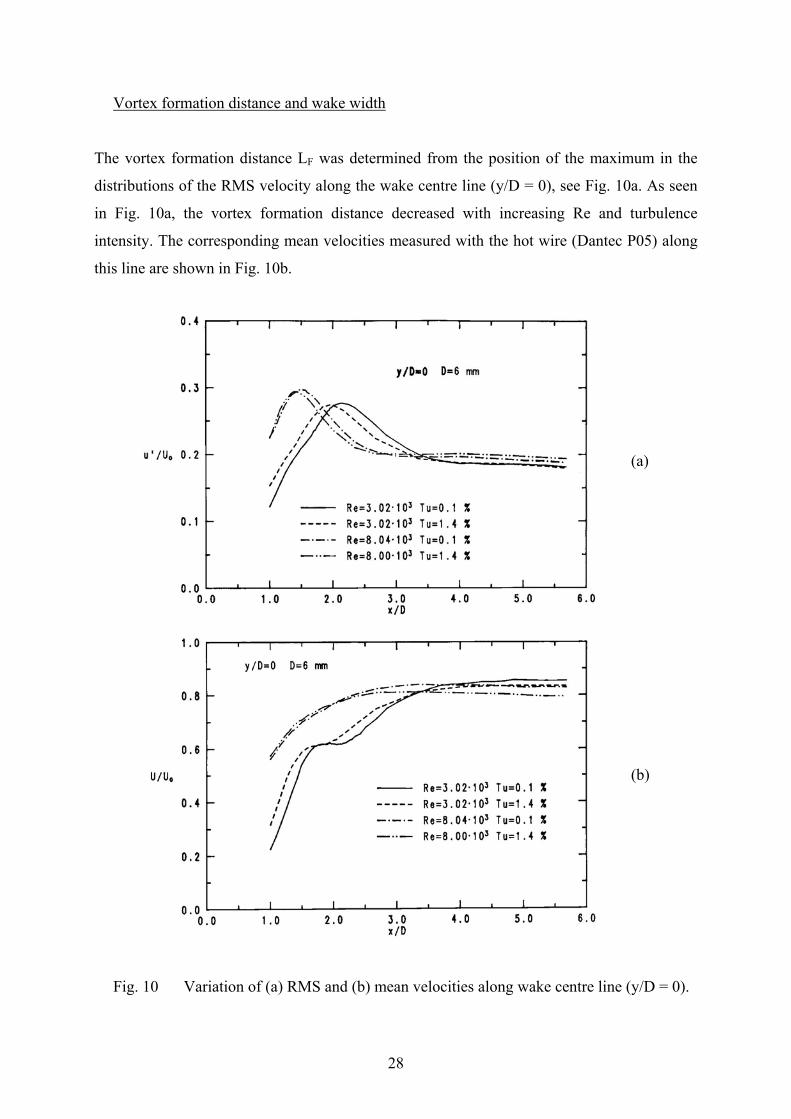
Vortex formation distance and wake width
The vortex formation distance LF was determined from the position of the maximum in the
distributions of the RMS velocity along the wake centre line (y/D = 0), see Fig. 10a. As seen
in Fig. 10a, the vortex formation distance decreased with increasing Re and turbulence
intensity. The corresponding mean velocities measured with the hot wire (Dantec P05) along
this line are shown in Fig. 10b.
(a)
(b)
Fig. 10 Variation of (a) RMS and (b) mean velocities along wake centre line (y/D = 0).
29
It is noticeable that only the cases at Re = 3·103 show a plateau at a constant mean velocity in
a region upstream of the position of the maximum RMS velocity. It is suspected that this
behaviour is related to fundamental changes in the vortex shedding process. The so-called
near-wake is generally defined as the region in which interactions between the cylinder and
the separated flow occur [11]. After the vortex formation in the near-wake the vortices are
convected downstream. As a consequence of the convection only minor changes of measured
quantities in the streamwise direction are to be expected. The variations along the wake centre
line, see Fig. 10, suggest that the near-wake region extends to about 1.5 diameters
downstream of the vortex formation point (x = LF).
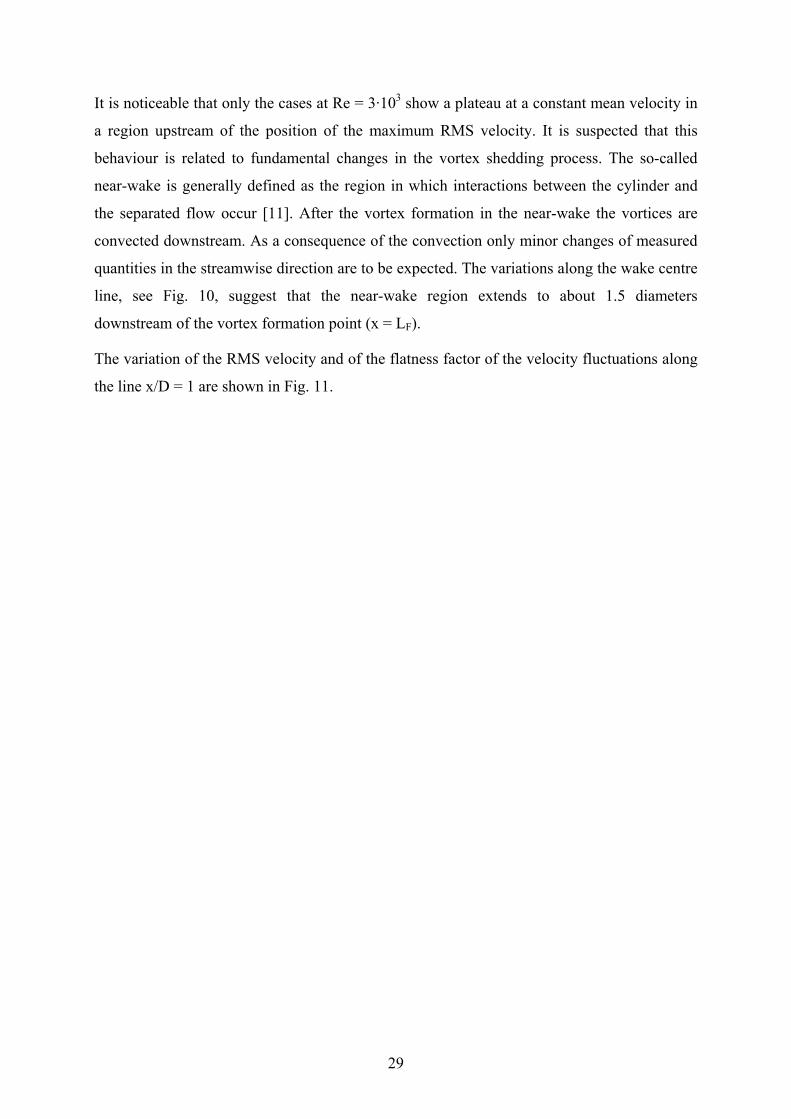
The variation of the RMS velocity and of the flatness factor of the velocity fluctuations along
the line x/D = 1 are shown in Fig. 11.
30
(a)
(b)
Fig. 11 Variation of (a) RMS (u’) and (b) flatness factor (F) of velocity fluctuations at x/D = 1.
A slight difference between the two sides of the wake was anticipated from the asymmetry
enforced by the probe support. However, only minor changes in the levels were noticed and
the positions of extreme values were perfectly symmetric with respect to the oncoming flow
direction. It should be pointed out that the absolute values, especially in the recirculating
regions, should be treated with caution. The distance between the positions of the maximum
in the RMS distributions at x/D = 1 was used as an estimate for the wake width (d’) at this
31
location. This wake width appears to have a similarity with the wake width as determined
from Roshko’s “notched hodograph theory” [61]. The decrease in d'/D with increasing Re and
Tu is related to the decrease in the vortex formation length. Boundary layer calculations using
the experimental pressure distributions in Fig. 9 indicated that the separation occurred at α ≈
80o. It was noticed that the increase in Re and Tu gave a slight reduction in the separation
angle. As seen in Table 2 the Strouhal number decreased slightly with decreasing vortex
formation length. The reduction in LF/D (and d'/D) together with an increase in the velocity at
separation imply an increase in the Strouhal number [62]. Gerrard [47] introduced the so-
called diffusion length in order to explain the observed Strouhal number variation. He argued
that the diffusion length, which is a measure of the width of the separated shear layers, is
expected to increase with decreasing LF/D and thus a balance between these scales explains
the relative constancy of the Strouhal numbers. The intermittent nature of the velocity
fluctuations in the outer parts of the shear layers is reflected in the high values of the flatness
factor in these regions. The position of the maximum of this factor can be used as an estimate
for the outer limit of the shear layer [31]. As seen in Fig. 11b, this position was more or less
the same for the different cases (y/D ≈ 0.72). In [31] the difference between the positions of
maximum flatness factor and maximum RMS-velocity at constant x/D was used as a measure
for the width of the shear layer. As seen in Fig. 11, this width increases with decreasing LF/D.
In Fig. 12 some earlier measurements of the vortex formation distance are collected together
with the present data.
Fig. 12 Vortex formation length vs Reynolds number.
32
The vortex formation lengths in Fig. 12 from the paper by Gerrard [13] were determined from
the points closest to the cylinder at which irrotational fluid crosses the wake centre line (flow
visualization). It has been shown by Bloor and Gerrard [63] that this definition is compatible
with the definition used in this paper (same as in [30, 64, 65]). The data of Gerrard, see
Fig. 12, suggest that the vortex formation length has a minimum in the transition regime. The
formation lengths of Bloor [23] and Schiller and Linke [59] are in general agreement with the
data compiled in Fig. 12. It appears that the formation length has a maximum of about 3
diameters at a Reynolds number slightly above 103. It then decreases rather rapidly up to
about Re = 104. The effect of the higher turbulence intensity is to accelerate this process. The
vortex formation length levels out at a value of about 1.2 diameters in the upper end of the
subcritical regime. Gerrard [47] has shown that the shrinking of the formation region is
related to the upstream movement of the position of transition in the shear layers. The vortex
formation length is also closely related to the base pressure coefficient CPb; a decrease in LF
increases the curvature of the streamlines associated with vortex formation thus producing a
decrease of the base pressure. As seen in Table 2 the relative changes of these quantities are
of the same magnitude, see also Figs. 12 and 15.
Some rationale for the sub-division of the subcritical regime at about Re = 5·103 can be found
from the dramatic changes in the RMS lift coefficient and in the Strouhal bandwidth at around
this Reynolds number, see e.g. [33] and Fig. 3. Gerrard [47] noted that the decrease in LF/D
could only explain a part of the observed changes in the RMS lift coefficient. This lead him to
suggest a possible fundamental change in the mode of vortex formation. He speculated on the
possibility that the vortex sheets might develop independently of each other at Reynolds
numbers below the transition. In that case the fluctuating lift on the cylinder should attain
small values because the transverse momentum flux may be balanced by fluid motions rather
than from body forces [13]. Blevins [25] found that the vortex shedding in the upper
subcritical regime seems to consist of strings of coherent cyclic events, which have
frequencies that wander about the mean vortex shedding frequency. This explains the
increased Strouhal bandwidth at these Reynolds numbers. Another important feature in the
upper subcritical regime is the large amplitude modulations of the signals associated with
vortex shedding. It has been suggested, see e.g. [66], that the pulsations are due to slow
variations in the size of the formation region. The soundness of this explanation can be found
from the fact that the frequency associated with large amplitudes seems to be lower than in
the intervals with lower amplitudes, see e.g. [25, 34].
33
Axial correlations
The measurements by Leehey and Hanson [67] indicated that the axial correlation decreases
significantly at Reynolds numbers from about 3·103 to 104. Prendergast [68] and el-Baroudi
[69] have presented axial correlations in the Reynolds number range 104 to 105, which showed
that the axial correlation increases slightly up to about Re = 5·104 and then decreases when
approaching the critical regime at higher Re. It was decided to further investigate the axial
correlations and to see whether any fundamental changes occur when going from the lower to
the upper subcritical regime. The correlation measurements were carried out using two hot
wires (Dantec P15) at various separations in the axial direction. The signals were band-pass
filtered with a low cut-off frequency of 1 Hz and a high cut-off frequency approximately
equal to 2.5·Uo/D. One hot wire was held stationary while the other was movable in all
directions. With the 6 mm cylinder the hot wires were positioned at x/D = 0.4, y/D = 0.9 and
at x/D = 0.0, y/D = 0.57 with the 41 mm cylinder. At these positions, outside the shear layers,
the velocity fluctuations contain a component that is directly related to the freestream
turbulence (RMS velocity = t’). If one assumes that the fluctuating velocity due to the
freestream turbulence is uncorrelated with the remaining velocity fluctuations (RMS velocity
= v') then the measured cross-correlation coefficient ρ12 between the two stations can be
written as:
)r1/()( 2t12
2v1212
−− ++= ρρρ r
where t12ρ and v
12ρ are the cross-correlation coefficients between the two stations due to the
freestream turbulence and due to the remaining flow components, respectively; r is the signal-
to-noise ratio defined as the ratio between the RMS values for the two components (r = v'/t’,
(u')2 = (v')2 + (t')2, u’ = RMS velocity at the hot wire position). It is evident from the
expression above that it is desirable to have a large signal-to-noise ratio in order to reduce the
influence from the freestream turbulence. In the real situation a coupling between the
components is likely but it is reasonable to assume that this coupling is small for the cases
investigated (i.e. at the present relative positions of the hot wires). For the cases with Tu =
0.1% the effects from the freestream turbulence on the measured correlation coefficients were
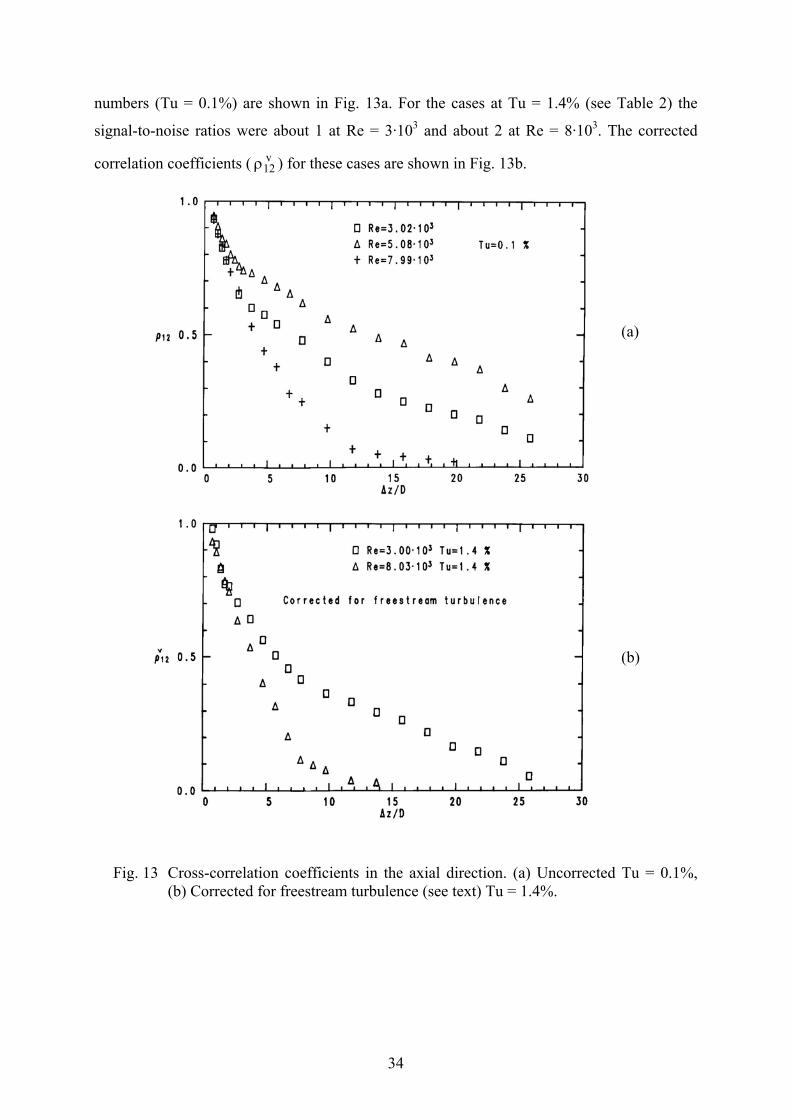
considered negligible (r >10). Uncorrected axial correlation coefficients at three Reynolds
34
numbers (Tu = 0.1%) are shown in Fig. 13a. For the cases at Tu = 1.4% (see Table 2) the
signal-to-noise ratios were about 1 at Re = 3·103 and about 2 at Re = 8·103. The corrected
correlation coefficients ( v12ρ ) for these cases are shown in Fig. 13b.
(a)
(b)
Fig. 13 Cross-correlation coefficients in the axial direction. (a) Uncorrected Tu = 0.1%, (b) Corrected for freestream turbulence (see text) Tu = 1.4%.
35
The correlation coefficient t12ρ was estimated using the longitudinal integral length scale Λ
(Λ/D = 2, see Table 1) [70]:
Λ∆−Λ∆−≈ /t
12 e)2/1( zzρ
The integral axial correlation lengths LA (one-sided) were calculated for the different cases in
Fig. 13. In the cases with finite correlation at the maximum separation distance (∆z/D = 26)
the data had to be extrapolated in order to obtain the integral axial correlation length. For the
case at Re = 5·103, Tu = 0.1% (not included in Table 3) a noticeable high degree of phase
uniformity along the axis was found (LA/D = 16.2).
It is also noticeable that the correlation coefficients for the upper subcritical cases at Re =
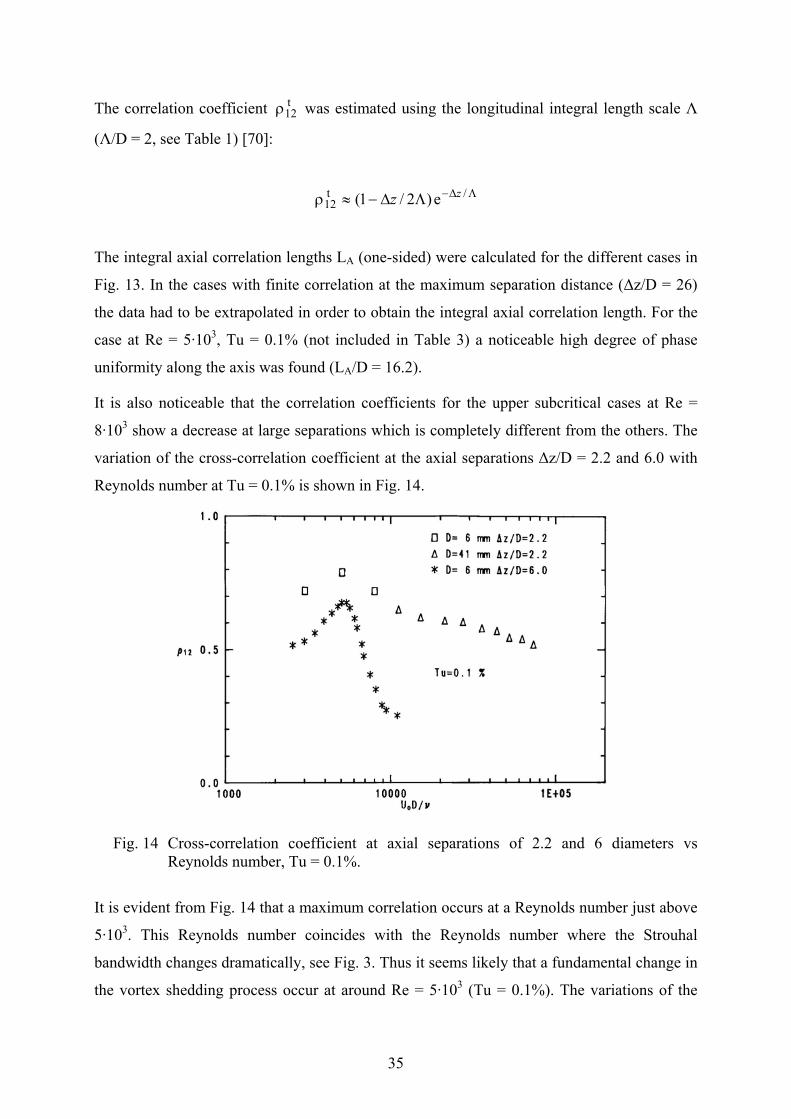
8·103 show a decrease at large separations which is completely different from the others. The
variation of the cross-correlation coefficient at the axial separations ∆z/D = 2.2 and 6.0 with
Reynolds number at Tu = 0.1% is shown in Fig. 14.
Fig. 14 Cross-correlation coefficient at axial separations of 2.2 and 6 diameters vs
Reynolds number, Tu = 0.1%.
It is evident from Fig. 14 that a maximum correlation occurs at a Reynolds number just above
5·103. This Reynolds number coincides with the Reynolds number where the Strouhal
bandwidth changes dramatically, see Fig. 3. Thus it seems likely that a fundamental change in
the vortex shedding process occur at around Re = 5·103 (Tu = 0.1%). The variations of the
36
correlations at fixed axial separations with additional freestream turbulence (Tu = 1.4%) were
not explored in detail. It is reasonable to believe that similar variations as those shown in
Fig. 14 occur at the higher turbulence intensity. The only fundamental differences are
expected to be a shift to lower Reynolds numbers and a lowering of the maximum value. The
nature of the flow mechanism responsible for the seemingly fundamental changes at Re ≈
5·103 (Tu = 0.1%) and Re ≈ 4·103 (Tu =1.4%) is not fully understood at the present time. It
looks as if the vortex shedding changes from one mode that is correlated over very large axial
distances with a well-defined frequency to a mode in which the shedding frequency changes
with time the axial correlations being much smaller. A deeper understanding of the change in
the vortex shedding mode cannot be expected until the time we know much more about the
three-dimensional features in the flow mechanisms at both high and low Reynolds numbers in
the subcritical regime.
The measurements by Leehey and Hanson [67] indicated a steady decrease in the axial
correlation length in the Reynolds number range around 5·103. In their case the cylinder was
forced to vibrate but the amplitude of the cylinder vibration was less than 3% of the diameter
in the worst case (at third harmonic resonance). It was believed that the cylinder vibration was
insufficient to cause any increase in the correlation length. The present correlation lengths at
Tu = 1.4% (corrected) are in reasonable agreement with the data of Leehey and Hanson
although they reported a turbulence intensity of about 0.04%. The large discrepancy between
the present data at Tu = 0.1% and the data of Leehey and Hanson especially concerning the
presence of a maximum correlation at around Re = 5·103 is intriguing. In the mounting
arrangement of Leehey and Hanson the cylinder was exposed to uniform flow except within
the shear layers of the open-jet. They reported that the thickness of the shear layer was about
8 cylinder diameters. The length exposed to uniform flow was however about 80 diameters
but the effect of end conditions might still be crucial especially regarding the three-
dimensional aspects of the flow. It is worth noting that Leehey and Hanson measured a
negative correlation at large axial separations (Re = 6.05·103). This seemingly erroneous
behaviour was not observed in the present measurements. Nevertheless, the same principal
variations regarding the decay of the axial correlations at different Reynolds numbers is
evident from the additional data of Leehey and Hanson as given in [33].
The variation of the cross-correlation coefficient for ∆z/D = 2.2, see Fig. 14, indicates that the
axial correlation length is relatively constant (slowly decreasing) at Reynolds numbers
between say 104 and 105. The measurements by Prendergast [68] (correlations between the
37
wall pressures at the shoulder of the cylinder) indicated an increase in LA/D from about 3 at
Re = 3·104 to about 4 at Re = 9·104. El-Baroudi [69] found from velocity correlations at the
shoulder an increase in LA/D from about 3 at Re = 104 to about 6 at 5·104. A decrease in the
correlation length with increasing Re in the upper subcritical regime has been reported by
Kacker et al. [71], Bruun and Davies [72] and Sonneville [49]. Thus it appears that more
measurements on the axial correlations are needed in the subcritical regime. One problem in
the conventional way of measuring a cross-correlation is the effects due to extraneous noise.
In some cases the cross-correlations can be corrected afterwards (see above) and in some
cases a suitable filtering might solve the problem. In any case it must be specified which
components in the flow the cross-correlation should be based on. If it is possible to sort out
the components in the frequency domain the use of coherence functions [25] or band-pass
filters might be effective.
BASE PRESSURE COEFFICIENTS
Mean base pressure coefficient
Roshko and Fiszdon [11] presented an overall view on various transition phenomena that
occur in the flow around a circular cylinder. The basis of their discussion was the existing
data (up to 1969) on the variation of the Strouhal number and of the (mean) base pressure
coefficient. In particular, a comparison between their own data and data of Gerrard [10] on
CPb in the Re range from 103 to 105 was presented. The comparison clearly demonstrated the
sensitivity to the freestream turbulence intensity but there was also a noticeable effect of the
cylinder diameter. As plausible reasons for the diameter effect they mentioned the scale of
turbulence and effects of the wall constraints. In 1982, West and Apelt [73] presented data on
the separate effects of blockage and aspect ratio in the Re range from 104 to 105. They found
that a reduction in the aspect ratio (end plates were used) gave similar effects on e.g. CPb as an
increase in the blockage. The effects of the aspect ratio seemed to be more prominent at the
lower end of the Re range considered (i.e. near Re = 104). This is consistent with the
decreasing axial correlations with Re found in this investigation, see Fig. 14. The present
results on the base pressure coefficient can be found in Fig. 15.
38
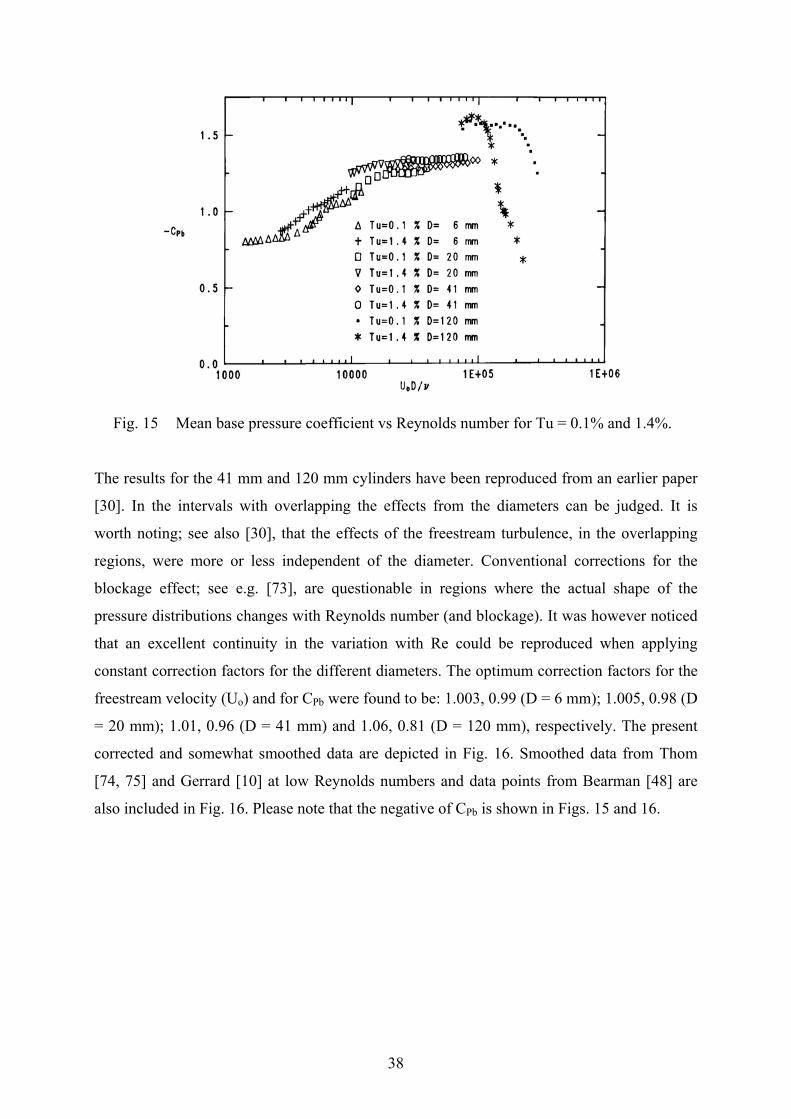
Fig. 15 Mean base pressure coefficient vs Reynolds number for Tu = 0.1% and 1.4%.
The results for the 41 mm and 120 mm cylinders have been reproduced from an earlier paper
[30]. In the intervals with overlapping the effects from the diameters can be judged. It is
worth noting; see also [30], that the effects of the freestream turbulence, in the overlapping
regions, were more or less independent of the diameter. Conventional corrections for the
blockage effect; see e.g. [73], are questionable in regions where the actual shape of the
pressure distributions changes with Reynolds number (and blockage). It was however noticed
that an excellent continuity in the variation with Re could be reproduced when applying
constant correction factors for the different diameters. The optimum correction factors for the
freestream velocity (Uo) and for CPb were found to be: 1.003, 0.99 (D = 6 mm); 1.005, 0.98 (D
= 20 mm); 1.01, 0.96 (D = 41 mm) and 1.06, 0.81 (D = 120 mm), respectively. The present
corrected and somewhat smoothed data are depicted in Fig. 16. Smoothed data from Thom
[74, 75] and Gerrard [10] at low Reynolds numbers and data points from Bearman [48] are
also included in Fig. 16. Please note that the negative of CPb is shown in Figs. 15 and 16.
39
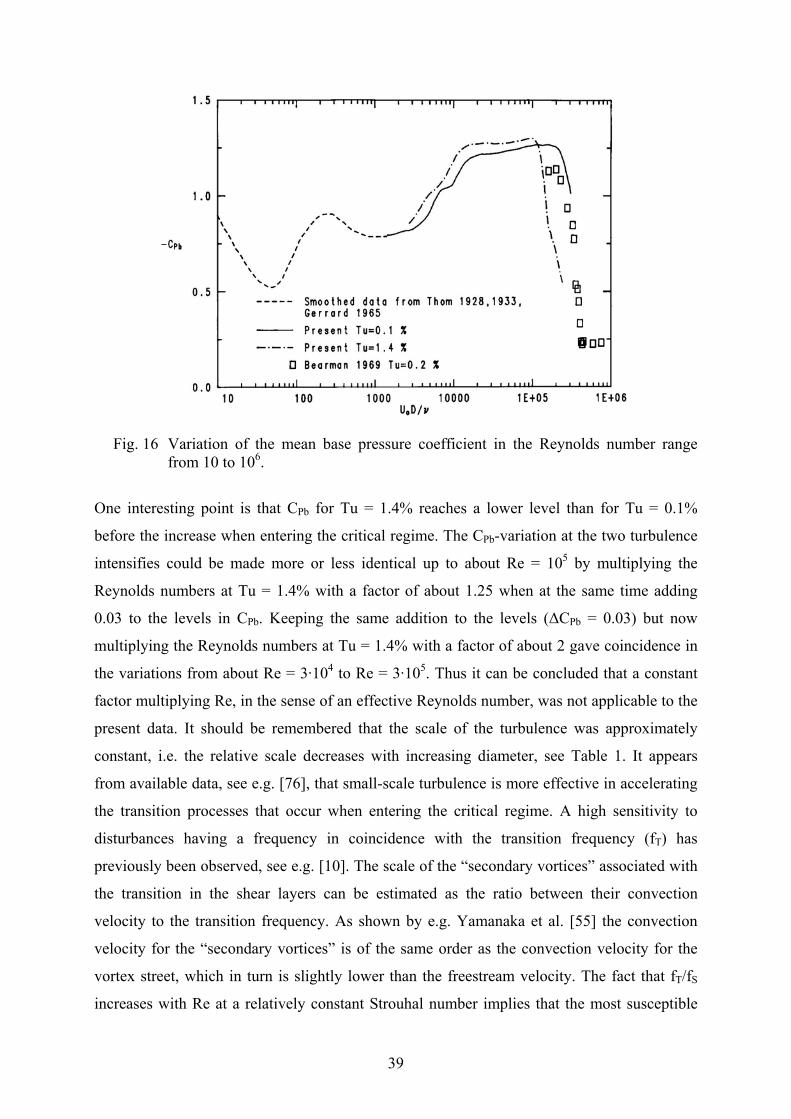
Fig. 16 Variation of the mean base pressure coefficient in the Reynolds number range
from 10 to 106.
One interesting point is that CPb for Tu = 1.4% reaches a lower level than for Tu = 0.1%
before the increase when entering the critical regime. The CPb-variation at the two turbulence
intensifies could be made more or less identical up to about Re = 105 by multiplying the
Reynolds numbers at Tu = 1.4% with a factor of about 1.25 when at the same time adding
0.03 to the levels in CPb. Keeping the same addition to the levels (∆CPb = 0.03) but now
multiplying the Reynolds numbers at Tu = 1.4% with a factor of about 2 gave coincidence in
the variations from about Re = 3·104 to Re = 3·105. Thus it can be concluded that a constant
factor multiplying Re, in the sense of an effective Reynolds number, was not applicable to the
present data. It should be remembered that the scale of the turbulence was approximately
constant, i.e. the relative scale decreases with increasing diameter, see Table 1. It appears
from available data, see e.g. [76], that small-scale turbulence is more effective in accelerating
the transition processes that occur when entering the critical regime. A high sensitivity to
disturbances having a frequency in coincidence with the transition frequency (fT) has
previously been observed, see e.g. [10]. The scale of the “secondary vortices” associated with
the transition in the shear layers can be estimated as the ratio between their convection
velocity to the transition frequency. As shown by e.g. Yamanaka et al. [55] the convection
velocity for the “secondary vortices” is of the same order as the convection velocity for the
vortex street, which in turn is slightly lower than the freestream velocity. The fact that fT/fS
increases with Re at a relatively constant Strouhal number implies that the most susceptible
40
scale of turbulence decreases with Re. For instance the value of fT/fS ≈ 40 at Re = 105, see
Fig.8, would give a most susceptible scale of about 0.1 diameters. This is about the same
relative scale as for the 120 mm cylinder; see Table 1. Also interactions with other scales in
the flow, for instance relevant scales in the near wake and scales in the spanwise direction,
might be important in the transition mechanisms involved.
The smoothed variation of CPb at Reynolds numbers less than about 103, see Fig. 16, is rather
tentative due to the large scatter of the data reported in this region. Nevertheless, the extreme
values seem to be in coincidence with major transitions in the flow. For instance the base
pressure coefficient appears to have a local maximum at around the onset of vortex shedding
at Re ≈ 50 and a local minimum in the transition regime. The reader is referred to the papers
by Roshko and Fiszdon [11] and Gerrard [13] for a more complete discussion about the
variations at these Reynolds numbers.
The variation of CPb at Re greater than about 103 generally follows the variation of the vortex
formation length; see Fig. 12. It appears however that the rate of change in CPb is slowed
down at around a Reynolds number slightly above the limit between the lower and upper
subcritical regime. The observed CPb-variation might be a reflection of that the axial
correlation as well as the vortex formation length changes substantially in this Reynolds
number range. The change to a slow variation of CPb with increasing Re occurs at about Re =
104.At this stage the transition point in the shear layer has reached a position quite close to the
cylinder [23]. The upstream movement of the transition continues with increasing Re but at a
decreased rate; the transition has almost reached the separation point at the upper end of the
subcritical regime.
In the so-called precritical regime [28] the separation moves downstream with increasing Re
and as a consequence the base pressure coefficient increases, the wake becomes narrower and
the Strouhal number increases. In the so-called paracritical regime [28] the laminar separation
is followed by a separation bubble, reattachment and subsequent turbulent separation.
Evidence of that the separation bubble only forms at one side which results in a steady lift
force on the cylinder have been reported in a number of investigations, see e.g. [48, 77, 78].
As demonstrated by Schewe [79] the asymmetric behaviour is very sensitive to disturbances
in the flow. Schewe interpreted the symmetry breaks with jumps to different critical flow
states with associated hysteresis effects as so-called subcritical bifurcations [78]. As noted in
[30] the present case at Tu = 1.4% did not appear to have similar breaks in the symmetry. This
was believed to be a result of a smearing effect due to the small-scale turbulence. In other
41
words the equilibrium flow states and how they change with changes in the leading parameter,
i.e. the Reynolds number, may be completely different when considering cases with different
flow conditions (e.g. freestream turbulence, surface roughness, ...). It is worth noting that both
the present CPb- and Strouhal number variations at Tu = 0.1%, Re < 3·105 compare favourable
with the results of Bearman [48], see Figs. 4b and 16. Bearman did observe asymmetric flow
in the critical regime at Re > 3·105 but limitations in the tunnel speed did not permit
measurements at such high Reynolds numbers in the present case (D = 120 mm).
RMS base pressure coefficient
The RMS pressure coefficient CP’ is defined as the ratio between the RMS value of the wall
pressure fluctuations to the dynamic pressure. The variation of CP’ around the cylinder for
some cases with the 41 mm and 120 mm cylinders in the subcritical regime (Tu = 0.1%,
1.4%) and in the critical regime (Tu = 1.4%) can be found in [30]. The variation of the RMS
pressure coefficient at α = 180o (CPb’) with Reynolds number at the two turbulence intensities
are shown in Fig. 17. Corrections for blockage have been applied to the freestream velocities
(same corrections as in Fig. 16) but not to the CPb’-values. The expected increase in CPb’ due
to an increase in blockage is evident in the overlapping regions of the 20 mm and 41 mm
cylinders but not in the corresponding joints between the 41 mm and 120 mm cylinders. As
shown in an earlier paper [31] about 35 % of the fluctuation energy in the base region comes
from frequencies less than 0.1·Uo/D. At Re ≈ 105 the value of 0.1·Uo/D is about 11 Hz for the
120 mm cylinder. The low-frequency limit of the microphones used (B & K type 4135) was
about 3 Hz (-3 dB). Thus it can be inferred that the CPb’- values measured with the 120 mm
cylinder are to low in the lower end of the Reynolds number range with this diameter.
Without taking this effect in consideration the maximum relative error in these measurements
was estimated to be less than 3% [30].
42
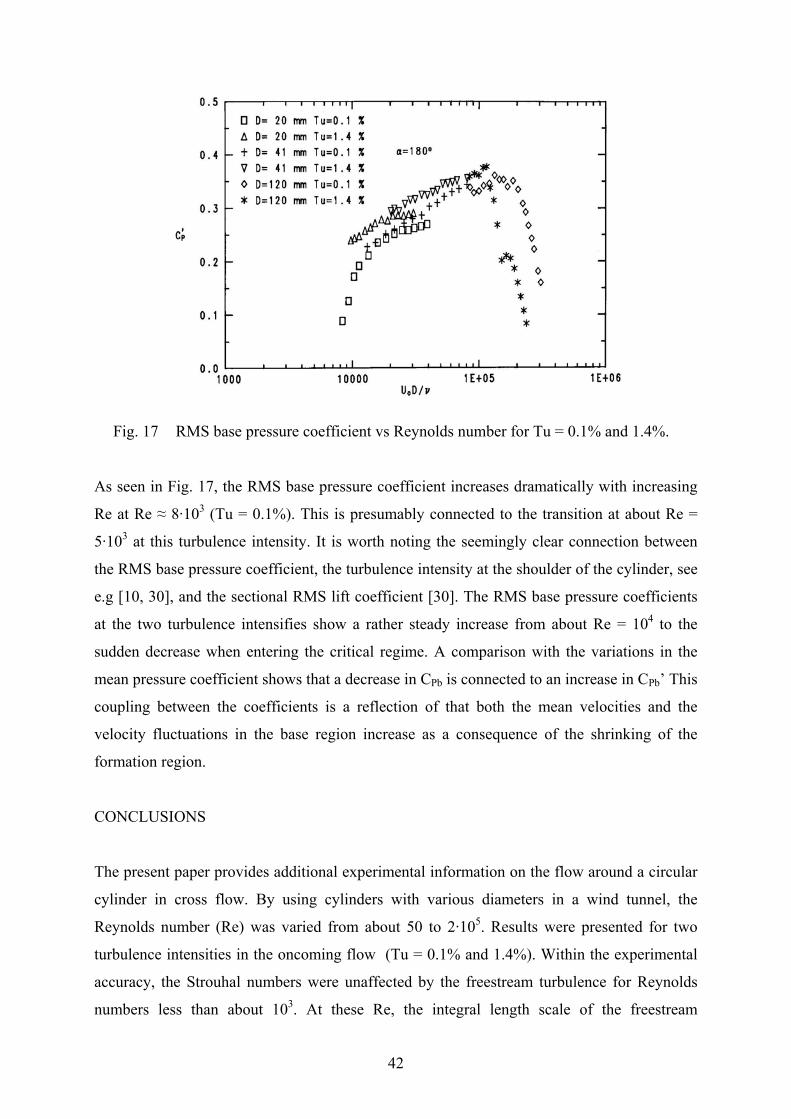
Fig. 17 RMS base pressure coefficient vs Reynolds number for Tu = 0.1% and 1.4%.
As seen in Fig. 17, the RMS base pressure coefficient increases dramatically with increasing
Re at Re ≈ 8·103 (Tu = 0.1%). This is presumably connected to the transition at about Re =
5·103 at this turbulence intensity. It is worth noting the seemingly clear connection between
the RMS base pressure coefficient, the turbulence intensity at the shoulder of the cylinder, see
e.g [10, 30], and the sectional RMS lift coefficient [30]. The RMS base pressure coefficients
at the two turbulence intensifies show a rather steady increase from about Re = 104 to the
sudden decrease when entering the critical regime. A comparison with the variations in the
mean pressure coefficient shows that a decrease in CPb is connected to an increase in CPb’ This
coupling between the coefficients is a reflection of that both the mean velocities and the
velocity fluctuations in the base region increase as a consequence of the shrinking of the
formation region.
CONCLUSIONS
The present paper provides additional experimental information on the flow around a circular
cylinder in cross flow. By using cylinders with various diameters in a wind tunnel, the
Reynolds number (Re) was varied from about 50 to 2·105. Results were presented for two
turbulence intensities in the oncoming flow (Tu = 0.1% and 1.4%). Within the experimental
accuracy, the Strouhal numbers were unaffected by the freestream turbulence for Reynolds
numbers less than about 103. At these Re, the integral length scale of the freestream
43
turbulence was relatively large compared to the cylinder diameters. The results on the
corresponding bandwidths of the shedding frequency (∆fS) suggest that the shedding
frequency (fS) responds instantaneously to the velocity variations imposed by the freestream
turbulence (“quasi-stationary flow”).
Regardless of the turbulence intensity, the Reynolds number at which the vortex shedding
started was about 48, the onset value of the Strouhal number being 0.117. The present
Strouhal numbers were found to vary continuously with Re in the stable regime. The results
indicated that the transition regime extended from Re ≈ 160 to Re ≈ 265. The relative
bandwidth (∆fS/fS) increased up to a maximum of about 5% in the transition regime.
The present Strouhal number data were compared with some existing proposals for the
Strouhal - Reynolds number relationship. The present data was found to be a support for the
so-called “Roshko relation” in the stable regime.
In the Reynolds number range from about 2·103 to 5·104 (Tu = 0.1%) some data on the ratio
between the shear layer transition frequency to the shedding frequency were given. The
present data indicated that the increase of the ratio with Re was greatest at Re ~ 5·103.
At Reynolds numbers greater than about 103 the flow was dependent on the turbulence
intensity. For instance, the Strouhal numbers were lower at the higher turbulence intensity in
the Re-range from about 103 to 105 the difference being greatest around Re = 5·103.
The flow seemed to exhibit a basic change at a Reynolds number of about 5·103 (4·103 with
turbulence). A sub-division of the subcritical regime at this Reynolds number is proposed. At
the boundary between the so-called lower and upper subcritical regimes the relative
bandwidth changed by about one order of magnitude. In addition, the axial correlations
appeared to have a local maximum at this Re. Probably, the vortex shedding changes from
one mode that is correlated over large axial (spanwise) distances with a well-defined
frequency to a mode in which the shedding frequency varies with time, the axial correlations
being much smaller. Further measurements are needed in order to clarify the apparent change
in the mode of vortex shedding.
In the beginning of the upper subcritical regime the axial correlations showed a rapid decrease
with increasing Re. Also the mean and RMS base pressure coefficients changes dramatically
in this region. In the Reynolds number range from about 104 to the end of the subcritical
regime at around 2·105 (1·105 with turbulence) both the mean and RMS base pressure
44
coefficients show a rather slow variation with Re; the coefficients (absolute values) at Tu =
1.4% being greater than those at Tu = 0.1%.
ACKNOWLEDGEMENTS
The present project is a part of the Swedish contribution to the International Energy Agency
(IEA) - cooperative work on Heat Transfer and Heat Exchangers, Annex III Tube Vibration.
The project is financially supported by the National Swedish Board for Technical
Development (STU). The author also wishes to thank Dr Bengt Sundén for valuable
discussions and supervision during the course of this study.
REFERENCES
1 Strouhal, V., Ueber eine besondere Art der Tonerregung, Ann. Phys. und Chemie,
Neue Folge, Vol. 5, No. 10, pp. 216-251 (1878)
2 Richardson, E. G., Aeolian tones, Proc. Phys. Soc. London, Vol. 36, pp. 153-167
(1924)
3 Bénard, H., Formation de centres de giration à l’arrière d’un obstacle en mouvement,
Acad. Sci. Comptes Rendus (Paris), Vol. 17, pp. 839-842 (1908)
4 von Kármán, T. and Rubach, H., Über den Mechanismus des Flüssigkeits- und
Luftwiderstandes, Phys. Zeitschrift, Vol. 13, No. 2, pp. 49-59 (1912)
5 Bénard, H., Sur les écarts des valeurs de la fréquence des tourbillons alternés par
rapport à la loi de similitude dynamique, Acad. Sci. Comptes Rendus (Paris), Vol. 183,
pp. 20-22 (1926)
6 Lord Rayleigh, Aeolian tones, Phil. Mag. Ser. 6, Vol. 29, pp. 433-444 (1915)
7 Gerich, D. and Eckelmann, H., Influence of end plates and free ends on the shedding
frequency of circular cylinders, J. Fluid Mech., Vol. 122, pp. 109-121 (1982)
8 Stansby, P. K., The effects of end plates on the base pressure coefficient of a circular
cylinder, Aeronautical Journal, Vol. 78, pp. 36-37 (1974)
9 Fage, A. and Warsap, J. H., The effects of turbulence and surface roughness on the
drag of a circular cylinder, ARC Reports and Memoranda No. 1283 (1929)
10 Gerrard, J. H., A disturbance-sensitive Reynolds number range of the flow past a
circular cylinder, J. Fluid Mech., Vol. 22, Part 1, pp. 187-196 (1965)
45
11 Roshko, A. and Fiszdon, W., On the persistence of transition in the near-wake, in
Problems of Hydrodynamics and Continuum Mechanics, Philadelphia, pp. 606-616
(1969)
12 Homann, F., Einfluβ groβer Zähigkeit bei Strömung um Zylinder, Forsch. Ing. -Wes.,
Vol. 7, No. 1, pp. 1-10 (1936)
13 Gerrard, J. H., The wakes of cylindrical bluff bodies at low Reynolds number, Phil.
Trans. Roy. Soc. (London) Ser. A, Vol. 288, No. 1354, pp. 351-382 (1978)
14 Coutanceau, M. and Bouard, R., Experimental determination of the viscous flow in the
wake of a circular cylinder in uniform translation. Part 1. Steady flow, J. Fluid Mech.,
Vol. 79, Part 2, pp. 231-256 (1977)
15 Kovásznay, L. S. G., Hot-wire investigation of the wake behind cylinders at low
Reynolds numbers, Proc. Roy. Soc. (London) Ser. A, Vol. 198, pp. 174-190 (1949)
16 Roshko, A., On the development of turbulent wakes from vortex streets, NACA Report
1191 (1954)
17 Schaefer, J. W. and Eskinazi, S., An analysis of the vortex street generated in a viscous
fluid, J. Fluid Mech., Vol. 6, pp. 241-260 (1959)
18 Tritton, D. J., Experiments on the flow past a circular cylinder at low Reynolds
numbers, J. Fluid Mech., Vol. 6, Part 4, pp. 547-567 (1959)
19 Berger, E., Die Bestimmung der hydrodynamischen Gröβen einer Kármánschen
Wirbelstraβe aus Hitzdrahtmessungen bei kleinen Reynoldsschen Zahlen, Zeitschrift
Flugwiss., Vol. 12, No. 2, pp. 41-59 (1964)
20 Sreenivasan, K. R., Transition and turbulence in fluid flows and low-dimensional
chaos, in Frontiers in Fluid Mechanics, Springer-Verlag, pp. 41-67 (1985)
21 Gaster, M., Vortex shedding from slender cones at low Reynolds numbers, J. Fluid
Mech., Vol. 38, Part 3, pp. 565-576 (1969)
22 Van Atta, C. W. and Gharib, M., Ordered and chaotic vortex streets behind circular
cylinders at low Reynolds numbers, J. Fluid Mech., Vol. 174, pp. 113-133 (1987)
23 Bloor, S., The transition to turbulence in the wake of a circular cylinder, J. Fluid
Mech., Vol. 19, Part 2, pp. 290-304 (1964)
24 Wei, T. and Smith, C. R., Secondary vortices in the wake of circular cylinders, J. Fluid
Mech., Vol. 169, pp. 513-533 (1986)
25 Blevins, R., The effects of sound on vortex shedding from cylinders, J. Fluid Mech.,
Vol. 161, pp. 217-237 (1985)
46
26 Berger, E. and Wille, R., Periodic flow phenomena, Annual Review of Fluid
Mechanics, Vol. 4, pp. 313-340 (1972)
27 Farell, C., Flow around fixed circular cylinders: fluctuating loads, J. Engng. Mech.
Div. ASCE, Vol. 107, No. EM3, pp. 565-588 (1981)
28 Zdravkovich, M. M., Discussion on [27], J. Engng. Mech. Div. ASCE, Vol. 108, No.
EM3, pp. 567-569 (1982)
29 Fleischmann, S. T. and Sallet, D. W., Vortex shedding from cylinders and the resulting
unsteady forces and flow phenomenon, Part 1, Shock and Vibration Digest, Vol. 13,
No. 11, pp. 9-22 (1981)
30 Norberg, C. and Sunden, B., Turbulence and Reynolds number effects on the flow and
fluid forces on a single tube in cross flow, to appear in Journal of Fluids and Structures
(1987)
31 Norberg, C., Interaction between freestream turbulence and vortex shedding for a
single tube in cross-flow, Journal of Wind Engineering and Industrial Aerodynamics,
Vol. 23, pp. 501-514 (1986)
32 Ljungkrona, L. and Mitsner, A., Studium av strömningen kring två cylindrar i
tandemarrangement, M.Sc. thesis Dept. Applied Thermodynamics and Fluid
Mechanics, Chalmers Univ., Gothenburg (1985) (in Swedish)
33 Blake, W. K., Mechanics of Flow-Induced Sound and Vibration, Vol. 1, Academic
Press (1986)
34 Bishop, R. E. D. and Hassan, A. Y., The lift and drag forces on a circular cylinder in a
flowing fluid, Proc. Roy. Soc. (London) Ser. A, Vol. 277, pp. 32-50 (1964)
35 Camichel, C., Dupin, P. and Teissié-Solier, M., Sur l'application de la loi de similitude
aux périodes de formation des tourbillons alternés de Bénard-Karman, Acad. Sci.
Comptes Rendus, Vol. 185, pp. 1556-1559 (1927)
36 Nishioka, M. and Sato, H., Measurements of velocity distributions in the wake of a
circular cylinder at low Reynolds numbers, J. Fluid Mech., Vol. 65, Part 1, pp. 97-112
(1974)
37 Kohan, S. and Schwarz, W. H., Low speed calibration formula for vortex shedding
from cylinders, Physics of Fluids, Vol. 16, No. 9, pp. 1528-1529 (1973)
38 Friehe, C. A., Vortex shedding from cylinders at low Reynolds numbers, J. Fluid
Mech., Vol. 100, Part 2, pp. 237-241 (1980)
39 Taneda, S., Experimental investigation of the wakes behind cylinders and plates at low
Reynolds numbers, J. Phys. Soc. Japan, Vol. 11, No. 3, pp. 302-307 (1956)
47
40 Gaster, M., Vortex shedding from circular cylinders at low Reynolds numbers, J. Fluid
Mech., Vol. 46, Part 4, pp. 749-756 (1971)
41 Tritton, D. J., A note on vortex streets behind circular cylinders at low Reynolds
numbers, J. Fluid Mech., Vol. 45, Part 1, pp. 203-208 (1971)
42 Newhouse, S., Ruelle, D. and Takens, F., Occurrence of strange axiom A attractors
near quasiperiodic flow on Tm, m≥3, Commun. Phys., Vol. 64, pp. 35-40 (1978)
43 Sirovich, L., The Karman vortex trail and flow behind a circular cylinder, Physics of
Fluids, Vol. 28, No. 9, pp. 2723-2726 (1985)
44 Hussain, A. K. M. F. and Ramjee, V., Periodic wake behind a circular cylinder at low