Page 1
1
Published in: Journal of Child Psychology and Psychiatry (2003), 44, 445-455
Children’s colour choices for completing drawings of affectively characterised topics
Esther Burkitt 1, Martyn Barrett 2 and Alyson Davis 2
1 Psychology Group
School of Cognitive and Computing Sciences
University of Sussex
Falmer, Brighton
Sussex BN1 9QH
2 Department of Psychology
University of Surrey
Guildford
Surrey GU2 7XH
Acknowledgements: The research reported in this paper was supported by ESRC Research
Studentship R00429634149 awarded to the first author.
Address for correspondence: Dr Esther Burkitt, Psychology Group, School of Cognitive
and Computing Sciences, University of Sussex, Falmer, Brighton, Sussex BN1 9QH. Email:
[email protected]
Page 2
2
Abstract
This study was designed to explore whether or not children systematically use particular
colours when completing drawings of affectively characterised topics. Three hundred and
thirty 4-11-year-old children were subdivided into three conditions, colouring in a drawing of
a man, a dog, or a tree, respectively. The children completed two test sessions in
counterbalanced order. In one session, children rated and ranked ten colours in order of
preference. In the other session, children completed three colouring tasks in which they had to
colour in three identical figures but which had been given different affective
characterisations: a neutrally characterised figure, a figure characterised as nasty, and a figure
characterised as nice. It was found that, in all age groups and for all topics, the children used
their more preferred colours for the nice figures, their least preferred colours for the nasty
figures, and colours rated intermediately for the neutral figures. It was also found that, in all
age groups and for all topics, black tended to be the most frequently chosen colour for
colouring in the drawings of the negatively characterised figures. By contrast, primary colours
were predominantly selected for the neutral figure, while a wide range of mainly primary and
secondary colours were chosen for colouring in the nice figure. These results suggest that
children are able to alter systematically their use of colour during picture completion tasks in
response to differential affective topic characterisations, and that even very young children
are able to use colours symbolically.
Page 3
3
Introduction
Psychologists have long speculated that the contents of children’s drawings are a
product of more than just the cognitive and perceptual-motor factors which are required for
executing those drawings. There is a long history of research into whether the positive or
negative feelings which children might have about the topics which they draw are reflected in
the contents of their drawings. Both the size (Burkitt, 2000; Burkitt, Barrett & Davis,
submitted; Craddick, 1961, 1963; Fox & Thomas, 1990; Koppitz, 1966, 1968; Machover,
1949; Thomas, Chaigne & Fox, 1989) and the spatial disposition (Bombi & Pinto, 1993,
1994) of the contents of a drawing have been found to be affected systematically by the
feelings that the child artist holds toward the drawn topic.
Another possible resource which is potentially available to children for expressing
their feelings about the topic being drawn is colour. It has frequently been argued in the
literature that the child’s choice of colour is affected by the feelings which he or she holds
towards the drawn topic (e.g. Alschuler & Hattwick, 1943, 1947; Arnheim, 1956, 1974;
Brick, 1944; Golomb, 1992; Hammer, 1997; Winston, Kenyon, Stewardson & Lepine, 1995).
These claims have often been voiced by clinicians and art therapists (Dalley, 1984; Hammer,
1997; Liebowitz, 1999; McNiff, 1992; Warren, 1993) in relation to the observation and
interpretation of colour use in patients’ artwork as part of assessment and therapy.
However, although colour use in children’s drawings has commonly been regarded as
being emotionally significant, the majority of claims to this effect have been based on
professional observation rather than on formal experimentation, with research having been
conducted mainly within clinical contexts, where systematic independent validation of the
artist’s feelings towards the colours used, and towards the topics drawn, is not undertaken,
and the potential availability of other drawing strategies to the child has not been
experimentally controlled. This lack of properly controlled research is a serious omission, as
Page 4
4
children’s drawings are often interpreted for personal meaning in clinical and educational
settings (see, for example, Di Leo, 1973; Hammer, 1997), with interpretations of the
emotional significance of the contents of children’s drawings - which may have implications
for the treatment of those children - being made in such settings in the absence of an adequate
research evidence base for those interpretations.
Although an association between colour and emotional symbolism has been
established (Alschuler & Hattwick, 1947; Anastasi & Foley, 1943; Hammer, 1953; Zentner,
2001), this work examines children’s sensitivity to metaphorical associations of colour, rather
than examining children’s use of colour in drawing production tasks. No research has
systematically examined which colours might be used by children in drawing production
tasks for topics which elicit emotions, and the majority of claims as to the usefulness and
function of chromatic tests is based largely on individual case studies (Hammer, 1997).
Moreover, there have been no attempts to validate such tasks in relation to other factors
which might contribute to colour choice, for example, colour preference and familiarity.
The present study aimed to examine whether children systematically vary their use of
a single colour in relationship to affective topic characterisations, and whether the colours
that are chosen for use in such tasks are systematically related to their own colour
preferences. An experimental methodology was used to ensure that any effects that were
observed could be unambiguously related to the experimental manipulation. Children were
assigned to one of three conditions, in which they were given simple outline drawings of men,
dogs or trees to colour in. Each child was required to colour in three versions of the man, dog
or tree, namely a neutral, a nice and a nasty version. For each version, the children had to use
just a single colour for colouring it in.
The range of topics was chosen to assess whether any effects were influenced by topic
animism (trees vs. men and dogs). The suitability of these three topics for use in the study
Page 5
5
was established through piloting. The colour range made available to children was based
upon the youngest children’s familiarity both with the colours and with the names of the
colours (as ascertained through teacher questionnaires prior to running the study).
Predrawn outline drawings were used in order to reduce the task demands to a
minimum, to minimise any planning and production problems which the children might have
had, and to ensure that the choice of a single colour represented the principal planning
decision which the children had to make in order to complete the task. Thus, the design was
intended to answer the very specific question: when all other production factors are controlled
to the maximum possible extent, do children systematically use different colours in order to
depict affectively neutral, nice and nasty figures?
A further feature of the study was that the children’s affect towards the nice and nasty
figures was assessed independently, using a rating scale. The children’s colour preferences
were also measured independently. This enabled the study to explore whether the children
would use different colours for colouring in the drawings of the neutral, nice and nasty
versions of the topics, and to ascertain whether their colour choices were related to the
children’s own colour preferences. Specifically, the study aimed to examine whether children
would use more preferred colours for the positively characterised topics, least preferred
colours for the negatively characterised topics, and colours receiving intermediate ratings for
the neutrally characterised topics. The study also explored the particular colours which
children chose to complete their baseline, nice and nasty drawings, in order to see if any
particular colours were more or less associated with neutral, nice and nasty figures overall. A
large sample size was used in the study. One of the problems which has undermined much
previous research into whether children’s feelings or emotions influence the contents of their
drawings has been the use of small sample sizes, which has meant that even large effects are
often statistically undetectable in the small samples that have been used (see Burkitt, 2000,
Page 6
6
for a more extended discussion of this problem). Thus, for the present study, power
calculations were used at the outset to ensure that the number of children in each
experimental group (N = 32 or above) was well above the minimum number (N = 20) needed
to detect a medium effect size (0.35) at an alpha level of 0.05 (Faul & Erdfelder, 1992). In
addition, a wide age range of children (4 to 11 years old) was used, as Golomb (1992) has
argued that children as young as 4 years are able to use colour symbolically. Thus, the study
also aimed to explore developmental trends in children’s general colour use and choice of
specific colours.
Method
Participants
Three hundred and thirty subjects (176 boys and 154 girls) were randomly recruited
from mainstream primary and junior schools across the county of Surrey in the UK. Children
were divided into three age groups, and then further randomly assigned to the three condition
groups (see Table 1).
*INSERT TABLE 1 AND FIGURE 1 ABOUT HERE*
Materials
Pre-drawn unshaded line drawings of a man, a dog and a tree were provided (see
Figure 1). Each child coloured in three versions of the same line drawing on three separate
sheets. Ten individual laminated colour cards shaded using Crayola crayons were used in
Session 1 (red, orange, yellow, green, blue, purple, pink, white, brown and black), and the 10
coloured crayons themselves were provided for use by the children in Session 2. A five-point
smiley-face Likert scale (showing faces with very unhappy, unhappy, neither unhappy nor
happy, happy, and very happy expressions) was used to gather affect ratings towards each
Page 7
7
individual colour in Session 1, and to gather affect ratings towards the affectively
characterised drawings in Session 2.
Procedure
All children completed two test sessions. The two sessions were presented in
counterbalanced order to control for possible order effects. Children were seen individually in
a quiet area of their school for both sessions, which were always conducted on two successive
days.
Session 1
Children completed the following two colour preference tasks, which were
administered in a counterbalanced order.
Colour rating task
Children were shown ten cards successively in a random order with one colour on
each card (red, orange, yellow, green, blue, purple, pink, white, brown and black). As each
colour was presented, they were asked to rate how the colour made them feel, using the Likert
scale. Responses were scored between 1 and 5, where 1 = “very unhappy” and 5 = “very
happy”. The instructions were as follows:
“I would like to find out how you feel about this colour. What I’d like you to do is point to the
face to show how you feel about the colour. Here are the faces that you are going to be
looking at (pointing to each face). The first one is a very unhappy face; the next one is quite
an unhappy face; the middle one is neither happy nor unhappy. The fourth face is quite a
happy face and the last one is a very happy face. When you answer my question, I’d like you
to point to the face that describes how you feel about the colour. OK?”
Page 8
8
The instructions were repeated in full if the child indicated that they had not understood. Few
children required additional prompting.
Ranking task
The colour cards were spread out face up in a random arrangement in front of the
children. The children were asked to conduct a structured sort of the colour cards, arranging
them in order of preference beginning with the removal of their favourite colour. The children
were told:
“Here are some cards with one colour on each card. I’d like you to point to the colour which
you like the most. Please put that colour over here. Now, point to the colour which you like
the most (pointing at remaining display). Now take away the colour that you like the most
from these cards. Keep taking away a colour one at a time that you like the most from the
remaining cards. OK?”
The order in which the cards were removed was recorded, and the instructions were
only repeated in full if children stopped removing one card at a time. Only a few children
needed to be reminded of the instructions.
Session 2
In this session, each child was asked to colour in three pre-drawn outline line
drawings of a man, a dog or a tree. Each child coloured in the baseline model first, and then
completed the positively and negatively characterised models in counterbalanced order. The
same colour crayons that had been used to prepare the materials in session 1 were provided
for the children to use in this task.
Baseline colouring task
Page 9
9
Children were presented with a pre-drawn line drawing (either a man, a dog or a tree)
and instructed to chose one colour from the range provided to complete the drawing. The
children completing the man were instructed as follows:
“I’d like you to colour in this shape in front of you using one of these colours. Colour in the
whole shape as well as you can. Do not include any details such as the face or the clothes.”
The children completing the dog received the following instructions:
“I’d like you to colour in this shape in front of you using one of these colours. Colour in the
whole shape as well as you can. Do not include any details such as the hair or claws”.
Children completing the tree were told:
“I’d like you to colour in this shape in front of you using one of these colours. Colour in the
whole shape as well as you can. Do not include any details such as the leaves or flowers.”
Nice and nasty colouring tasks
Children received the following instructions characterising the model as either nice or
nasty in counterbalanced order. Completed models were removed before presentation of the
second task.
Nice task
The children completing the outline drawing of the man were instructed:
“Now pretend that the shape is of a very nice kind man who is very pleasant and friendly to
everyone. Colour in the man in front of you using one of these colours, remembering what a
nice person he is. Colour in the whole shape as well as you can, but do not include any
details such as the face or clothes”.
The children completing the outline drawing of the dog were instructed:
Page 10
10
“Now pretend that the shape is of a very nice kind dog, which is very pleasant and friendly
with everyone. Colour in the dog in front of you using one of these colours, remembering
what a nice dog it is. Colour in the whole shape as well as you can, but do not include any
details such as the hair or claws.”
The children colouring in the outline drawing of the tree were told:
“Now pretend that the shape is of a very nice lovely tree, which everyone likes looking at and
which is very pleasant. Colour in the tree in front of you using one of these colours,
remembering what a nice tree it is. Colour in the whole shape as well as you can, but do not
include any details such as the leaves or flowers”.
Nasty task
The group completing the model man were instructed as follows:
“Now pretend that the shape is of a very nasty horrible man who is very mean and unfriendly
to everyone. Colour in the man in front of you using one of these colours, remembering what
a nasty man he is. Colour in the whole shape as well as you can, but do not include any
details such as the face or clothes”
The instructions for children colouring in the dog were as follows:
“Now pretend that the shape is of a very nasty horrible dog, which is very mean and
unfriendly, and barks at everyone. Colour in the dog in front of you using one of these
colours, remembering what a nasty dog it is. Colour in the whole shape as well as you can,
but do not include any details such as the hair or claws.”
The children completing the model tree were told:
“Now pretend that the shape is of a very nasty horrible tree, which everyone hates looking at
and which is very unpleasant. Colour in the tree in front of you using one of these colours,
Page 11
11
remembering what a nasty tree it is. Colour in the whole shape as well as you can, but do not
include any details such as the leaves or flowers.”
Affect ratings towards the characterised topics
Immediately after completing each of the two affectively characterised topics, the
children were asked to rate their affect towards the drawings using the Likert scale and the
following instructions:
“I would like to find out how you feel about the (man/dog/tree). What I’d like you to do is
point to the face to show how you feel about the (man/dog/tree). Here are the faces that you
are going to be looking at (pointing to each face). The first one is a very unhappy face; the
next one is quite an unhappy face; the middle one is neither happy nor unhappy. The fourth
face is quite a happy face and the last one is a very happy face. When you answer my
question, I’d like you to point to the face that describes how you feel about the
(man/dog/tree). OK?”.
The children’s responses were scored between 1 and 5, where 1 = “very unhappy” and 5 =
“very happy”.
Results
All children successfully completed the sequence of tasks, and restricted their colour
use to one colour for each drawing type. As a precaution, the data were screened for possible
effects of the order of presentation of the two test sessions, as well as the order of
presentation of the two characterised drawing tasks within Session 2. No main or interaction
effects involving order were found. Thus, these two orders of task administration were
excluded as factors from the following analyses.
Page 12
12
The children’s colour preferences
The Likert-scale affect ratings taken in Session 1 towards each of the 10 colours were
correlated with the ranks assigned to those colours using Spearman’s rho. This was intended
to assess whether the two measures provided convergent evidence of the children’s
preferences for the various colours. The correlation coefficients for each individual colour are
shown in Table 2. All of the coefficients were significant at the 0.01 level, indicating that the
two measures yielded convergent findings about children’s colour preferences: if the children
gave a more positive affect rating to a colour, then they did indeed rank that colour more
highly. The correlations between affect ratings and rankings for each individual colour were
also calculated for each age group separately. Once again, all correlations were significant at
the 0.01 level. Table 2 also shows both the mean affect ratings and the mean ranks which
were attributed to the ten colours in the two tasks by the sample as a whole
*INSERT TABLE 2 ABOUT HERE*
Affect ratings for the colour choices for each drawing type
The children’s affect ratings (taken in Session 1) towards the colours selected for the
three drawing types (baseline, nice and nasty) were submitted to a 3 (age group) x 2 (sex) x 3
(condition: man vs. dog vs. tree) x 3 (drawing type: baseline vs. nice vs. nasty) four-way
mixed ANOVA, with drawing type entered as a repeated measure and the other factors
entered as independent measures. A significant main effect was found for drawing type (F (2,
624) = 608.40, p < 0.001). Table 3 shows the mean affect ratings for the colours chosen for
the baseline, nice and nasty tasks by the three age groups. Post hoc paired t-tests showed that
the colours for each drawing task were rated significantly differently from each other at the
0.001 level, with the colours chosen for the nice drawing being rated more positively than the
Page 13
13
colours chosen for both the baseline and nasty drawings, and the colours chosen for the
baseline figures being rated significantly more positively than the colours chosen for the nasty
figures. A significant interaction effect between age group and drawing type was also
revealed (F (4, 624) = 2.82, p < 0.05). Post hoc Scheffe (p < 0.05) analysis located the
interaction in the affect ratings for the nasty drawing type, where the colour choices made by
the oldest group were found to be significantly more positive than those made by both the
youngest and middle age groups.
*INSERT TABLE 3 ABOUT HERE*
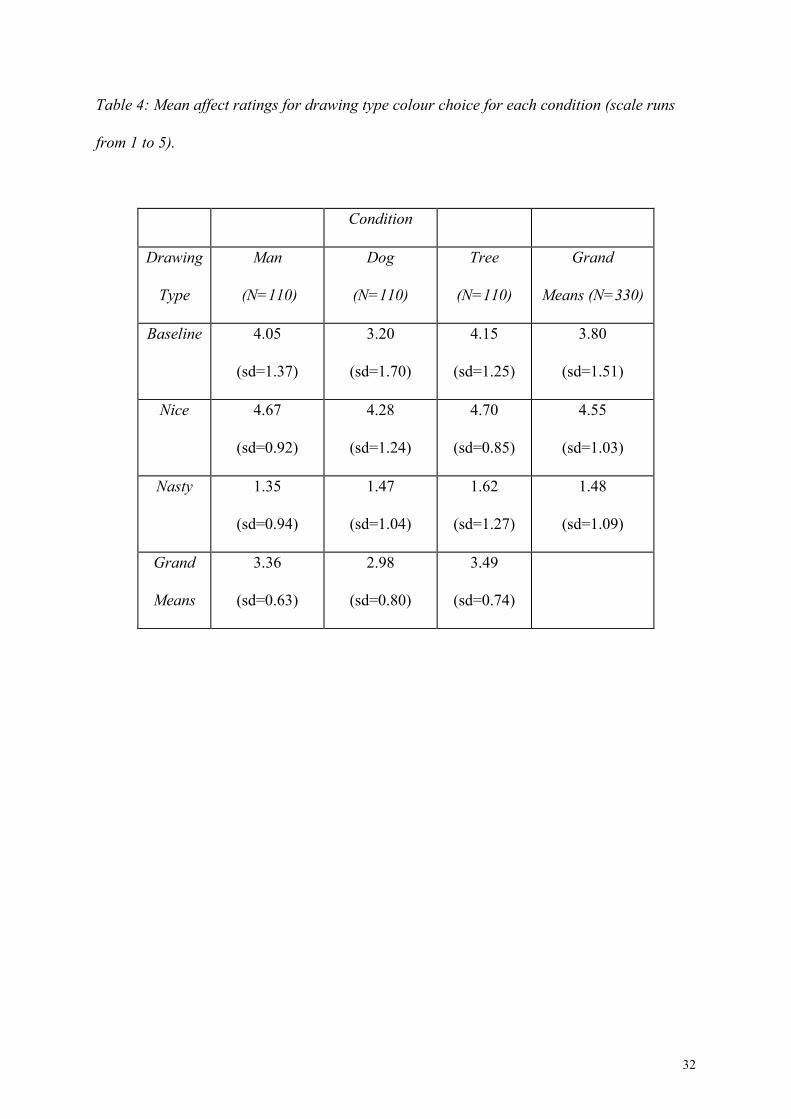
A second main effect was found for condition (F (2, 312) = 13.50, p < 0.05). Table 4
shows the mean overall affect ratings for the three drawing types for each condition. Post hoc
Scheffe (p < 0.05) analysis showed that the colours used for the man and the tree had received
significantly more positive ratings overall than the colours used for the dog. An interaction
effect was also found between drawing type and condition (F (4, 624) = 5.51, p < 0.05). Post
hoc Scheffe (p < 0.05) and paired t-tests (p < 0.05) showed that the colours used for the
baseline and nice drawings had received significantly higher ratings in the man and tree
conditions than in the dog condition; as far as the nasty drawings were concerned, there were
no significant differences between the three conditions.
*INSERT TABLE 4 ABOUT HERE*
An interaction effect was also found between sex and drawing type (F (2, 624) = 3.18,
p < 0.05). Post hoc independent t-tests (p < 0.05) and paired t-tests (p < 0.05) were performed
to locate the interaction, but no significant differences were found at the 0.05 level. However,
Page 14
14
inspection of the means suggested that the girls gave more positive affect ratings towards the
colours chosen for the baseline (M = 3.98, sd = 1.21) and nice (M = 4.53, sd = 0.92) drawing
tasks than the boys (M = 3.58, sd = 1.43 and M = 4.40, sd = 0.98 respectively), while the boys
gave more positive ratings for the colours chosen for the nasty task (M = 1.88, sd = 1.23) than
the girls (M = 1.65, sd = 1.05). No further main or interaction effects were revealed by the
ANOVA.
Affect ratings towards the affectively characterised drawings
During Session 2, all children rated the positively and negatively characterised
drawings immediately after completing the colouring of each. These data were subjected to a
3 (age group) x 2 (sex) x 3 (condition) x 2 (drawing type) four-way mixed ANOVA, with age
group, sex and condition entered as independent factors, and drawing type entered as a
repeated measure. A main effect was found for age group (F (2, 312) = 3.26, p < 0.05). Post
hoc Scheffe (p < 0.05) analysis failed to locate significant differences between the age groups.
However, inspection of the means (Youngest M = 3.02, sd = 0.28; Middle M = 3.00, sd =
0.31; Oldest M = 3.10, sd = 0.34) suggested that the oldest group gave slightly more positive
ratings overall than the youngest and the middle age groups.
A second main effect was found for drawing type (F (1, 312) = 6461.74, p < 0.001).
Post hoc paired t-tests (p < 0.05) revealed that the children rated the nice drawings (M = 4.76,
sd = 0.48) far more positively than the nasty drawings (M = 1.32, sd = 0.51). An interaction
effect was also found between sex and drawing type (F (1, 312) = 6.55, p < 0.05). Post hoc
independent t-tests (p < 0.05) showed that the girls gave more positive affect ratings towards
the nice drawings (M = 4.81, sd = 0.40) than the boys (M = 4.70, sd = 0.52), and the boys
Page 15
15
gave significantly more positive affect ratings towards the nasty drawings (M = 1.40, sd =
0.54) than the girls (M = 1.26, sd = 0.47). No other main or interaction effects were found.
Non-parametric analyses were also conducted on the rank orderings which the
children had assigned to the colours used for the baseline, nice and nasty drawings, in order to
see whether children ranked the colours which they chose for each drawing type significantly
differently. A Friedman two-way ANOVA showed that, overall, the children used more
highly ranked colours for the nice task (mean rank = 2.78), the lowest ranked colours for the
nasty task (mean rank = 8.62), and intermediate ranked colours for the baseline task (mean
rank = 3.86) (χ2 (2) = 347.86, p < 0.001); post hoc Wilcoxon tests indicated that there were
significant differences between all three drawing types. These non-parametric analyses failed
to reveal any effects associated with age, gender or condition.
The specific colours used for completing the baseline, nice and nasty drawings
Frequency counts of the specific colours which were used for the three drawing types
(baseline, nice and nasty) were made for each condition individually. The data were analysed
using correspondence analysis, in order to explore the specific colours which had been used
for the different drawings. Correspondence analysis (Hammond, 1988, 1993) uses well-
established geometric principles to provide a pictorial representation of the relationship
between categories of response and groups of individuals. It permits a multi-dimensional
analysis of categorical data by providing a plot in which the geometric distance between the
groups and the types of response gives a direct measure of the relative degree of association
between the groups and the response types. This graphical representation reveals those colour
choices which are most closely associated with each group (be it age, gender, condition or
Page 16
16
drawing type) and which therefore best discriminate the behaviour of the children in each
subgroup.
A series of individual correspondence analyses was run. Colour choices for each
drawing type were compared individually and simultaneously across age groups, gender and
condition. Colours with a response frequency count of less than 5 were not included in the
sequence of analyses in order to avoid the results being biased by these low frequency
responses (Hammond, 1988). The outcomes for the three conditions individually, irrespective
of age, were as follows.
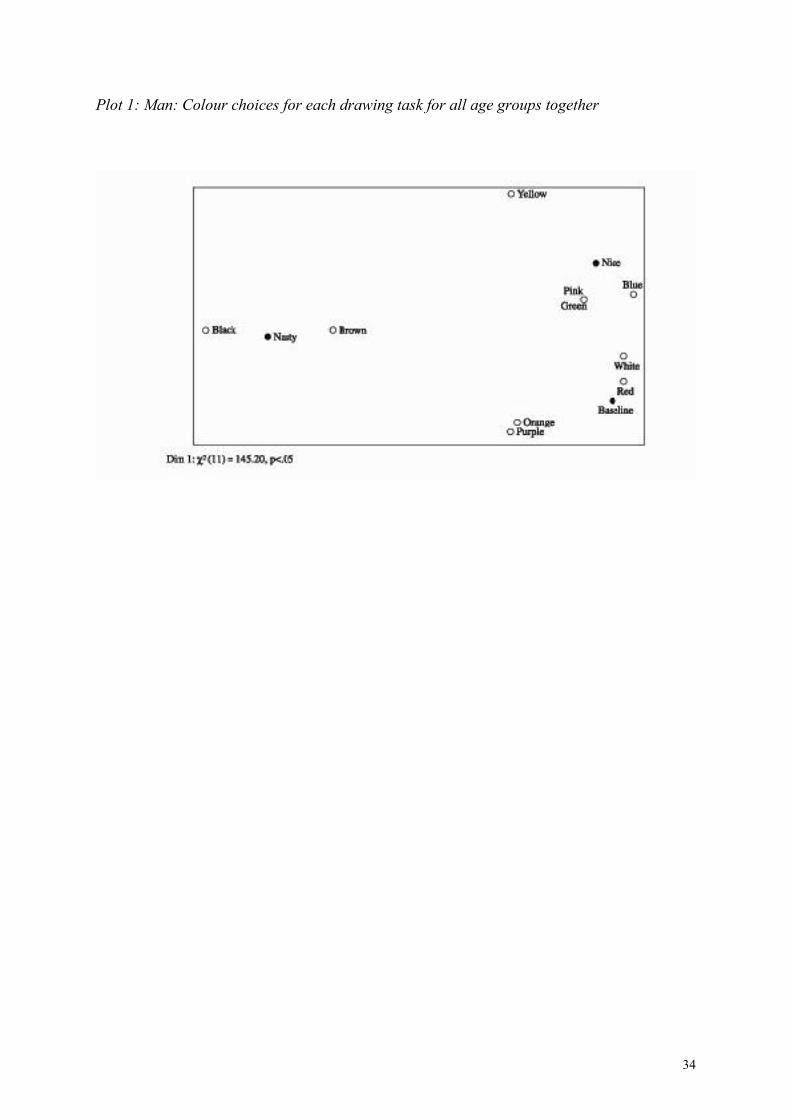
Plot 1: Man: Colour choices for each drawing task for all age groups together.
The analysis was based on the colours chosen by the children for completing the man
in the baseline, nice and nasty tasks. Only one significant dimension was found (χ2 (11) =
145.20, p < 0.05), which only allows interpretation of distances along the horizontal axis of
the plot. This shows that blue, white, red, pink and green were more closely associated with
the nice and baseline drawings than with the nasty drawings, and that brown and black were
more closely associated with the nasty drawings than with the nice and baseline drawings.
*INSERT PLOTS 1-3 ABOUT HERE*
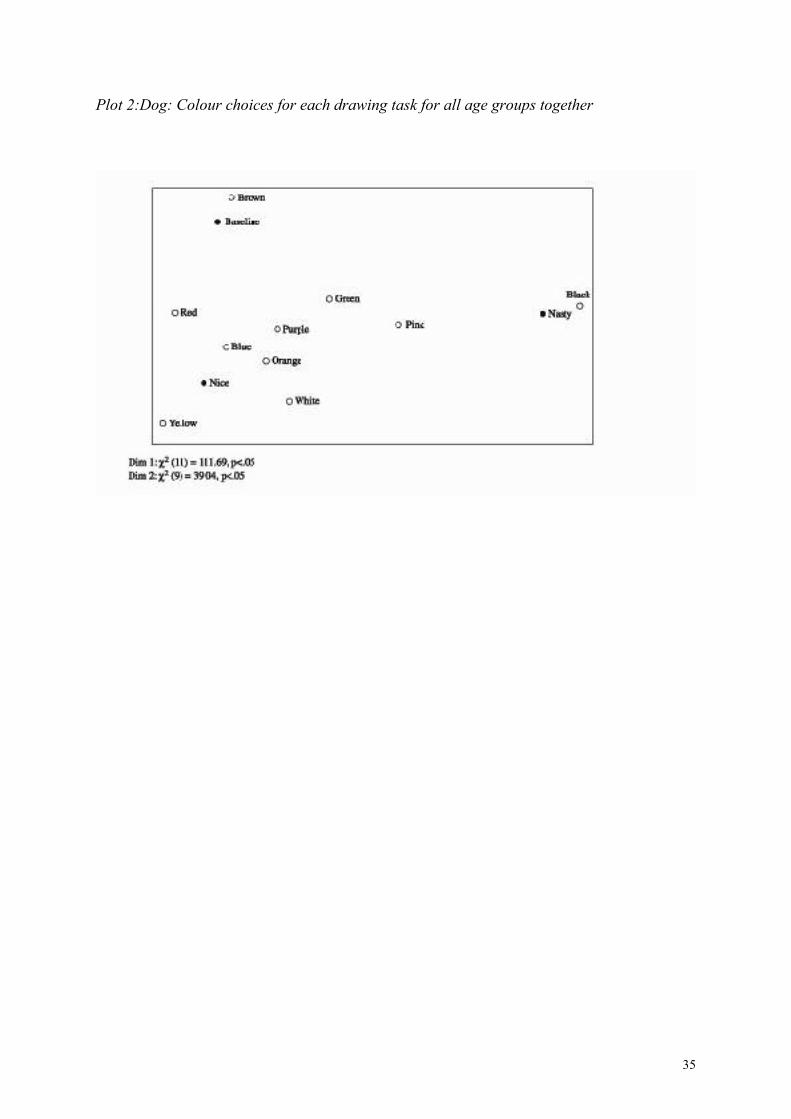
Plot 2: Dog: Colour choices for each drawing task for all age groups together
Colour choices for the three drawings of the dog were also examined. Two significant
dimensions were found (χ2 (11) = 111.69, p < 0.05; χ2 (9) = 39.04, p < 0.05), allowing
interpretation of the plot in terms of both the horizontal and the vertical axes of the plot. The
plot shows that black was more closely associated with the nasty drawings than with the
Page 17
17
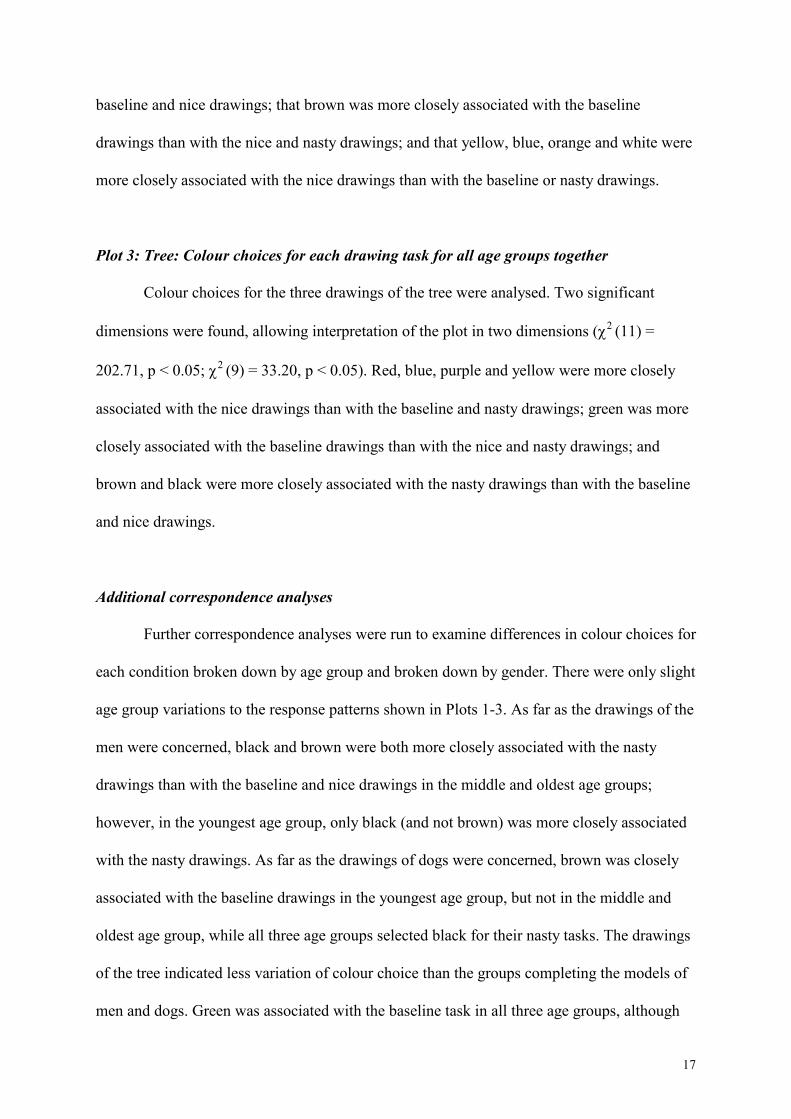
baseline and nice drawings; that brown was more closely associated with the baseline
drawings than with the nice and nasty drawings; and that yellow, blue, orange and white were
more closely associated with the nice drawings than with the baseline or nasty drawings.
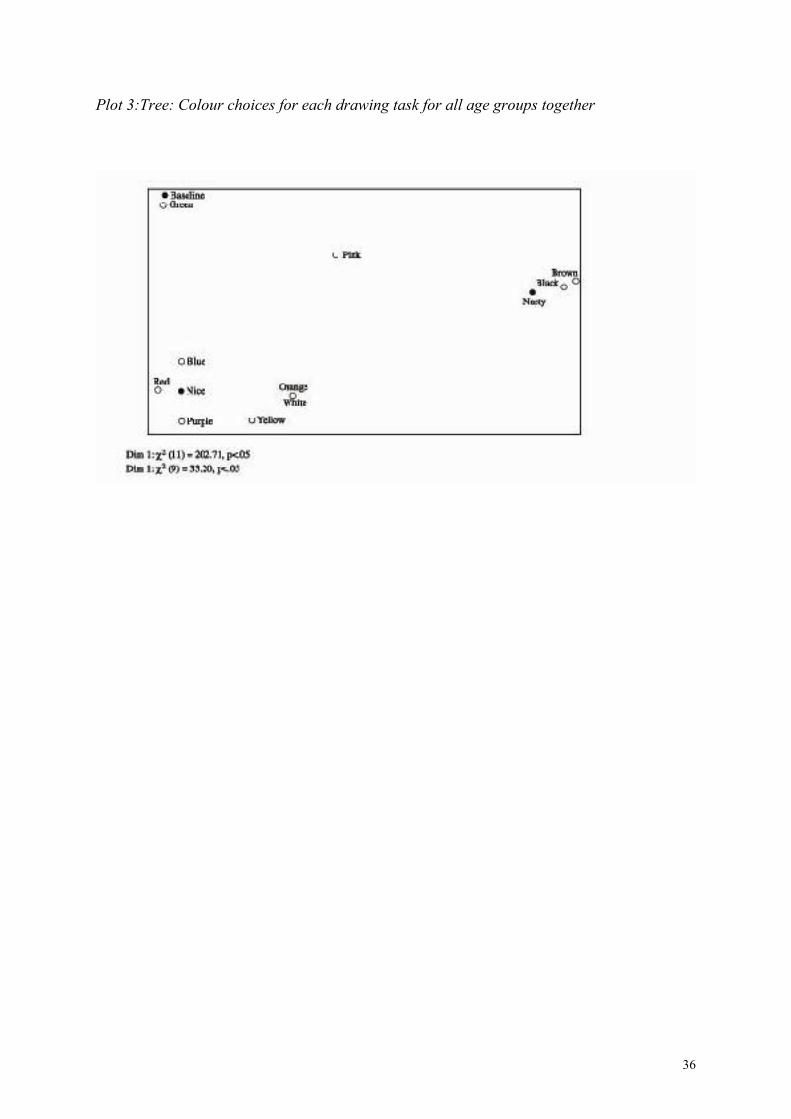
Plot 3: Tree: Colour choices for each drawing task for all age groups together
Colour choices for the three drawings of the tree were analysed. Two significant
dimensions were found, allowing interpretation of the plot in two dimensions (χ2 (11) =
202.71, p < 0.05; χ2 (9) = 33.20, p < 0.05). Red, blue, purple and yellow were more closely
associated with the nice drawings than with the baseline and nasty drawings; green was more
closely associated with the baseline drawings than with the nice and nasty drawings; and
brown and black were more closely associated with the nasty drawings than with the baseline
and nice drawings.
Additional correspondence analyses
Further correspondence analyses were run to examine differences in colour choices for
each condition broken down by age group and broken down by gender. There were only slight
age group variations to the response patterns shown in Plots 1-3. As far as the drawings of the
men were concerned, black and brown were both more closely associated with the nasty
drawings than with the baseline and nice drawings in the middle and oldest age groups;
however, in the youngest age group, only black (and not brown) was more closely associated
with the nasty drawings. As far as the drawings of dogs were concerned, brown was closely
associated with the baseline drawings in the youngest age group, but not in the middle and
oldest age group, while all three age groups selected black for their nasty tasks. The drawings
of the tree indicated less variation of colour choice than the groups completing the models of
men and dogs. Green was associated with the baseline task in all three age groups, although
Page 18
18
blue was also associated with the nice drawings in the oldest age group. Black and brown
were most closely associated with the nasty drawings for all age groups. No effects of gender
were revealed by any of the correspondence analyses.
Discussion
This study shows that children use different colours for completing pre-drawn line
drawings of neutrally, positively and negatively characterised topics. In addition, a
relationship has been found between children’s colour preferences and the colour selected for
completion of the three drawing types. Children’s responses in both the colour rating and the
rank ordering tasks show that children use more preferred colours for positively characterised
drawings, least preferred colours for negatively characterised drawings, and colours rated and
ranked intermediately for neutrally characterised drawings. It was found that this pattern of
colour use occurred at all ages (from 4-11 years), and for all drawing topics (i.e. for men,
dogs and trees). Furthermore, these results have been obtained using a design in which the
children’s own affect towards the affectively characterised drawings was independently
assessed in order to confirm that the children did indeed feel differently towards the topics
that had received the positive and negative characterisations.
A notable trend emerged in the children’s choice of colours for negatively
characterised topics. In all age groups, and for all topics, black tended to be the most
frequently chosen colour for completing the drawings of the negatively characterised topics.
Again, this finding was neither age- nor topic-specific. By contrast, primary colours were
predominantly selected for the baseline task, and a wide range of mainly primary and
secondary colours were chosen for completion of the nice task. These results suggest that
children do alter their colour choice during colour completion tasks in response to differential
Page 19
19
affective topic characterisations. Furthermore, these findings support the suggestion that
children can and do use colour symbolically from a young age (Golomb, 1992; Winston et al.,
1995). It would be interesting to ascertain whether children’s choice of black for colouring in
nasty topics is related to their racial attitudes (Aboud, 1988; Stabler & Johnson, 1972), and
whether such behaviour varies in children of different ethnicities: it is noteworthy that the
children in the present study were predominantly white in ethnicity.
It is interesting that the children changed their choice of colour for affectively
characterised topics regardless of topic animism (men and dogs versus trees) and regardless
of whether the topic was human (men) or not (dogs and trees). Children’s selection of more
preferred colours for the nice task, least preferred colours for the nasty task, and
intermediately rated colours for the neutral task was not affected by topic. However, there
were some subtle differences in the specific colours which were used for the neutral, nice and
nasty versions of men, dogs and trees. For example, the children used brown to complete the
nasty man and tree, but not the nasty dog. This suggests that the tree and the man were treated
more similarly than the man and dog, a finding which lends itself neither to the anticipated
distinction of treatment between animate topics and non-animate topics (men and dogs versus
trees) nor between human topics and non-human topics (men versus dogs and trees). Another
difference that occurred between the three topics was that the children completing the
drawings of the dogs and the trees seemed to make more realistic colour choices in their
baseline drawings (i.e. brown for neutral dogs, and green for neutral trees) than the group
completing the man. Children may have been imagining the men to be in clothing, allowing
for a wider choice of colour. The extent to which the perceived realism of a colour interacts
with its expressive properties in determining children’s decisions over choice of colour in
their drawings is an issue which clearly merits further investigation.
Page 20
20
Thus, children do tend to use darker colours for negative topics, and these darker
colours (i.e. brown and black) are typically ranked and rated as the children’s least preferred
colours overall. It has frequently been argued in the clinical literature that darker colours tend
to be used to a greater extent by individuals who are less well emotionally-adjusted, and for
the depiction of negative topics (Alschuler & Hattwick, 1943, 1947; Brick, 1944;
Milijkovitch de Heredia & Milijkovitch, 1998; Waehner, 1946). Some support for the idea
that black and brown are more closely associated with the depiction of negative topics is
provided by the present study.
Precisely how children come to associate different colours with positive or negative
topics is an issue which now needs to be addressed by further research. One possibility is that
children acquire these associations from cultural conventions which they have seen and used
in colouring books and other interactive media. This explanation has been suggested as a
possible mechanism influencing children’s associations of particular colours with facial
expressions of emotions (Zentner, 2001), and it may also help to explain the differential use
of colour when drawing emotion-eliciting topics.
There was no evidence of any substantial developmental trends or gender differences
in children’s use of colour in this study. There were some minor differences between the boys
and the girls in their ratings of the colours which were used for the differentially characterised
topics, but the correspondence analyses did not reveal any significant differences between the
boys and the girls in their actual choice of colours for the various tasks. Research with clinical
groups suggests that girls integrate more colour in their responses to the Rorschach test than
boys (Ames, Metraux & Walker, 1971), and use colour at an earlier age than boys in their
Page 21
21
drawings of common objects (Milne & Greenway, 1999). It would be of interest to explore
whether sex differences would emerge in children’s drawings using the current paradigm with
comparable clinical populations.
The measure of the children’s affect towards the drawing topic which was taken
immediately after drawing completion showed that the children did indeed rate the topics
following affective characterisation in the anticipated directions. However, no measure of the
children’s feelings towards their drawings was taken at the actual time of drawing (e.g. using
physiological measures). It might be interesting to do so in order to confirm the presence of
differential affect towards the topic at the actual time that the children make their colour
choices in order to establish whether there is a direct link between the emotions which are
experienced by a child at the time of producing a drawing and the specific contents of the
drawing which is produced.
In addition, the present experiment utilised pre-drawn and rather unusual models,
completed under a specific set of tightly controlled conditions (for the reasons given in the
Introduction to this paper). It would be interesting to ascertain whether these effects of
affective characterisation occur when more naturalistic pre-drawn drawings are used, or when
children have to produce their own freehand drawings of nice and nasty figures, when they
would be able to utilise a range of drawing strategies (in addition to the differential use of
colour) for drawing affectively characterised topics. The extent to which the availability of
other drawing strategies might over-ride the use of differential colour in children’s freehand
drawings remains the subject for further study.
Page 22
22
That said, however, the present study has provided clear evidence that, when other
drawing strategies are not available to the child, 4-11-year-old children do indeed use colour
differentially and systematically for colouring in simple line drawings that have received
differential affective characterisations. This has been demonstrated using an experimental
paradigm that has not previously been utilised in order to address these issues. It has been
found that children use their more preferred colours for positive figures, their least preferred
colours for negative figures, and colours rated intermediately for neutral figures. Furthermore,
this study provides evidence that even four years olds are able to use colour symbolically
(Golomb, 1992; Winston et al., 1995).
Page 23
23
References
Aboud, F. (1988). Children and Prejudice. Oxford: Blackwell.
Alschuler, R., & Hattwick, L. A. (1943). Easel painting as an index of personality in
preschool children. Journal of Orthopsychiatry, 13, 616-625.
Alschuler, R., & Hattwick, L. A. (1947). Painting and Personality. Volumes I and II. Chicago:
The University of Chicago Press.
Ames, L. B., Metraux, R. & Walker, R. (1971). Child Rorschach Responses: Developmental
Trends from 10 to 16 years. New York: Brunner-Mazel.
Anastasi, A. & Foley, J. P. (1943) An analysis of spontaneous artistic productions by the
abnormal. Journal of Genetic Psychology, 28, 297-313.
Arnheim, R. (1956). Art and Visual Perception: A Psychology of the Creative Eye. London:
Faber & Faber.
Arnheim, R. (1974). Art and Visual Perception: A Psychology of the Creative Eye. The New
Version. Berkeley, CA: University of California Press.
Bombi, A.S. & Pinto, G. (1993). I Colori dell’Amicizia: Studi sulle Rappresentazioni
Pittoriche dell’Amicizia in eta Evolutiva. Bologna: Il Mulino.
Page 24
24
Bombi, A.S. & Pinto, G. (1994). Making a dyad: Cohesion and distancing in children’s
pictorial representation of friendship. British Journal of Developmental Psychology, 12, 563-
575.
Brick, M. (1944). The mental hygiene value of children’s art work. American Journal of
Orthopsychiatry, 14, 136-146.
Burkitt, E. (2000). Children’s drawings of affectively characterised topics. Unpublished
doctoral thesis. University of Surrey, Surrey.
Burkitt, E., Barrett, M. & Davis, A. (submitted). The effect of affective characterisations on
the size of children’s drawings.
Craddick, R. (1961). Size of Santa Claus drawings as a function of time before and after
Christmas. Journal of Psychological Studies, 12, 121-125.
Craddick, R. A. (1963). Size of Hallowe’en witch drawings prior to, on and after Hallowe’en.
Perceptual and Motor Skills, 16, 235-238.
Dalley, T. (1984) Art As Therapy. Routledge: London.
Di Leo, J. H. (1973). Children’s Drawings as Diagnostic Aids. New York: Brunner Mazel.
Page 25
25
Faul, F. & Erdfelder, E. (1992). GPOWER: A priori, post-hoc, and compromise power
analyses for MS-DOS [computer program]. Bonn, Germany: Bonn University, Department of
Psychology.
Fox, T. & Thomas, G. V. (1990). Children’s drawings of an anxiety-eliciting topic: Effect on
size of the drawing. British Journal of Clinical Psychology, 29, 71-81.
Gesche, I. (1927). The color preferences of 1152 Mexican children. Journal of Comparative
Psychology, 7, 297-311.
Golomb, C. (1981). Representation and reality: The origins and determinants of young
children’s drawings. Review of Research in Visual Art Education, 14, 36-48.
Golomb, C. (1992). The Child’s Creation of a Pictorial World. Berkeley: University of
California Press.
Hammer, E. F. (1953) The role of the H-T-P in the prognostic battery. Journal of Clinical
Psychology, 9, 371-374.
Hammer, E. F. (1997). Advances in Projective Drawing Interpretation. Springfield, Ills.: C. C.
Thomas.
Hammond, S. M. (1988). CORRES 1.0: A programme for the correspondence analysis of
contingency tables on IBM compatible micros. Department of Psychology, University of
Surrey, Guildford, Surrey.
Page 26
26
Hammond, S. M.(1993). The descriptive analyses of shared representations. In G. Breakwell
& D. Canter (Eds.), Empirical Approaches to Social Representation, pp. 205-220. Oxford:
Clarendon press.
Jolley, R. P. (1995). Children’s production and perception of visual metaphors for mood and
emotion in line drawings and in art. Unpublished doctoral thesis. University of Birmingham,
Birmingham.
Koppitz, E. M. (1966). Emotional indicators on human figure drawings of shy and aggressive
children. Journal of Clinical Psychology, 22, 466-469.
Koppitz, E. M. (1968). Psychological Evaluation of Children’s Human Figure Drawings.
London: Grune and Stratton.
Liebowitz, M. (1999). Interpreting children’s drawings: A self-psychological approach.
London: Brunner Mazel.
Machover, K. (1949). Personality Projection in the Drawings of the Human Figure.
Springfield, IL: C. C. Thomas.
McNiff, S. (1992) Art as medicine: Creating a therapy of the imagination. Piakus, London:
Piakus.
Melkman, R., Koriat, A. & Pardo, K. (1976). Preference for colour and form in pre-schoolers
as related to colour and form differentiation. Child Development, 47, 1045-1050.
Page 27
27
Miljkovitch de Heredia, R. M. & Miljkovitch, I. (1998). Drawings of depressed inpatients:
Intentional and unintentional expression of emotion states. Journal of Clinical Psychology,
54, 1029-1042.
Milne, L. C. & Greenway, P. (1999). Color in children’s drawings: The influence of age and
gender. The Arts in Psychotherapy, 26, 261-263.
Nelson, T. M., Allan, D. K. & Nelson, J. (1971). Cultural differences in the use of color in
Northwest Canada. International Journal of Psychology, 6, 283-292.
O’Hare, D. & Cook, D. (1983). Children’s sensitivity to different modes of colour use in art.
British Journal of Educational Psychology, 53, 267-277.
Parsons, M. J. (1987). How We Understand Art: A Cognitive Developmental Account of
Aesthetic Experience. Cambridge: Cambridge University Press.
Ross, T. R. (1938). Studies in the psychology of the theatre. Psychological Records, 2, 127-
190.
Stabler, J. R. & Johnson, E. E. (1972). The meaning of black and white to children.
International Journal of Symbology, 3, 11-21.
Subes, J. (1959). Les gouts des enfants pour les coleurs. Enfance, 2, 117-142.
Page 28
28
Thomas, G. V., Chaigne, E. & Fox, T. J. (1989). Children’s drawings of topics differing in
significance: Effects on size of drawing. British Journal of Developmental Psychology, 7,
321-331.
Waehner, T. S. (1946). Interpretations of spontaneous drawings and paintings. Genetic
Psychology Monographs, 33, 70.
Warren, B. (1993). Using the creative arts in therapy: A practical introduction. London:
Routledgde.
Winston, A. S., Kenyon, B., Stewardson, J. & Lepine, T. (1995). Children’s sensitivity to
expression of emotion in drawings. Visual Arts Research, 21, 1-14.
Zentner, M.R. (2001). Preferences for colours and colour-emotion combinations in early
childhood. Developmental Science, 4, 389-398.
Page 29
29
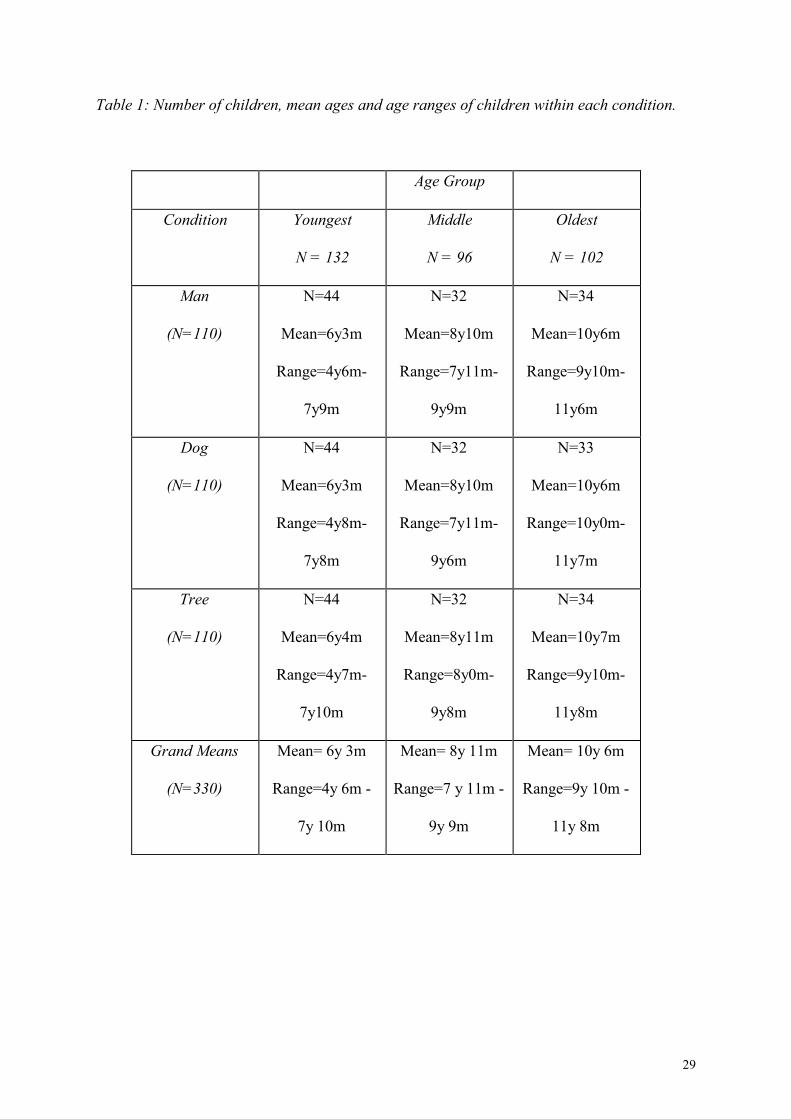
Table 1: Number of children, mean ages and age ranges of children within each condition.
Age Group
Condition Youngest
N = 132
Middle
N = 96
Oldest
N = 102
Man
(N=110)
N=44
Mean=6y3m
Range=4y6m-
7y9m
N=32
Mean=8y10m
Range=7y11m-
9y9m
N=34
Mean=10y6m
Range=9y10m-
11y6m
Dog
(N=110)
N=44
Mean=6y3m
Range=4y8m-
7y8m
N=32
Mean=8y10m
Range=7y11m-
9y6m
N=33
Mean=10y6m
Range=10y0m-
11y7m
Tree
(N=110)
N=44
Mean=6y4m
Range=4y7m-
7y10m
N=32
Mean=8y11m
Range=8y0m-
9y8m
N=34
Mean=10y7m
Range=9y10m-
11y8m
Grand Means
(N=330)
Mean= 6y 3m
Range=4y 6m -
7y 10m
Mean= 8y 11m
Range=7 y 11m -
9y 9m
Mean= 10y 6m
Range=9y 10m -
11y 8m
Page 30
30
Table 2: Spearman correlations between the children’s affect ratings towards, and their
rankings of, each of the ten colours, together with the mean affect rating and the mean
ranking of each individual colour in the sample as a whole (listed in descending order of
preference shown on the rank ordering task).
Colour Correlation
between affect
rating and rank
Mean affect
rating (and sd)
Mean rank
ordering (and sd)
Red - 0.71 4.40 (1.14) 3.18 (2.44)
Blue - 0.69 4.28 (1.19) 3.41 (2.30)
Yellow - 0.64 4.10 (1.21) 4.52 (2.16)
Green - 0.63 3.56 (1.38) 4.80 (2.21)
Purple - 0.64 3.33 (1.68) 4.94 (2.50)
Orange - 0.68 3.56 (1.40) 5.27 (1.87)
Pink - 0.79 2.81 (1.85) 5.88 (3.26)
White - 0.64 2.65 (1.62) 6.36 (2.27)
Brown - 0.59 1.56 (1.11) 8.22 (1.71)
Black - 0.69 1.58 (1.18) 8.45 (2.21)
Page 31
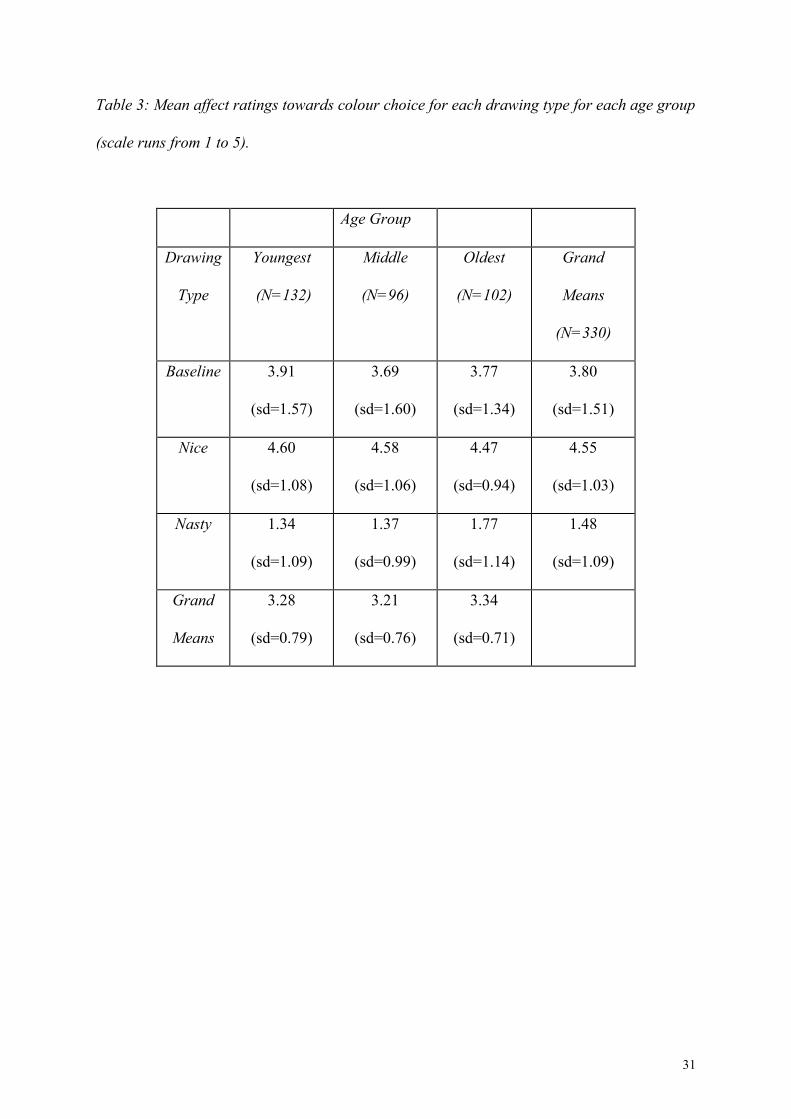
31
Table 3: Mean affect ratings towards colour choice for each drawing type for each age group
(scale runs from 1 to 5).
Age Group
Drawing
Type
Youngest
(N=132)
Middle
(N=96)
Oldest
(N=102)
Grand
Means
(N=330)
Baseline 3.91
(sd=1.57)
3.69
(sd=1.60)
3.77
(sd=1.34)
3.80
(sd=1.51)
Nice 4.60
(sd=1.08)
4.58
(sd=1.06)
4.47
(sd=0.94)
4.55
(sd=1.03)
Nasty 1.34
(sd=1.09)
1.37
(sd=0.99)
1.77
(sd=1.14)
1.48
(sd=1.09)
Grand
Means
3.28
(sd=0.79)
3.21
(sd=0.76)
3.34
(sd=0.71)
Page 32
32
Table 4: Mean affect ratings for drawing type colour choice for each condition (scale runs
from 1 to 5).
Condition
Drawing
Type
Man
(N=110)
Dog
(N=110)
Tree
(N=110)
Grand
Means (N=330)
Baseline 4.05
(sd=1.37)
3.20
(sd=1.70)
4.15
(sd=1.25)
3.80
(sd=1.51)
Nice 4.67
(sd=0.92)
4.28
(sd=1.24)
4.70
(sd=0.85)
4.55
(sd=1.03)
Nasty 1.35
(sd=0.94)
1.47
(sd=1.04)
1.62
(sd=1.27)
1.48
(sd=1.09)
Grand
Means
3.36
(sd=0.63)
2.98
(sd=0.80)
3.49
(sd=0.74)
Page 33
33
Figure 1: Outline models used in colouring tasks (not to scale)
Page 34
34
Plot 1: Man: Colour choices for each drawing task for all age groups together
Page 35
35
Plot 2:Dog: Colour choices for each drawing task for all age groups together
Page 36
36
Plot 3:Tree: Colour choices for each drawing task for all age groups together