-Apeas (e) apap!nord ppo~ law paqnbar saM uarppp roj p m l o ~ d 8qsq aspraxa alqqms e ' s g qqdmo3,lz o~ .masn s! @np;~pq m uq!~ 8urlsa~ puas ~ oj pm sdnos uaawaq asplaxa qwd pm pupmqns 01 sasuodsar qn3seno!pm:, pm ssawg nln3seno1.pn3 loj uospdmo:,jo poqram v -sasuodsar qn3sa~opm3 pm 'ssawy np3sa~opm3 'L3uapyja asyaxa jo uop?npna MOP ppoqs lsal aspraxa m Lwap~ 'ssarls aspraxa 01 sasuodsar np3sano~p.m 8qenpaa uy masn a n sanpn aspraxa v a d pua awls-Lpeats p u p m q n s g o 8 .passar$s am smalsLs fioleqdsa~ pue ap3senopn3 a* q o q asy3raxa 8 u~a -ans Apoq pm sage 3~~~ 30 aaCqns xq 1sai a m aq tq erep aspraxa W pm ~ q n s P!PA ugqo oi 4 ~ 9 ~ aw pm uogeinp 1~31 -do m Aq pwqsuomap se 'p~gae~d s! p3oioid a q ~ 'sanpa qead wam q3g pm 'sanpn pm ale1 w q qaad mam puuou 'spoud 3as-0s om* ~sq a q uaamlaq a3uaragp m m im~p3!suou 'sasuodsar aspiaxa maw pmrou 8vmoqs apsar aqj Ilq pateymsqns s! lo3o$ord a q roj &!PF@A au .sanpA patrodai raqo M a~qeredmm aram 1 + I mql ra~ea~3 ro 01 pnba sanpa (am opx a3mq3xa Doieqdsar aqj jo % pue 'ZOA qaad 'aer m q qed m a w -ralawred lsa] lCua roj a3uaragp m m jm3r~nrS?!s ou q!m '66'0=~ 01 69'0=J m o y pa3mr DU~~IJJ~O~ uopelauoo ssrr13er~u1 .sanpza qead ugqo 01 sa8ws dun31 ms-o~ Aq pamono3 s a 3 ~ s @nrFxearqns q ~ s - A p a a ~ s aaq jo 3gs~uo:, 'snonuguozi WM is1 aspraxa paper3 a u -rawuo31a a ph e uo s a n s aspraxa 3upnp ' ~ 1 0 1 L sa3e 'uarppp LEZ m sasuodsar n p s e n -0p1133 pm 'ssawg rep3seaopre3 'A3ua!3p asp~axa pauwxa Apws a= 'aua3salope pue uaipm3 lsal a m s a q m sasnodsa~ aspraxa qead pm alms-dpeals p m y m q n s qloq q qo 01 padola~ap 1om1ord anbpn e 30 moye3gdde pg3erd pue ' & ~ F @ A '&!~qagar a q sa~e~~omap ided s g ~ Aauoyew '1 Are1 pue 'ayrel3 rue!ll!M 'zuey j uaalylen 'uaplog '3 auer ua~pl!ya do! sanlm asp~ax3 yead pue
Transcript
-Apeas (e) apap!nord ppo~ law paqnbar saM uarppp roj pmlo~d 8qsq aspraxa alqqms e 'sg qqdmo3,lz o~ .masn s! @np;~pq m uq!~ 8urlsa~ puas ~oj pm sdnos uaawaq asplaxa qwd pm pupmqns 01 sasuodsar qn3seno!pm:, pm ssawg nln3seno1.pn3 loj uospdmo:,jo poqram v -sasuodsar qn3sa~opm3 pm 'ssawy np3sa~opm3 'L3uapyja asyaxa jo uop?npna MOP ppoqs lsal aspraxa m Lwap~ 'ssarls aspraxa 01 sasuodsar np3sano~p.m 8qenpaa uy masn an sanpn aspraxa vad pua awls-Lpeats pupmqns go8 .passar$s am smalsLs fioleqdsa~ pue ap3senopn3 a* qoq asy3raxa 8u~a
-ans Apoq pm sage 3~~~ 30 aaCqns xq 1sai am aq tq erep aspraxa W pm ~qns P!PA ugqo oi 4~9~ aw pm uogeinp 1~31 -do m Aq pwqsuomap se 'p~gae~d s! p3oioid aq~ 'sanpa qead wam q3g pm 'sanpn pm ale1 wq qaad mam puuou 'spoud 3as-0s om* ~sq aq uaamlaq a3uaragp mm im~p3!suou 'sasuodsar aspiaxa maw pmrou 8vmoqs apsar aqj Ilq pateymsqns s! lo3o$ord aq roj &!PF@A au .sanpA patrodai raqo M a~qeredmm aram 1 + I mql ra~ea~3 ro 01 pnba sanpa (am opx a3mq3xa Doieqdsar aqj jo % pue 'ZOA qaad 'aer mq qed maw -ralawred lsa] lCua roj a3uaragp mm jm3r~nrS?!s ou q!m '66'0=~ 01 69'0=J moy pa3mr DU~~IJJ~O~ uopelauoo ssrr13er~u1 .sanpza qead ugqo 01 sa8ws dun31 ms-o~ Aq pamono3 sa3~s @nrFxearqns q~s-Apaa~s aaq jo 3gs~uo:, 'snonuguozi WM is1 aspraxa paper3 au -rawuo31a aph e uo sans aspraxa 3upnp '~101 L sa3e 'uarppp LEZ m sasuodsar npsen -0p1133 pm 'ssawg rep3seaopre3 'A3ua!3p asp~axa pauwxa Apws a= 'aua3salope pue uaipm3 lsal ams aq m sasnodsa~ aspraxa qead pm alms-dpeals pmymqns qloq qqo 01 padola~ap 1om1ord anbpn e 30 moye3gdde pg3erd pue '&~F@A '&!~qagar aq sa~e~~omap ided sg~
state submaximal and (b) peak exercise data during the same test in a large number of normal children and adolescents.
Maximal oxygen consumption (maximal aerobic power) is the best single indicator of health related physical fitness and is used because of its role in limiting the capacity to perform aerobic tasks (30). A plateau in oxygen consumption 0702) is often used as criteria for a maximal test; however, children often do not reach a plateau (9, 23). The value used as peak VO, is the highest V02 reached during an exercise test meeting specific criteria for peak effort, even though leveling off of VO, is not seen and is usually close to maximal V 4 (30). Peak VO, can be used as an index of cardiorespiratory fitness.
To the best of our knowledge, no protocol allowing for both submaximal steady-state stages and peak exercise in the same test on a cycle ergometer had been described. The purpose of this paper is to demonstrate the reliability, validity, and usefulness of a unique protocol developed to obtain submaxid steady-state and peak exercise responses using a cycle ergometer in the same test in children and adolescents. The goal was to develop a protocol with workloads individualized and to keep the testduration long enoughio tax the cardiovascular system before boredom or excess leg fatigue occurred. In this study, submaximal exercise and peak exercise responses were assessed in a large number of children and adolescents using this protocol.
Subjects and Methods
A total of 237 subjects ages 7 to 17 years agreed to participate. A medical questionnaire was given to the family prior to involvement in the study, and subjects with known disease were excluded. The mean age, height, and weight of the total population are shown in Table 1. Of those 237, eight subjects (3.3 %) had no valid exercise test data due to noncompliance with the protocol (such as being unable to maintain efficient pedaling) and 16 (6.8%) did not meet the criteria for peak effort. For the remaining 213 subjects, peak heart rate was available; however 11 (4.6%) did not obtain valid peak VO, measurements (3 were due to equipment problems and 8 to failure by the subjects to maintain a seal around the mouthpiece). Those for whom peak VO, values were not avail- able were evenly distributed between the sexes but tended to be younger, with a mean age of 9.8 years ( f 3 .O) compared to 1 1.9 years ( f 2.7) for those success- fully completing the test.
Table 1
Means and Standard Deviations for Physical Characteristics of the Total Population
Total (n = 237) Males (n = 1 18) Females (n = 1 19) M SD M SD M SD
Graded exercise testing offers little risk in normal children (1, 29). The protocol was approved by the University of Iowa Hospitals and Clinics Human Subjects Review Committee. Informed consent was obtained from parents and subjects, and the subject was allowed to withdraw at any time. Participants and their families were informed about exercise testing by viewing a videotape of the procedures and having an opportunity to ask questions.
A constant-workload electromechanically braked cycle ergometer (Sie- mens Elema, model 320B, distributed by Siemens Systems, Coralville, IA) was selected for the study with children because the workload was constant regardless of the pedaling rate. Using a cycle ergometer provides easier measurement of blood pressure than with the treadmill because of reduced upper body movement. The cycle ergometer was calibrated according to the manufacturer's specifica- tions. Recommendations for optimal fitting of the cycle ergometer for efficient pedaling were followed (3, 19). The ergometer was modified to accommodate different size subjects by using different stems and seats to provide an optimal seat height. Adjustable handlebars and three pedal crank lengths were also used to provide a more efficient ride.
A Burdick electrocardiograph @CG) single channel recorder (model EK- 8, Burdick Corp., Milton, WI) was used to measure heart rate (HR). For electro- cardiography, a modified CM5 electrode (3M, Red Dot 2255T, St. Paul, MN) lead configuration was used (3, 13,22). Heart rate was measured fkom an ECG strip taken during the last 10 seconds of each submaximal and ramp stage. An electrosphygmomanorneter (Model PE-300, Narco Biosystems, Inc., Houston, TX) was used in conjunction with a microphone and a mercury manometer to measure blood pressure (SBP). The SBP measurement was read from a mercury manometer by experienced personnel. The Korotkoff sounds were amplified by a microphone and the inflation and deflation rate of the electrosphygmomanometer were manually set for each determination. The electrosphygmomanometer was modified to include an audio amplifier and earphone headset to facilitate detecting the Korotkoff sounds. The blood pressure cuff size was chosen so that the cuff was approximately 75 % the length of the upper arm (18) and the bladder encir- cled at least half the circumference of the arm.
The Medgraphics System CPX metabolic cart was used (Medical Graphics Corp., St. Paul, MN). Each metabolic variable was calculated separately using a proprietary Medgraphics computer program and computer system. For the reporting of ventilation gases, the average of the two final 30-s collection periods was used, and for each ramp stage a 30-sec collection period was used. Specific calibration procedures were followed according to the manufacturer's recom- mendations. Expired air was collected using Hans Rudolph two-way nonre- breathing pulmonary valves (series 1400, 2600, and 2700) and Hans Rudolph head harnesses for adults and children (models 2766 and 1426, Scientific Instru- ment, Kansas City, MO).
Protocol
Participants were asked to pedal at 60-80 revolutions per minute with an external tachometer fully in view (13,29). Tests were administered in an air-conditioned room at approximately 22°C temperature. A short practice session was provided on the same day prior to testing, using the first stage workload. The subject then sat quietly for a few minutes before beginning the actual test. The practice session
132 - Golden, Janz, Clarke, and Mahoney
was kept short and the workload was kept low to avoid fatigue. The objectives of the practice session were to see that the ergometer was properly adjusted for an optimal ride and to allow the subject to practice efficient pedaling between 60 to 80 rpm.
The graded exercise test was continuous, with workloads systematically incremented. The test consisted of two parts: (a) one Cmin and two 3-min sub- maximal steady-state stages to obtain submaximal values, and (b) 30-s ramps to obtain peak values. An extra minute was used at the lowest workload since there was no warm-UD.
~hree-mihute ramp stage testing has been used in children on both the treadmill (24, 25) and cycle ergometer (14, 27). One protocol for 3-min ramp stages using a cycle ergometer individualized workloads according to body sur- face area (14). The workloads were based on three groups selected by body surface area, each encompassing a wide range of weights. Preliminary work determined that many subjects in our study would have been unable to complete three steady-state submaximal stages using this protocol because the workload was too high. Another 3-rnin ramp stage protocol using a cycle ergometer em- ployed large weight ranges and targeted higher heart rates for the second and third stages (27).
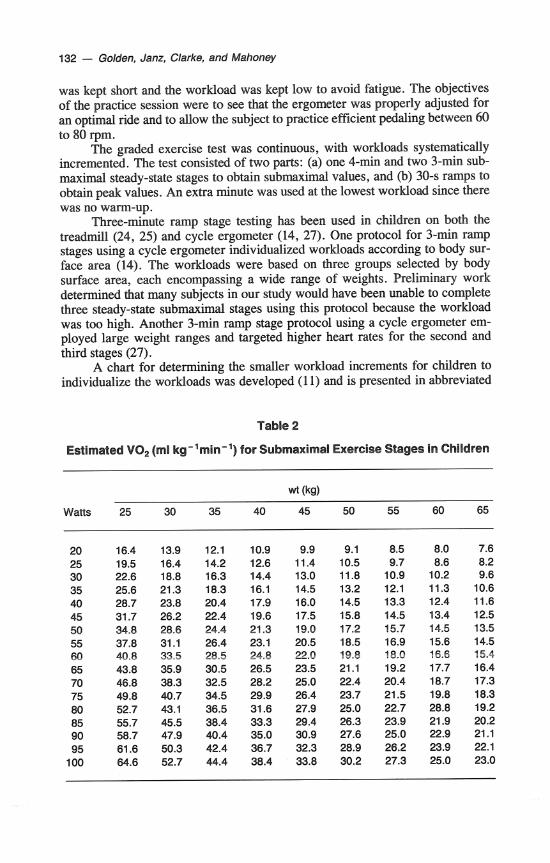
A chart for determining the smaller workload increments for children to individualize the workloads was developed (1 1) and is presented in abbreviated
Table 2
Estimated VO, (ml kg-'min-') for Submaximal Exercise Stages in Children
Watts
New Protocol for Exercise Values - 133
form in Table 2. Guidelines for estimating the V02 (ml/kg*min) at particular workloads for adults were used as a basis for a regression equation (2). Although metabolic requirements for cycling may not be exactly the same for children, the workload chart provided a convenient way to determine suitable workloads for the desired V02 (mllkg amin).
For males, an estimated range of peak values used was 35-50 mllkg-min, and for females it was 30-45 ml/kg*min, based on published values for testing on a cycle ergometer (6, 16). The estimated peak V02 prior to testing was se- lected based on the subject's body weight, sex, and self-reported physical activity level. Testing was targeted at 40, 50, and 60% of the subject's estimated V0,- max, corresponding to expected heart rates of approximately 120, 135, and 150 bpm. Heart rates between 110 and 150 bpm seem to have the best linear relation- ship with oxygen consumption over a wide range of ages and fitness levels (20). The desired percentage of the estimated peak V02 was then used to determine the workloads. For example, if a male subject reported a high physical activity level, his submaximal workloads were individually selected based on 40,50, and 60% (corresponding to 20,25, and 30 mllkg emin, respectively) of an estimated 50 ml/kg*min peak VO,. If a male subject was overweight and reported being sedentary, his submaxirnal workloads were based on an estimated peak V02 of 35 ml/kg*min.
The ramp portion of the test followed the three steady-state stages. Thirty- second ramp stages were used to obtain peak exercise values. The short ramp stages were used to lessen the leg fatigue that is often seen with longer ramp stages at high workloads. The workload was increased every 30 seconds by an estimated 2 to 4 mllkg-min to keep the number of ramp stages less than 10 and the total test time less than 15 minutes. The workload increments for the ramp were increased from 5 to 30 watts depending on the subject's weight and perfor- mance on the submaximal portion of the test. The HR measurement was taken during the last 10 seconds of each ramp stage. The 30-sec ramp stage had to be completed in order for the peak VO, to be considered valid. The child was encouraged to give maximal effort. Feedback from the computer screen and verbal encouragement were used to motivate maximal effort.
Since a plateau in V02 at peak exercise is often not reached in children (9, 23,30), other criteria were used to determine whether a peak effort was obtained. One of the following criteria had to be satisfied: (a) attainment of 200 beats per minute HR, (b) respiratory exchange ratio (RER) greater than 1.0 in conjunction with extreme forced ventilation, or (c) appearance of extreme forced ventilation and other subjective signs of exhaustion (30). In order to determine whether local muscular fatigue, cardiorespiratory factors, or both had limited the performance, subjects were asked the primary reason for terminating the test. If leg fatigue was stated as a limiting factor, the last ramp stage was considered a peak if the criteria for peak values were met.
Since it was possible to test the large sample of children only once, a reliability study on a small sample was needed. Prior to initiating the large study, 10 normal healthy children (6 girls and 4 boys) were tested twice within the same week using the same submaximal and ramp workloads. For the 10 subjects tested during the reliability study, the mean age and weight were 11.9 years (f 2.2) and 40.7 kg (f 11.8), respectively.
134 - Golden, Janz, Clarke, and Mahoney
Data Analysis
Statistical analysis systems (SAS) were used for data analysis. Statistical signifi- cance was considered to be pG0.05. Individual regression equations to obtain a rate of change (slope) were calculated. Predicted midpoint values were calculated for dependent variables using the mean value of the second workload and the corresponding VO, as independent variables.
Reliability analysis for 10 subjects during submaximal exercise consisted of (a) comparisons of cardiorespiratory measures and physical workload at each submaximal stage, (b) paired t tests for the slopes and predicted midpoints of the response curves, and (c) intraclass correlation coefficients for the slopes and predicted midpoints of the response curves. Between-day reliability for physical work capacity, peak VO,, peak HR, and peak SBP exercise values was deter- mined by paired t tests and intraclass correlation coefficients.
Unadjusted means and standard deviations for exercise values at each sub- m a d stage and the percent of the peak values obtained were calculated using results from the large population. VO, is presented in mllkg-min to provide comparisons to other studies. The mean difference for the last two 30-sec periods for each stage of the submaximal steady-state portion was calculated and tested for significance using a paired t test.
Results
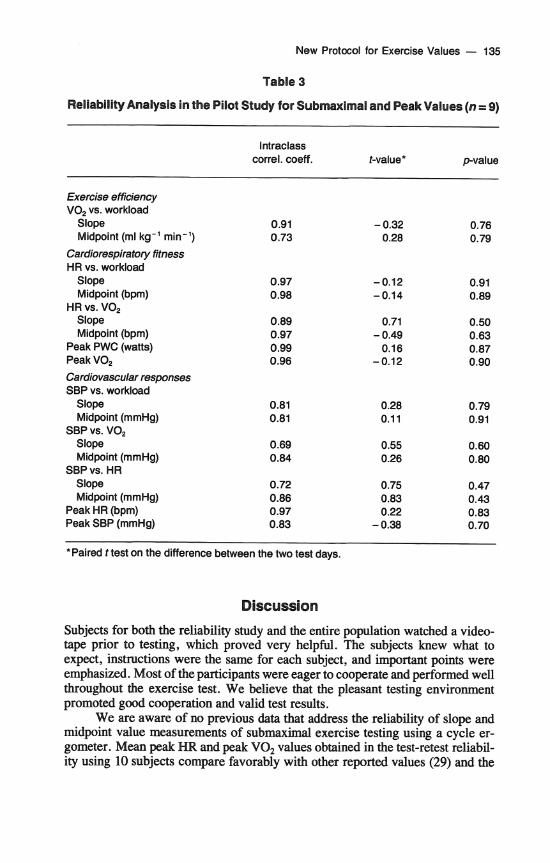
Data from one subject under each test condition in the reliability study did not meet criteria or were difficult to interpret and thus were not used in the final analysis. The results for the between-day reliability are found in Table 3. No significant mean differences were seen on the slopes and predicted midpoints between the two test days. The intraclass correlation coefficients were between r=0.69 and r=0.99.
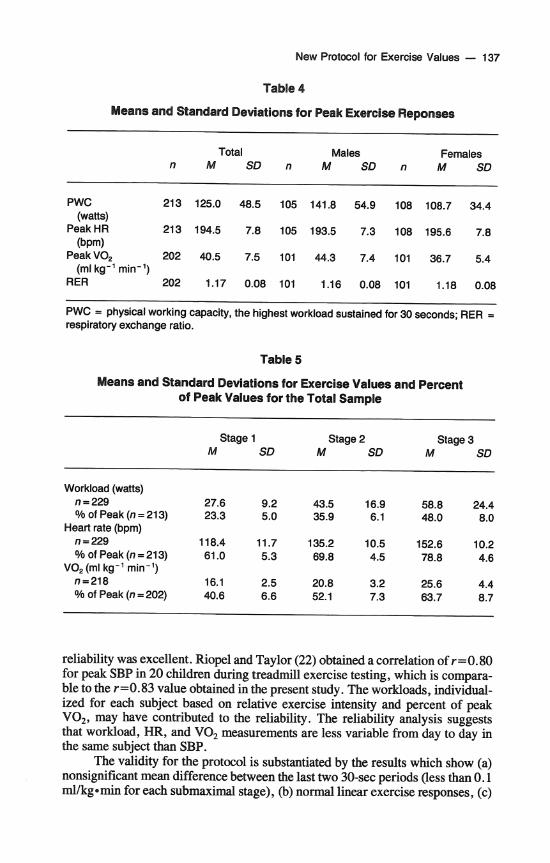
Normal exercise responses were seen in both the reliability study and the larger study. The linearity of the exercise responses is shown in Figure 1. Of the 237 subjects tested, 213 were considered valid for peak HR (90%), and 202 (85 %) for peak VO,. Mean for peak HR was 194.5 (+7.8), and for peak VO, it was 40.5 ( + 7.5) (see Table 4).
The mean values for each submaximal stage and percent of peak values are presented in Table 5. The mean difference in VO, for the last two 30-sec periods for each submaximal stage was less than 0.1 mllkg-min. Paired t tests indicated no significant mean difference between these 30-sec periods. The mean values for the third steady-state stage for the present study were 63.7% of peak VO,. The third stage mean for percent of peak HR in the present study was 78.8 % .
The mean RER for peak VO, was 1.17 ( f 0.08), with 84.2 % of the values equal to or above 1.1. Over 56% of the subjects felt that breathlessness alone or in conjunction with leg fatigue was the primary reason for stopping. The mean peak HR for those who cited breathlessness or a combination of breathlessness and leg fatigue was 195.4 (f 8.0), compared to a mean peak HR of 193.5 (f 7.3) for those who cited leg fatigue. The mean RER value for those reporting leg fatigue (Category 1) and those who reported only breathlessness as a limitation (Category 2) was the same (1.17).
New Protocol for Exercise Values - 135
Table 3
Reliability Analysis in the Pilot Study for Submaximal and Peak Values (n = 9)
*Paired t test on the difference between the two test days.
Discussion
Subjects for both the reliability study and the entire population watched a video- tape prior to testing, which proved very helpful. The subjects knew what to expect, instructions were the same for each subject, and important points were emphasized. Most of the participants were eager to cooperate and performed well throughout the exercise test. We believe that the pleasant testing environment promoted good cooperation and valid test results.
We are aware of no previous data that address the reliability of slope and midpoint value measurements of submaximal exercise testing using a cycle er- gometer. Mean peak HR and peak V02 values obtained in the test-retest reliabil- ity using 10 subjects compare favorably with other reported values (29) and the
136 - Golden, Janz, Clarke, and Mahoney
Workload (watts)
Workload (wattd
Figure 1 - Typical exercise responses (three submaximal steady-state and peak) of a small (upper panel) and large (lower panel) subject for V02 (ml/kg.min) versus workload (watts).
New Protocol for Exercise Values - 137
Table 4
Means and Standard Deviations for Peak Exercise Reponses
reliability was excellent. Riopel and Taylor (22) obtained a correlation of r=0.80 for peak SBP in 20 children during treadmill exercise testing, which is compara- ble to the r =O. 83 value obtained in the present study. The workloads, individual- ized for each subject based on relative exercise intensity and percent of peak VOz, may have contributed to the reliability. The reliability analysis suggests that workload, HR, and VO, measurements are less variable from day to day in the same subject than SBP.
The validity for the protocol is substantiated by the results which show (a) nonsignificant mean difference between the last two 30-sec periods (less than 0.1 rnllkgernin for each submaximal stage), (b) nonnal linear exercise responses, (c)
138 - Golden, Janz, Clarke, and Mahoney
normal mean peak HR and VO, values, and (d) high mean peak RER of 1.17 (f 0.08). The nonsignificant mean difference of less than 0.1 ml/kg*min for the last two 30-sec periods of each submaximal stage demonstrated that steady-state values were achieved. In children, steady-state is usually reached in 1-112 min- utes (14).
The levels of VO, and HR during the steady-state submaximal exercise should be on the linear portion of the response curve, as evidenced by the percent of peak VO, and percent of peak HR for each stage. The mean values for the percentage of peak HR and VO, reached at each submaximal stage was in the targeted range. Compared to a study by Washington et al. (29), our mean value of 63.7 % of peak VO, was within the aerobic range. The mean value of 78.8 % of peak HR for the third stage was within the aerobic range. Above 85% of the predicted maximal HR, the relationship between HR and workload is often nonlinear (10).
The mean values for peak HR compare favorably with other reported val- ues (6, 14, 17,21, 29). The values obtained for peak VO, were similar to those for V02max (mllkgmmin) reported for children in the U.S. tested with a ramp protocol on a cycle ergometer (6, 16). Values for V0,max for treadmill testing are known to be 7.4 to 7.9 % higher than cycle ergometer testing in children (16). Peak V0, values for subjects tested on a cycle ergometer are significantly higher in Europe (29). The high RER values obtained indicate that the subjects were exercising at a high level. In a study by Hergenroeder (12) of 39 adolescents undergoing V02max testing on an electromechanically braked cycle ergometer, 85 % reached an RER of 1.1, comparable to our values. The mean RER values for females in the present study were statistically higher than for males (1.18 vs. 1.16), but the physiological difference is small.
Practical Applications
Valid submaximal and peak exercise responses can be obtained in a wide range of subjects with an optimal test duration. The subjects exercised at approximately the same percent of their physical work capacity (physical workload), peak VO, (physiological work capacity), and peak HR for each of the three stages. The percentage of peak HR and peak VO, (ml/kg=rnin) at each stage was close to that expected. This consistency allows reliable comparisons of cardiovascular responses between different groups and between the sexes.
Submaximal exercise testing can provide useful information. The workload increments used in our protocol allowed three submaximal steady-state stages to be completed. The efficiency of performing work can be determined by evaluat- ing the linear relationship between physical workload (watts) and physiological workload (oxygen consumption, VO,), using submaximal steady-state stages (8, 15). The linear relationship between HR versus V02 and between HR versus workload is a measure of fitness (4). For example, decreased HR or rate of change of HR at representative submaximal workloads or VO, may indicate a more fit individual (5). SBP versus workload, SBP versus VO,, or SBP versus HR responses can also be assessed during submaximal testing (28).
Obtaining maximal exercise tests in children is often difficult due to lack of experience with maximal effort, lack of motivation, and choice of test protocol (26). In our study the percentage of valid peak VO, obtained was the same as previously reported during treadmill testing for over 200 subjects, ages 7 to 17 (10). In our subjects the exercise test lasted from 12 to 15 minutes, depending
New Protocol for Exercise Values - 139
on the number of ramp stages, and was within recommended 9- to 15-min guide- lines (7). Sufficient time was allowed for the cardiorespiratory system to be taxed without excess leg fatigue or boredom.
Conclusion
The population tested included a wide distribution of age and body weight, indi- cating that our protocol is applicable to populations of children and adolescents. The subjects were cooperative and able to complete both the submaximal and peak portions of the exercise test. Normal linear responses to submaximal exer- cise and peak values comparable to other studies were achieved. The number of tests considered valid was similar to those reported by others. Our protocol for exercise testing to obtain submaximal steady-state and peak values in children and adolescents was reliable, valid, and practical. It provides practitioners with another option for exercise testing a large group of children on a cycle ergometer.
pressure response to dynamic exercise in healthy children. J. Pediatr. 99:556-560, 1981.
2. American College of Sports Medicine. Guidelines for Exercise Testing and Exercise Prescription. Philadelphia: Lea & Febiger , 1980.
3. American College of Sports Medicine. Guidelines for Exercise Testing and Exercise Prescription (3rd 4.). Philadelphia: Lea & Febiger, 1986.
4. Astrand, P., and I. Rhyming. A nomogram for calculation of aerobic capacity (physi- cal fitness) from pulse rate during submaximal work. J. App. Physiol. 7:218-221, 1954.
5. Astrand, P., and K. Rodahl. Textbook of Work Physiology. New York: McGraw- Hill, 1986.
6. Braden, D., and W. Strong. Cardiovascular responses and adaptation to exercise in childhood. In: Perspectives in Exercise Science and Sports Medicine, Vol 11, C. Gisolfi and D. Lamb (Eds.). Indianapolis: Benchmark Press, 1989, pp. 293-329.
7. Christiansen, J., and W. Strong. Exercise Testing. In. Moss 'Heart Disease in Infants, ChiMren and Adolescents, F.H. Adams, G.C. Emmanoulides, and T.A. Riemensch- neider (Eds.). Baltimore: Williams & Wilkins, 1988, pp. 93-106.
8. Cooper, D., D. Weiler-Ravell, B. Whipp, and K. Wasserman. Growth-related changes in oxygen uptake and heart rate during progressive exercise in children. Pediat. Res. 18:845-851, 1984.
9. Cunningham, D., B. Van Waterschoot, D. Paterson, M. Lefcoe, and S. Sangal. Reliability and reproducibility of maximal oxygen uptake measurement in children. Med. Sci. Sports 9(2): 104-108, 1977.
10. Fraser, G., R. Phillips, and R. Harris. Physical fitness and blood pressure in school children. Circulation 67:405-412, 1987.
1 1. Golden, J.E. Responses to gmded exercise testing in normal children with high and low left ventricular mars. Doctoral dissertation, University of Iowa, 1990.
12. Hergenroeder, A., and R. Schoene. Predicting maximum oxygen uptake in adoles- cents. AJDC 143:673-677, 1989.
13. James, F., C. Blomquist, M. Freed, W.W. Miller, J.H. Moller, E.W. Nugent, D.A. Riopel, et al. Standards for exercise testing in the pediatric age group. Circulation 66: 1377A-1379A, 1982.
140 - Golden, Janz, Clarke, and Mahoney
14. James, F., S. Kaplan, C. Glueck, J. Tsay, M. Knight, and C. Sarwar. Responses of normal children and young adults to controlled bicycle exercise. Circulation 61:902- 912, 1980.
15. Klausen, K., B. Rasmussan, L. Glensgaard, and 0. Jensen. Work efficiency in chil- dren during submaximal exercise. In: Children and Exercise XI, R. Binkhorst, H. Kemper, and W. Saris (Eds.). Champaign, IL: Human Kinetics, 1983, pp. 210-217.
16. Krahenbuhl, G., J. Skinner, and W. Kohrt. Developmental aspects of maximal aero- bic power in children. Exer. Sport Sci. Rev. 13503-538, 1985.
17. Londeree, B., and M. Moeschberger. Effect of age and other factors on maximal heart rate. Res. Quart. Exer. Sport 53(4):297-304, 1982.
18. National Heart Lung and Blood Institute: Task Force on Blood Pressure Control in Children. Pediatrics 79: 1-25, 1987.
19. Nordeen-Snyder, K: The effect of bicycle seat height variation upon oxygen con- sumption and lower limb kinematics. Med. Sci. Sports 9(2): 113-1 17, 1977.
20. Pollock, M., J. Wilmore, and S. Fox. Exercise in Health and Disease. Philadelphia: Saunders, 1984.
21. Ricard, R., L. Leger, and D. Massicotte. Validity of the "220-age" formula to predict maximal heart rate. Med. Sci. Sport Exer. 22(2): S96 (abstract), 1990.
22. Riopel, D., and H. Taylor. Blood pressure, heart rate, pressure-rate product and electrocardiographic changes in healthy children during treadmill exercise. Am. J. Cardiol. 44:697-704, 1979.
23. Ritmeester, J., H. Kemper, and R. Verschuur. Is a leveling-off criterion in oxygen uptake a prerequisite for a maximal performance in teenagers? In: Children and ExerciseXZ, R. Binkhorst, H. Kemper, and W. Saris (Eds.). Champaign, IL: Human Kinetics, 1983, pp. 161-169.
24. Rowland, T., J. Auchinachie, T. Keenan, and G. Green. Physiological responses to treadmill running in adult and prepubertal males. Znt. J. Sports Med. 8:292-297, 1988.
25. Rowland, T., and G. Green. Physiological responses to treadmill exercise in females: Adult-child differences. Med. Sci. Sport Exer. 20(5):474478, 1987.
26. Sharkey, B. Physiology of Fitness (3rd 4.). Champaign, IL: Human Kinetics, 1990. 27. Strong, W., D. Spencer, M. Miller, and M. Salehbhai. The physical working capac-
ity of healthy black children. Am. J. Dis. Child. 132:244-248, 1978. 28. Wanne, O., and E. Haapoja. Blood pressure during exercise in healthy children. Eur.
J. Appl. Physiol. 58:62-67, 1988. 29. Washington, R., J. van Gundy, C. Cohen, H. Sandheimer, and R. Wolfe. Normal
aerobic and anaerobic exercise data for North American school-age children. J. Pedi- atr. 112:223-233, 1988.
30. Zwiren, L. Anaerobic and aerobic capabilities of children. Pediat. Exer. Sci. 1:31- 44,1989.
Acknowledgment
Supported by grants from the National Institute of Health Specialized Center for Research in Atherosclerosis, 2P50-HL14230, Juvenile Hypertension Program, HL 35600, and the Foundation for Physical Therapy.
The authors thank the Muscatine Field team for help with data collection; David H. Nielsen, PhD, associate professor, physical therapy education, University of Iowa,