10/21/2002 1 Final Report SERDP/SEED Pulsed Acoustic Sparker Bio-Fouling Control in Heat Transfer Equipment Phoenix Science and Technology, Inc. 27 Industrial Avenue Chelmsford, MA 01824 978.367.0232 Contact: Dr. Raymond B. Schaefer [email protected]Background Within DoD, biological fouling is a problem in U.S. Navy ships and submarines (heat exchangers, condensers and seawater piping systems) and for the U.S. Army Corps of Engineers (dams, locks, and hydroelectric plants). Biofouling adversely effects system performance by decreasing heat transfer and blocking the flow of water. Chlorination is an effective antibiofouler, but has negative environmental impacts and does not meet federal and state regulations. Biofouling of heat exchangers and piping systems in heat transfer equipment is a major problem in Navy ships and submarines, commercial vessels, as well as land-based cooling systems (e.g. hydroelectric plants, locks, dams, etc.). Biofouling inhibits heat transfer and plugs system components. The primary biofouling control technique is chlorination, which is effective but has negative environmental impacts. For example, some byproducts generated by chlorination are carcinogenic. Consequently, regulatory actions both are in place and under consideration that limit the use of chlorination. The Clean Water Act prohibits the discharge of chlorinated seawater from cooling systems and a proposed Uniform National Discharge Standards regulation would further restrict the use of chlorine for biofouling control. Consequently, environmentally benign technologies are needed to prevent biological fouling. Objectives The objective of this SEED program was to demonstrate the feasibility of using pressure pulses from a sparker acoustic source to control microfouling (i.e., slime) in heat exchanger pipes. The long-term objective is to develop sparker technology for controlling biofouling that meets the Statement of Needs (SON) to control both microbiological and macrobiological fouling, meets state and federal discharge requirements, eliminates requirements for hazardous materials storage and is economically feasible. Technical Approach The technical approach is to direct pressure pulses generated by a sparker along the inside of pipes to prevent biofouling, shown conceptually in Figure 1. We, Phoenix Science & Tech- nology (PS&T) have used this approach for preventing macrofouling due to Zebra mussels (1,2) , where the pressure pulse prevents new growth from attaching to the inside of the pipe. In addition, we have been developing new sparker technology for two Navy applications, submarine countermeasures and for a new tactical acoustic measurement (TAM) buoy (3-4) . Our
Transcript
10/21/2002 1 Final Report SERDP/SEED
Pulsed Acoustic Sparker Bio-Fouling Control in Heat Transfer Equipment
Phoenix Science and Technology, Inc. 27 Industrial Avenue Chelmsford, MA 01824 978.367.0232 Contact: Dr. Raymond B. Schaefer [email protected]
Background
Within DoD, biological fouling is a problem in U.S. Navy ships and submarines (heat exchangers, condensers and seawater piping systems) and for the U.S. Army Corps of Engineers (dams, locks, and hydroelectric plants). Biofouling adversely effects system performance by decreasing heat transfer and blocking the flow of water. Chlorination is an effective antibiofouler, but has negative environmental impacts and does not meet federal and state regulations.
Biofouling of heat exchangers and piping systems in heat transfer equipment is a major problem in Navy ships and submarines, commercial vessels, as well as land-based cooling systems (e.g. hydroelectric plants, locks, dams, etc.). Biofouling inhibits heat transfer and plugs system components.
The primary biofouling control technique is chlorination, which is effective but has negative environmental impacts. For example, some byproducts generated by chlorination are carcinogenic. Consequently, regulatory actions both are in place and under consideration that limit the use of chlorination. The Clean Water Act prohibits the discharge of chlorinated seawater from cooling systems and a proposed Uniform National Discharge Standards regulation would further restrict the use of chlorine for biofouling control. Consequently, environmentally benign technologies are needed to prevent biological fouling. Objectives
The objective of this SEED program was to demonstrate the feasibility of using pressure pulses from a sparker acoustic source to control microfouling (i.e., slime) in heat exchanger pipes. The long-term objective is to develop sparker technology for controlling biofouling that meets the Statement of Needs (SON) to control both microbiological and macrobiological fouling, meets state and federal discharge requirements, eliminates requirements for hazardous materials storage and is economically feasible. Technical Approach
The technical approach is to direct pressure pulses generated by a sparker along the inside of pipes to prevent biofouling, shown conceptually in Figure 1. We, Phoenix Science & Tech- nology (PS&T) have used this approach for preventing macrofouling due to Zebra mussels (1,2), where the pressure pulse prevents new growth from attaching to the inside of the pipe. In addition, we have been developing new sparker technology for two Navy applications, submarine countermeasures and for a new tactical acoustic measurement (TAM) buoy (3-4). Our
Report Documentation Page Form ApprovedOMB No. 0704-0188
Public reporting burden for the collection of information is estimated to average 1 hour per response, including the time for reviewing instructions, searching existing data sources, gathering andmaintaining the data needed, and completing and reviewing the collection of information. Send comments regarding this burden estimate or any other aspect of this collection of information,including suggestions for reducing this burden, to Washington Headquarters Services, Directorate for Information Operations and Reports, 1215 Jefferson Davis Highway, Suite 1204, ArlingtonVA 22202-4302. Respondents should be aware that notwithstanding any other provision of law, no person shall be subject to a penalty for failing to comply with a collection of information if itdoes not display a currently valid OMB control number.
1. REPORT DATE 21 OCT 2002 2. REPORT TYPE
3. DATES COVERED 00-00-2002 to 00-00-2002
4. TITLE AND SUBTITLE Pulsed Acoustic Sparker Bio-Fouling Control in Heat Transfer Equipment
5a. CONTRACT NUMBER
5b. GRANT NUMBER
5c. PROGRAM ELEMENT NUMBER
6. AUTHOR(S) 5d. PROJECT NUMBER
5e. TASK NUMBER
5f. WORK UNIT NUMBER
7. PERFORMING ORGANIZATION NAME(S) AND ADDRESS(ES) Phoenix Science and Technology, Inc.,27 Industrial Avenue,Chelmsford,MA,01824
8. PERFORMING ORGANIZATIONREPORT NUMBER
9. SPONSORING/MONITORING AGENCY NAME(S) AND ADDRESS(ES) 10. SPONSOR/MONITOR’S ACRONYM(S)
11. SPONSOR/MONITOR’S REPORT NUMBER(S)
12. DISTRIBUTION/AVAILABILITY STATEMENT Approved for public release; distribution unlimited
13. SUPPLEMENTARY NOTES
14. ABSTRACT
15. SUBJECT TERMS
16. SECURITY CLASSIFICATION OF: 17. LIMITATION OF ABSTRACT Same as
Report (SAR)
18. NUMBEROF PAGES
20
19a. NAME OFRESPONSIBLE PERSON
a. REPORT unclassified
b. ABSTRACT unclassified
c. THIS PAGE unclassified
Standard Form 298 (Rev. 8-98) Prescribed by ANSI Std Z39-18
10/21/2002 2 Final Report SERDP/SEED
approach for this SEED program was to apply the pressure technique used for zebra mussels to microfouling on the inside of heat exchanger pipes using sparker system technology adapted from the Navy programs. The pressure pulse technique has the potential to control biological fouling without the use of chlorine or other chemical additives, and thus satisfies state and federal discharge requirements. Furthermore, a sparker bio-controller would eliminate the requirements for hazardous materials storage. Sparkers also are economically attractive based on the zebra mussels field tests (1), where sparkers are a cost competitive alternative to chlorine. Furthermore, sparkers are simple and rugged, and their performance is not sensitive to impurities in the water or temperature variations.
Pressure Pulse
Sparker
Sparker Controls and Power
Pipe
Acoustic Reflector
Figure 1 SEED Sparker Biofouling Control Concept This concept has prevented biofouling at municipal water plants (1,5), where the target
nuisance is the zebra mussel. In one installation(1), a single sparker pulse, generated every thirty seconds, has for over four years prevented biofouling of a 16" diameter pipe, 1800 feet long, which transports 750,000 gallons per day. The pipe is free of biofouling for approximately 1700 feet, with an acceptably small amount of growth the last 100 feet.
We also conducted two additional tests showing sparker control of slime. First, in field tests this summer (2002) sponsored by the Army Corps of Engineers, the sparker prevented growth of slime on test samples up to fifty feet from the sparker in a water intake pipe. Second, in a recent laboratory experiment we conducted in collaboration with Duke University, a sparker inactivated two microorganisms, including MS2 bacteriophage.
For heat exchangers, the biofouling control concept is the same except the heat exchanger (i.e., an array of relatively small diameter pipes) replace the single large pipe exhibited in Figure 1. For an implementation of this concept into a ship or submarine, we envision using a single sparker or a small array or series of sparkers to control biofouling of a heat exchanger.
Prior to the SEED program we developed sparker systems for Navy applications (6-10), including sonar, mine sweeping, submarine countermeasures and an environmental sonobuoy. We developed high efficiency, long lifetime and compact sparker systems. This sparker technology has direct application for biofouling control in heat transfer equipment.
The sparker system has an electrical driver, a sparker "head" and housing in case of in-line system. A capacitor (electrical energy storage device) is charged to high voltage (5-10 kV)
10/21/2002 3 Final Report SERDP/SEED
and then a switch is closed, allowing the electrical energy to discharge into the sparker head. The pulsed electrical discharge vaporizes a small volume of surrounding water, producing a strong pressure pulse. The vaporized water forms a high-pressure gas cavity that expands and collapses, producing additional pressure pulses. An example sparker pressure waveform is shown in Figure 2. After the first, electrically driven pressure peak, two additional pressure peaks from cavity collapses occur at just over 6 and 9 milliseconds. Each pressure peak is on the order of 20 microseconds long, with a maximum pressure, in this example, of about 100 atmospheres at four inches from the sparker. The propagation of these high peak pressures, bouncing along the inside surface of the pipe, prevents biological organisms from attaching or growing.
-1 0 1 2 3 4 5 6 7 8 9 10 -2
0
2
4
6
8
10
12
14 x 10 11
Time, (msec)
Pressure, (upa ref. @ 1m)
Figure 2. Example Sparker Pressure Waveform.
Summary
Field tests in this SEED program successfully showed that sparker pressure pulses can control slime growth on the inside of heat exchanger pipes. Two sparker units were built and tested in the laboratory, and then used in feasibility tests of biofouling control at the NSWCDD Corrosion Test Facility, Dana, FL. Each sparker was integrated with a twenty foot long 5/8” diameter titanium pipe, along with three control pipes and operated for approximately one month (6/18/02 – 7/17/02). Ocean water flowed through the pipes during the tests and slime growth monitored in one pipe. At the end of the tests, the pipes were sectioned and the biomass accumulation determined for all pipes.
The results of the field test show the feasibility of controlling slime with sparker pressure pulses. Also, the in-line sparker was more effective than the wet-well one. However, the control pipes showed a large variability in biomass that precluded quantitative assessment. We
10/21/2002 4 Final Report SERDP/SEED
recommend that laboratory tests be conducted to both quantify sparker slime control and determine sparker operating parameters that are most effective at controlling slime.
Based on the results of this SEED program, success in laboratory and field tests, and success with zebra mussels (1-2), the sparker has potential for complete control of biofouling.
Project Accomplishments
Introduction In this SEED project we built and field-tested two sparker modules based on sparkers we
had developed for the Navy (3-4). These tests demonstrate the feasibility of our sparker approach, which employs a sparker pressure pulse generated in water either in line with a pipe or near the entrance to the pipe(s). The pressure pulse propagates along the inside of the pipe, preventing the growth of aquatic nuisances.
Sparkers emit strong pulses of sound generated by a pulsed electric discharge between electrodes in water. One approach already investigated (11) by the Navy is to attach a sparker to the outside of a pipe and the pulse vibrates the pipe. In that approach, the pipe serves as one electrode of the sparker, so that the approach is only amenable to metal pipes. This concept was tested in 1998 at the NSWCCD Corrosion Test Facility, Dina, FL. Based on information available to us (11-12), biofouling control was partially successful.
The approach investigated in this SEED program, shown conceptually in Figure 1, employs a sparker that generates a pressure pulse that propagates along the inside of the pipe, which prevents slime growth. Unlike the previous approach (11), our sparker has two electrodes and can be used for pipes of different materials. Thus the sparker approach of this SEED project is efficient, can be used for all types of pipes without intentionally generating mechanical vibrations. This SEED project had two phases, the first to develop and test two sparkers in the laboratory and the second to conduct field tests at the NSWCCD Corrosion Test Facility, Dana, FL, described in the next two sections.
Sparker Development A new sparker head exhibited in Figure 3 was designed, fabricated and tested in the lab.
The diagram, Figure 3a, shows a cross section of the sparker head. Two electrodes opposing one another are encased in a dielectric material. The high voltage discharge is across the gap. The electrical connections are made at the outside of the casing, shown in Figure 3b.
The sparker head shown in Figure 3a was implemented in two different configurations, shown in Figure 4. In both cases the sparker is controlled remotely and powered through cables. The “wet-well” implementation (see Figure 4a) is similar to that shown above in Figure 1. The sparker head is placed in a wet-well directly in front of the pipe.
For the “in-line” implementation (see Figure 3b and 4b), the sparker head is attached to the pipe on both sides and the water flows through the sparker head. The pressure pulse propagates in both directions. The advantage of the “in-line” sparker is efficient coupling of the pressure pulse into the pipe without the need of a reflector. The advantage of the “wet-well” sparker is the potential for one sparker to be used for an array of pipes. For both cases the pressure pulse, which has many directional components bouncing along the inside of the pipe, prevents aquatic nuisances from forming on the inside of the pipe.
10/21/2002 5 Final Report SERDP/SEED
(a) (b)
Figure 3 Sparker Heads Developed for SEED Project, showing section of sparker head (a) and entire in-line speaker with electrical connection outside of casting (b).
Two electrical drivers were assembled and packaged for field-testing. The electrical drivers consisted of high voltage power supply, energy storage capacitors and closing switches. The wet-well driver had a capacitance of 32 µF and the in-line a capacitance of 8 µF. Each circuit had a current and a high voltage probe, attached to a digital oscilloscope, to monitor
Dielectric materials Electrode Gap
Electrode connection
Pipe connection
Sparker Controls And Power
In-line
Pipe
Pressure pulse
Pressure pulse
Pipe
Sparker Controls and Power
Wet - well
Pressure pulse
Pipe
10/21/2002 6 Final Report SERDP/SEED
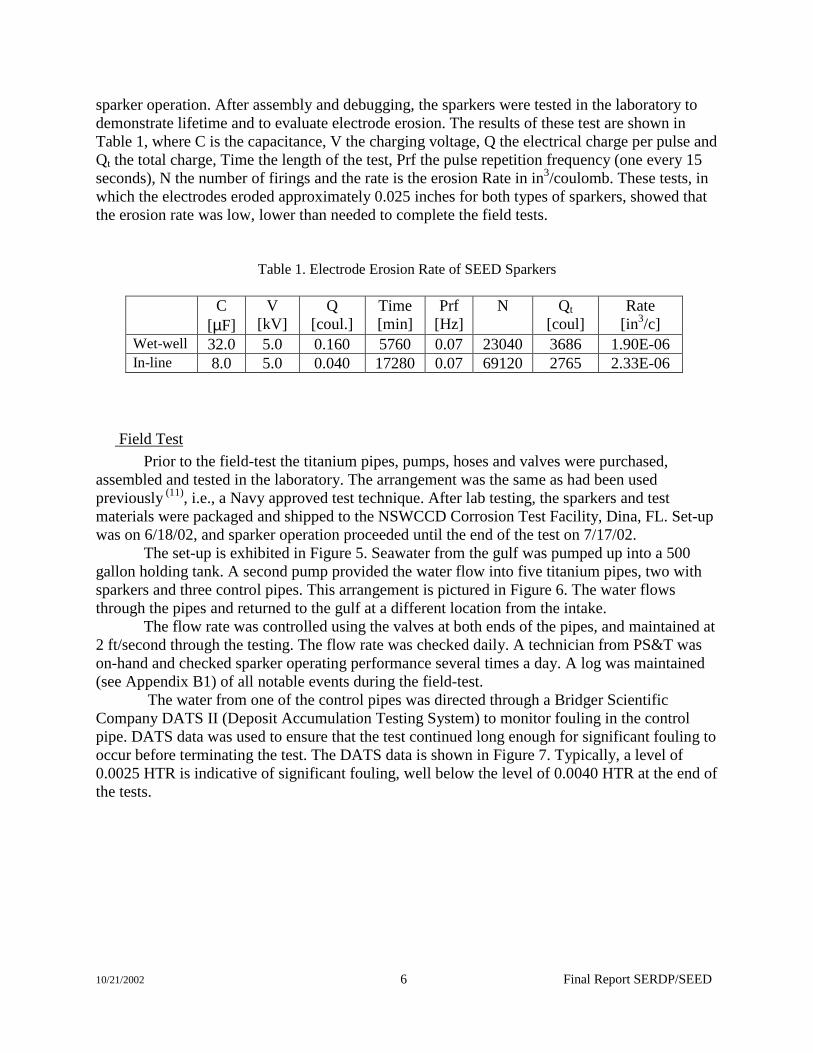
sparker operation. After assembly and debugging, the sparkers were tested in the laboratory to demonstrate lifetime and to evaluate electrode erosion. The results of these test are shown in Table 1, where C is the capacitance, V the charging voltage, Q the electrical charge per pulse and Qt the total charge, Time the length of the test, Prf the pulse repetition frequency (one every 15 seconds), N the number of firings and the rate is the erosion Rate in in3/coulomb. These tests, in which the electrodes eroded approximately 0.025 inches for both types of sparkers, showed that the erosion rate was low, lower than needed to complete the field tests.
Field Test Prior to the field-test the titanium pipes, pumps, hoses and valves were purchased,
assembled and tested in the laboratory. The arrangement was the same as had been used previously (11), i.e., a Navy approved test technique. After lab testing, the sparkers and test materials were packaged and shipped to the NSWCCD Corrosion Test Facility, Dina, FL. Set-up was on 6/18/02, and sparker operation proceeded until the end of the test on 7/17/02.
The set-up is exhibited in Figure 5. Seawater from the gulf was pumped up into a 500 gallon holding tank. A second pump provided the water flow into five titanium pipes, two with sparkers and three control pipes. This arrangement is pictured in Figure 6. The water flows through the pipes and returned to the gulf at a different location from the intake.
The flow rate was controlled using the valves at both ends of the pipes, and maintained at 2 ft/second through the testing. The flow rate was checked daily. A technician from PS&T was on-hand and checked sparker operating performance several times a day. A log was maintained (see Appendix B1) of all notable events during the field-test.
The water from one of the control pipes was directed through a Bridger Scientific Company DATS II (Deposit Accumulation Testing System) to monitor fouling in the control pipe. DATS data was used to ensure that the test continued long enough for significant fouling to occur before terminating the test. The DATS data is shown in Figure 7. Typically, a level of 0.0025 HTR is indicative of significant fouling, well below the level of 0.0040 HTR at the end of the tests.
10/21/2002 7 Final Report SERDP/SEED
Figure 5 Field Test Set-Up for SEED Speaker Figure 6 Photograph of Test Lines Demonstration
Figure 7 DATS Data
After the completion of the test the apparatus was disassembled. Navy personnel used a
tube cutter to section the pipes into approximately one-foot lengths for biomass analysis. Each section was weighed, cleaned and weighed again. The weight difference is normalized to the
DATSRecorde
Wet - well k
A
B
C
D
E
Control Pi
In - line k
Pump500 G llTank
Pump
Sea
Titanium Pi
Valve
10/21/2002 8 Final Report SERDP/SEED
inside surface area of the pipe to provide a measure (in mg/cm2) of the biofouling mass. This procedure was carried out by Navy personnel, and their report is included in the Appendix B2.
The results for the in-line sparker, control pipe and wet-well sparker are shown in Figures 8-10. The in-line sparker had the best slime control with an average of about 0.50 mg/cm2 along the pipe (Figure 8), in comparison with the control pipe in Figure 9, which had an average of about 1.0 mg/cm2. The in-line sparker also had an unexpected result that the control was better downstream of the sparker (which was located at 10 feet in Figure 8) with about 0.40 mg/cm2 downstream in comparison to about 0.060 mg/cm2 upstream of the sparker. It is likely the water flow caused the second pressure peak (see Figure 2), which is from a bubble oscillation from the electrical pulse, to be carried to the downstream side of the electrodes, which in turn increased the biofouling control effect. In any case, the reduced biomass in the pipe demonstrates a significant control of slime growth. It remains for further experimental development to determine sparker operating conditions that will provide complete control of slime.
0.000
0.200
0.400
0.600
0.800
1.000
1.200
1.400
0 5 10 15 20 25
Tube Section #
Dry
Wei
ght (
mg/
cm2)
Figure 8 In-line Sparker Biofilm Weight vs. Tube Section Number
0.000
0.200
0.400
0.600
0.800
1.000
1.200
1.400
0 5 10 15 20 25
Tube Section #
Dry
Wei
ght (
mg/
cm2)
Figure 9 Control Line Biofilm Weight vs. Tube Section Number
10/21/2002 9 Final Report SERDP/SEED
0.000
0.200
0.400
0.600
0.800
1.000
1.200
1.400
0 5 10 15 20 25
Tube Section #
Dry
Wei
ght (
mg/
cm2)
Figure 10 Wet-Well Sparker Biofilm Weight vs. Tube Section Number
The results for the wet-well sparker shown in Figure 10, however, do not demonstrate
slime control. It is likely that, although the wet well sparker operated at four times the energy of the in-line sparker, which the coupling of pressure pulse into the pipe was very inefficient. For this SEED demonstration the wet-well sparker did not have a reflector. Further investigations will include measurements of the pressure inside the pipe. We are currently setting up a pressure pulse propagation experiment for zebra mussels applications (2) (with a 30 inch diameter pipe) that could be modified to use a titanium heat exchanger pipe in a follow on to this SEED program.
The variability of the biomass results for the control pipe was approximately +/- 0.5 mg/cm2, large enough to preclude a quantitative determination of the sparker effect. Consequently, we feel that the results of the relatively expensive field test results do not warrant further field tests. Instead, we recommend (see below) a series of laboratory slime control tests to determine sparker parameters that best control slime. Based on discussions with the Center for Biofilm Engineering and biologists (13), it is feasible to set up a laboratory slime control experiment with a response time of a few days (in comparison to the four weeks in the field tests) at a much lower cost. This would allow testing for a wide range of sparker operating parameters for a program the size of SEED.
VIII Conclusions
The results of this SEED program show that sparker pressure pulses can inhibit the growth of slime on the inside of titanium heat exchanger pipes. An innovative in-line sparker system tested at the NSWCCD Corrosion Test Facility, Dina, FL effectively controlled slime growth. Additional testing is needed to determine the sparker operating parameters (e.g., energy per pulse, pulse length, pulse repetition rate, reflector design) that optimize slime control with the sparker. IX. Transition Plan
This SEED program showed the feasibility of our sparker concept for controlling slime on heat exchanger pipes. However, we recommend (see next section) a year of additional
10/21/2002 10 Final Report SERDP/SEED
technical development prior to transition. Assuming success in that technical work, in the second year we will address technical and practical issues, leading to sparker use for fouling control in real heat exchangers and seawater piping systems in Navy vessels. These issues include potential effects of the pressure pulse on welds and joints, acoustic and electromagnetic signatures generated by the sparker, the effect of sparker operation on pumps and sensors in the lines and regulatory issues with using the sparker in Navy ships and submarines. Field tests on Navy ship would be in the third year.
Successful development will lead to manufacturing of sparker biocontrollers for heat transfer equipment that could be used on all ocean vessels. Furthermore, development of sparker systems for biocontrol in heat control equipment is synergistic with the need for biocontrollers for dams, locks, hydroelectric plants and municipal water supply systems.
The potential benefits to DoD/DoE include a cost benefit as well as an "enabling" benefit. The sparker used to control zebra mussels has lower capital and operating costs than the corresponding chlorination system. For heat transfer equipment we also expect the cost to be less for the sparker than chlorination. Perhaps more important is the "enabling" benefit, that a sparker biocontroller will meet CWA and UNDS regulations, and thus fulfill a current Navy need.
Also, the market size justifies commercialization once a methodology is established through research and development. The market potential for sparker anti-biofoulers is immense. For zebra mussels, independent market research indicates that the potential for immediate sales for unprotected sites that already need protection from zebra mussels is 500 units. Over the next few years sites that currently use chlorine control systems must be replaced and additional new sites that will require protection have a sales potential of about 5,000 units. The market for biofouling control of heat transfer equipment on ships and submarines also is large, with about $300K/year spent on each CVN-68 class aircraft carrier, and over $2.5M spent on the US Navy's submarine force in 1990.
We are developing a team to commercialize sparker technology for antibiofouling, and this, together with our sparker patent (6) will have a strong intellectual property position. We also are working with Kaiser Systems, Inc.(KSI), an internationally known manufacturer of high voltage power supplies and integrator of pulse power systems. We plan to form a team in which PS&T provides sparker expertise and application engineering and KSI manufacturing and financial support. The team's objective is to commercialize an environmentally friendly, safe, and cost-effective antibiofouler.
X. Recommendations
Although this SEED program showed promise for the use of sparker technology to control the slime growth, it did not allow us to go into the optimization of the sparker. The optimization results will further enhance efficiency of the sparker for the particular application, i.e. heat exchanger pipes. In addition, due to the large variability occurred in the control pipes during the field test, a new less costly means of test conformation is necessary. Therefore, we recommend a three-step program to develop an improved sparker system to control slime in heat control equipment.
The first step is to optimize sparker control in laboratory tests and design a sparker system that meets Navy requirements. This step builds on the feasibility demonstration of the SEED program, determining optimum sparker parameters for controlling slime. The second step is to address practical issues for sparker implementations into ships. The third step is to build and test the sparker in a heat exchanger system.
10/21/2002 11 Final Report SERDP/SEED
One aspect of optimizing the sparker involves the propagation of the pressure pulse along
the inside of the pipe and the other, for the wet-well sparker, is the coupling of the sparker pulse into the heat exchanger pipes adjacent to the sparker.
Sparker pressure pulses are impulsive (i.e. composed of short high pressure peaks), which means the acoustic spectrum is broadband, typically ranging from about 10 Hz to 100 kHz. Because of the small diameter of heat exchanger pipes (e.g. typically 5/8”), high frequency components propagate efficiently whereas low frequency components propagate poorly. The high frequency components of the sparker pulse are determined primarily by the pulselength of the electrical discharge. For a typical sparker circuit the pulselength is determined primarily by the capacitance. Furthermore, sound absorption in water increases with increasing frequency. Consequently, multiple inter-related factors determine the strength of the pressure pulse as it propagates along the pipe. Thus, we will measure the pressure propagation as a function of the capacitances. In an ongoing program sponsored by the EPA we are setting up a pulse propagation experiment for 30” diameter pipes. This set-up will help us to create a testing method using twenty feet, 5/8 inch diameter titanium pipes, and measure the pressure propagated along the pipe. Both in-line and wet-well configurations will be tested.
For the wet-well sparker reflectors will be fabricated and tested, to increase the efficiency of transferring sparker acoustic energy into the pipe. At a minimum, both parabolic and elliptical reflectors will be tested. We have developed and tested acoustic reflectors, and have a patent pending on sparker acoustic reflectors (14). We use ray-trace software to determine size and shape for a given configuration. Also, we are developing a model (in the EPA program) for the propagation of pressure pulses into and along pipes. We plan to employ this model to support experimental planning and analysis of the results.
The second step to optimize the sparker is to conduct design tests leading to a prototype design. This task addresses energy per pulse and pulse repetition frequency requirements for slime control. In order to conduct these tests a laboratory environment will be set up that promotes slime growth and allows fast assessment. Based on discussions with the Deputy Director of the Center for Biofilm Engineering and other biologists expert in biofilms (13), this environment is straightforward to set up. A water recirculation system will be set up with artificial seawater and using the pumps from SEED. Plastic tubing will be used to provide a visible assessment of slime growth. Two tubes with sparkers and a control tube will be used simultaneously. Clear visual evidence of slime growth in the control pipe is expected in two to three days. This will allow different sparker operation conditions to be tested every two to three days.
The energy per pulse and the pulse repetition frequency are the two key electrical parameters that will be varied during the experiments. The prototype speaker will be designed based on the test results and the analysis.
The combination of another SEED size effort in year one based on this recommendation along with on-going internal research and EPA (2) programs will determine sparker parameters for efficiency and controllability of slime on heat exchange pipes. A second year would address actual implementation issues and a third year the development and ship-board testing of a prototype sparker biofouling control system.
10/21/2002 12 Final Report SERDP/SEED
Reference
1. Schaefer, Raymond et. al. “Control of Zebra Mussel Fouling Using an Electric Sparker-Field Study and Evaluation of a Commercial Speaker”, 11th International Conference on Aquatic Invasive Species, Feb 2002.
2. Non-Toxic Control of Zebra Mussels, Phase II SBIR, Contract # 68-D-02-059, 2002 3. Schaefer, Raymond B. and Dan Flynn, "Development of a Sonobuoy Using Sparker Acoustic Sources
as an Alternative to Explosives", Oceans '99, MTS/IEEE. September 1999. 4. Schaefer, Raymond B., Demo of the Feasibility of an Impulsive Sparker Acoustic Source "A" Size
Sonobuoy, Final Report, Phase II SBIR, December 1999. 5. Mackie, G.L., Philip Lowry, & Clint Cooper, Progress Report on Studies to Determine Use of Plasma
Pulse Technology for Controlling Zebra Mussel Biofouling, 1999. 6. Schaefer, Raymond B., Sparker Source Systems, Patent Number 5,841,737, 1998. 7. Schaefer, Raymond B., “Spectral Control of Sparker Acoustic Sources”, Oceans ‘97 MTS/IEEE. Oct
1997. 8. Schaefer, Raymond B., “Insertion of SD Sparker Acoustic Sources into Sub Countermeasures”, Phase
I Phase I Final Report, December 1997. 9. Schaefer, Raymond B., Bambert, J. et. al., “ALISS Design Tests”, Test Report, Nov 1995. 10. Schaefer, Raymond B., Evaluation of a Controllable Impulsive Surface Discharge Acoustic Source
for "A" Size Sonobuoy Application, Final Report for NAWC, 1996. 11. Brizzolara, Robert, A., Marianne Walch, David J. Nordham, et. al., Pulsed Acoustics for Biofouling
Control in Heat Exchangers and Piping Systems. 1998. 12. Personal communication: Bob Brizzolara. 13. Personal Communications, Dr. Phil Stuart, Deputy of the Center for Biofilm Engineering, RNT
Consulting, Brigham Young, September 2002. 14. High Efficiency Long Lifetime Sparker Sources, Serial No. 10/114,863, Filed April 2002.
Appendix A No published technical papers.
Appendix B1: Field Test Progress Report at Navy Corrosion Lab (Dina, FL) 6/18/02: Setup system 45-48 msem conductivity. 6/19/02: repaired positive wire in wet well after running 12 hours. 6/20/02: 15uF cap shorted on wet well and positive wire on inline broke off.
6/21/02: Spark gap failed in on wet well would not stop firing and positive electrode eroded.
6/22/02: No Problems 43-45 msem conductivity. 6/23/02: Replaced positive & negative wires on wet well new positive electrode and body installed valves at output to allow wet well to fill completely. 6/24-28/02: No problems. 6/29/02: Replaced in line sparker, checked wet-well turn system back on lost controller and both power supplies replaced spark gap on wet well. inline sparker up and running right away 7/1/02: Replaced power supplies and controllers. Wet well down three days 7/1-5/02: No Problems.
10/21/2002 13 Final Report SERDP/SEED
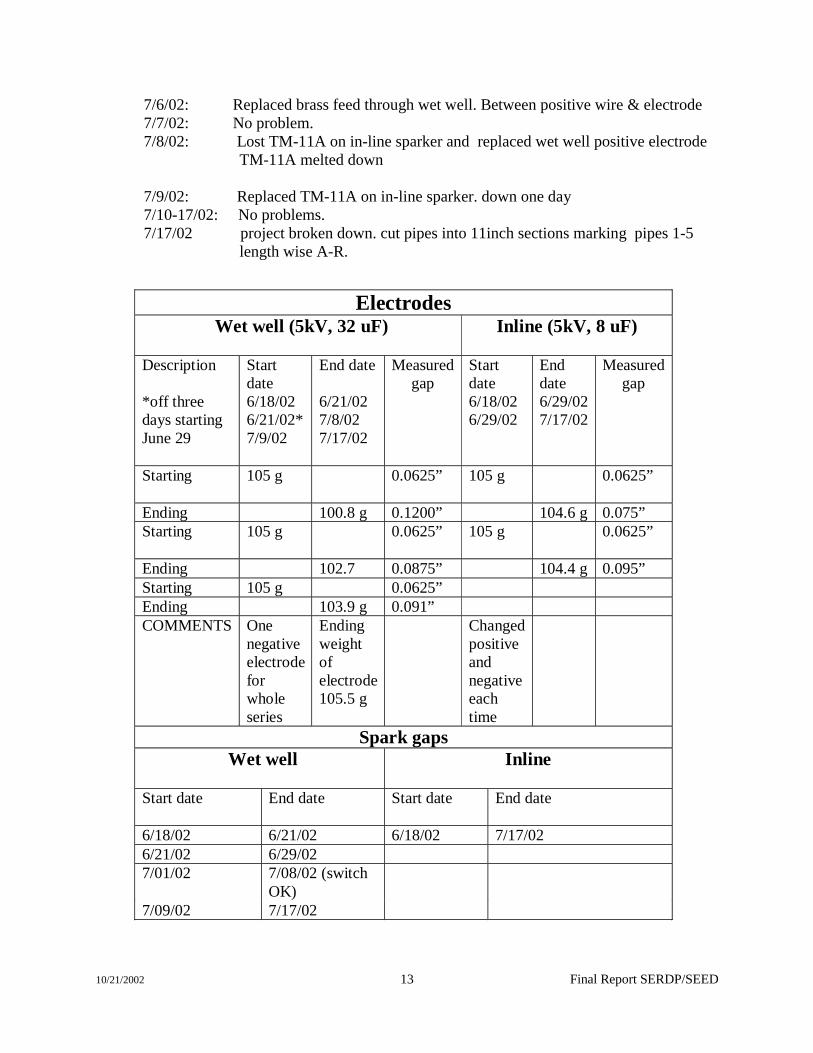
Electrodes Wet well (5kV, 32 uF)
Inline (5kV, 8 uF)
Description *off three days starting June 29
Start date 6/18/02 6/21/02* 7/9/02
End date 6/21/02 7/8/02 7/17/02
Measured gap
Start date 6/18/02 6/29/02
End date 6/29/02 7/17/02
Measured gap
Starting
105 g 0.0625” 105 g 0.0625”
Ending 100.8 g 0.1200” 104.6 g 0.075” Starting
105 g
0.0625”
105 g 0.0625”
Ending 102.7 0.0875” 104.4 g 0.095” Starting 105 g 0.0625” Ending 103.9 g 0.091” COMMENTS One
7/6/02: Replaced brass feed through wet well. Between positive wire & electrode 7/7/02: No problem. 7/8/02: Lost TM-11A on in-line sparker and replaced wet well positive electrode TM-11A melted down 7/9/02: Replaced TM-11A on in-line sparker. down one day 7/10-17/02: No problems. 7/17/02 project broken down. cut pipes into 11inch sections marking pipes 1-5 length wise A-R.
10/21/2002 14 Final Report SERDP/SEED
Appendix B2: Navy Memorandum 645-RAB 20 August 2002
MEMORANDUM From: 645 (Brizzolara) To: 613 (Regis Conrad) Subj: Dry Weight Analysis of Ti tubes Sample Submitted: 110 5/8” diameter Ti tubes, each of approximate length 1’. These
tubes were labeled A1:A22, B1:B22, C1:C22, D1:D22 and E1:E22. These labels represent 5 test lines, A, B, C, D and E. The titanium tube that comprised each test line was cut into 22 sections. Two of the test lines were treated with a biofouling control device and three were untreated controls.
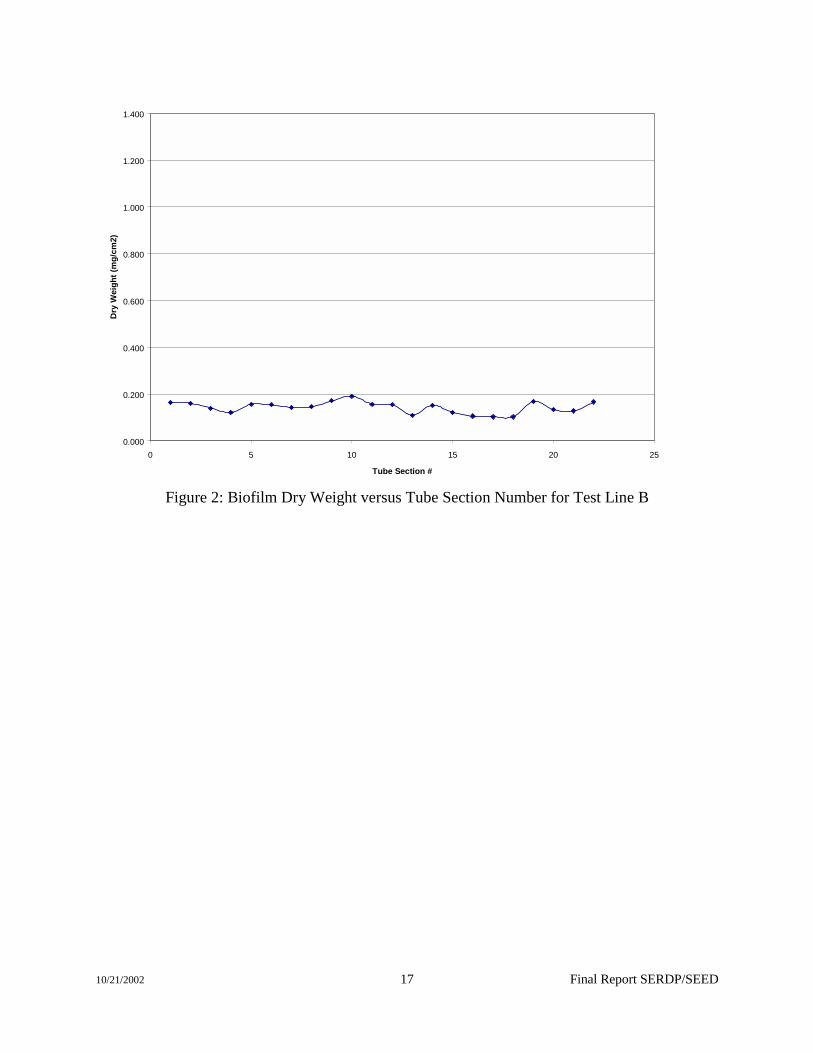
Conclusions: The dry weight for test line B, 0.14 mg/cm2, was significantly lower than
the dry weights of the other four test lines. Test lines D and E had mid-range dry weights (0.59 and 0.50 mg/cm2) and test lines A and C had the highest dry weights (1.14 mg/cm2 and 1.02 mg/cm2). The average dry weight of sections 1-11 of test line E was significantly higher than that for sections 12-22.
Analysis Procedure: After the seawater flow in the pipes was shut off at the end of the test, the titanium tubes were sectioned into approximately 1’ lengths using a tube cutter. The tube sections were stored moist, in a refrigerator, until dry weight measurements were performed approximately 1-2 weeks later. Dry weight measurements were performed as follows. Each tube section was rinsed gently with a 50% dilution of seawater in deionized water to remove loose material. The rinsed tubes were dried at 105 oC overnight and weighed. Each tube was then scrubbed with a test tube brush under flowing water to remove all material from its interior. The tubes were then dried and weighed again. The weight difference before and after swabbing gives the dry weight of biofouling material. The biomass measurement employed in this test measures both inorganic and biological deposits; however, visual and microscopic observation in previous tests showed the deposits obtained under these conditions to be predominantly microbial fouling.
Results: Plots of the dry weight as a function of tube section number are shown in
Figures 1 through 5. The average dry weight for each test line, A-E, is given in the table.
10/21/2002 15 Final Report SERDP/SEED
Table 1: Average dry weight for each test line.
Tube Average Dry Weight (mg/cm2)
A 1.14 B 0.14 C 1.02 D 0.59 E 0.50
Tube B has significantly lower dry weight than the other four tubes. Tubes D and E have
mid-range dry weights and tubes A and C have the highest dry weights. The dry weights of Tubes A and C are typical for untreated tubes for a 1-month test at this test site. Tubes D and E, while a bit low, are also somewhat typical of untreated tubes for a 1-month test at this test site.
Table 2 shows the average dry weight for each test line for sections 1-11 and 12-22. Table 2: Average dry weight for each test line for sections 1-11 and 12-22. Tube Avg Dry Weight,
Sections 1-11
Avg. Dry Weight, Sections 12-22
A 1.17 1.10 B 0.16 0.13 C 1.02 1.01 D 0.63 0.56 E 0.62 0.39 The dry weight for each half of the test line is virtually identical for test lines A, B, C and
D. For test line E, however, the dry weight in Sections 1-11 is significantly higher than for sections 12-22.
Job Order Number: 37 hours were charged to 02-1-6130-406-20
10/21/2002 16 Final Report SERDP/SEED
Figure 1: Biofilm Dry Weight versus Tube Section Number for Test Line A
0.000
0.200
0.400
0.600
0.800
1.000
1.200
1.400
0 5 10 15 20 25
Tube Section #
Dry
Wei
ght (
mg/
cm2)
10/21/2002 17 Final Report SERDP/SEED
Figure 2: Biofilm Dry Weight versus Tube Section Number for Test Line B
0.000
0.200
0.400
0.600
0.800
1.000
1.200
1.400
0 5 10 15 20 25
Tube Section #
Dry
Wei
ght (
mg/
cm2)
10/21/2002 18 Final Report SERDP/SEED
Figure 3: Biofilm Dry Weight versus Tube Section Number for Test Line C
0.000
0.200
0.400
0.600
0.800
1.000
1.200
1.400
0 5 10 15 20 25
Tube Section #
Dry
Wei
ght (
mg/
cm2)
10/21/2002 19 Final Report SERDP/SEED
Figure 4: Biofilm Dry Weight versus Tube Section Number for Test Line D
0.000
0.200
0.400
0.600
0.800
1.000
1.200
1.400
0 5 10 15 20 25
Tube Section #
Dry
Wei
ght (
mg/
cm2)
10/21/2002 20 Final Report SERDP/SEED
Figure 5: Biofilm Dry Weight versus Tube Section Number for Test Line E


![Fouling vs. Availability · PDF fileFouling vs. Availability CheMin ... Sanicro 28/ 63, Sandvik 8RE. Fouling vs. Availability CheMin ... Fouling rate...Heat Transfer [W/m2]](https://static.documents.pub/doc/80x56/5aadcccc7f8b9a8f498eba95/fouling-vs-availability-vs-availability-chemin-sanicro-28-63-sandvik-8re.jpg)


