12
Analytical Paper Pulses in Canada by Ellen Bekkering Agriculture Division Catalogue no. 96‑325‑X — No. 007 ISSN 0‑662‑35659‑4 Canadian Agriculture at a Glance
Analyt ical Paper
Pulses in Canada
by Ellen BekkeringAgriculture Division
Catalogue no. 96‑325‑X — No. 007ISSN 0‑662‑35659‑4
Canadian Agriculture at a Glance

How to obtain more informationFor information about this product or the wide range of services and data available from Statistics Canada, visit our website, www.statcan.gc.ca.
You can also contact us by
email at [email protected],
telephone, from Monday to Friday, 8:30 a.m. to 4:30 p.m., at the following toll‑free numbers:
• Statistical Information Service 1‑800‑263‑1136• National telecommunications device for the hearing impaired 1‑800‑363‑7629• Fax line 1‑877‑287‑4369
Depository Services Program• Inquiries line 1‑800‑635‑7943• Fax line 1‑800‑565‑7757
To access this productThis product, Catalogue no. 96‑325‑X, is available free in electronic format. To obtain a single issue, visit our website, www.statcan.gc.ca, and browse by “Key resource” > “Publications.”
Standards of service to the publicStatistics Canada is committed to serving its clients in a prompt, reliable and courteous manner. To this end, Statistics Canada has developed standards of service that its employees observe. To obtain a copy of these service standards, please contact Statistics Canada toll‑free at 1‑800‑263‑1136. The service standards are also published on www.statcan.gc.ca under “About us” > “The agency” > “Providing services to Canadians.”
Published by authority of the Minister responsible for Statistics Canada
© Minister of Industry, 2014
All rights reserved. Use of this publication is governed by the Statistics Canada Open Licence Agreement (http://www.statcan.gc.ca/reference/licence‑eng.htm).
Cette publication est aussi disponible en français.
Standard symbolsThe following symbols are used in Statistics Canada publications:
. not available for any reference period
.. notavailableforaspecificreferenceperiod
... not applicable0 true zero or a value rounded to zero0s value rounded to 0 (zero) where there is a meaningful
distinction between true zero and the value that was rounded
p preliminaryr revisedx suppressedtomeettheconfidentialityrequirementsofthe
Statistics ActE use with cautionF too unreliable to be published* significantlydifferentfromreferencecategory(p<0.05)
Note of appreciationCanada owes the success of its statistical system to a long‑standing partnership between Statistics Canada, the citizens of Canada, its businesses, governments and other institutions. Accurate and timely statistical information could not be produced without their continued co‑operation and goodwill.

Statistics Canada — Catalogue no. 96-325-X
Canadian Agriculture at a Glance
1
Pulses in CanadaBy Ellen Bekkering
A pulse is an edible seed harvested from the pod of a variety of annual leguminous plants. Pulses grown in Canada include, mainly, dry beans, dry peas, lentils and chickpeas. According to the 2011 Census of Agriculture, pulses represented approximately 6% of field crop area in Canada in 2011, while wheat and canola accounted for almost 50%. Pulse area and production in Canada has increased since the 1980s, making the country one of the leading producers and exporters of pulses worldwide.
Pulse seeded areas were at 2.2 million hectares in 2011. This was a jump of more than 11 times the
area planted in 1981 (Chart 1). As well, the number of farms reporting pulses almost doubled from 6,392 in 1981 to 12,110 in 2011.
0
500,000
1,000,000
1,500,000
2,000,000
2,500,000
3,000,000
1981 1986 1991 1996 2001 2006 2011
hectares
Year
Chart 1Pulse seeded areas by variety, Canada, 1981 to 2011
Dry peas Chickpeas Lentils Dry beans
Sources: Statistics Canada, Census of Agriculture, 1981 to 2011.
The development and expansion of the pulse industry was closely tied to its profitability, research into new varieties that resist lodging and disease or have a shorter growing season, and the growth of processing facilities. The majority of pulse variety registrations in Canada have been developed in public breeding programs, funded through private-public-producer check offs in exchange for royalty-
Photo: A variety of pulses

Statistics Canada — Catalogue no. 96-325-X
Canadian Agriculture at a Glance
2
free access to the new varieties developed. Agriculture and Agri-Food Canada and both the University of Saskatchewan (the Crop Development Centre) and the University of Guelph developed the majority of new pulse varieties.
Where are pulses grown in Canada?
In 2011, Saskatchewan was home to the largest pulse area in the country with 1.7 million hectares. This represented 79.3% of the total pulse area in Canada. Saskatchewan accounted for 68.3% of dry pea area, 86.9% of chickpea area, and 96.0% of lentil area. The Prairie provinces have a particular advantage in growing most pulse varieties due to soil, climate, and the development of innovation networks, such as the Crop Development Centre at the University of Saskatchewan. Other advantages for these provinces are access to western ports for shipping to markets in China, India and Turkey and industry advocates (Table 1).
Ontario reported the largest area of dry beans, accounting for 38.4% of the national area in 2011. Manitoba and Alberta reported the next largest areas with 32.1% and 18.8% of the national area, respectively. Ontario and Manitoba grow both white and coloured beans, while Alberta production focused primarily on coloured beans.
Table 1Pulses: number of farms, area and percentage of total field crop area by province, 2011
Farms AreaShare of total field crop
area in province
number percent hectares percent
RegionCanada 12,110 100 2,157,840.6 100 6.2Maritime provinces 35 0.3 327.4 0.0 0.1Quebec 174 1.4 4,137.9 0.2 0.2Ontario 998 8.2 39,556.8 1.8 1.1Manitoba 491 4.1 49,132.9 2.3 1.1Saskatchewan 7,951 65.7 1,711,497.9 79.3 11.6Alberta 2,363 19.5 348,965.2 16.2 3.6British Columbia 98 0.8 4,222.5 0.2 0.7
Note: No pulse area was reported in Newfoundland and Labrador.Source: Statistics Canada, Census of Agriculture, 2011.
What are the characteristics of pulse farms in Canada?
Pulses are grown mostly by large farms and these farms have increased in size significantly between 1981 and 2011. Farms growing pulses had on average 1,070.3 hectares of total farm area in 2011, four times the 1981 average of 266.5 hectares.
In 2011, the average pulse seeded area was 178.2 hectares per farm, compared with an average of 30.3 hectares in 1981.
The sector has also become more concentrated. Fewer, bigger farms reported a larger proportion of the total pulse area. More than a third of farms growing pulses (36.7%) in 2011 had a total farm size of over 1,000 hectares. These 4,440 farms accounted for over two-thirds of Canada’s pulse acreage (1.5 million hectares or 67.7%).

Statistics Canada — Catalogue no. 96-325-X
Canadian Agriculture at a Glance
3
Smaller farms (those with less than 250 hectares) made up 16.3% of farms reporting pulses, and accounted for 3.2% of the total national pulse area. This is a change from three decades earlier when smaller farms made up 63.0% of farms reporting pulses and accounted for 42.3% of the national pulse area. Larger pulse farms (over 1,000 hectares) at that time represented only 2.8% of farms reporting pulses and accounted for 7.1% of total pulse area (Table 2).
Table 2Pulses: number of farms and average areas by farm size, Canada, 1981 and 2011
Number of farms Percentage of total pulse area Average total farm area Average pulse area
1981 2011 1981 2011 1981 2011 1981 2011
number percent hectares
Farm sizeAll pulse farms 6,392 12,110 100 100 266.5 1,070.3 30.3 178.2Less than 250 hectares 4,029 1,975 42.3 3.2 110.9 120.7 20.3 34.9250 to 499 hectares 1,456 2,149 28.8 7.6 346.3 365.9 38.3 75.9500 to 999 hectares 729 3,546 21.7 21.5 672.1 730.2 57.5 130.91,000 to 1,999 hectares 155 2,981 5.9 31.8 1,290.8 1,384.6 73.5 230.22,000 hectares or greater 23 1,459 1.2 35.9 2,719.5 3,577.4 104.4 531.4
Sources: Statistics Canada, Census of Agriculture, 1981 and 2011.
Farming practices used by pulse growers
There has been a trend toward a decrease in conventional tillage practices on farms with field crops toward conservation tillage or no-till practices. This trend was also seen on farms growing pulses,1 as these operations have a variety of field crops grown. The proportion of farms with pulses reporting no-till (or zero-till) seeding practices increased from 15.2% in 19912 to 72.9% in 2011. Over this 20-year period, there was a shift from conventional tillage practices (where most crop residues are incorporated into the soil) to no-till seeding (with direct seeding into undisturbed stubble or sod). In 1991, 78.0% of pulses growers reported conventional tillage. Twenty years later, only 20.5% reported using this practice.
1. Due to data limitation, it is not possible to link practices to specific field crops especially when growers have multiple crops. The assumption is made that if a practice was reported, it is used for all field crops (pulses, cereals or oilseeds).
2. 1991 Census of Agriculture was first census with more detailed questions on tillage practices.
Statistics Canada — Catalogue no. 96-325-X
Canadian Agriculture at a Glance
4
0
10
20
30
40
50
60
70
80
90
100
No-till seeding Conservation tillage Conventional tillage Crop rotation
percentage of pulse farms
Management practice
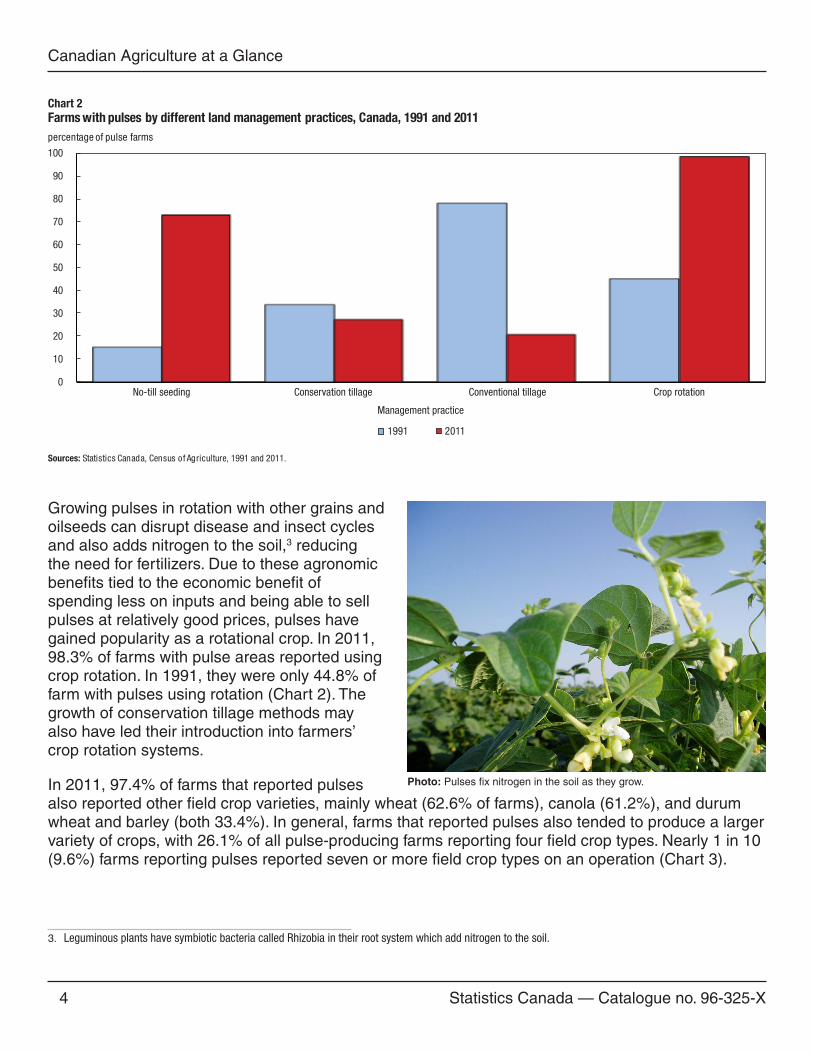
Chart 2Farms with pulses by different land management practices, Canada, 1991 and 2011
Sources: Statistics Canada, Census of Agriculture, 1991 and 2011.
20111991
Growing pulses in rotation with other grains and oilseeds can disrupt disease and insect cycles and also adds nitrogen to the soil,3 reducing the need for fertilizers. Due to these agronomic benefits tied to the economic benefit of spending less on inputs and being able to sell pulses at relatively good prices, pulses have gained popularity as a rotational crop. In 2011, 98.3% of farms with pulse areas reported using crop rotation. In 1991, they were only 44.8% of farm with pulses using rotation (Chart 2). The growth of conservation tillage methods may also have led their introduction into farmers’ crop rotation systems.
In 2011, 97.4% of farms that reported pulses also reported other field crop varieties, mainly wheat (62.6% of farms), canola (61.2%), and durum wheat and barley (both 33.4%). In general, farms that reported pulses also tended to produce a larger variety of crops, with 26.1% of all pulse-producing farms reporting four field crop types. Nearly 1 in 10 (9.6%) farms reporting pulses reported seven or more field crop types on an operation (Chart 3).
3. Leguminous plants have symbiotic bacteria called Rhizobia in their root system which add nitrogen to the soil.
Photo: Pulses fix nitrogen in the soil as they grow.

Statistics Canada — Catalogue no. 96-325-X
Canadian Agriculture at a Glance
5
2.6
8.1
20.3
26.1
21.0
12.29.6
38.2
24.5
16.5
10.5
6.1
2.81.4
0
5
10
15
20
25
30
35
40
45
Single field crop Two field crops Three field crops Four field crops Five field crops Six field crops Seven or more field crops
percent of farms
Number of crop varieties
Chart 3Number of field crop varieties, Canada, 2011
Note: All farms with field crops also include farms with pulses.Source: Statistics Canada, Census of Agriculture, 2011.
All farms with field cropsFarms with pulses
Chart 4 shows that almost 9 out of 10 farms with pulses reported using herbicides or commercial fertilizers in 2011.4 In contrast, more than half of farms with field crops reported using these inputs. The use of insecticides and fungicides was also more prevalent with farms growing pulses.
Farms growing other intensively managed field crops, such as canola, also had similar proportions of input use (91.7% of farms growing canola reported using herbicides).
4. It excludes farms that only reported “alfalfa” and “all tame hay and fodder crop for hay or silage.”

Statistics Canada — Catalogue no. 96-325-X
Canadian Agriculture at a Glance
6
0
10
20
30
40
50
60
70
80
90
100
Herbicides Insecticides Fungicides Commercial fertilizers Lime Irrigation
percent of farms
Land inputs
Chart 4Input uses for farms with pulses and field crops, Canada, 2011
Note: All farms with field crops also include farms with pulses.Source: Statistics Canada, Census of Agriculture, 2011.
Farms with pulses All farms with field crops All farms
The economics of pulses
Farm cash receipts for pulses increased from $56.1 million in 1980 to $1.5 billion in 2010, as pulses represented 6.5% of total Canadian crop receipts (Table 3). Farm cash receipts for lentils and chickpeas were $723.5 million and $53.4 million, respectively, in 2010. Dry beans farm cash receipts were $40.6 million in 1981 and $150.4 million in 2010, while dry pea farm cash receipts were $15.5 million in 1981 and $582.2 million in 2011.
Table 3Farm cash receipts for pulses by variety, annual (in 2010 constant dollars), Canada, 1980 and 2010
1980 2010
$ thousands
Total farm cash receipts 21,964,592 44,325,063Total crops receipts 8,720,122 22,301,906Pulses 56,106 1,509,507Lentils .. 723,516Dry beans 40,568 150,392Dry peas 15,539 582,180Chick peas .. 53,419.. not available for a specific reference periodSource: Statistics Canada, CANSIM, table 002-0001 adjusted with Farm Product Price Index 002-0069.
In 2010, pulse farm sales from Saskatchewan represented 77.8% of the national farm cash receipts for pulses. Alberta was second with 12.7% of the national share. Pulse sales accounted for 12.9% of Saskatchewan total farm cash receipts.

Statistics Canada — Catalogue no. 96-325-X
Canadian Agriculture at a Glance
7
According to the 2011 Census of Agriculture, the largest proportion of farms reporting pulses (25.5%) earned $250,000 to $499,999 in gross farm receipts. There were 1,715 farms reporting one million dollars or more of gross farm receipts. These million-dollar pulse farms represented 14.2% of farms reporting pulses and earned 53.2% of the total gross farm receipts for farms reporting pulses. Three decades earlier, these million-dollar farms made up less than 1% of all farms growing pulses. Smaller farms earning less than $100,000 dominated in those days, accounting for 54.7% of all farms reporting pulses (Chart 5).
54.7
32.5
9.6
2.4 0.8
17.8
22.225.5
20.4
14.2
0
10
20
30
40
50
60
Under $100,000 $100,000-$249,999 $250,000-$499,999 $500,000-$999,999 $1,000,000 and more
percent of farms with pulses
Farm size
Chart 5Farms growing pulses by farm size, Canada, 1980 and 2010
Note: Farm size categories established with 2010 constant dollars.Sources: Statistics Canada, Census of Agriculture, 1981 and 2011.
20101980
How does Canada fit into the global pulse production picture?
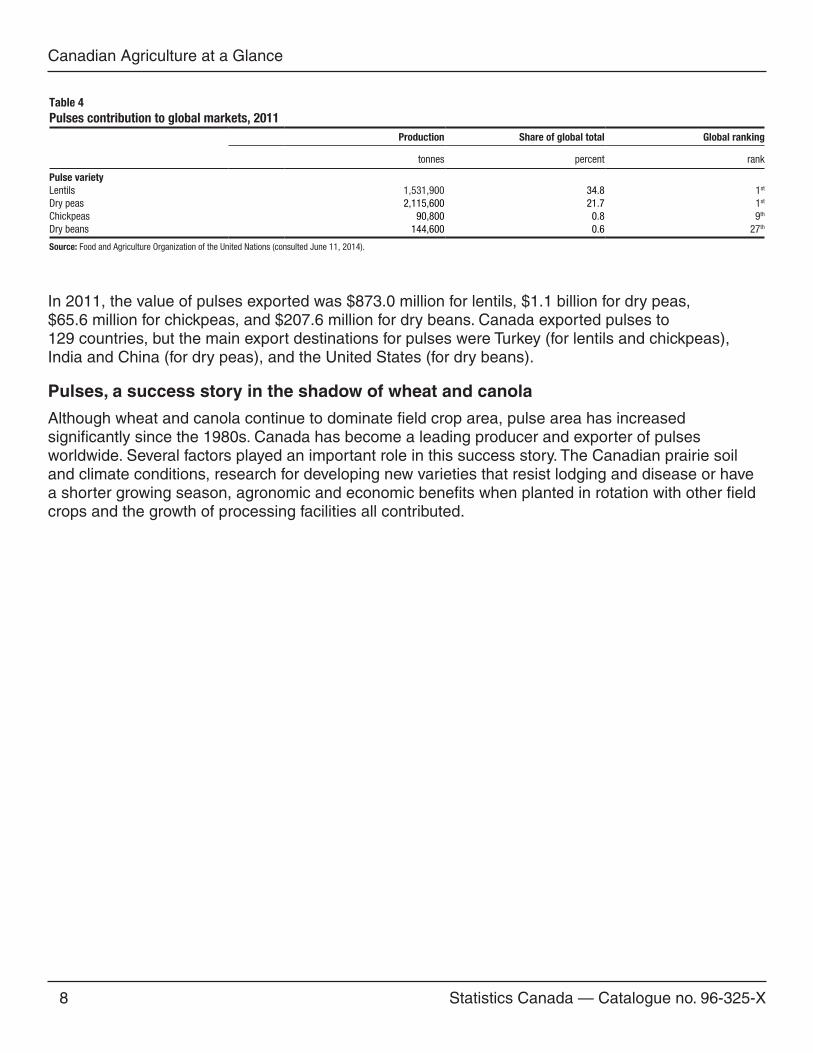
A large part of pulses produced in Canada are intended for exports. Exports of dry peas, lentils and chickpeas accounted for almost 40% of the annual production (five-year average 2007-2011). Canada was the worldwide leader in production of lentils and dry peas in 2011. Canada produced over a third of the world’s lentils in 2011 (1.5 million tonnes). Canada had the largest amount of dry pea production in tonnes in 2011, producing 2.1 million tonnes of dry peas, or 21.7% of the total global production (Table 4).
Statistics Canada — Catalogue no. 96-325-X
Canadian Agriculture at a Glance
8
Table 4Pulses contribution to global markets, 2011
Production Share of global total Global ranking
tonnes percent rank
Pulse varietyLentils 1,531,900 34.8 1st
Dry peas 2,115,600 21.7 1st
Chickpeas 90,800 0.8 9th
Dry beans 144,600 0.6 27th
Source: Food and Agriculture Organization of the United Nations (consulted June 11, 2014).
In 2011, the value of pulses exported was $873.0 million for lentils, $1.1 billion for dry peas, $65.6 million for chickpeas, and $207.6 million for dry beans. Canada exported pulses to 129 countries, but the main export destinations for pulses were Turkey (for lentils and chickpeas), India and China (for dry peas), and the United States (for dry beans).
Pulses, a success story in the shadow of wheat and canola
Although wheat and canola continue to dominate field crop area, pulse area has increased significantly since the 1980s. Canada has become a leading producer and exporter of pulses worldwide. Several factors played an important role in this success story. The Canadian prairie soil and climate conditions, research for developing new varieties that resist lodging and disease or have a shorter growing season, agronomic and economic benefits when planted in rotation with other field crops and the growth of processing facilities all contributed.

Statistics Canada — Catalogue no. 96-325-X
Canadian Agriculture at a Glance
9
Pulses have a variety of nutritional and health benefits beyond their agronomic benefits when planted in rotation with other field crops. They are increasingly popular as a protein substitute for North American consumers. Pulses have double the amount of protein compared to other cereal crops and rice, plus combining pulses with grains provides a better quality protein.5 Pulses also have a low glycemic index to manage blood sugar levels and contain both soluble and insoluble fibres.
What are pulses and how are they used?
Photo: Chickpeas in the pod
A pulse is an edible seed harvested from the pod of a variety of annual leguminous plants. Legumes refer more broadly to the Fabaceae family of plants. Pulses grown in Canada include, mainly, dry beans, dry peas, lentils and chickpeas. They are cool-season crops.
There are over 100 varieties of dry peas produced in Canada. The two main types are yellow cotyledon or green cotyledon.
Lentils can be classified by seed size or cotyledon colour (yellow, red or green). They are marketed by their red or green seed coat colour. Green lentils are often
marketed whole, while red lentils are marketed whole, or are dehulled and split. Most of the global trade is in red lentils and it is the most commonly consumed lentil worldwide.
The two main chickpea types are kabuli (garbanzo) or desi, which is often dehulled and split or ground into flour.
Dry beans are classified into either white or coloured bean production. Dry beans are rotated often with cereal crops, and sugar beets in Alberta. Bean varieties include kidney beans, navy beans, Great Northern beans, pinto beans, and black beans.
The main domestic use of pulses is for livestock feed—particularly low-quality production— with dry peas for hogs being the most common. Pulses can be expensive compared to other feed sources.
A small amount is used by Canadian consumers and has increased over time, but is still relatively low compared to countries where pulses are a dietary staple.
5. Pulses provide the amino acid lysine and other grains provide the amino acids methionine and cysteine which are not found in pulses in a high amount.

Statistics Canada — Catalogue no. 96-325-X
Canadian Agriculture at a Glance
10
Primary processing of pulses includes cleaning and quality sorting. Secondary processing is focused on preparing seed for consumer use. This involves sorting by seed size, dehulling and/or splitting, milling, canning, dry packaging, and creation of flours and processed food products (soups, snack food, etc.)
Another processing type, called fractionation, separates pulses into concentrates and isolates such as proteins, starches and fibres for ingredient use in food processing. Isolates such as pea starch are used as thickening agents in soups and sauces, and pea flour is used in the processed meat industry. Starches extracted from pulses are also used in industrial applications in the paper and board industries.
For export, pulses are most often used for direct consumption or for food processing, such as dry pea starch for noodle production in China.

![Practicum 5, Spring 2015 Selective pulses: long pw90s ...€¦ · Selective pulses: long pw90s, presaturation and shaped pulses ! ... experiment"![4] ... Figure'18! [1]) ...](https://static.documents.pub/doc/80x56/5ac559387f8b9aa0518df036/practicum-5-spring-2015-selective-pulses-long-pw90s-selective-pulses-long.jpg)


