Pumping Plant Pumping Plant Conversions- Conversions- Energy and Energy and Air Implications for Air Implications for Improving Pumping Plants Improving Pumping Plants Dennis K. Carman, P.E. Dennis K. Carman, P.E. National Water Management National Water Management Center Center Newport, Rhode Island Newport, Rhode Island April 20-21, 2005 April 20-21, 2005
Transcript
Pumping Plant Conversions- Pumping Plant Conversions- Energy and Air Implications for Energy and Air Implications for
Improving Pumping PlantsImproving Pumping Plants
Dennis K. Carman, P.E.Dennis K. Carman, P.E.National Water Management CenterNational Water Management Center
Identify primary reasons to make pumping Identify primary reasons to make pumping plant conversions and how to evaluateplant conversions and how to evaluate– Focus on energy usesFocus on energy uses
How to evaluateHow to evaluateHow to determine costHow to determine costHow to compare systemsHow to compare systems
– Discuss Air Quality ImplicationsDiscuss Air Quality ImplicationsPresent a potential approach for expanding into an Present a potential approach for expanding into an evaluation processevaluation process
Pumping PlantsPumping Plants
Primary usesPrimary uses– Pumping water (irrigation)Pumping water (irrigation)– Manure TransferManure Transfer
For today’s efforts we will focus only on For today’s efforts we will focus only on the irrigation activitiesthe irrigation activities
Why would a farmer consider a Why would a farmer consider a pumping plant conversion?pumping plant conversion?
Energy savingsEnergy savings– Energy costs are increasingEnergy costs are increasing– Pumping water is a major energy user on some farmsPumping water is a major energy user on some farms
Air quality improvementsAir quality improvements– Farmer viewFarmer view– In or out of a non-attainment area?In or out of a non-attainment area?– EQIP or state cost share incentive availableEQIP or state cost share incentive available– Earn a CSP enhancement paymentEarn a CSP enhancement payment
Pumping Plants and EnergyPumping Plants and EnergyWhat makes a difference?What makes a difference?
The power unitThe power unit– Internal combustion engineInternal combustion engine
an inefficient engine wastes fuelan inefficient engine wastes fuel– get a tune-upget a tune-up
– ElectricityElectricityless likely for improvementless likely for improvement
The pumpThe pump– A primary potential for improvementA primary potential for improvement– Pump selection needs to match the conditionsPump selection needs to match the conditions
The pumping depthThe pumping depth– What is the lift? What is the lift? – Greater the depth (lift) the more energy requiredGreater the depth (lift) the more energy required
The application method and amount pumpedThe application method and amount pumped– Application method influences the pumping discharge pressureApplication method influences the pumping discharge pressure– Application method could influence the amount pumpedApplication method could influence the amount pumped– Amount pumped influences the total energy costsAmount pumped influences the total energy costs
Causes for excessive fuel use include:Causes for excessive fuel use include:
1)1) Poor pump selectionPoor pump selection• Pumps are designed for a particular discharge, head and speed. Operation Pumps are designed for a particular discharge, head and speed. Operation
outside of those parameters result in increased energy useoutside of those parameters result in increased energy use2)2) Pumps out of adjustment or worn-out pumpsPumps out of adjustment or worn-out pumps
• Pumps need adjustment from time to time to compensate for wearPumps need adjustment from time to time to compensate for wear3)3) Improperly sized engines or motorsImproperly sized engines or motors
• Power plants must be matched to the pump for efficient operationsPower plants must be matched to the pump for efficient operations4)4) Engines in need of maintenance and/or repairEngines in need of maintenance and/or repair
• For internal combustion engines a tune up can be criticalFor internal combustion engines a tune up can be critical5)5) Improperly matched gear headsImproperly matched gear heads
• Gear head pump drives must fit the load and speed requirements of the pump Gear head pump drives must fit the load and speed requirements of the pump and engineand engine
Performance evaluations indicate, on average, irrigation pumping plants in Performance evaluations indicate, on average, irrigation pumping plants in Kansas use about 40 percent more fuel than necessary.Kansas use about 40 percent more fuel than necessary.
How do we evaluate pumping plants?How do we evaluate pumping plants?
Perform a pumping plant performance evaluationPerform a pumping plant performance evaluation– The most accurateThe most accurate– Relatively time consumingRelatively time consuming– Farmers reluctant to spend money to find out if Farmers reluctant to spend money to find out if
something is wrongsomething is wrongIrrigation pumping energy auditIrrigation pumping energy audit– Compare energy costs (bills) to an established Compare energy costs (bills) to an established
standardstandard– Use the results of this evaluation to determine if Use the results of this evaluation to determine if
changes are necessarychanges are necessaryCost verses benefitsCost verses benefits
– Less costly, less time consuming, less accurateLess costly, less time consuming, less accurate
What is needed for the irrigation What is needed for the irrigation pumping energy audit?pumping energy audit?
1)1) Acres IrrigatedAcres Irrigated
2)2) Discharge rateDischarge rate
3)3) Total dynamic headTotal dynamic head
4)4) Total application depthTotal application depth
5)5) Total fuel billTotal fuel bill
6)6) Fuel price per unitFuel price per unit
DefinitionsDefinitionsTotal dynamic head (TDH)Total dynamic head (TDH)– Estimated by adding the total pumping lift and pressure at the pump. Estimated by adding the total pumping lift and pressure at the pump.
Example: 150 feet of lift plus 45 PSI. 45 PSI = 45x2.31 or 104 feet of head. TDH = Example: 150 feet of lift plus 45 PSI. 45 PSI = 45x2.31 or 104 feet of head. TDH = 150 feet + 104 feet = 254 feet TDH150 feet + 104 feet = 254 feet TDH
Water horsepowerWater horsepower– A measure of the power input to the water and can be determined from total A measure of the power input to the water and can be determined from total
dynamic head and flow ratedynamic head and flow rateWater horsepower-hourWater horsepower-hour– A measure of the water horsepower work or energy input for 1 hourA measure of the water horsepower work or energy input for 1 hour
Nebraska Pumping Plant Performance Criteria (NPC)Nebraska Pumping Plant Performance Criteria (NPC)– Criteria developed in the early 1960’s and recognized throughout the United Criteria developed in the early 1960’s and recognized throughout the United
States as the standard for comparison.States as the standard for comparison.BTUBTU– A measure of energy. British Thermal Unit. Energy sources have different A measure of energy. British Thermal Unit. Energy sources have different
energy content. This unit allows us to compare energy sources, energy costs, energy content. This unit allows us to compare energy sources, energy costs, and energy options.and energy options.
Step 1Step 1Determine the Water HorsepowerDetermine the Water Horsepower
Water horsepower (WHP) is the amount of Water horsepower (WHP) is the amount of work done on the waterwork done on the water– WHP = TDH x GPM WHP = TDH x GPM ÷ ÷ 39603960
GPM = discharge rate in gallons per minuteGPM = discharge rate in gallons per minute– Example: 600 GPMExample: 600 GPM
TDH = total dynamic head (in feet)TDH = total dynamic head (in feet)– Example: 150 feet lift + 104 feet pump pressure = 254 Example: 150 feet lift + 104 feet pump pressure = 254
feet TDHfeet TDH
WHP = 254 x 600 WHP = 254 x 600 ÷ 3960 = 38.5÷ 3960 = 38.5
Step 2Step 2
Calculate hours of pumpingCalculate hours of pumping– HR = D x acres HR = D x acres ÷ (GPM ÷ 450)÷ (GPM ÷ 450)
HR = Hours of pumpingHR = Hours of pumping
D = Depth of applied irrigation water (inches)D = Depth of applied irrigation water (inches)
Acres = Acres irrigatedAcres = Acres irrigated
GPM = discharge rate in gallons per minuteGPM = discharge rate in gallons per minute
450 = a constant for conversion 450 = a constant for conversion (1 acre-inch/hour = 450 gallons/minute)(1 acre-inch/hour = 450 gallons/minute)
– Example: for 1 inch of application and 100 acresExample: for 1 inch of application and 100 acresHR = 1 inch x 100 acres x (600 GPM ÷ 450) = 133.3HR = 1 inch x 100 acres x (600 GPM ÷ 450) = 133.3
Step 3Step 3
Estimate Hourly NPC fuel useEstimate Hourly NPC fuel use– FU = WHP FU = WHP ÷ NPC÷ NPC
FU = Hourly fuel use using the Nebraska criteriaFU = Hourly fuel use using the Nebraska criteria
WHP = Water horsepower from step 1WHP = Water horsepower from step 1
Energy SourceEnergy Source WHP-HRS per Unit of FuelWHP-HRS per Unit of Fuel
DieselDiesel 12.5 per gallon12.5 per gallon
PropanePropane 6.89 per gallon6.89 per gallon
Natural Gas (925 BTU/cf)Natural Gas (925 BTU/cf) 61.7 per MCF61.7 per MCF
ElectricityElectricity 0.885 per KWH (kilowatt-hour)0.885 per KWH (kilowatt-hour)
For our example: WHP = 38.5 from step 1FU = 38.5 ÷ (12.5) or (6.89) or (61.7) or (0.885)
Step 4Step 4
Estimate Seasonal NPC fuel costEstimate Seasonal NPC fuel cost– SFC = FU x HR x CostSFC = FU x HR x Cost
SFC = Seasonal fuel cost if the pump was SFC = Seasonal fuel cost if the pump was operating at NPC standardoperating at NPC standardHR = Hours of operation from Step 2HR = Hours of operation from Step 2Cost = $ per fuel unitCost = $ per fuel unitContinuing with our example and selecting diesel Continuing with our example and selecting diesel as our energy sourceas our energy source
– SFC = (38.5 SFC = (38.5 ÷ ÷ 12.5) x 133.3 x $2.00 per gallon diesel = 12.5) x 133.3 x $2.00 per gallon diesel = $821.00 to pump 1 inch of water for the 100 acres$821.00 to pump 1 inch of water for the 100 acres
Step 5Step 5
Determine excess fuel costDetermine excess fuel cost– EFC = AFC – SFCEFC = AFC – SFC– EFC = Excess Fuel Cost in dollarsEFC = Excess Fuel Cost in dollars– AFC = Actual Fuel Cost in DollarsAFC = Actual Fuel Cost in Dollars– SFC = Estimated Seasonal Fuel Cost using NPC in SFC = Estimated Seasonal Fuel Cost using NPC in
dollarsdollars– Continuing with our example:Continuing with our example:
Let’s assume we pumped 10 inches of water during the yearLet’s assume we pumped 10 inches of water during the yearOur fuel cost should have been about $8200 for the yearOur fuel cost should have been about $8200 for the yearIf we were significantly more than this value we should If we were significantly more than this value we should consider a more extensive evaluationconsider a more extensive evaluation
How do I compare energy sources?How do I compare energy sources?
Example:Focusing on column 2 from the table aboveA value of 1 is listed for electricityA value of 14.12 is listed for Diesel
This means a gallon of Diesel will produce 14.12 times as many water horsepower-hour outputs per gallon as 1kWh of electricity
Which source is best?Which source is best?It depends on a lot of considerations with energy cost It depends on a lot of considerations with energy cost being onebeing one
Let’s continue with our example of 100 acres applying 10 Let’s continue with our example of 100 acres applying 10 inches of waterinches of water
Continuing with our example and selecting diesel as our energy Continuing with our example and selecting diesel as our energy sourcesource
SFC = (38.5 ÷ 12.5) x 133.3 x $2.00 per gallon diesel = SFC = (38.5 ÷ 12.5) x 133.3 x $2.00 per gallon diesel = $8210 to pump 10 inches of water for the 100 acres$8210 to pump 10 inches of water for the 100 acres
Equivalent energy sources would be:Equivalent energy sources would be:Electricity: $2.00 x .071 = Electricity: $2.00 x .071 =
$0.14 per kWh$0.14 per kWhPropane: $2.00 x 0.551 = Propane: $2.00 x 0.551 =
$1.10 per gallon$1.10 per gallonNatural Gas: $2.00 x 4.94 = Natural Gas: $2.00 x 4.94 =
$9.88 per mcf$9.88 per mcf
PA natural gas $11.53 per thousandPA natural gas $11.53 per thousandNJ propane $0.985 per gallonNJ propane $0.985 per gallonMD electricity $0.10 per kWhMD electricity $0.10 per kWh
Further evaluationsFurther evaluations
An economic assessment can be made to An economic assessment can be made to determine the probability for paybackdetermine the probability for payback
Perform a pumping plant performance Perform a pumping plant performance evaluationevaluation– Determine the most logical problem and Determine the most logical problem and
recommended fixesrecommended fixes
What are the Air Quality What are the Air Quality Implications?Implications?
How can we improve air quality?How can we improve air quality?– Electric motorsElectric motors
Use less energy (pump less water or reduce head)Use less energy (pump less water or reduce head)– Fix or replace pumpsFix or replace pumps
– Select irrigation systems with lower operating pressuresSelect irrigation systems with lower operating pressures
– Alternative source of water at less depth (surface water)Alternative source of water at less depth (surface water)
– Reduce amount of water used by improving efficienciesReduce amount of water used by improving efficiencies
How do we evaluate this?How do we evaluate this?Electric MotorsElectric Motors
Electric motors can be evaluated by using the Electric motors can be evaluated by using the previous energy audit processprevious energy audit process
Specific attention paid to factors influencingSpecific attention paid to factors influencing– Lift (reduced lift, less energy)Lift (reduced lift, less energy)– Operating pressure (lower pressure, less energy)Operating pressure (lower pressure, less energy)– Depth of water applied (improved efficiencies result in less water Depth of water applied (improved efficiencies result in less water
applied)applied)
In any situation, the pump and motor need to be In any situation, the pump and motor need to be selected for the conditionsselected for the conditions
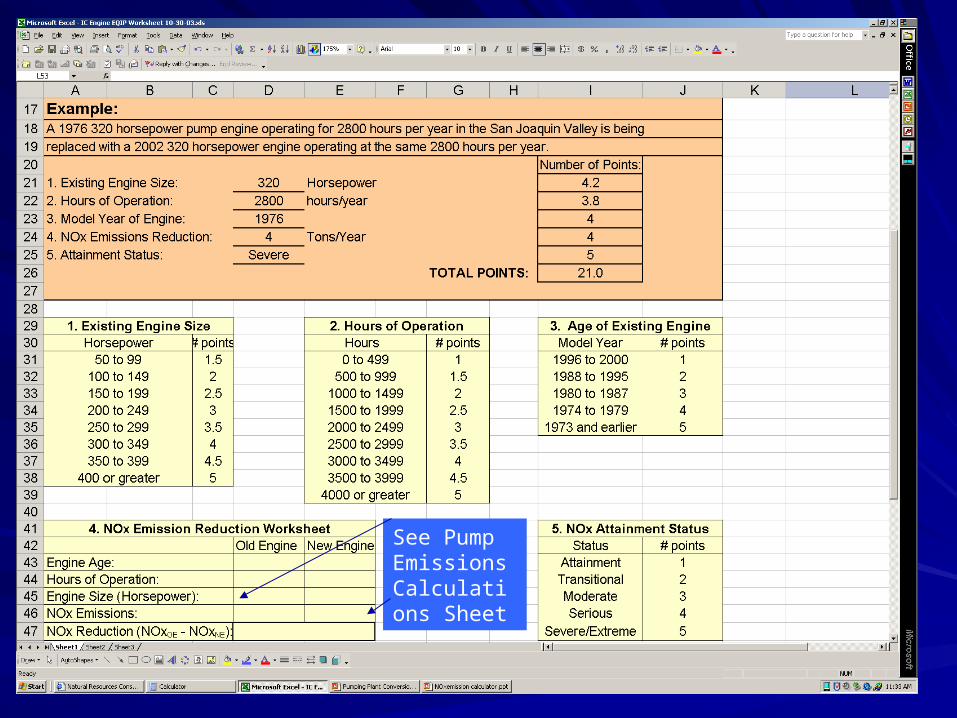
How do we evaluate this?How do we evaluate this?Internal Combustion EnginesInternal Combustion Engines
California evaluation example - DieselCalifornia evaluation example - Diesel– ConsiderationsConsiderations
Work is being done on the energy front for Work is being done on the energy front for CSPCSP– Energy auditsEnergy audits– Self AssessmentSelf Assessment– On-line processOn-line process
Air QualityAir Quality– Technology is moving forwardTechnology is moving forward– New emphasisNew emphasis
The U.S. Department of Agriculture prohibits discrimination in its programs on the basis of race, color, national origin, sex, religion, age, disability, political beliefs and