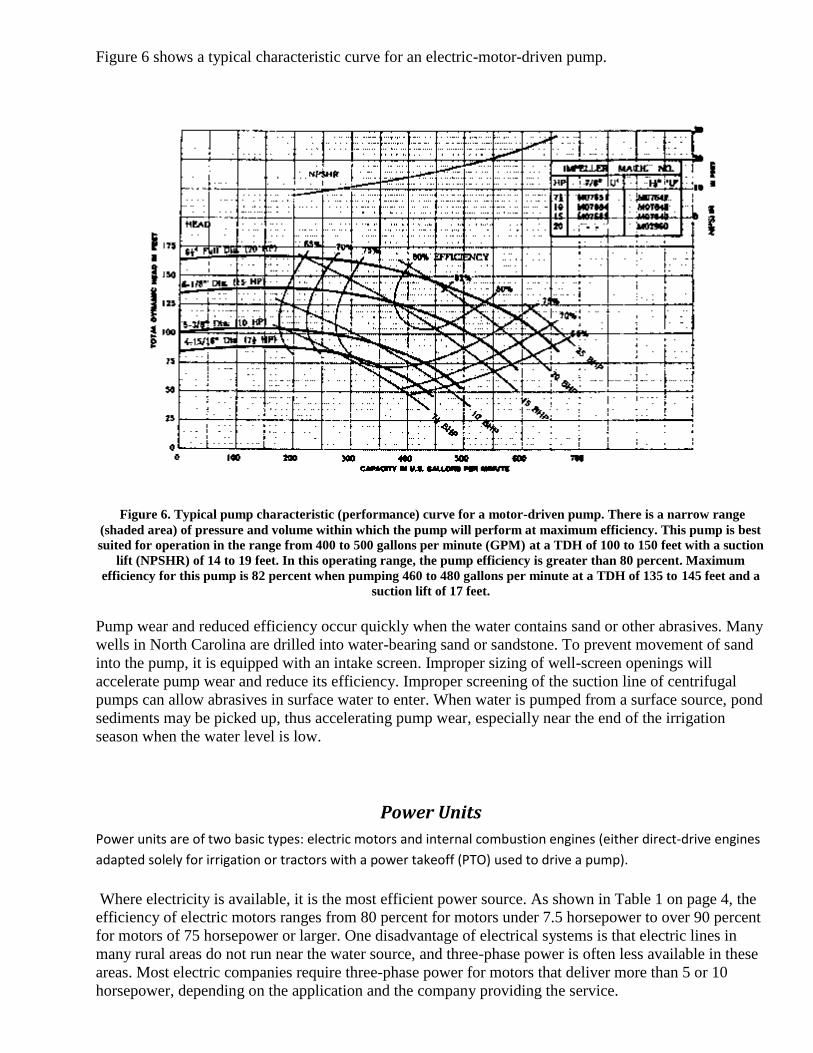
Pumping Plant Performance Evaluation Prepared by: Robert Evans, Extension Agricultural Engineering Specialist R. E. Sneed, Extension Agricultural Engineering Specialist J. H. Hunt, Extension Agricultural Engineering Specialist Published by: North Carolina Cooperative Extension Service Publication Number: AG 452-6 Last Electronic Revision: June 1996 (KNS) Introduction Irrigation requires large quantities of energy. Most of the energy is consumed by the pumping plant. High pumping costs usually result from poor maintenance, excessive wear, or mismatched components. Annual energy costs run about $25per acre in North Carolina where application rates average 8 inches per acre per year. Energy cost may be several times higher when water is applied with poorly maintained and operated systems. This publication discusses the causes of poor irrigation system performance. Some of these causes can be identified and corrected by the irrigator. Others require specialized evaluation equipment, and the corrections should therefore be performed by specially trained technicians. The energy required to pump a given quantity of water is affected by: 1. pumping lift-the vertical distance from the water source to the discharge point (elevation) in the field; 2. operating pressure-pressure on the discharge side of the pump necessary to provide the proper pressure to sprinkler nozzles in the field; 3. pumping plant efficiency. Energy requirements decrease as pumping lift and operating pressure decrease and pumping plant efficiency increases. To maximize pumping plant efficiency, the components should be matched to the site-specific conditions of pumping lift, operating pressure, and flow rate.
Transcript
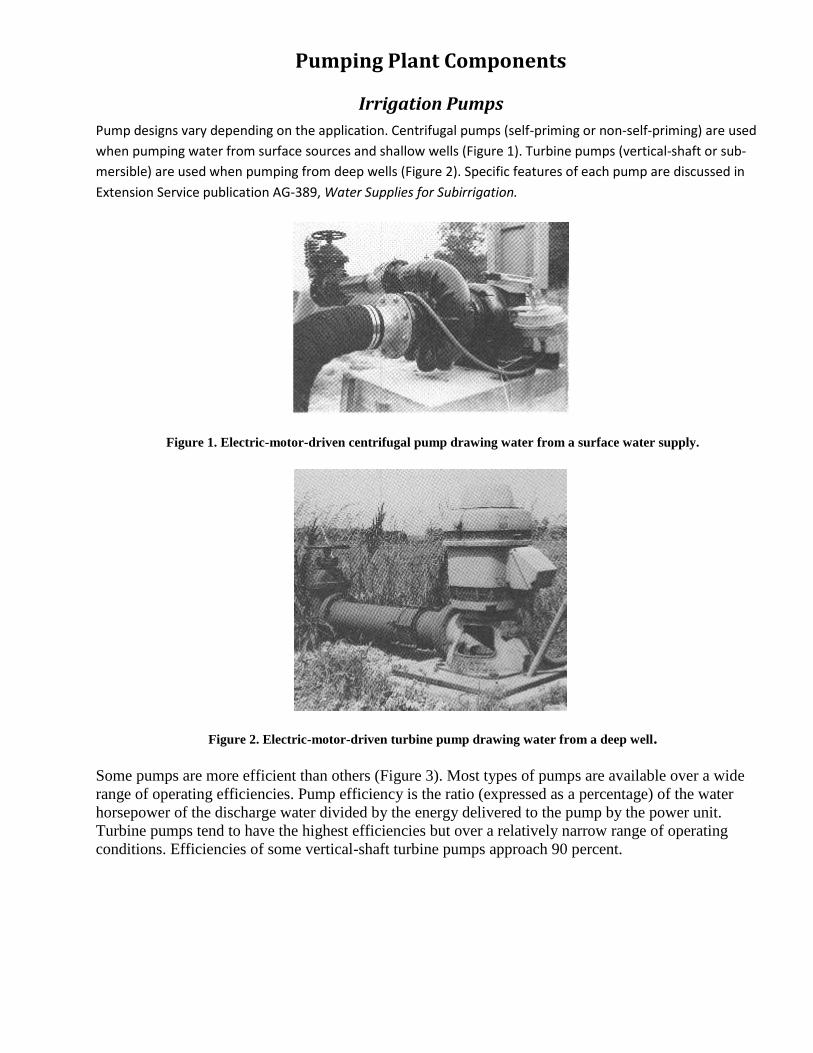
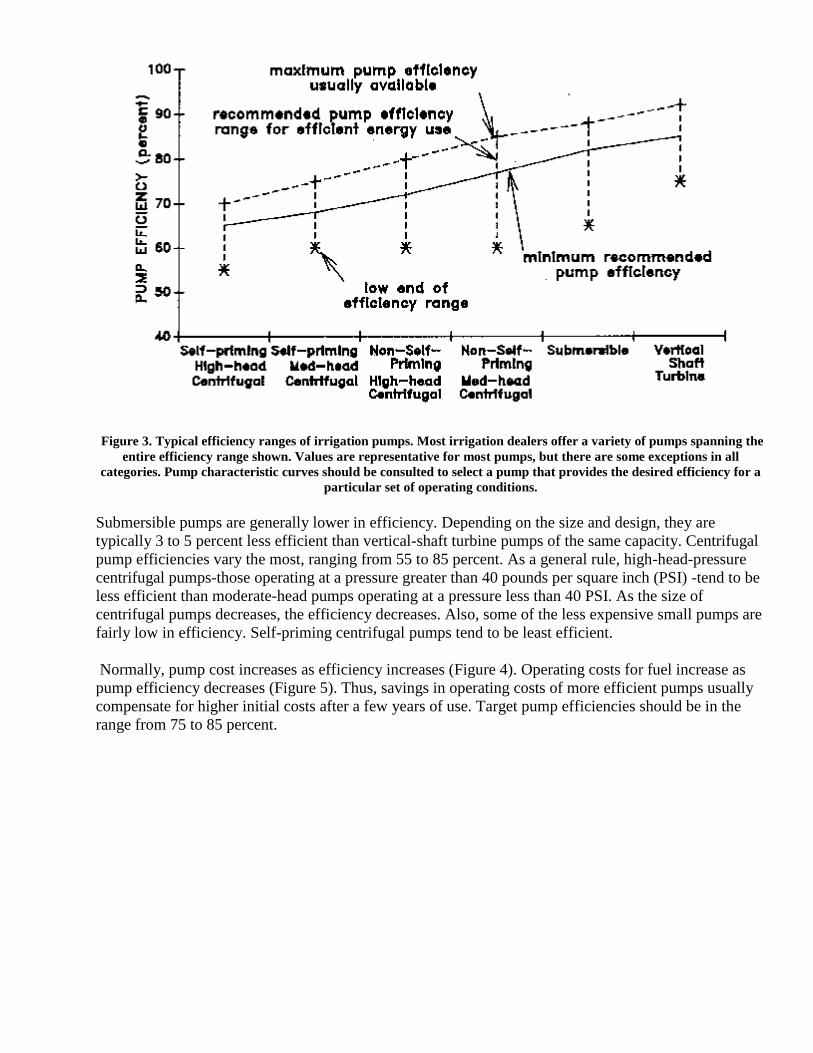
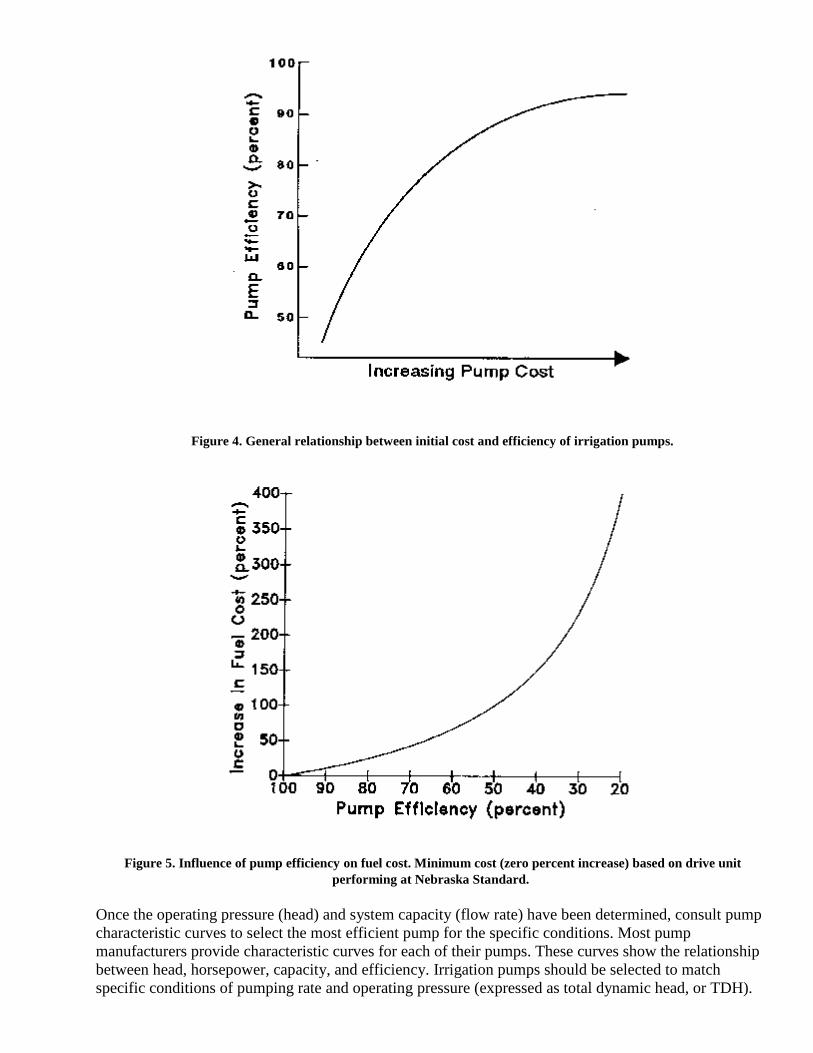
Pumping Plant Performance Evaluation
Prepared by:
Robert Evans, Extension Agricultural Engineering Specialist
R. E. Sneed, Extension Agricultural Engineering Specialist
J. H. Hunt, Extension Agricultural Engineering Specialist
Published by: North Carolina Cooperative Extension Service
Publication Number: AG 452-6
Last Electronic Revision: June 1996 (KNS)
Introduction Irrigation requires large quantities of energy. Most of the energy is consumed by the pumping plant. High
pumping costs usually result from poor maintenance, excessive wear, or mismatched components. Annual energy
costs run about $25per acre in North Carolina where application rates average 8 inches per acre per year. Energy
cost may be several times higher when water is applied with poorly maintained and operated systems.
This publication discusses the causes of poor irrigation system performance. Some of these causes can
be identified and corrected by the irrigator. Others require specialized evaluation equipment, and the
corrections should therefore be performed by specially trained technicians.
The energy required to pump a given quantity of water is affected by:
1. pumping lift-the vertical distance from the water source to the discharge point (elevation) in the field; 2. operating pressure-pressure on the discharge side of the pump necessary to provide the proper
pressure to sprinkler nozzles in the field; 3. pumping plant efficiency.
Energy requirements decrease as pumping lift and operating pressure decrease and pumping plant efficiency
increases. To maximize pumping plant efficiency, the components should be matched to the site-specific
conditions of pumping lift, operating pressure, and flow rate.
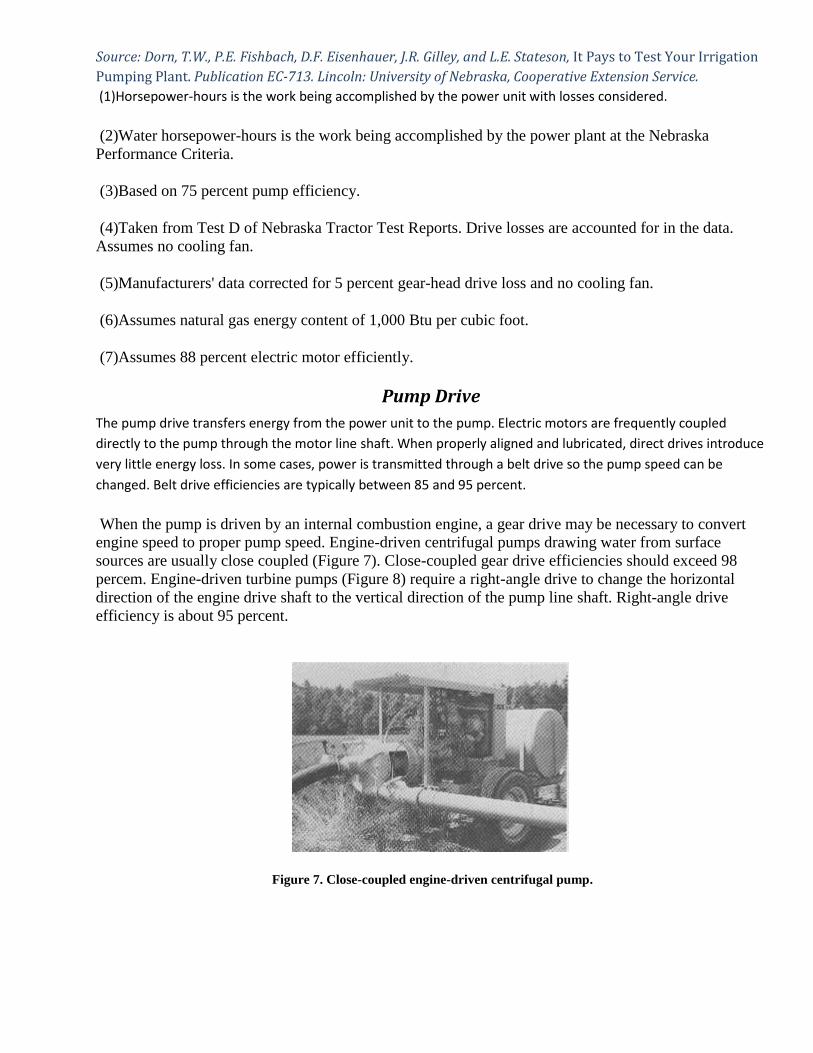
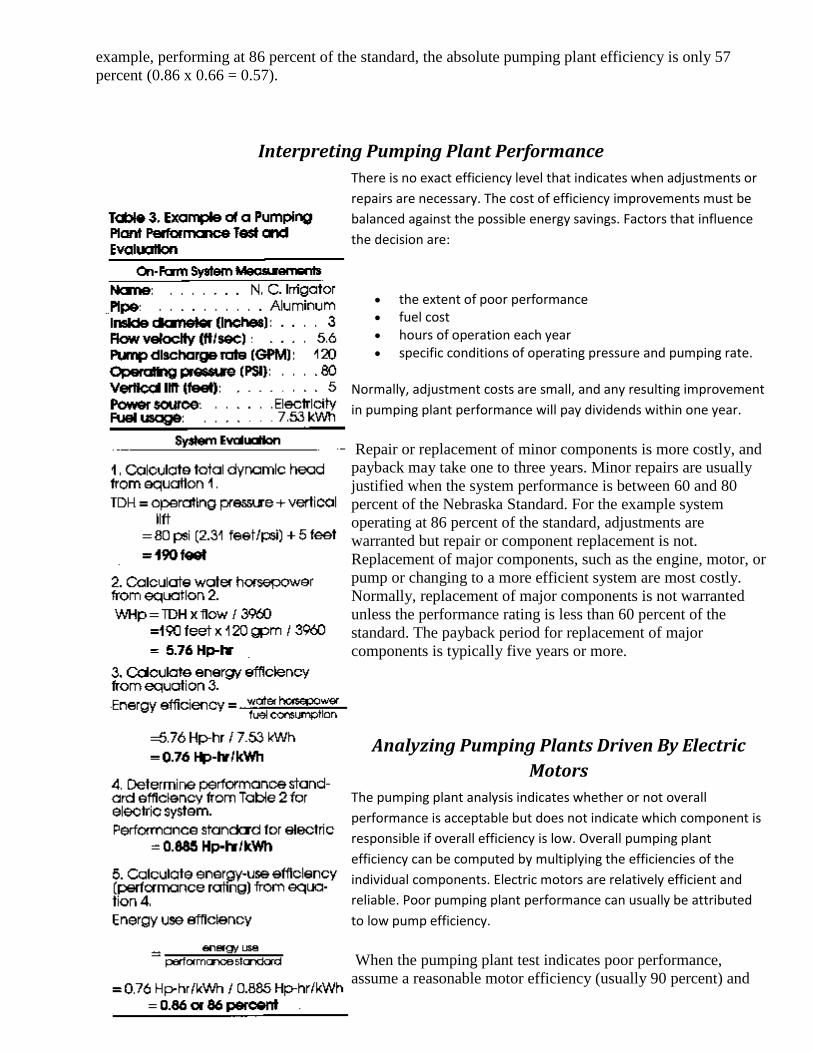
Figure 8. Right-angle drive for engine-driven turbine pump.
Inefficient pumping plants cost more to operate. Low pumping
plant performance usually results from (1) an inefficient pump or
power unit, (2) mismatching of the pump and power unit, or (3) a
combination of these.
Pumping plant efficiency can be tested to provide information on
adjustments or retrofits needed to improve efficiency. To
determine the pumping plant efficiency, measure pumping lift,
discharge pressure, flow rate, and fuel usage. Fuel usage can be
read directly from the electric meter or by measuring the liquid
level in the fuel tank over a specific time period. A pressure gauge
is usually installed on the discharge side of the pump to indicate
operating pressure. Some systems have in-line flow meters to
indicate pumping rate. Thus, the only equipment needed is a device
to measure water level (relative to the pump) at the water source
and a flow meter if one is not present.
Once the above measurements have been made, the pumping plant
performance can be computed from the relationships in the box on
the following page.
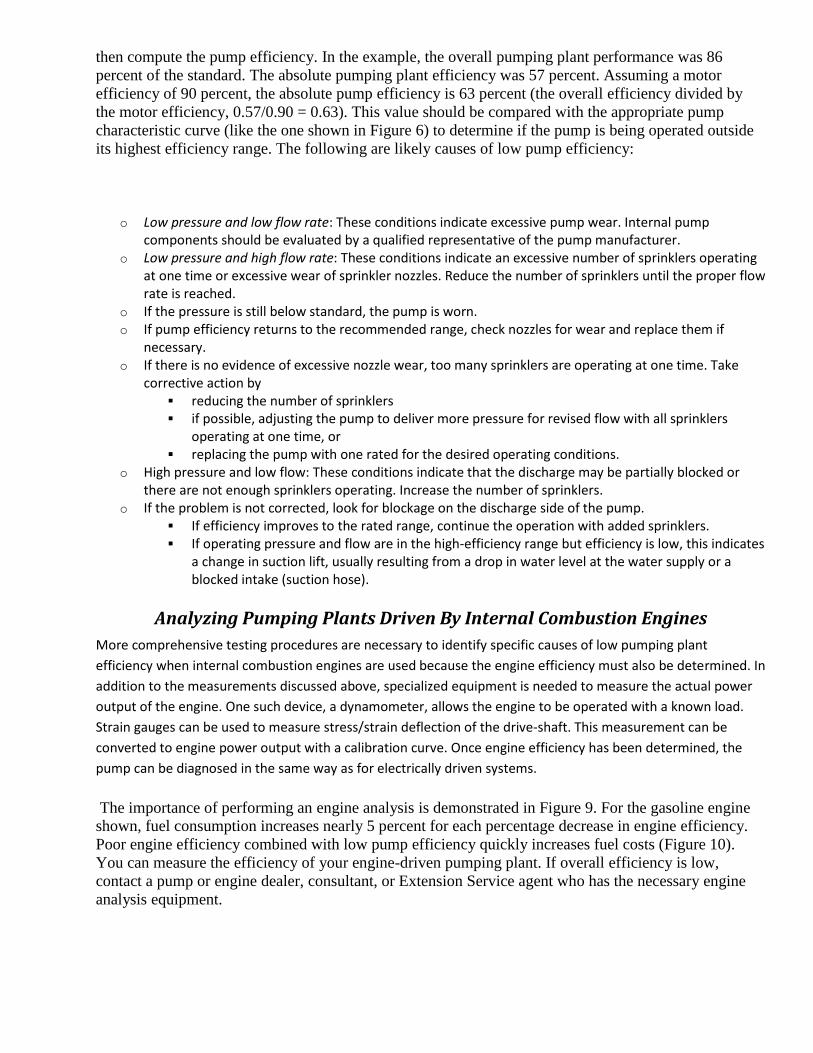
An example of a pumping plant performance analysis is shown in
Table 3 on page 6. In this example, the pumping plant is
performing at 86 percent of the Nebraska Standard. For additional
explanation of the terminology used in Table 3, consult Extension
Publication AG-452-5, Irrigation Management Strategies to
Improve Water and Energy Efficiencies.
In establishing performance standards, it is recognized that
individual pumping plant components are not 100 percent efficient.
The performance standards were established to compare and
evaluate systems based on "reasonable efficiency expectations."
For an electrically driven pumping plant, the standard is based on a
motor efficiency of 88 percent and a pump efficiency of 75 percent
(see the footnotes to Table 2), resulting in an actual efficiency of
66 percent (0.88 x 0.75 = 0.66). Thus, an electrically driven
pumping plant performing at the standard is only 66 percent
efficient in converting electric energy to mechanical energy. In the
example, performing at 86 percent of the standard, the absolute pumping plant efficiency is only 57
percent (0.86 x 0.66 = 0.57).
Interpreting Pumping Plant Performance
There is no exact efficiency level that indicates when adjustments or
repairs are necessary. The cost of efficiency improvements must be
balanced against the possible energy savings. Factors that influence
the decision are:
the extent of poor performance fuel cost hours of operation each year specific conditions of operating pressure and pumping rate.
Normally, adjustment costs are small, and any resulting improvement
in pumping plant performance will pay dividends within one year.
Repair or replacement of minor components is more costly, and
payback may take one to three years. Minor repairs are usually
justified when the system performance is between 60 and 80
percent of the Nebraska Standard. For the example system
operating at 86 percent of the standard, adjustments are
warranted but repair or component replacement is not.
Replacement of major components, such as the engine, motor, or
pump or changing to a more efficient system are most costly.
Normally, replacement of major components is not warranted
unless the performance rating is less than 60 percent of the
standard. The payback period for replacement of major
components is typically five years or more.
Analyzing Pumping Plants Driven By Electric
Motors
The pumping plant analysis indicates whether or not overall
performance is acceptable but does not indicate which component is
responsible if overall efficiency is low. Overall pumping plant
efficiency can be computed by multiplying the efficiencies of the
individual components. Electric motors are relatively efficient and
reliable. Poor pumping plant performance can usually be attributed
to low pump efficiency.
When the pumping plant test indicates poor performance,
assume a reasonable motor efficiency (usually 90 percent) and
then compute the pump efficiency. In the example, the overall pumping plant performance was 86
percent of the standard. The absolute pumping plant efficiency was 57 percent. Assuming a motor
efficiency of 90 percent, the absolute pump efficiency is 63 percent (the overall efficiency divided by
the motor efficiency, 0.57/0.90 = 0.63). This value should be compared with the appropriate pump
characteristic curve (like the one shown in Figure 6) to determine if the pump is being operated outside
its highest efficiency range. The following are likely causes of low pump efficiency:
o Low pressure and low flow rate: These conditions indicate excessive pump wear. Internal pump components should be evaluated by a qualified representative of the pump manufacturer.
o Low pressure and high flow rate: These conditions indicate an excessive number of sprinklers operating at one time or excessive wear of sprinkler nozzles. Reduce the number of sprinklers until the proper flow rate is reached.
o If the pressure is still below standard, the pump is worn. o If pump efficiency returns to the recommended range, check nozzles for wear and replace them if
necessary. o If there is no evidence of excessive nozzle wear, too many sprinklers are operating at one time. Take
corrective action by reducing the number of sprinklers if possible, adjusting the pump to deliver more pressure for revised flow with all sprinklers
operating at one time, or replacing the pump with one rated for the desired operating conditions.
o High pressure and low flow: These conditions indicate that the discharge may be partially blocked or there are not enough sprinklers operating. Increase the number of sprinklers.
o If the problem is not corrected, look for blockage on the discharge side of the pump. If efficiency improves to the rated range, continue the operation with added sprinklers. If operating pressure and flow are in the high-efficiency range but efficiency is low, this indicates
a change in suction lift, usually resulting from a drop in water level at the water supply or a blocked intake (suction hose).
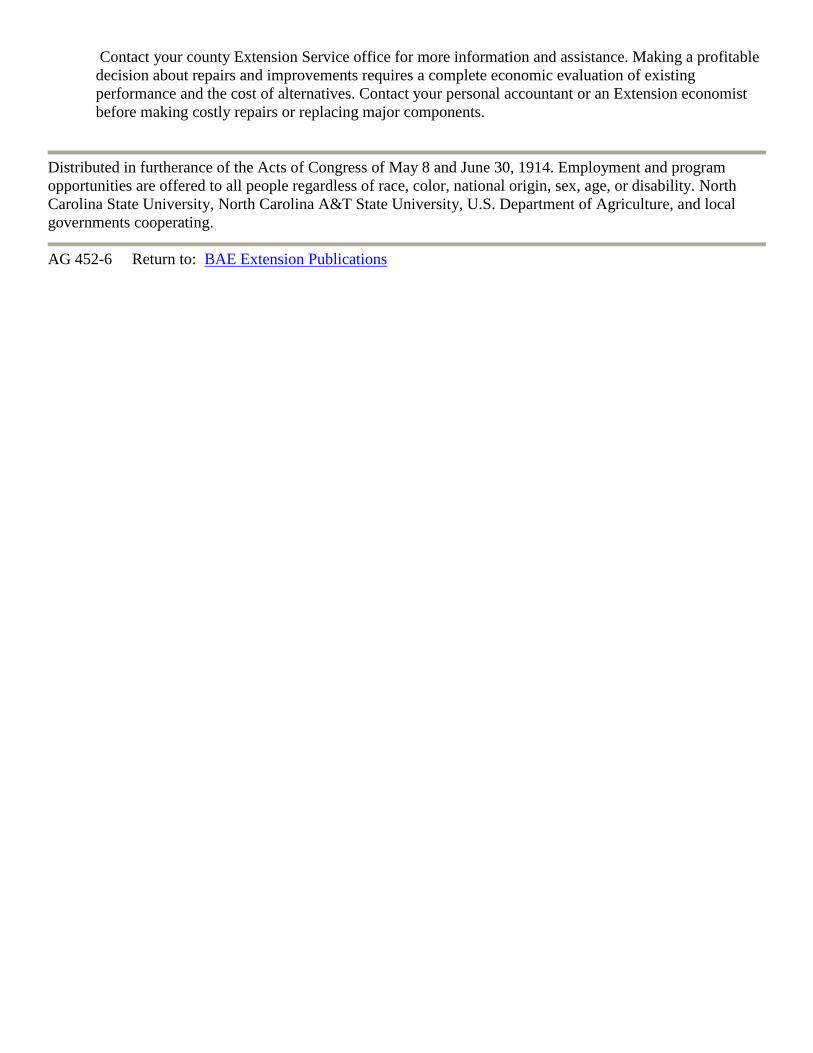
Analyzing Pumping Plants Driven By Internal Combustion Engines
More comprehensive testing procedures are necessary to identify specific causes of low pumping plant
efficiency when internal combustion engines are used because the engine efficiency must also be determined. In
addition to the measurements discussed above, specialized equipment is needed to measure the actual power
output of the engine. One such device, a dynamometer, allows the engine to be operated with a known load.
Strain gauges can be used to measure stress/strain deflection of the drive-shaft. This measurement can be
converted to engine power output with a calibration curve. Once engine efficiency has been determined, the
pump can be diagnosed in the same way as for electrically driven systems.
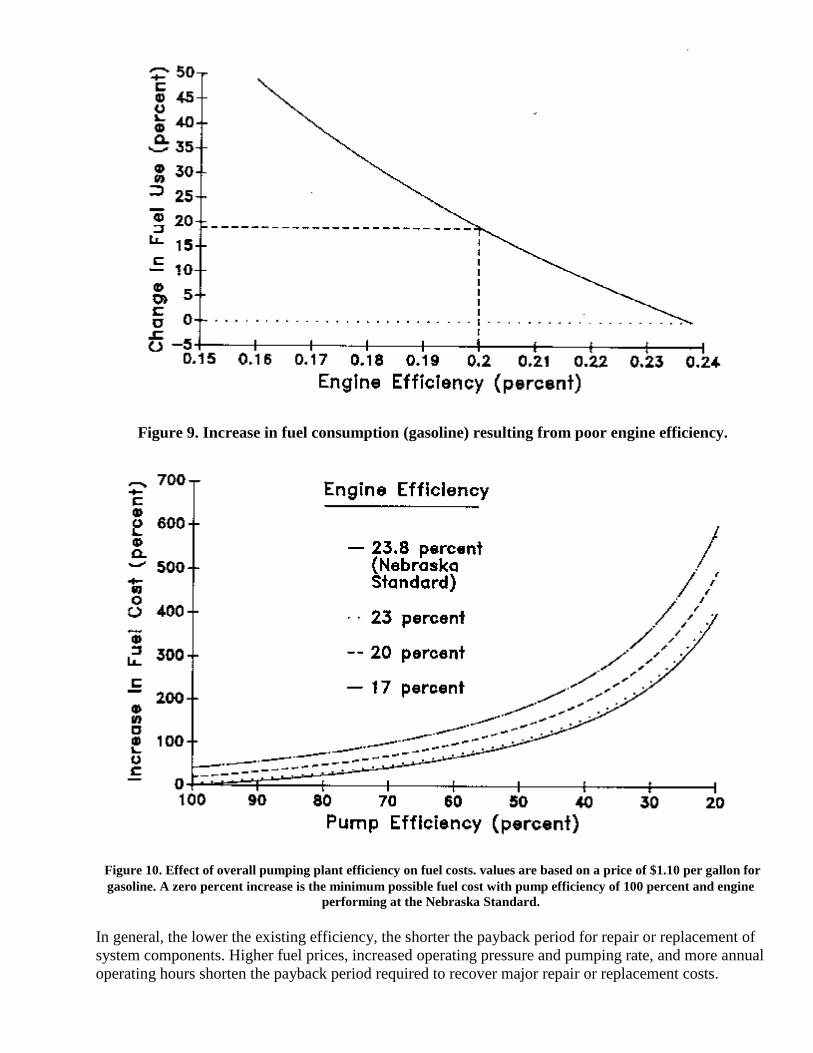
The importance of performing an engine analysis is demonstrated in Figure 9. For the gasoline engine
shown, fuel consumption increases nearly 5 percent for each percentage decrease in engine efficiency.