Pumping Test Analysis of Fourteen Depressurization and Injection Wells in the Basal McMurray Watersand, Fort McMurray, Alberta Authors: JUSTIN K. G. BOURNE 1 , Jacques Whitford AXYS Ltd., Suite 500, 4370 Dominion St., Burnaby, BC V5G 4L7; GARRY W. CHAN, Jacques Whitford AXYS Ltd., Suite 300, 805 – 8th Avenue SW, Calgary, AB T2P 1H7; and WILLIAM CSANYI, Canadian Natural Resources Limited, Suite 1800, 324 – 8th Avenue SW, Calgary, AB T2P 2Z2. 1 Mr. Bourne is now with Lorax Environmental Services Ltd., 2289 Burrard Street, Vancouver, BC V6J 3H9. Abstract A winter drilling and aquifer testing program at the Canadian Natural Resources Limited Horizon Oil Sands Project (Horizon Project) was conducted between 2005 and 2007. The Horizon Project is a large (133,000 increasing to 235,000 barrels per day) open pit oil sands mine located approximately 70 km north of Fort McMurray, Alberta. The Basal McMurray Watersand Aquifer (Basal Aquifer) is the first Cretaceous formation unconformably overlying Devonian limestone. The Basal Aquifer was deposited in Devonian lows and resembles a complex river system with multiple tributaries and side channels. It immediately underlies the McMurray Oil Sand and thus requires depressurization in advance of mining. Produced water is saline and corrosive and will therefore be disposed of by injection back into the Basal Aquifer approximately 5 km north of the area to be initially mined. The current plan is to transmit the saline water from the depressurization wells (DP wells) to the injection wells (IN wells) via a pipeline. Based on the hydrogeologic characteristics, the wells were tested at rates between 130 and 1080 m 3 /d (20 to 165 Imperial gallons per minute, igpm). The observed pump test results were classified into four main categories: 1. Ideal (Theis); 2. Positive (Recharge) Boundary; 3. Negative (Physical) Boundary; and, 4. Negative (Degassing) Boundary. This paper addresses the logistical challenges surrounding drilling and pumping test operations in extreme (-40°C) temperature conditions, as well as the analysis and interpretation of selected pumping test results. Finally, this paper will discuss lessons learned during this program that can be applied to other projects in the future.
Transcript
Pumping Test Analysis of Fourteen Depressurization and Injection Wells in the Basal McMurray Watersand, Fort
McMurray, Alberta
Authors: JUSTIN K. G. BOURNE1, Jacques Whitford AXYS Ltd., Suite 500, 4370 Dominion St., Burnaby, BC V5G 4L7; GARRY W. CHAN, Jacques Whitford AXYS Ltd., Suite 300, 805 – 8th Avenue SW, Calgary, AB T2P 1H7; and WILLIAM CSANYI, Canadian Natural Resources Limited, Suite 1800, 324 – 8th Avenue SW, Calgary, AB T2P 2Z2.
1 Mr. Bourne is now with Lorax Environmental Services Ltd., 2289 Burrard Street, Vancouver, BC V6J 3H9.
Abstract
A winter drilling and aquifer testing program at the Canadian Natural Resources Limited Horizon Oil Sands Project (Horizon Project) was conducted between 2005 and 2007. The Horizon Project is a large (133,000 increasing to 235,000 barrels per day) open pit oil sands mine located approximately 70 km north of Fort McMurray, Alberta. The Basal McMurray Watersand Aquifer (Basal Aquifer) is the first Cretaceous formation unconformably overlying Devonian limestone. The Basal Aquifer was deposited in Devonian lows and resembles a complex river system with multiple tributaries and side channels. It immediately underlies the McMurray Oil Sand and thus requires depressurization in advance of mining.
Produced water is saline and corrosive and will therefore be disposed of by injection back into the Basal Aquifer approximately 5 km north of the area to be initially mined. The current plan is to transmit the saline water from the depressurization wells (DP wells) to the injection wells (IN wells) via a pipeline. Based on the hydrogeologic characteristics, the wells were tested at rates between 130 and 1080 m3/d (20 to 165 Imperial gallons per minute, igpm). The observed pump test results were classified into four main categories:
1. Ideal (Theis);
2. Positive (Recharge) Boundary;
3. Negative (Physical) Boundary; and,
4. Negative (Degassing) Boundary.
This paper addresses the logistical challenges surrounding drilling and pumping test operations in extreme (-40°C) temperature conditions, as well as the analysis and interpretation of selected pumping test results. Finally, this paper will discuss lessons learned during this program that can be applied to other projects in the future.
Introduction
Jacques Whitford AXYS Ltd. (JWA) was retained by Canadian Natural Resources Limited (Canadian Natural) to provide technical professional services for the Basal McMurray Watersand Aquifer (Basal Aquifer) Winter Drilling and Testing Program between 2005 and 2007. This program is part of an ongoing effort to manage the Basal Aquifer in advance of open pit mining at the Horizon Oil Sands Project (Horizon Project). The Basal Aquifer underlies the oil sand and requires depressurization in advance of mining. Produced water is saline and will therefore be disposed of by injection back into the Basal Aquifer approximately 5 km north of the area to be initially mined. Water will be transmitted from the depressurization wells (DP wells) to the injection wells (IN wells) via a pipeline.
JWA was retained by Canadian Natural to provide input on the design of the DP and IN wells, to supervise the installation and testing of the DP and IN wells and associated observation wells (OBW), and to provide a report documenting the work with an assessment of the long-term capacity of each well for depressurization and injection, respectively. During 2006, one IN well and one OBW was installed at each of six injection locations. These wells, and two IN wells that were previously installed, were pump tested. The scope of activities for 2007 included the installation of five DP wells and associated OBW’s, and the pumping tests that were completed on the five new wells.
Horizon Project Overview
The Horizon Project is located approximately 70 km north of Fort McMurray, Alberta, where Canadian Natural owns and operates leases covering 115,000 acres through lease arrangements with the Province of Alberta. Drilling on the leases indicates an estimated 16 billion barrels of synthetic crude oil (bbl SCO) in place at the Horizon Project, with approximately 6 to 8 billion bbl SCO recoverable using existing open pit mining technologies. Phase 1 start-up is scheduled for the third quarter of 2008 which will see production of 110,000 bbl SCO per day. Future phases will see production of 232,000 to 250,000 bbl SCO per day, followed in due course by an expansion to 500,000 bbl SCO per day.
Hydrogeological Setting
The Horizon Project is situated within the northeastern margin of the Western Canada Sedimentary Basin. In general, the regional stratigraphy consists of Precambrian rocks unconformably overlain by Middle and Upper Devonian rocks. Cretaceous sedimentary strata unconformably overlie the Devonian rocks, and are, in turn, overlain unconformably by Quaternary unconsolidated deposits.
The McMurray Formation is the first Cretaceous formation overlying the Devonian rocks, and is present throughout the study area. The thickness of the McMurray Formation varies within the study area from 50 m in the northwestern part of the study area, to more than 125 m to the east in the vicinity of a Devonian aged collapse feature under the Athabasca River. The McMurray Formation has been subdivided into a Lower,
Middle and an Upper member, and consists of quartzose sand and clay interbeds. The Upper and Middle members are generally bitumen-saturated, which substantially affects the hydrogeological properties of the unit. Water bearing sands are common at the base of the lower member. These sands are generally referred to as the Basal Aquifer, or Basal Watersands. The thickness of the Basal Aquifer in the study area, as mapped by Canadian Natural, ranges from nil to more than 70 m in the area where the Devonian collapse is encountered. As indicated, the Basal Aquifer sands generally extend from the Devonian structural low, adjacent to the Athabasca River. There are also isolated areas of Basal Aquifer found throughout the project area. This map is based on over 1,000 structure test holes drilled by Canadian Natural to delineate oil sand reserves and to map the Basal Aquifer. The McMurray Formation acts as an aquitard where it is bitumen-saturated.
Groundwater in the Basal Aquifer in the study area is generally described as a sodium chloride type of water and is generally brackish to saline, with total dissolved solids (TDS) concentrations ranging from 17,900 to 278,300 mg/L. Groundwater sample analysis conducted by Canadian Natural in 2005 indicated a range in TDS of between 17,900 mg/L to 183,000 mg/L on the Horizon leases. The highest TDS groundwater is generally associated with the Devonian low near the Athabasca River. Chemical analysis results indicate that the groundwater in the Basal Aquifer is not potable.
Background
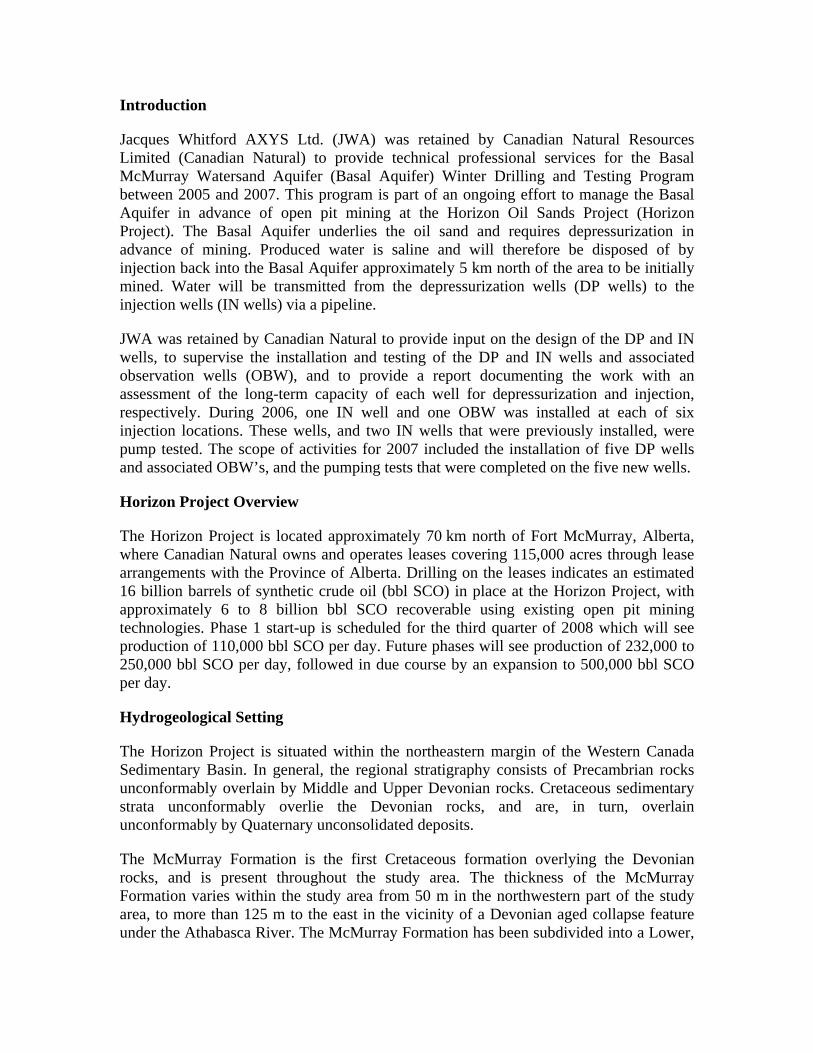
The first area to be mined at the Horizon project is the south pit, shown in Figure 1. Mining of a starter pit has commenced at the north-western extent of the south pit and is scheduled to proceed to the east over the next ten years.
Numerical modelling results identified six locations where depressurization wells (DP-01 through DP-06) were to be drilled and installed around the starter pit, as shown in Figure 1. These wells will be pumped continuously throughout the mining process, and will be joined by additional wells as the pit expands.
As the produced water is far too saline (>25,000 ppm TDS) to discharge to surface, a pipeline has been constructed to transport and re-inject the water back into the Basal McMurray aquifer about 5km north of the south pit. As with the DP wells, ten injection well locations (IN-01 through IN-10) were located as shown in Figure 1 based on numerical modeling results.
Drilling Program
Drilling was conducted with a mud rotary water well drilling rig provided by McAllister Drilling of Lloydminster, Alberta. One production well (either DP or IN) was installed at each drill pad, with an observation well (OBW) located at a radial distance of approximately 25 to 50 m from the production well. All holes were logged using downhole wireline geophysical methods by Century Wireline Services of Tulsa, Oklahoma.
As the project area is primarily muskeg swamp, access with heavy equipment was limited to the winter months when the ground is frozen. Of course winter work in northern
Figure 1: Basal Aquifer Isopach Map
Alberta comes with some challenges as temperatures drop below -40°C before accounting for wind chill. Such extreme temperatures cause serious complications such as frozen and brittle drill pipe. As such, boilers and steam wands were on hand to keep everything operational. All vacuum and water trucks had to have dedicated boilers on-board as well as their loads would freeze within minutes if left unattended to.
Hydrogen sulphide (H2S) is a concern in the oil sands, and this site was no different. Each drill hole was set up with a diverter in place, ready to shut-in the well in case a gas pocket was encountered. Also, recirculated mud and cuttings were passed through a poor-boy degasser in the mud tank. Full time dedicated safety personnel from United Safety of Calgary, Alberta were on-site monitoring all site activities as well as measuring gas levels at critical points of the program, ensuring the health and safety of all personnel.
Pumping Test Program
The following tests were typically performed at each of the well locations:
1. Step-drawdown test;
2. Constant rate pumping test; and
3. Water sample collection and analysis.
McAllister provided the electrical submersible pump, drop pipe, and the above ground well head fittings, including a ball valve to control the flow rate and a Halliburton flow meter to monitor the rate of flow. A ball valve was used in preference to a gate valve as gate valves have cracked under high rate tests. In addition, a gate valve opens from bottom to top, potentially creating a pocket of no-flow where gas can accumulate and periodically release, thereby interrupting flow. Centurion Power of Fort McMurray, Alberta was retained by Canadian Natural to construct a control box that would match the pump to the correct generator set and therefore facilitate pump on/off switching. Terroco Contracting of Red Deer, Alberta provided 400 bbl storage tanks, a manifold and a boiler to contain the produced water and prevent the water from freezing. Two water storage tanks were used for each test. Discharge water was pumped to the top of the first tank and allowed to cascade into the tank. In this way the lifting height above ground was maintained as a constant through the course of each test. United Safety monitored the lease and various sampling ports and fittings for the potential release of gas.
The water level response was measured in the pumping well and at the observation well with data logging equipment (Solinst Leveloggers). Manual depth to water measurements were periodically obtained to check the calibration of the Leveloggers. A high sensitivity Levelogger was hung inside the surface casing of the OBW during each pumping test to monitor barometric pressure changes during each of the tests.
The step-drawdown testing consisted of up to four steps of 30 minutes duration, at progressively increasing pumping rates. These rates were to represent approximately 50, 75, 100 and 125% of the anticipated production well capacity as estimated during well
development. However, the discharge rates and durations were also dictated by the available water storage capacity on site. The relatively high salinity of the groundwater required that all produced groundwater be contained for proper disposal. Discharge rates ranged between approximately 157 m3/d (24 igpm) and 1015 m3/d (155 igpm). Based on the possibility of negative boundary conditions observed on previous tests, consideration was given to allow the water level to recover to the pre-pumping level at the end of each step, if possible. However, freezing conditions made this impractical.
The final step in each step test was extended to up to approximately six hours at a constant pumping rate for each well site. The total duration of each test was up to eight hours of drawdown followed by monitoring of the recovery period for an equal period of time, or until 95% of recovery had been observed. Freezing was not a concern for the recovery period because dismantling and drainage of the above ground lines was commenced immediately after the pump was shut down. Pumping occurred at night, and moving between well sites was restricted to daylight hours for safety reasons.
Field chemistry parameters were generally monitored through the course of each pumping test. Parameters included temperature, pH, dissolved oxygen and total dissolved solids.
Nearing the end of each pumping test, water samples were collected for the analysis of chemical parameters that are important for the planning of future pumping. Samples obtained from a sampling port situated down-stream of the ball valve were collected while breathing with a self-contained breathing apparatus (SCBA). Produced gas was also monitored during sample collection. Parameters included the following:
• Routine parameters including major ions, total suspended solids, total dissolved solids;
• Naphthenic Acids;
• Silica species;
• Dissolved metals; and,
• Benzene, Toluene, Ethyl Benzene, Xylene F1 and F2 Hydrocarbon fractions.
Selected Results Analysis and interpretation of the pumping test results resulted in four main types of response:
i. Ideal (Theis);
ii. Positive;
iii. Negative;
a. Physical;
b. Due to degassing; and,
iv. Other.
These main types of observed responses are discussed in the following sections.
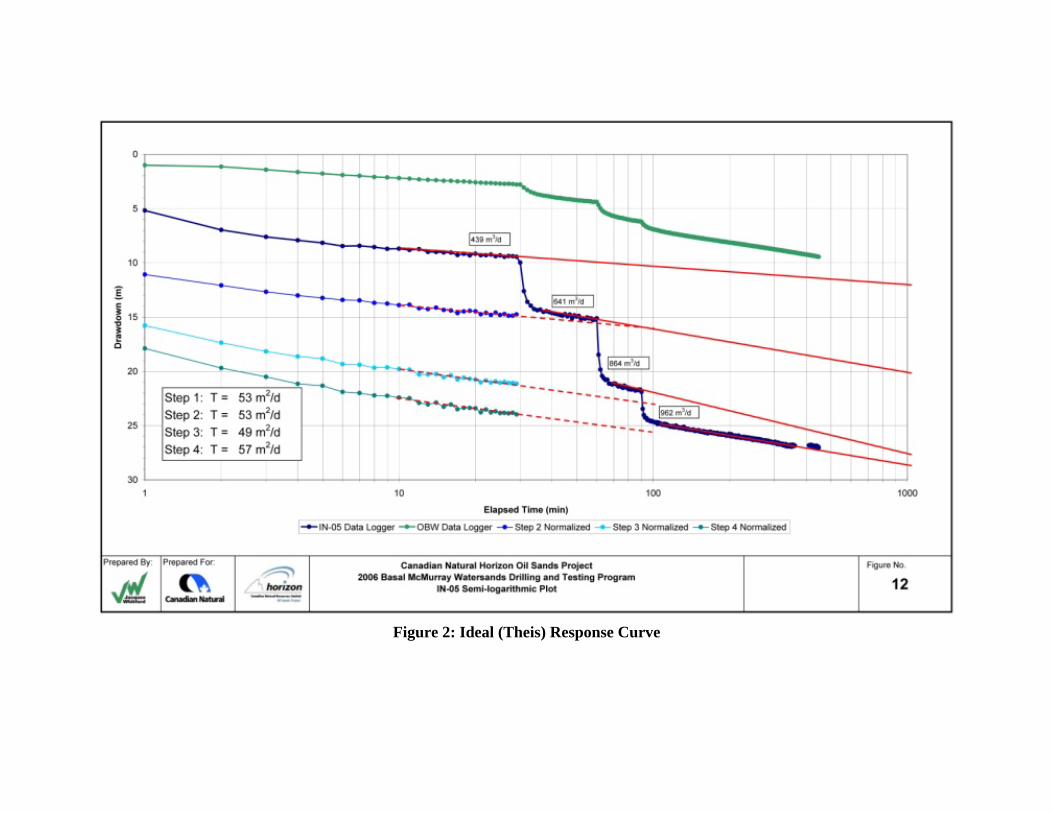
Ideal (Theis) Response Theis-like aquifers are horizontal, fully confined, homogeneous, isotropic, and infinite in areal extent. When all of the above assumptions hold true, one expects to observe an ideal, Theis-like pumping test response. Perhaps not surprisingly, this type of response was observed in several wells located near the centre of the main channel in the IN area. One such well was IN-05, whose results are presented in Figure 2.
The production well and observation well response curves are presented on a semi-logarithmic scale. The steps of the production well response curve corresponding to the variable pumping rates have been normalized as well to remove the effects of previous pumping steps.
The first observation one can make about these curves is that they plot as straight lines on the semi-log scale. This indicates no boundary effects during the test, and that the remaining Theis assumptions have been satisfied.
Also of interest is that the production well curves are essentially perfectly parallel to the corresponding observation well curves. This implies that the wells are efficient, and that non-linear energy losses associated with the production well are minimal.
Positive Boundary Response One variation of an ideal pumping test response is a positive boundary response. Such a response occurs when a source of recharge is encountered at a certain radial distance from the production well. Such a boundary results in decreased drawdown rates as water can move more freely from the newly found source to the production well. This recharge source can vary from a river or lake with a hydraulic connection to the aquifer to a zone of higher transmissivity. In the case of this program, positive boundary responses are inferred to have been caused by adjacent zones of higher transmissivity such as a wider part of the channel with thicker deposits and/or coarser sediments.
IN-02 (Figure 3) is an excellent example of a pumping test exhibiting a positive boundary response. In the final step of the variable rate test, the production well water level initially drew down very quickly by almost 14 m, and then levelled off quickly to a flat line with no additional drawdown observed out to the end of the test (8 hours total elapsed time). IN-02 is located near the centre of the main channel, however the channel widens and thickens significantly just to the west. Based on the observed results, it is assumed that
Figure 2: Ideal (Theis) Response Curve
Figure 3: Positive Boundary Response Curve
this higher transmissivity zone of the channel adjacent to IN-02 is responsible for the positive boundary effect.
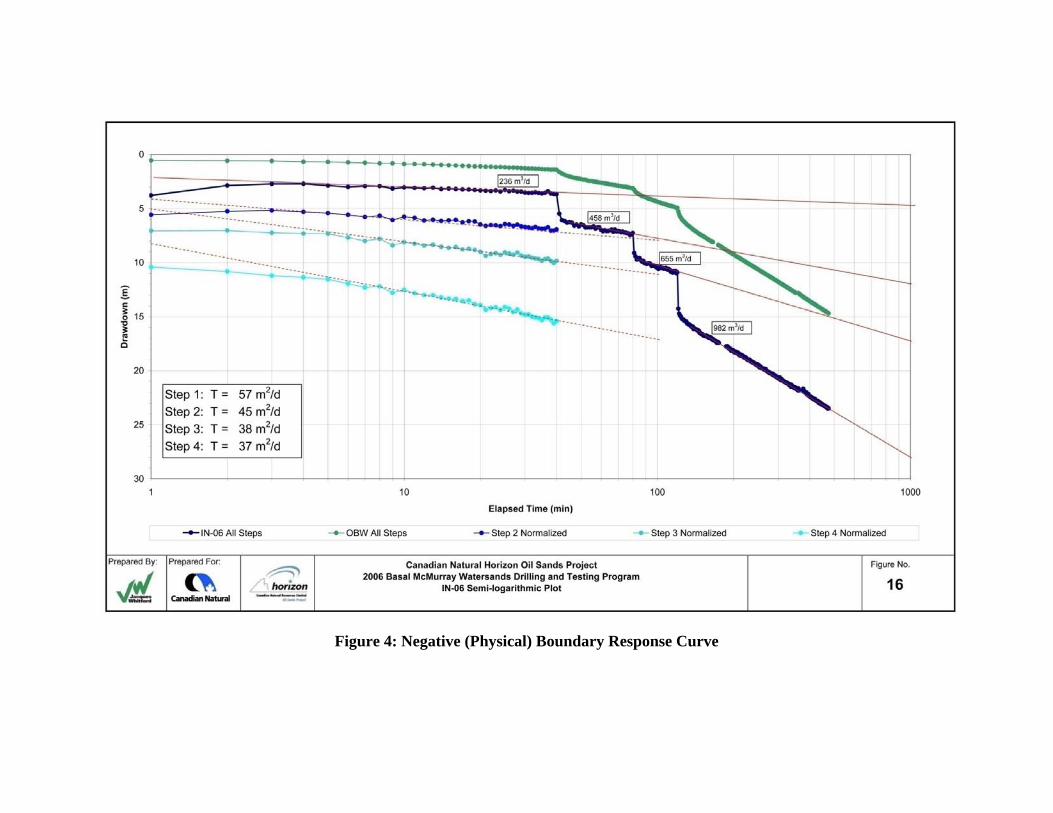
Negative (Physical) Boundary Response
A negative physical boundary response is just the opposite of the positive boundary response described above. This type of response occurs when an impermeable boundary and/or lower permeability zone is encountered at a radial distance from the production well. This type of boundary causes drawdown rates around the production well to increase as it becomes more difficult to draw water towards the production well from the direction in which the boundary is located.
IN-06 (Figure 4) is an example of a negative boundary response observed during a pumping test. While difficult to observe in the unadjusted curves, closer inspection of the normalized production well curves leads to the observation that there is in fact a downward inflection in the later curves. Such an inflection represents an increased drawdown rate, which has been assumed to be caused by a negative boundary. As these effects are subtle here, it is assumed that the boundaries encountered are zones of lower transmissivity rather than impermeable boundaries or the edges of the aquifer.
It is also interesting to note that while the production well and the observation well response curves are essentially parallel (indicating an efficient production well), both curves show increasing slopes with progressive steps. These increasing slopes translate into monotonically decreasing transmissivity with each successive step. If one observes where IN-06 is located, it is near the centre of one of the larger tributary channels. As the drawdown cone extends radially outward from the production well, the transmissivity of the aquifer presumably decreases continually as the channel thins towards the edges. It makes sense then that as time progresses during the test, the observed transmissivity decreases.
Negative (Degassing) Boundary Response
DP-05 (Figure 5) is a good example of this type of response. At first glance, this type of response appeared to be a very pronounced negative boundary effect at approximately 300 minutes elapsed time. On closer inspection, however, it was observed that while a very distinct inflection was noted in the production well curve, no such effect was mirrored in the observation well.
This could not be explained at first, until a similar effect was noticed at several different production wells. Upon review of the field notes for the affected tests, it was noted that all of the groundwater samples from these wells were effervescent and contained more dissolved H2S than at other leases. Further, side by side comparison of the test results led to the observation that the inflection in the production well curves all occurred at approximately 25 m drawdown. From this it was hypothesized that at a pressure drop equivalent to approximately 25 m of water, H2S would start bubbling out of solution. When there is enough bubbling around the production well, multi-phase flow (gas and water) occurs. This, in turn, results in decreased transmissivity for water, which manifests
itself as markedly increased drawdown around the production well. As flow around the observation well is still single phase, this degassing boundary effect is not observed there.
Other Responses
It can be argued that no field program would be complete without encountering something that cannot be explained. While there were many interesting things that happened throughout this program, one particular pumping test response was more unique than the rest.
DP-02 (Figure 6) is located within approximately 100 m of DP-01, another depressurization well which was installed and pump tested previously. DP-02 was installed and completed similar to DP-01, and it was presumed that it could be pump tested in a similar fashion as well. DP-01 was not highly productive, so it was decided to begin the DP-02 test at the lowest rate the pump could reasonably manage. The production well drew down quickly by nearly 25 m in the first 40 minutes, at which point the second step was commenced. Upon increasing the pumping rate, the drawdown in the production well immediately became a linear function, progressing at almost precisely 1.2 m/min. Note that the drawdown response curves in Figure 6 are plotted on a linear time scale, not logarithmic as all previous figures were. At approximately 75 minutes the water level in the production well had drawn down nearly to the pump intake, so the test was terminated prior to breaking suction.
It should also be noted that while a very large drawdown (approximately 65 m) was observed in the production well, almost no drawdown (less than 1.2 m) was measured in the observation well. This would tend to indicate that there is a poor connection between the production well and the observation well.
DP-01 and DP-02 are quite close together (within 100 m) and are both located near the confluence of several tributary channels. While DP-01 was successfully pump tested previously, DP-02 behaved in an extremely non-ideal fashion. To date, no convincing explanations have been put forth for the behaviour observed at DP-02. However, it is believed to be caused by something related to well installation and development, though geology may also play a part.
Conclusions
On a project of this scale, knowledge of geology and depositional history is extremely important to understanding the hydrogeologic regime. By the nature of the industry, a great deal of exploration drilling has typically been completed prior to the commencement of a hydrogeology program. In most cases, isopach maps of aquifers of interest have or can been developed based on the results of such drilling programs. This detailed local information, when combined with knowledge of the regional geologic environment, can help hydrogeologists to make informed preliminary decisions such as siting groundwater supply and disposal wells, for instance.
From the fourteen pumping tests that were conducted during this program in various parts of the Basal McMurray Watersand at the Horizon project, several patterns were noted.
Figure 6: Other Response Curve
The Basal Aquifer can be likened to a fluvial system with a main channel and multiple tributary channels of varying widths and thicknesses.
Typically, the main channel is wider and thicker than the tributaries. Also, it is expected to be a higher energy depositional environment, resulting in coarser grained sediments being deposited in this area. This hypothesis has been confirmed through examination of core samples from various locations across the project area. As such, one would expect that the main channel would be a suitable place to site a water supply or disposal well. One might also predict that a dewatering operation in and around the main channel would be a rather large and challenging operation.
Conversely, the narrower and thinner tributary channels are lower energy depositional environments. As such, finer grained sediments are deposited in these areas. This results in lower transmissivities than in the main channel. Tributaries are not likely to be good places to locate water supply or disposal wells. However, dewatering operations are likely to be quite manageable if it is primarily tributary channels that need to be dealt with.