Proper pump for the right process is the cornerstone of the process industry, where selection of a pump for smooth functioning of the machinery is vital.
*R.P. Sharma
Abstract
The heart of most process industry is the rotating equipment. In almost all the
process industry liquid is to be handled to and fro through various vessels, storage
tanks, heights and lengths during the process of operation. In fact, most
manufacturing plants, commercial buildings, and municipalities rely on pumping
systems.
Fans and blowers provide air for ventilation and industrial process requirements.
Fans generate a pressure to move air (or gases) against a resistance caused by
ducts, dampers, or other components in a fan system
Pumps Fans and blowers being rotating equipment plays a very important role in
process industries and no plant can be operated successfully without reliable andlow energy efficient pumping, Fan and blower system. The profit of the plant or
company depends upon more reliable and efficient pumping, Fan and blower
system.
This report is devided into two parts, First part include pumps and second part deal
2.3.1 System characteristics .................................................................................................................... 26
2.3.2 Fan characteristics .......................................................................................................................... 27
2.3.3 System characteristics and fan curves............................................................................................. 28
2.3.4 Fan laws ......................................................................................................................................... 29
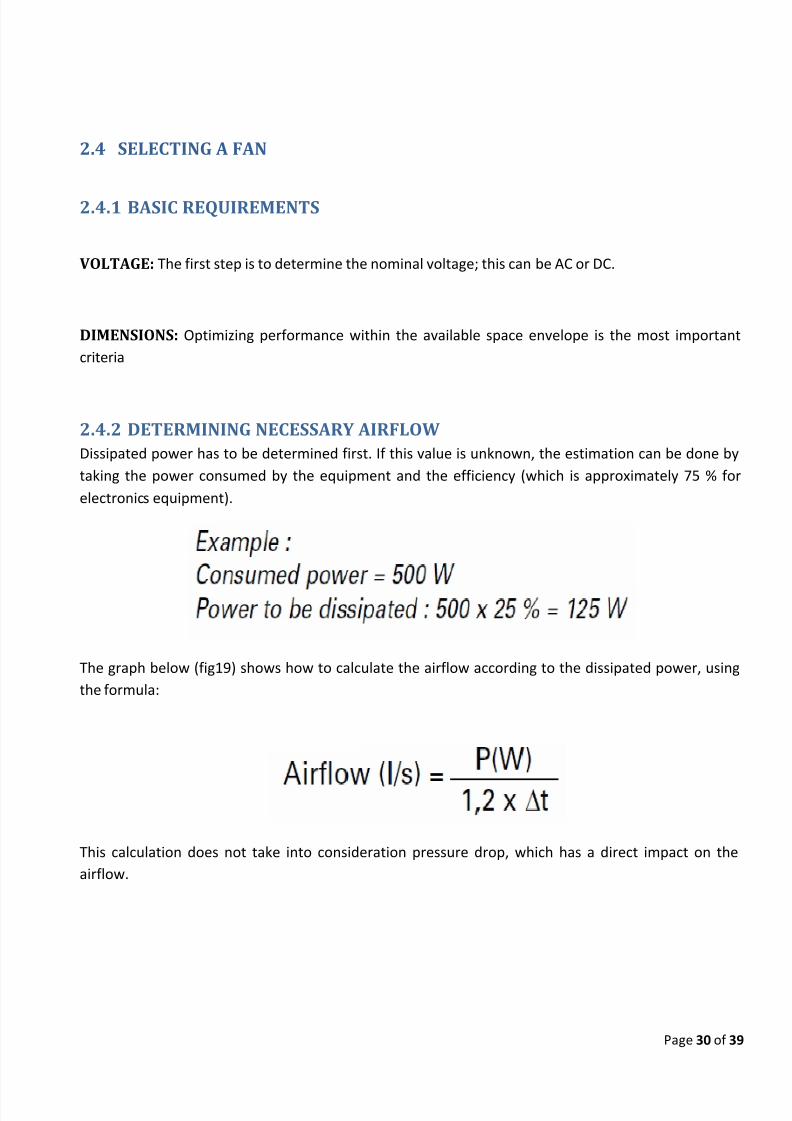
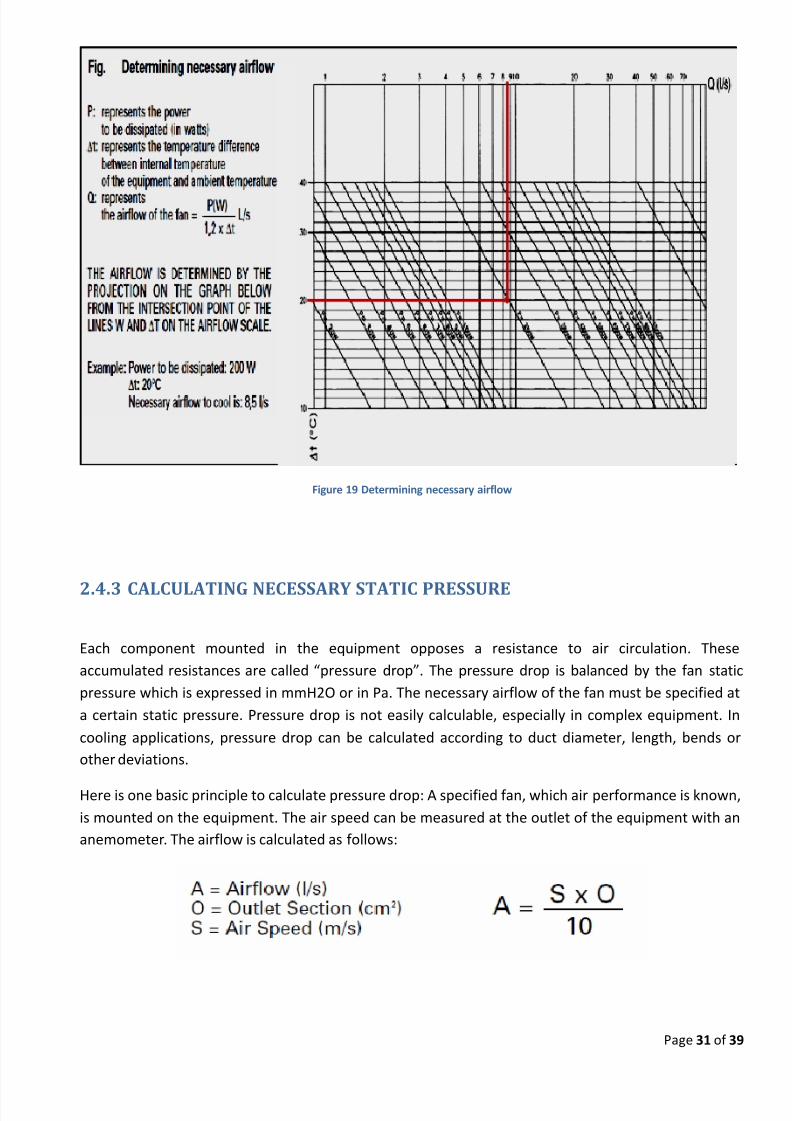
2.4 SELECTING A FAN ................................................................................................................................... 30
2.5 Fan and Blower Efficient System Operation ............................................................................................ 33
2.5.1 Installation of Fan ........................................................................................................................... 33
2.5.1.1 Impeller Inlet Seal Clearances ..................................................................................................... 33
2.5.1.2 System Resistance Change .......................................................................................................... 33
2.5.2 Flow Control Strategies .................................................................................................................. 33
Pumps are the fluid moving machineries which increase the mechanical energy of
the fluids to be displaced. The energy increase may be used to increase the velocity,
the pressure or the elevation of the fluids. A large number of pumps, differing
widely in principle and mechanical construction, have been developed to meet a
wide variety of operating conditions. For selection of pumps for a specific
application requires the knowledge of operating conditions of the system and
applicability of different available pumps.
1.2 CLASIFICATION OF PUMPS
By far the most common method of adding energy is by Positive displacement or
Centrifugal action, which can be supplied by the outside forces. These methods lead
to the two major classes of fluid moving machinery: 1. Positive Displacement Pumps
2. Centrifugal Pumps
1.2.1 POSITIVE DISPLACEMENT PUMPS
Depending upon the way of force generation, these can be classified asReciprocating (force applied to the fluid by a piston acting in a cylinder) and Rotary
(by rotating pressure members) pumps.
1.2.1.1 Reciprocating Pumps
A definite volume of liquid is trapped in a chamber, which is alternately filled from
the inlet and emptied at a higher pressure through the discharge. The chamber is a
stationary cylinder that contains a piston or plunger. According to the required
operating pressure.The maximum discharge pressure for commercial piston pumps is about 50 atm.
For higher pressure services plunger pumps can be utilized, they can discharge
against a pressure of 1500 atm. or more.
Diaphragm pumps can be used to handle toxic or corrosive liquids. They handle
small to moderate amounts of liquid, up to about 100 gal/min, and can develop
Rotary pumps best on clean, moderately viscous fluids, such as light lubricating oil.
Discharge pressures upto 200 atm and discharge a steady stream at moderate to
high pressures. They cannot be used with slurries.
Rotary pumps can be classified as Gear pump, Lobe (a broad rounded segmental
division) pump, Screw pump, Cam (eccentric projection on a revolving shaft, shaped
so as to give some desired linear motion) pump, and Vane (blade of a wind mill,propeller, revolving fan) pump.
1.2.2 CENTRIFUGAL PUMPS
The mechanical energy of the liquid is increased by centrifugal action. Centrifugal
pumps are classified as single suction and double suction pumps depending upon
the suction from either one side or from both sides respectively.
. A so-called high-energy centrifugal pump can develop a head of more than 200 m
in a single stage. But generally when a head greater than about 30 m is needed, 2 or
more impellers can be mounted in series on a single shaft and a multi-stage pump is
obtained. The discharge from the second provides suction for the third, and so forth.
The developed heads of all stages add to give a total head several times that of a
single stage.
Because of environmental considerations, leak proof centrifugal pumps are
increasingly used for handling dangerous liquids.
1.3 Pump Selection Considerations
1.3.1 Understanding Pumping System Requirements
Pumps transfer liquids from one point to another by converting mechanical energy
from a rotating impeller into pressure energy (head). The pressure applied to the
liquid forces the fluid to flow at the required rate and to overcome friction (or head)
losses in piping, valves, fittings, and process equipment. The pumping system
designer must consider fluid properties, determine end use requirements, and
understand environ-mental conditions.
Fluid Properties: The properties of the fluids being pumped can significantlyaffect the choice of pump. Key considerations include:
Acidity/alkalinity (pH) and chemical composition: Corrosive and acidic fluids
can degrade pumps, and should be considered when selecting pump materials.
Operating temperature: Pump materials and expansion, mechanical seal
components, and packing materials need to be considered with pumped fluids that
are hotter than 200°F.
Solids concentrations/particle sizes: When pumping abrasive liquids such as
industrial slurries, selecting a pump that will not clog or fail prematurely depends
on particle size, hardness, and the volumetric percentage of solids.Specific gravity: The fluid specific gravity is the ratio of the fluid density to that of
water under specified conditions. Specific gravity affects the energy required to lift
and move the fluid, and must be considered when determining pump power
requirements.
Vapor pressure: A fluid’s vapor pressure is the force per unit area that a fluid
exerts in an effort to change phase from a liquid to a vapor, and depends on the
fluid’s chemical and physical properties. Proper consideration of the fluid’s vapor
pressure will help to minimize the risk of cavitation.
Viscosity: The viscosity of a fluid is a measure of its resistance to motion. Sincekinematic viscosity normally varies directly with temperature, the pumping system
designer must know the viscosity of the fluid at the lowest anticipated pumping
temperature. High viscosity fluids result in reduced centrifugal pump performance
and increased power requirements. It is particularly important to consider pump
suction-side line losses when pumping viscous fluids.
1.3.2 End Use Requirements—System Flow Rate and Head
The design pump capacity, or desired pump discharge in gallons per minute (gpm)
is needed to accurately size the piping system, determine friction head losses,
construct a system curve, and select a pump and drive motor. Process requirements
may be met by providing a constant flow rate (with on/off control and storage used
to satisfy variable flow rate requirements), or by using a throttling valve or variable
speed drive to supply continuously variable flow rates.The total system head has
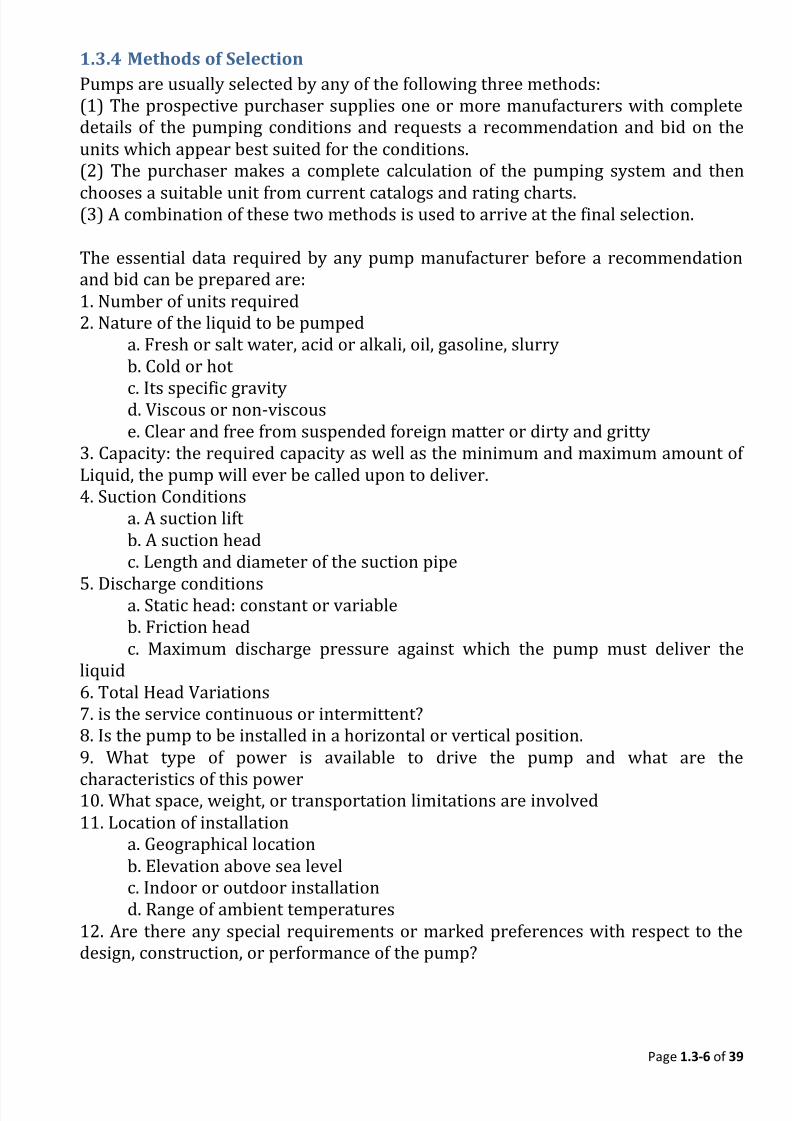
three components: static head, elevation (potential energy), and velocity (or
dynamic) head. Static head is the pressure of the fluid in the system, and is the
quantity measured by conventional pressure gauges. The height of the fluid level
can have a substantial impact on system head. The dynamic head is the pressure
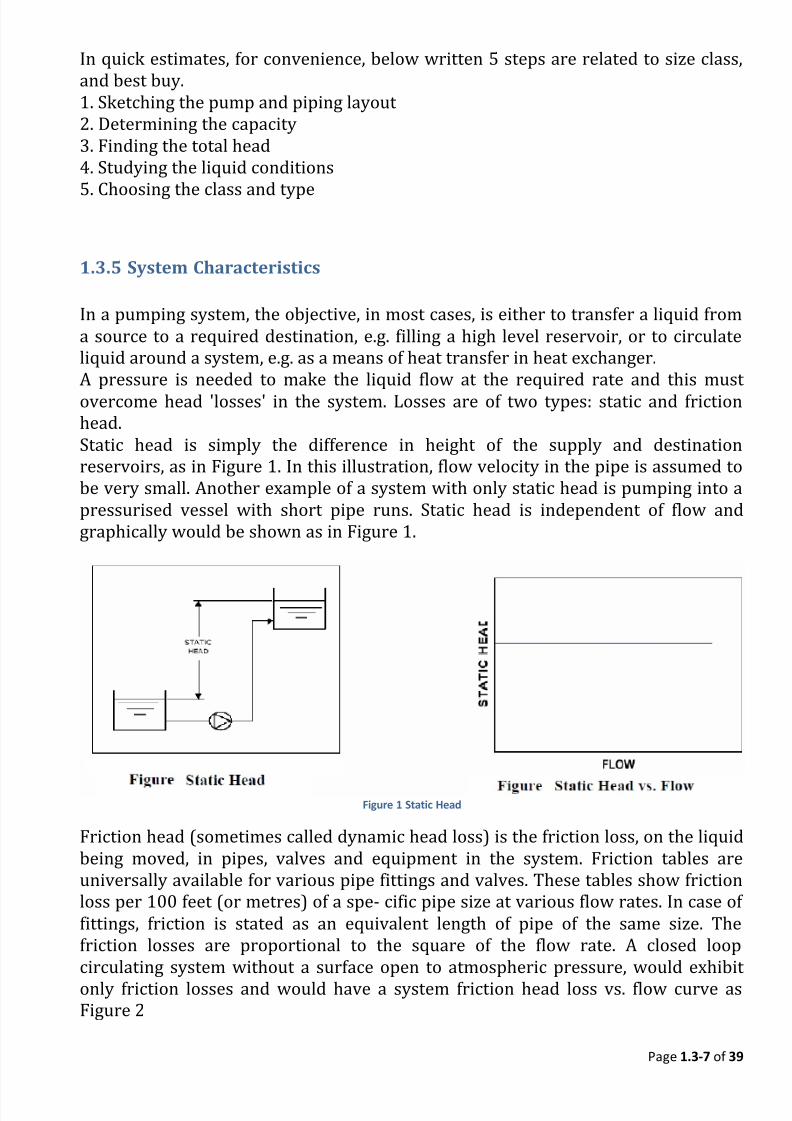
required by the system to overcome head losses caused by flow rate resistance in
pipes, valves, fittings, and mechanical equipment. Dynamic head losses are
approximately proportional to the square of the fluid flow velocity, or flow rate. If
the flow rate doubles, dynamic losses increase fourfold.
For many pumping systems, total system head requirements vary. For example, in
wet well or reservoir applications, suction and static lift requirements may vary as
the water surface elevations fluctuate. For return systems such as HVAC circulating
water pumps, the values for the static and elevation heads equal zero. We also need
to be aware of a pump’s net positive suction head requirements. Centrifugal pumps
require a certain amount of fluid pressure at the inlet to avoid cavitation.
A rule of thumb is to ensure that the suction head available exceeds that required by
the pump by at least 25% over the range of expected flow rates.
1.3.3 Environmental Considerations
Important environmental considerations include ambient temperature and
humidity, elevation above sea level, and whether the pump is to be installed indoors
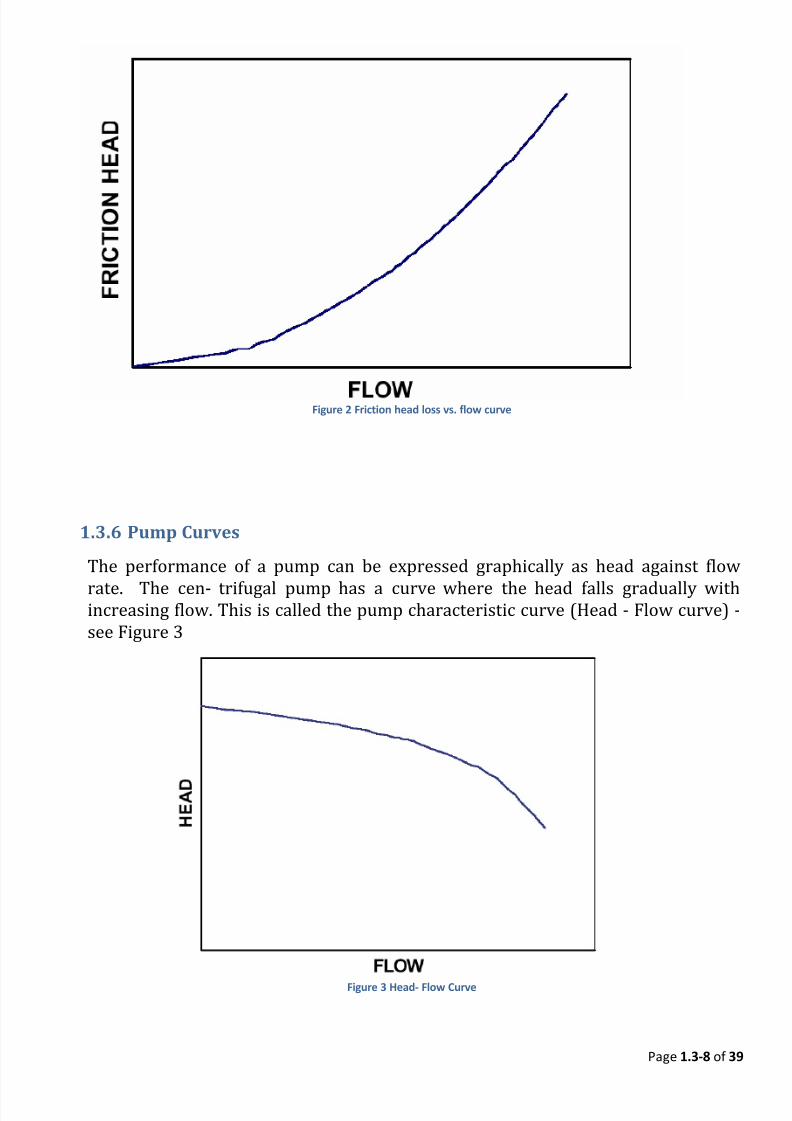
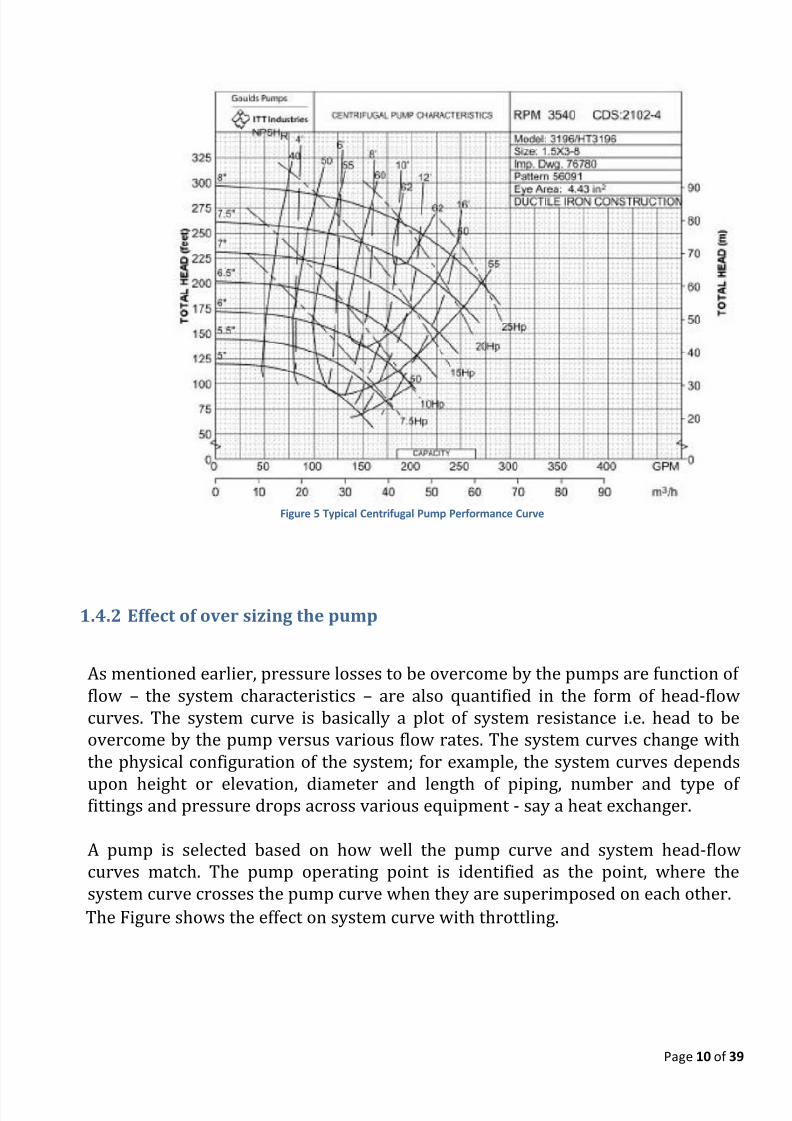
The performance of a pump can be expressed graphically as head against flow
rate. The cen- trifugal pump has a curve where the head falls gradually withincreasing flow. This is called the pump characteristic curve (Head - Flow curve) -
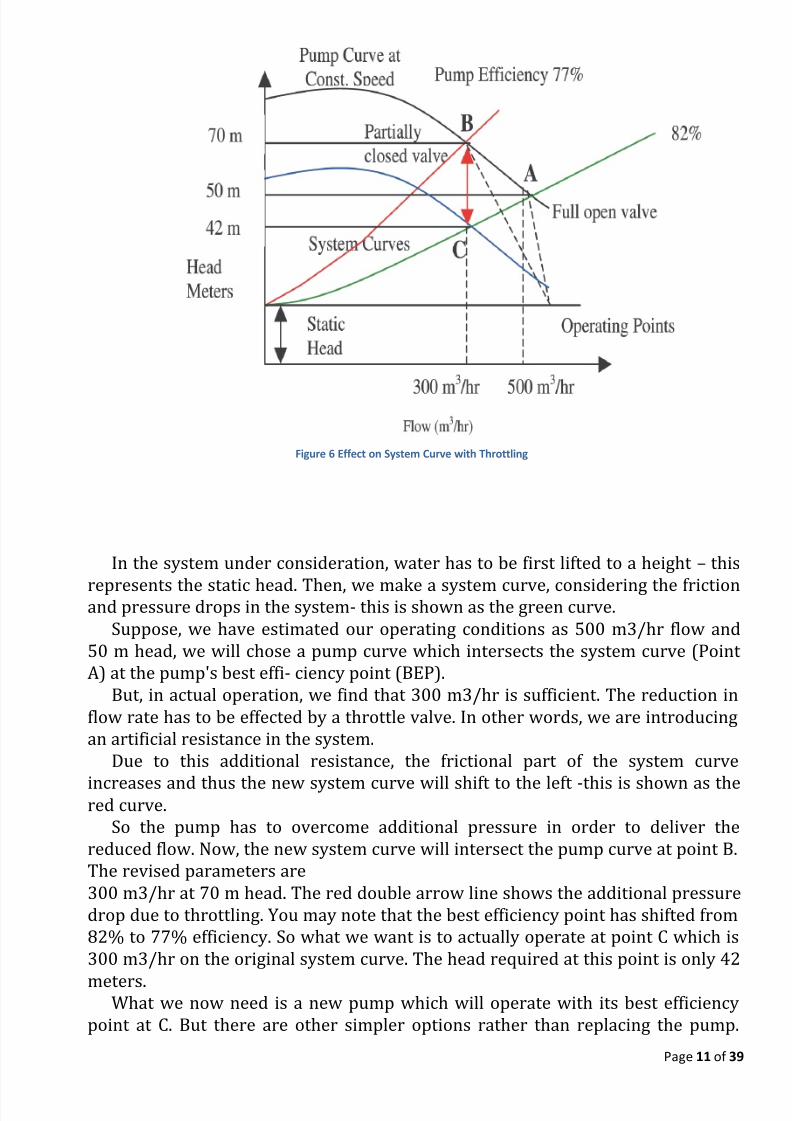
As mentioned earlier, pressure losses to be overcome by the pumps are function of
flow – the system characteristics – are also quantified in the form of head-flow
curves. The system curve is basically a plot of system resistance i.e. head to be
overcome by the pump versus various flow rates. The system curves change with
the physical configuration of the system; for example, the system curves depends
upon height or elevation, diameter and length of piping, number and type of fittings and pressure drops across various equipment - say a heat exchanger.
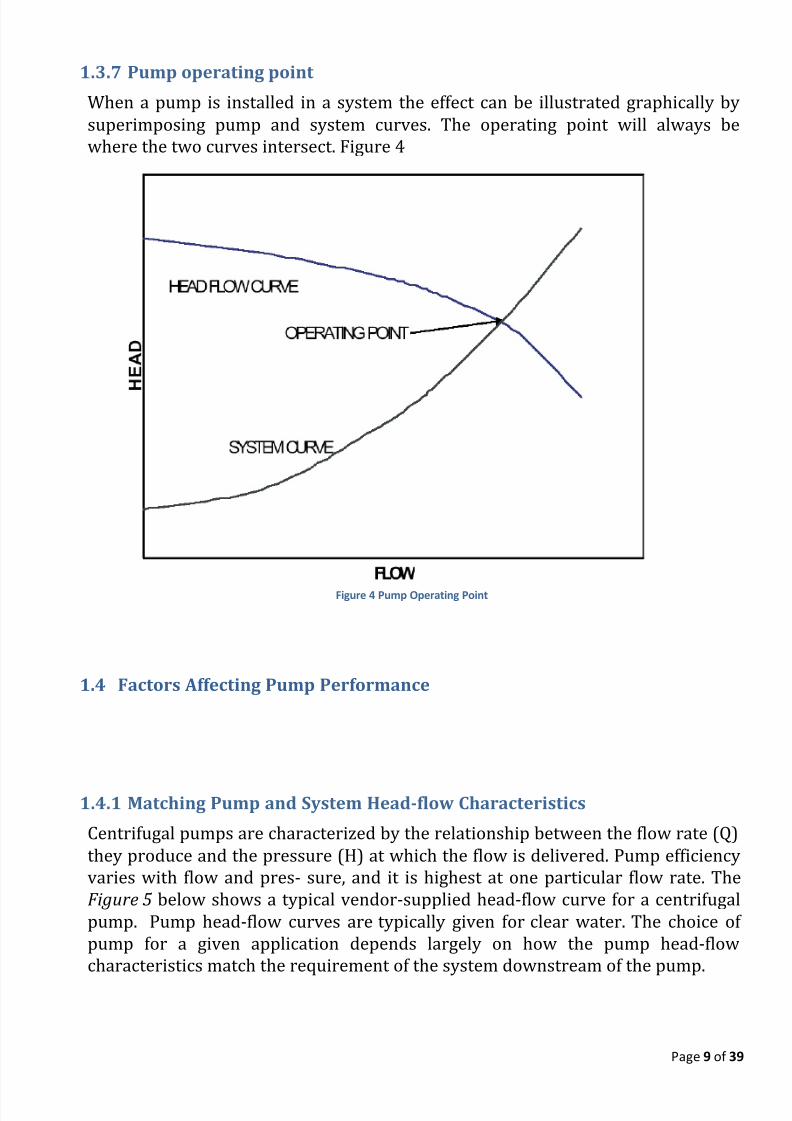
A pump is selected based on how well the pump curve and system head-flow
curves match. The pump operating point is identified as the point, where the
system curve crosses the pump curve when they are superimposed on each other.
The Figure shows the effect on system curve with throttling.
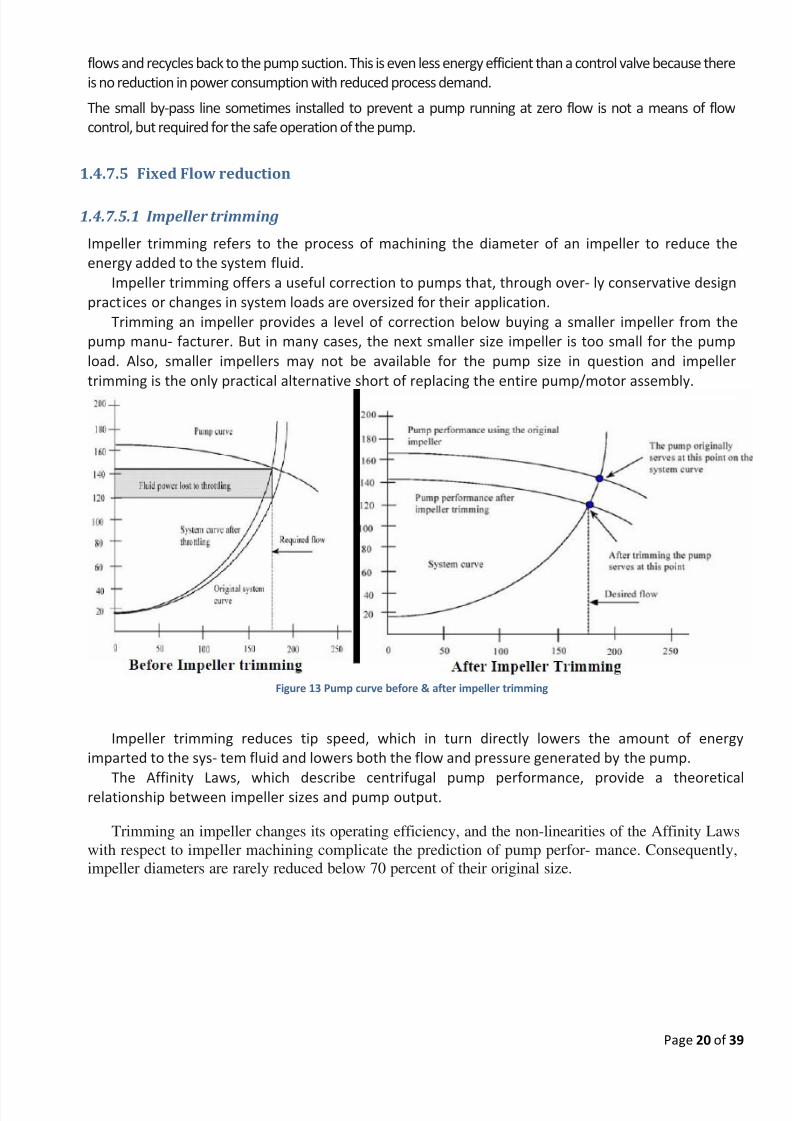
The speed of the pump can be reduced or the existing impeller can be trimmed (or
new lower size impeller). The blue pump curve represents either of these options.
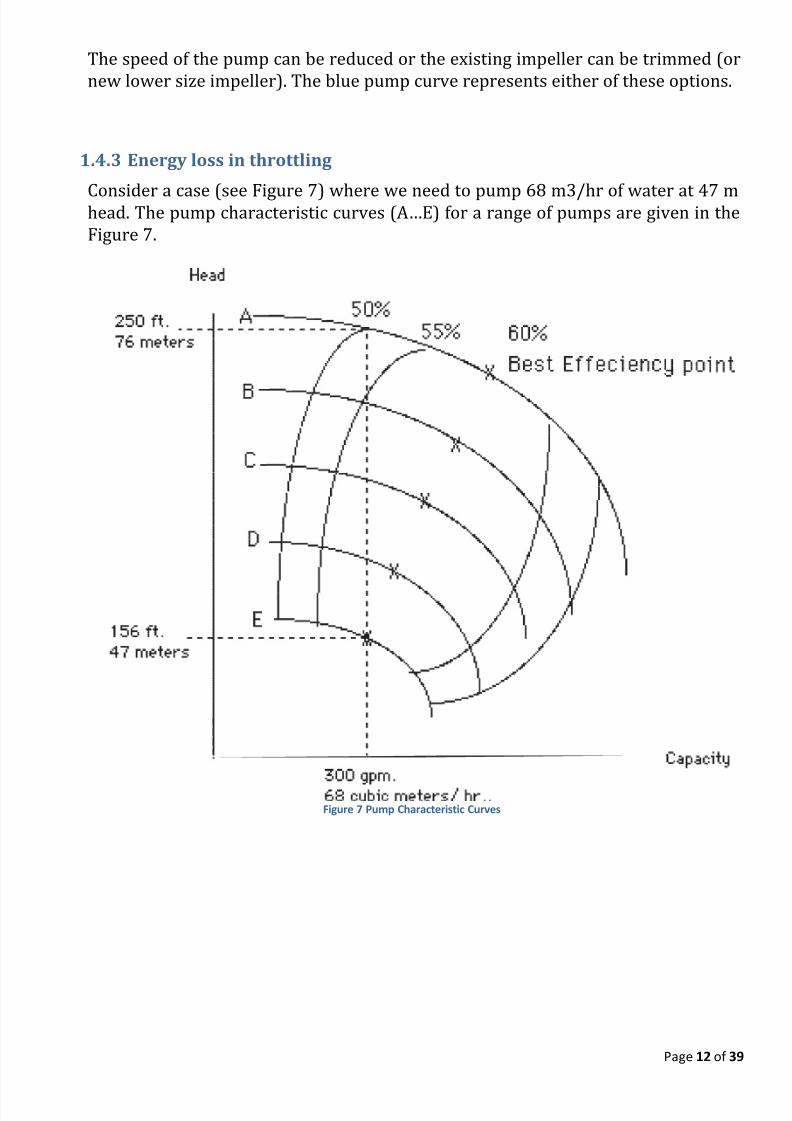
1.4.3 Energy loss in throttling
Consider a case (see Figure 7) where we need to pump 68 m3/hr of water at 47 mhead. The pump characteristic curves (A…E) for a range of pumps are given in the
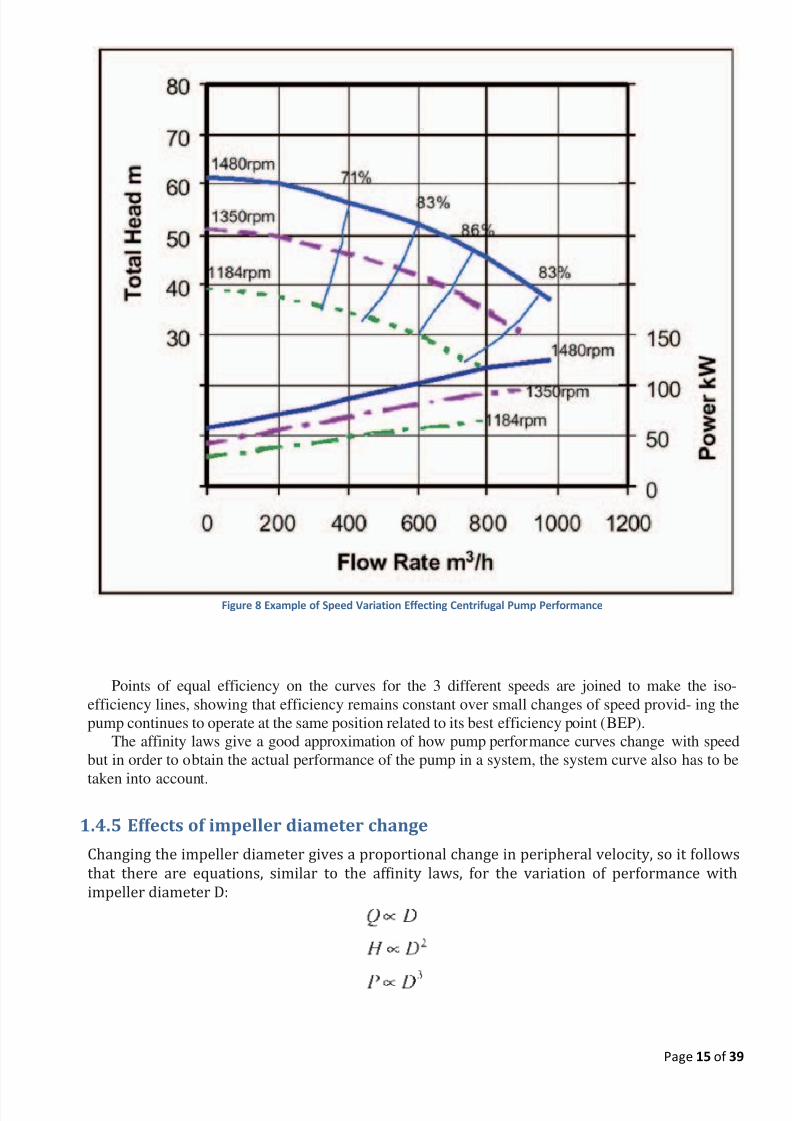
As stated above, a centrifugal pump is a dynamic device with the head generated
from a rotat- ing impeller. There is therefore a relationship between impeller
peripheral velocity and gener- ated head. Peripheral velocity is directly related toshaft rotational speed, for a fixed impeller diameter and so varying the rotational
speed has a direct effect on the performance of the pump. All the parameters
shown in fig 6.2 will change if the speed is varied and it is important to have an
appreciation of how these parameters vary in order to safely control a pump at
different speeds. The equations relating rotodynamic pump performance
parameters of flow, head and power absorbed, to speed are known as the Affinity
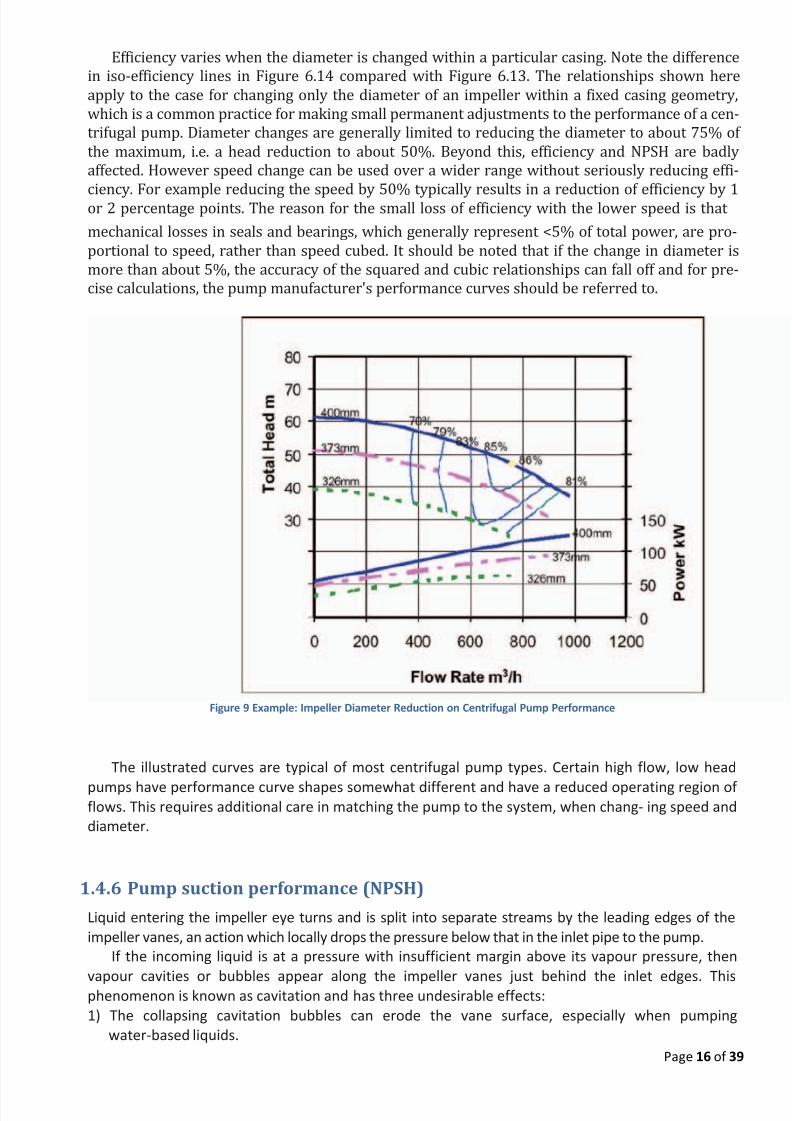
Efficiency varies when the diameter is changed within a particular casing. Note the difference
in iso-efficiency lines in Figure 6.14 compared with Figure 6.13. The relationships shown here
apply to the case for changing only the diameter of an impeller within a fixed casing geometry,
which is a common practice for making small permanent adjustments to the performance of a cen-
trifugal pump. Diameter changes are generally limited to reducing the diameter to about 75% of
the maximum, i.e. a head reduction to about 50%. Beyond this, efficiency and NPSH are badly
affected. However speed change can be used over a wider range without seriously reducing effi-
ciency. For example reducing the speed by 50% typically results in a reduction of efficiency by 1or 2 percentage points. The reason for the small loss of efficiency with the lower speed is that
mechanical losses in seals and bearings, which generally represent <5% of total power, are pro-
portional to speed, rather than speed cubed. It should be noted that if the change in diameter is
more than about 5%, the accuracy of the squared and cubic relationships can fall off and for pre-
cise calculations, the pump manufacturer's performance curves should be referred to.
Figure 9 Example: Impeller Diameter Reduction on Centrifugal Pump Performance
The illustrated curves are typical of most centrifugal pump types. Certain high flow, low head
pumps have performance curve shapes somewhat different and have a reduced operating region of flows. This requires additional care in matching the pump to the system, when chang- ing speed and
diameter.
1.4.6 Pump suction performance (NPSH)
Liquid entering the impeller eye turns and is split into separate streams by the leading edges of the
impeller vanes, an action which locally drops the pressure below that in the inlet pipe to the pump.
If the incoming liquid is at a pressure with insufficient margin above its vapour pressure, then
vapour cavities or bubbles appear along the impeller vanes just behind the inlet edges. Thisphenomenon is known as cavitation and has three undesirable effects:
1) The collapsing cavitation bubbles can erode the vane surface, especially when pumping
2) Noise and vibration are increased, with possible shortened seal and bearing life.
3) The cavity areas will initially partially choke the impeller passages and reduce the pump per-
formance. In extreme cases, total loss of pump developed head occurs.
The value, by which the pressure in the pump suction exceeds the liquid vapour pressure, is expressed as a head
of liquid and referred to as Net Positive Suction Head Available – (NPSHA). This is a charac- teristic of the system
design. The value of NPSH needed at the pump suction to prevent the pump from cavitating is known as NPSH
Required – (NPSHR). This is a characteristic of the pump design.
The three undesirable effects of cavitation described above begin at different values of NPSHAand generally there will be cavitation erosion before there is a noticeable loss of pump
head. However for a consistent approach, manufacturers and industry standards, usually define the
onset of cavitation as the value of NPSHR when there is a head drop of 3% compared with the head
with cavitation free performance. At this point cavitation is present and prolonged operation at this
point will usually lead to damage. It is usual therefore to apply a margin bywhich NPSHA should
exceed NPSHR.
As would be expected, the NPSHR increases as the flow through the pump increases, see fig In addition,
as flow increases in the suction pipework, friction losses also increase, giving a lower NPSHA at the
pump suction, both of which give a greater chance that cavitation will occur. NPSHR also varies
approximately with the square of speed in the same way as pump head and conversion of NPSHR fromone speed to another can be made using the following equations.
Q ∝ N
NPSHR ∝ N 2
It should be noted however that at very low speeds there is a minimum NPSHR plateau,
NPSHR does not tend to zero at zero speed It is therefore essential to carefully consider NPSH
in variable speed pumping.
1.4.7 Flow Control Strategies
1.4.7.1 Pumps in parallel switched to meet demand
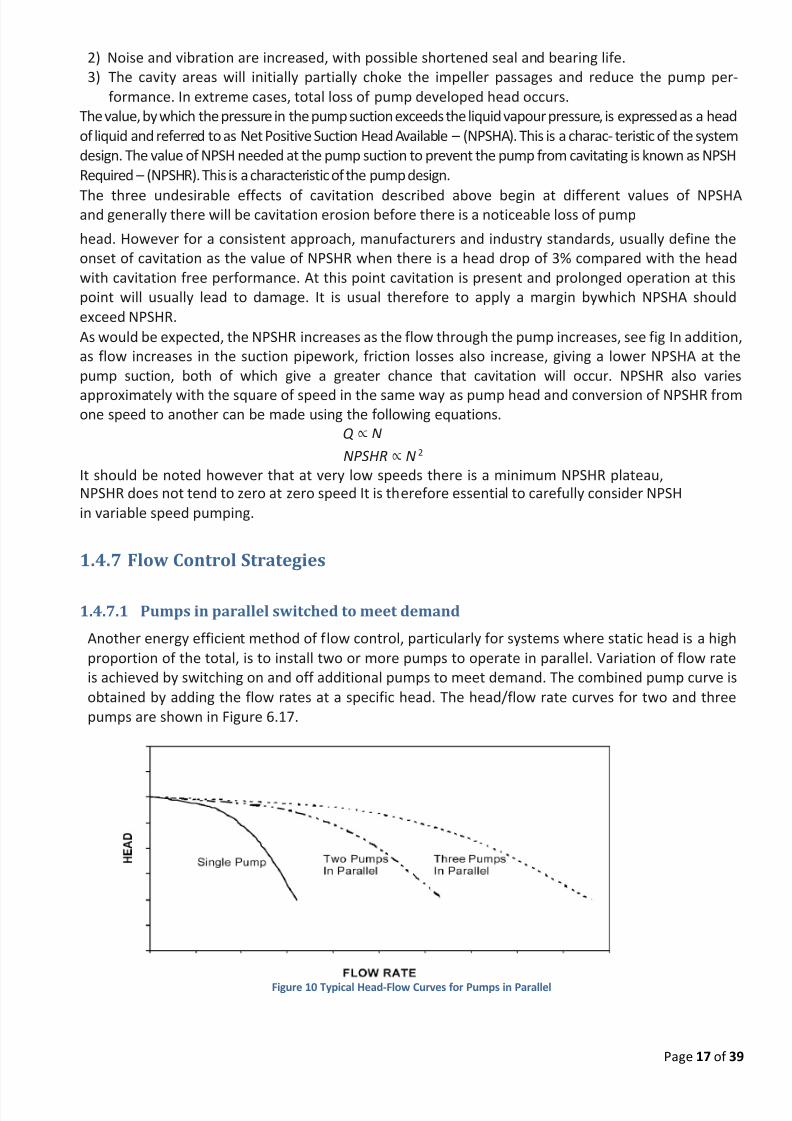
Another energy efficient method of flow control, particularly for systems where static head is a high
proportion of the total, is to install two or more pumps to operate in parallel. Variation of flow rate
is achieved by switching on and off additional pumps to meet demand. The combined pump curve is
obtained by adding the flow rates at a specific head. The head/flow rate curves for two and three
pumps are shown in Figure 6.17.
Figure 10 Typical Head-Flow Curves for Pumps in Parallel
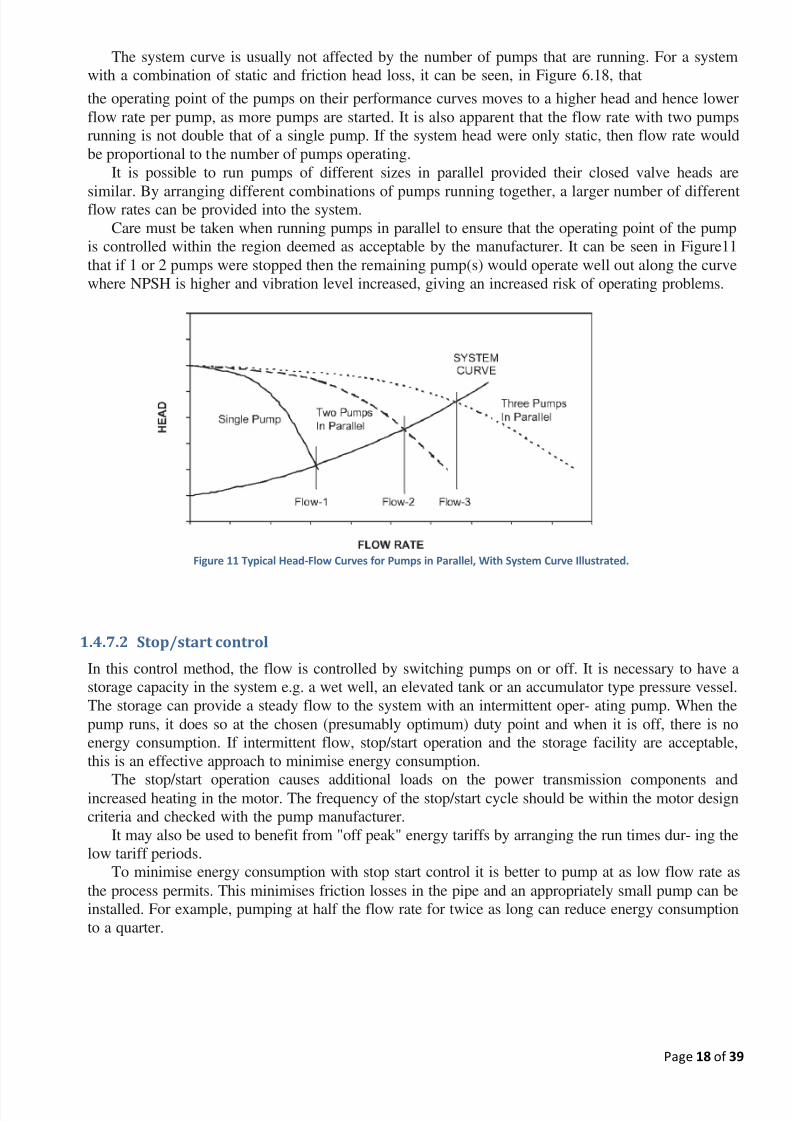
The system curve is usually not affected by the number of pumps that are running. For a system
with a combination of static and friction head loss, it can be seen, in Figure 6.18, that
the operating point of the pumps on their performance curves moves to a higher head and hence lower
flow rate per pump, as more pumps are started. It is also apparent that the flow rate with two pumps
running is not double that of a single pump. If the system head were only static, then flow rate would
be proportional to the number of pumps operating.
It is possible to run pumps of different sizes in parallel provided their closed valve heads are
similar. By arranging different combinations of pumps running together, a larger number of differentflow rates can be provided into the system.
Care must be taken when running pumps in parallel to ensure that the operating point of the pump
is controlled within the region deemed as acceptable by the manufacturer. It can be seen in Figure11
that if 1 or 2 pumps were stopped then the remaining pump(s) would operate well out along the curve
where NPSH is higher and vibration level increased, giving an increased risk of operating problems.
Figure 11 Typical Head-Flow Curves for Pumps in Parallel, With System Curve Illustrated.
1.4.7.2 Stop/start control
In this control method, the flow is controlled by switching pumps on or off. It is necessary to have a
storage capacity in the system e.g. a wet well, an elevated tank or an accumulator type pressure vessel.
The storage can provide a steady flow to the system with an intermittent oper- ating pump. When the
pump runs, it does so at the chosen (presumably optimum) duty point and when it is off, there is no
energy consumption. If intermittent flow, stop/start operation and the storage facility are acceptable,
this is an effective approach to minimise energy consumption.
The stop/start operation causes additional loads on the power transmission components andincreased heating in the motor. The frequency of the stop/start cycle should be within the motor design
criteria and checked with the pump manufacturer.
It may also be used to benefit from "off peak" energy tariffs by arranging the run times dur- ing the
low tariff periods.
To minimise energy consumption with stop start control it is better to pump at as low flow rate as
the process permits. This minimises friction losses in the pipe and an appropriately small pump can be
installed. For example, pumping at half the flow rate for twice as long can reduce energy consumption
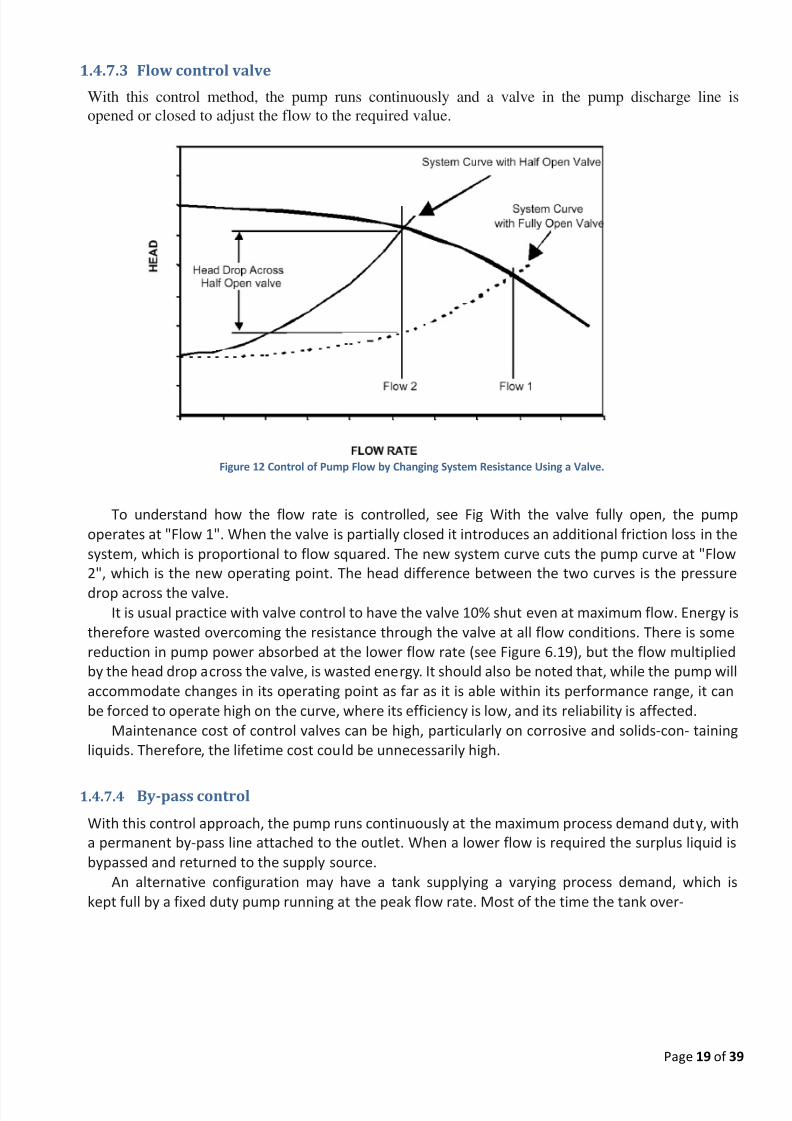
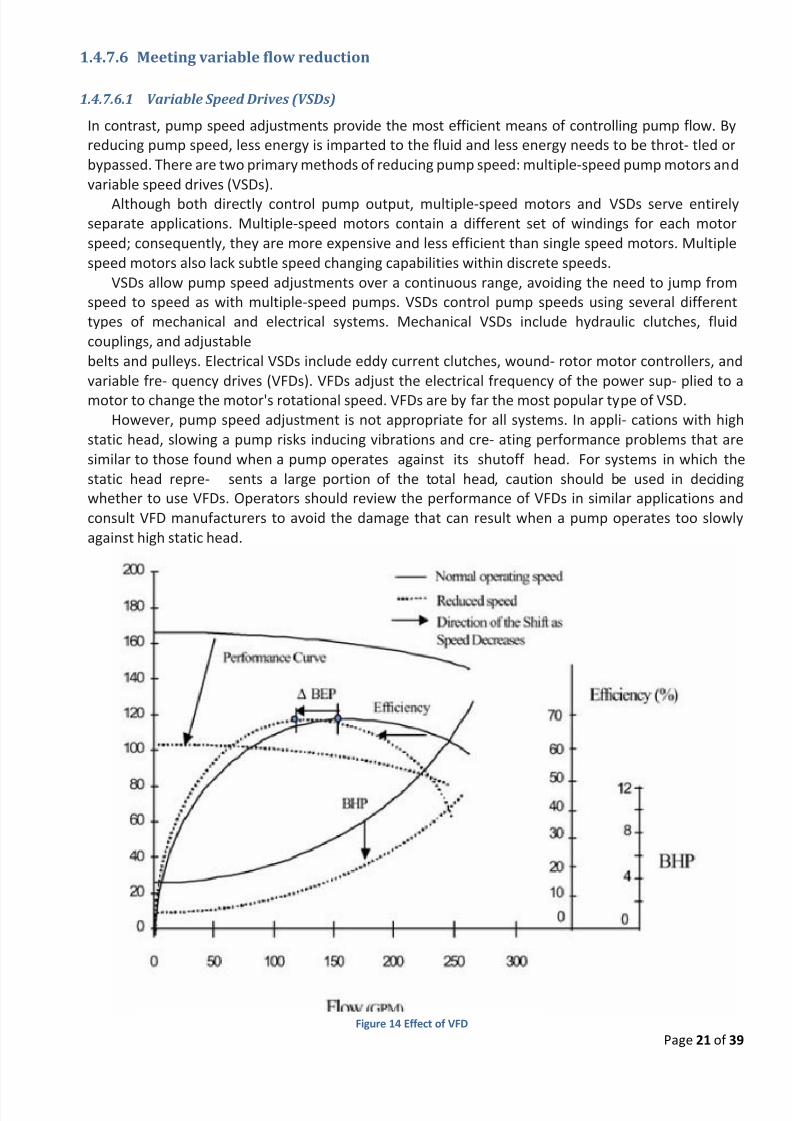
For many systems, VFDs offer a means to improve pump operating efficiency despite changes in
operating conditions. The effect of slowing pump speed on pump operation is illus- trated by the
three curves in Fig. When a VFD slows a pump, its head/flow and brake horsepower (BHP) curves
drop down and to the left and its efficiency curve shifts to the left. This efficiency response provides
an essential cost advantage; by keeping the operating effi- ciency as high as possible across
variations in the system's flow demand, the energy and main- tenance costs of the pump can be
significantly reduced.
VFDs may offer operating cost reductions by allowing higher pump operating efficiency, but theprincipal savings derive from the reduction in frictional or bypass flow losses. Using a system
perspective to identify areas in which fluid energy is dissipated in non-useful work often reveals
opportunities for operating cost reductions.
For example, in many systems, increasing flow through bypass lines does not noticeably impact
the backpressure on a pump. Consequently, in these applications pump efficiency does not
necessarily decline during periods of low flow demand. By analyzing the entire system, however, the
energy lost in pushing fluid through bypass lines and across throttle valves can be identified.
Another system benefit of VFDs is a soft start capability. During startup, most motors expe- rience
in-rush currents that are 5 – 6 times higher than normal operating currents. This high cur- rent fades
when the motor spins up to normal speed. VFDs allow the motor to be started with a lower startupcurrent (usually only about 1.5 times the normal operating current). This reduces wear on the motor
and its controller.
1.5 Energy Conservation Opportunities in Pumping Systems
Ensure adequate NPSH at site of installation
Ensure availability of basic instruments at pumps like pressure gauges, flow meters.
Operate pumps near best efficiency point. Modify pumping system and pumps losses to minimize throttling.
Adapt to wide load variation with variable speed drives or sequenced control of multiple
units.
Stop running multiple pumps - add an auto-start for an on-line spare or add a booster pump in
the problem area.
Use booster pumps for small loads requiring higher pressures.
Increase fluid temperature differentials to reduce pumping rates in case of heat
exchangers.
Repair seals and packing to minimize water loss by dripping.
Balance the system to minimize flows and reduce pump power requirements. Avoid pumping head with a free-fall return (gravity); Use siphon effect to advantage:
Conduct water balance to minimize water consumption
Avoid cooling water re-circulation in DG sets, air compressors, refrigeration systems,
cooling towers feed water pumps, condenser pumps and process pumps.
In multiple pump operations, carefully combine the operation of pumps to avoid throttling
Provide booster pump for few areas of higher head
Replace old pumps by energy efficient pumps
In the case of over designed pump, provide variable speed drive, or downsize / replace
impeller or replace with correct sized pump for efficient operation.
Optimise number of stages in multi-stage pump in case of head margins Reduce system resistance by pressure drop assessment and pipe size optimization
Effective pump maintenance allows industrial plants to keep pumps operating well, to detect
problems in time to schedule repairs, and to avoid early pump failures. Regular maintenance also
reveals deteriorations in efficiency and capacity, which can occur long before a pump fails.
The amount of attention given to maintenance depends on how important a system is to a plant’s
operations. Downtime can be expensive when it affects critical processes. Most maintenance activities
can be classified as either preventive or predictive. Preventive maintenance addresses routine system
needs such as lubrication, periodic adjustments, and removal of contaminants. Predictive maintenance
focuses on tests and inspections that detect deteriorating conditions.
Preventive Actions
Preventive maintenance activities include coupling alignment, lubrication, and seal maintenance and
replacement. Mechanical seals must be inspected periodically to ensure that either there is no leakage
or that leakage is within specifications. Mechanical seals that leak excessively usually must be
replaced. A certain amount of leakage is required, however, to lubricate and cool the packing seals.
But the packing gland needs to be adjusted if the leakage exceeds the manufacturer’s specifications.
The packing gland must be replaced if it has to be tightened excessively to control leakage. Over
tightening causes unnecessary wear on the shaft or its wear sleeve and increases electric power use.
Routine maintenance of pump motors, such as proper lubrication and cleaning, is also vital.
Predictive Actions
Predictive maintenance helps minimize unplanned equipment outages. Sometimes called “condition
assessment” or “condition monitoring,” it has become easier with modern testing methods and
equipment. The following methods apply to pumping systems:
Vibration analysis.
Trending vibration amplitude and frequency can detect an impending bearing failure. It can also reveal
voltage and mechanical imbalances that could be caused by impeller erosion or coupling problems.
Changes in vibration over time are more meaningful than a single “snapshot” of the vibration
spectrum.
Motor current signature analysis.
Sometimes called “dynamic analysis,” this reveals deteriorating insulation, rotor bar damage, electrical
system unbalance, and harmonics. It can also pick up system problems such as malfunctioning controlvalves that cause flow rate disturbances. Tracking the signature over time is more valuable than a
single snapshot.
Lubrication oil analysis.
This applies only to large, oil-lubricated pumps, and is an expensive procedure. Oil analysis can detect
bearing problems caused by metal particles or chemical changes that result from overheating, and seal
problems caused by pumped fluid in the oil. It also provides guidance on proper oil-change intervals.
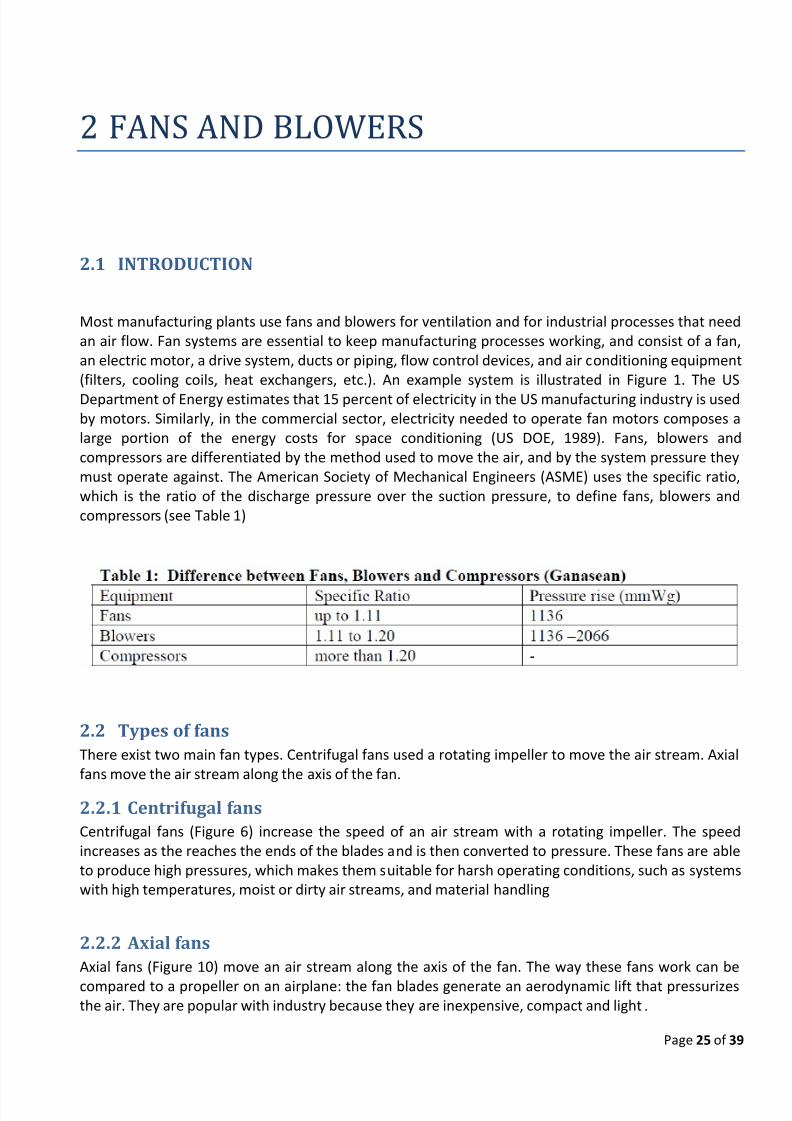
Most manufacturing plants use fans and blowers for ventilation and for industrial processes that need
an air flow. Fan systems are essential to keep manufacturing processes working, and consist of a fan,
an electric motor, a drive system, ducts or piping, flow control devices, and air conditioning equipment
(filters, cooling coils, heat exchangers, etc.). An example system is illustrated in Figure 1. The US
Department of Energy estimates that 15 percent of electricity in the US manufacturing industry is used
by motors. Similarly, in the commercial sector, electricity needed to operate fan motors composes a
large portion of the energy costs for space conditioning (US DOE, 1989). Fans, blowers and
compressors are differentiated by the method used to move the air, and by the system pressure they
must operate against. The American Society of Mechanical Engineers (ASME) uses the specific ratio,
which is the ratio of the discharge pressure over the suction pressure, to define fans, blowers and
compressors (see Table 1)
2.2 Types of fans
There exist two main fan types. Centrifugal fans used a rotating impeller to move the air stream. Axial
fans move the air stream along the axis of the fan.
2.2.1 Centrifugal fans
Centrifugal fans (Figure 6) increase the speed of an air stream with a rotating impeller. The speed
increases as the reaches the ends of the blades and is then converted to pressure. These fans are able
to produce high pressures, which makes them suitable for harsh operating conditions, such as systems
with high temperatures, moist or dirty air streams, and material handling
2.2.2 Axial fans
Axial fans (Figure 10) move an air stream along the axis of the fan. The way these fans work can be
compared to a propeller on an airplane: the fan blades generate an aerodynamic lift that pressurizesthe air. They are popular with industry because they are inexpensive, compact and light.
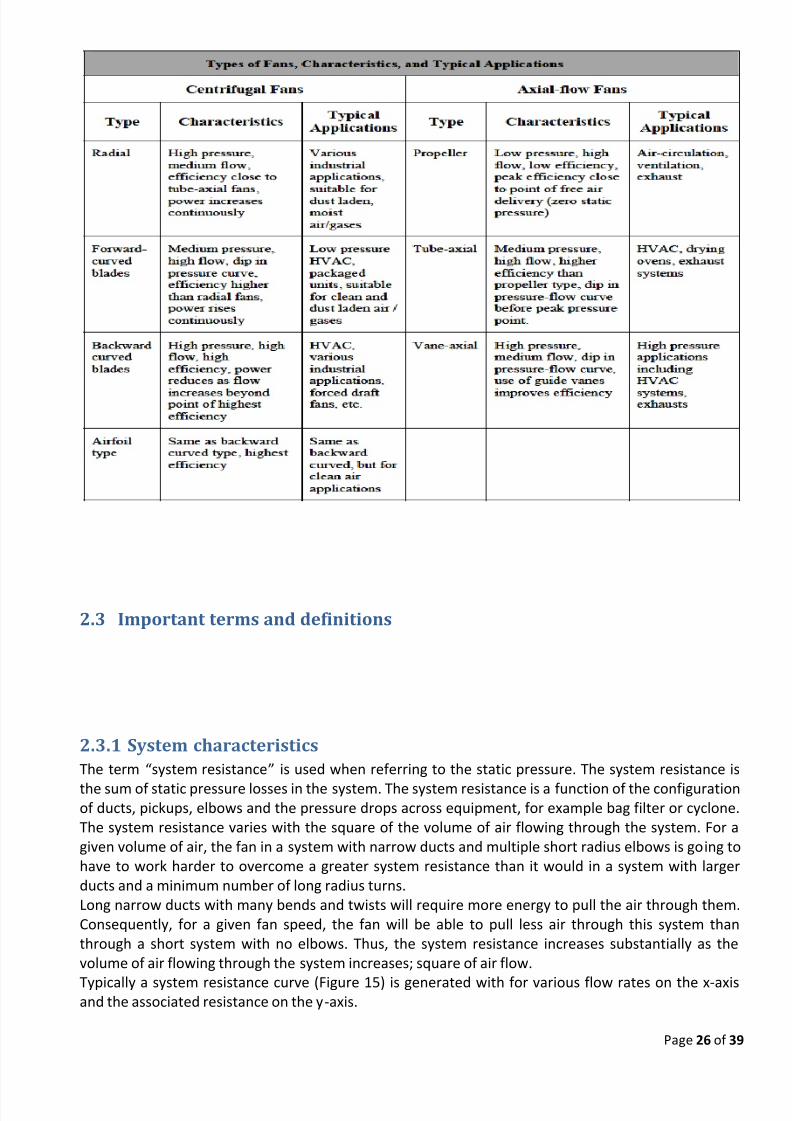
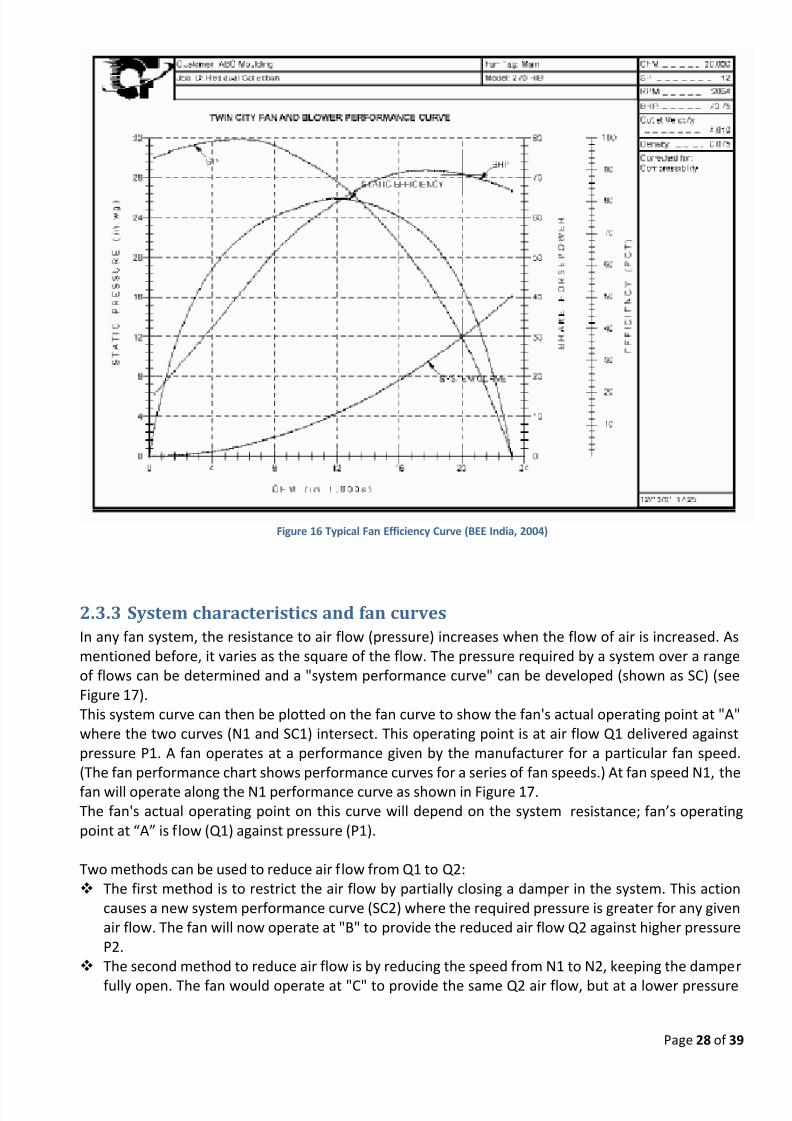
The term “system resistance” is used when referring to the static pressure. The system resistance is
the sum of static pressure losses in the system. The system resistance is a function of the configurationof ducts, pickups, elbows and the pressure drops across equipment, for example bag filter or cyclone.
The system resistance varies with the square of the volume of air flowing through the system. For a
given volume of air, the fan in a system with narrow ducts and multiple short radius elbows is going to
have to work harder to overcome a greater system resistance than it would in a system with larger
ducts and a minimum number of long radius turns.
Long narrow ducts with many bends and twists will require more energy to pull the air through them.
Consequently, for a given fan speed, the fan will be able to pull less air through this system than
through a short system with no elbows. Thus, the system resistance increases substantially as the
volume of air flowing through the system increases; square of air flow.
Typically a system resistance curve (Figure 15) is generated with for various flow rates on the x-axisand the associated resistance on the y-axis.
Figure 15 System Curve of a Fan and Effect of System Resistance (US DOE, 1989)
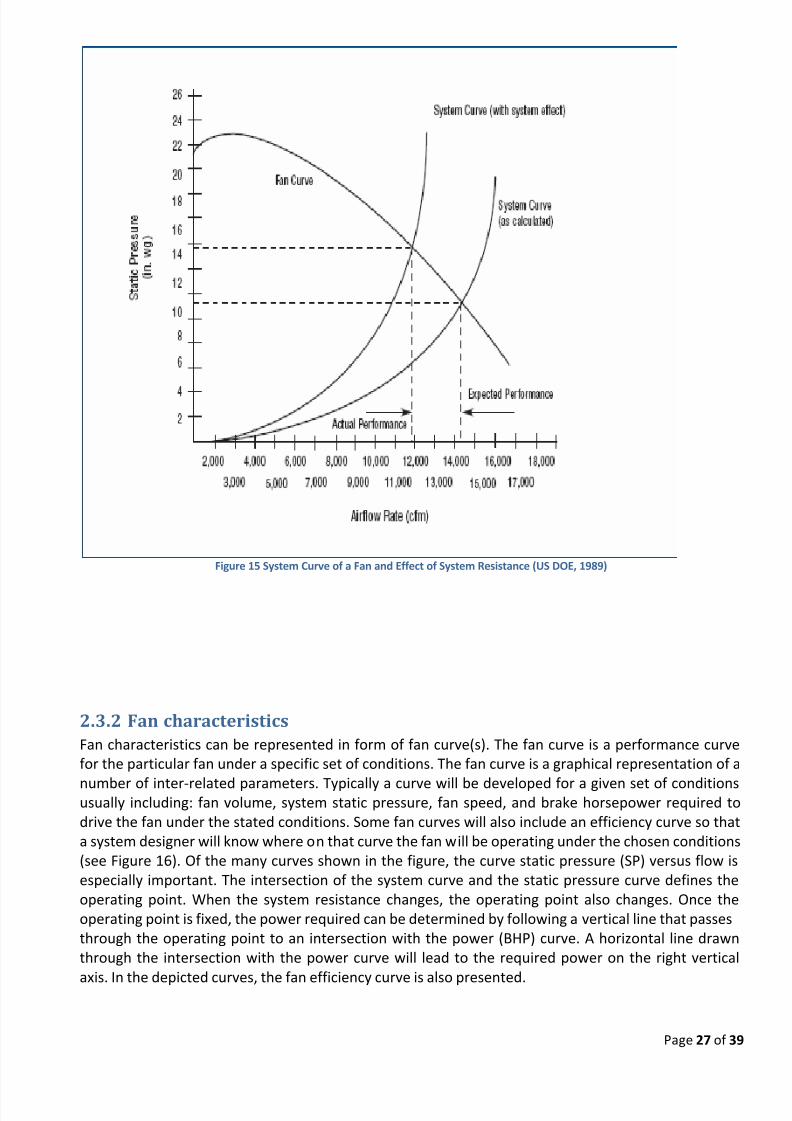
2.3.2 Fan characteristics
Fan characteristics can be represented in form of fan curve(s). The fan curve is a performance curve
for the particular fan under a specific set of conditions. The fan curve is a graphical representation of a
number of inter-related parameters. Typically a curve will be developed for a given set of conditionsusually including: fan volume, system static pressure, fan speed, and brake horsepower required to
drive the fan under the stated conditions. Some fan curves will also include an efficiency curve so that
a system designer will know where on that curve the fan will be operating under the chosen conditions
(see Figure 16). Of the many curves shown in the figure, the curve static pressure (SP) versus flow is
especially important. The intersection of the system curve and the static pressure curve defines the
operating point. When the system resistance changes, the operating point also changes. Once the
operating point is fixed, the power required can be determined by following a vertical line that passes
through the operating point to an intersection with the power (BHP) curve. A horizontal line drawn
through the intersection with the power curve will lead to the required power on the right vertical
axis. In the depicted curves, the fan efficiency curve is also presented.
The choice of safety margin affects the efficient operation of the fan. In all cases where the fan
requirement is linked to the process/other equipment, the safety margin is to be decided.
Based on the discussions with the process equipment supplier, In general, the safety margin can be 5
% over the maximum requirement on flow rate
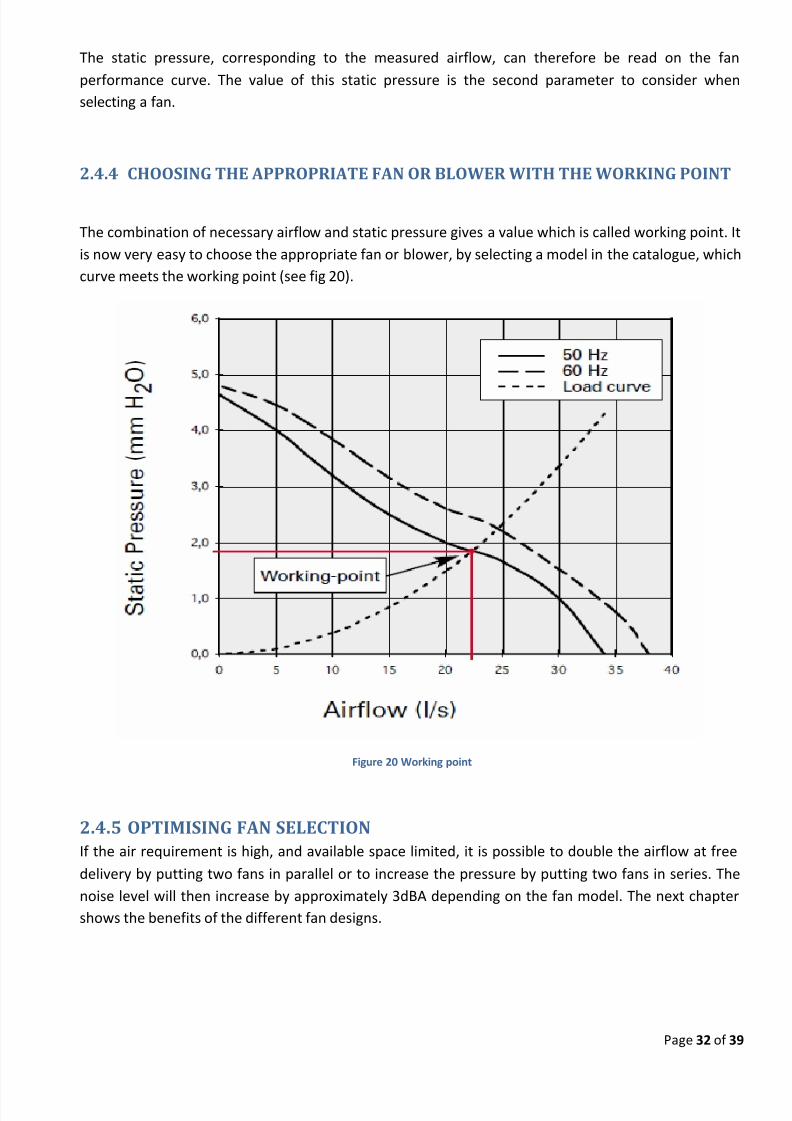
2.5 Fan and Blower Efficient System Operation
2.5.1 Installation of FanThe installation of fan and mechanical maintenance of the fan also plays a critical role in the efficiency of the
fan. The following clearances (typical values) should be maintained for the efficient operation of the impeller
2.5.1.1 Impeller Inlet Seal Clearances
• Axial overlap – 5 to 10 mm for 1 metre plus dia impeller
• Radial clearance – 1 to 2 mm for 1 metre plus dia impeller
• Back plate clearance – 20 to 30 mm for 1 metre plus dia impeller
• Labyrinth seal clearance – 0.5 to 1.5 mm
The inlet damper positioning is also to be checked regularly so that the "full open" and "full close"
conditions are satisfied. The fan user should get all the details of the mechanical clearances from the
supplier at the time of installation. As these should be strictly adhered to, for efficient operation of thefan, and a checklist should be prepared on these clearances. A check on these clearances should be
done after every maintenance, so that efficient operation of the fan is ensured on a continuous basis.
2.5.1.2 System Resistance Change
The system resistance has a major role in determining the performance and efficiency of a fan. The
system resistance also changes depending on the process. For example, the formation of the coatings
/ erosion of the lining in the ducts, changes the system resistance marginally. In some cases, the
change of equipment (e.g. Replacement of Multi-cyclones with ESP / Installation of low pressure drop
cyclones in cement industry) duct modifications, drastically shift the operating point, resulting in lower
efficiency. In such cases, to maintain the efficiency as before, the fan has to be changed.
Hence, the system resistance has to be periodically checked, more so when modifications are
introduced and action taken accordingly, for efficient operation of the fan.
2.5.2 Flow Control Strategies
Typically, once a fan system is designed and installed, the fan operates at a constant speed. There may
be occasions when a speed change is desirable, i.e., when adding a new run of duct that requires an
increase in air flow (volume) through the fan. There are also instances when the fan is oversized and
Various ways to achieve change in flow are: pulley change, damper control, inlet guide vane control,
variable speed drive and series and parallel operation of fans.
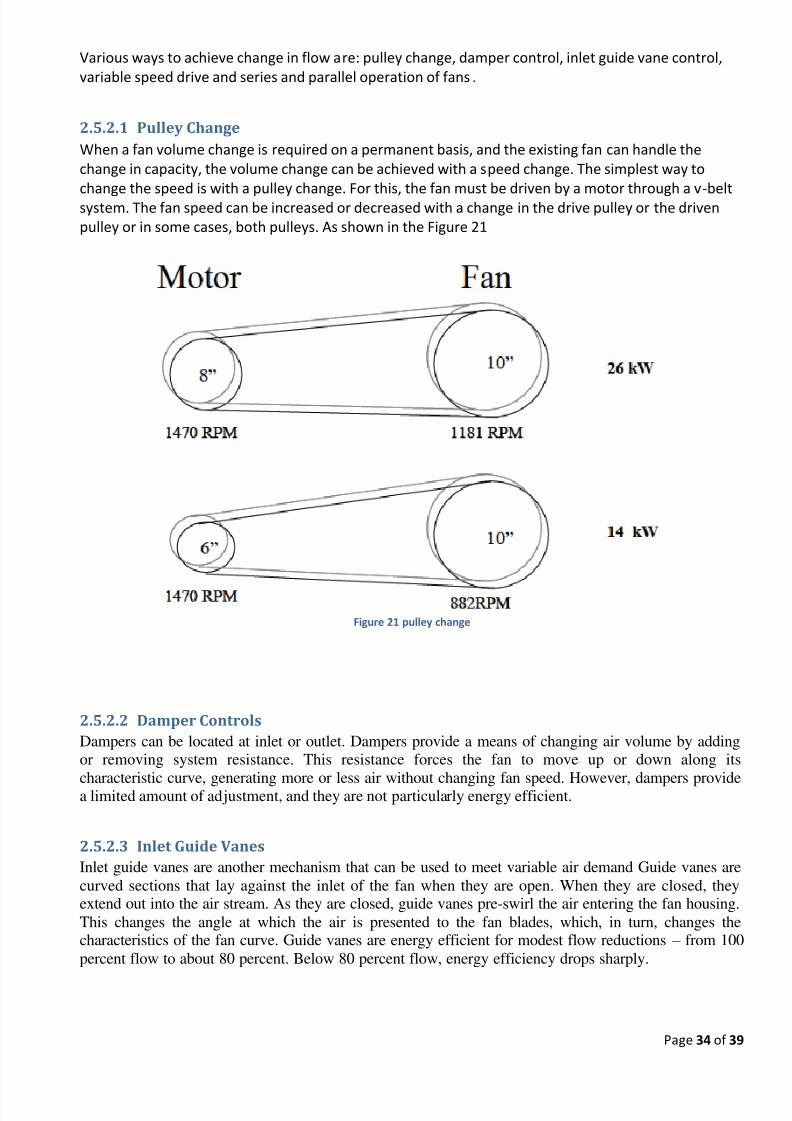
2.5.2.1 Pulley Change
When a fan volume change is required on a permanent basis, and the existing fan can handle the
change in capacity, the volume change can be achieved with a speed change. The simplest way to
change the speed is with a pulley change. For this, the fan must be driven by a motor through a v-belt
system. The fan speed can be increased or decreased with a change in the drive pulley or the driven
pulley or in some cases, both pulleys. As shown in the Figure 21
Figure 21 pulley change
2.5.2.2 Damper Controls
Dampers can be located at inlet or outlet. Dampers provide a means of changing air volume by adding
or removing system resistance. This resistance forces the fan to move up or down along its
characteristic curve, generating more or less air without changing fan speed. However, dampers provide
a limited amount of adjustment, and they are not particularly energy efficient.
2.5.2.3 Inlet Guide Vanes
Inlet guide vanes are another mechanism that can be used to meet variable air demand Guide vanes are
curved sections that lay against the inlet of the fan when they are open. When they are closed, theyextend out into the air stream. As they are closed, guide vanes pre-swirl the air entering the fan housing.
This changes the angle at which the air is presented to the fan blades, which, in turn, changes thecharacteristics of the fan curve. Guide vanes are energy efficient for modest flow reductions – from 100
percent flow to about 80 percent. Below 80 percent flow, energy efficiency drops sharply.
Variable speed drives provide almost infinite variability in speed control. Variable speed operation
involves reducing the speed of the fan to meet reduced flow requirements. Fan performance can bepredicted at different speeds using the fan laws. Since power input to the fan changes as the cube of the
flow, this will usually be the most efficient form of capacity control. However, variable speed controlmay not be economical for systems, which have infrequent flow variations. When considering variable
speed drive, the efficiency of the control system (fluid coupling, eddy-current, VFD, etc.) should be
accounted for, in the analysis of power consumption.
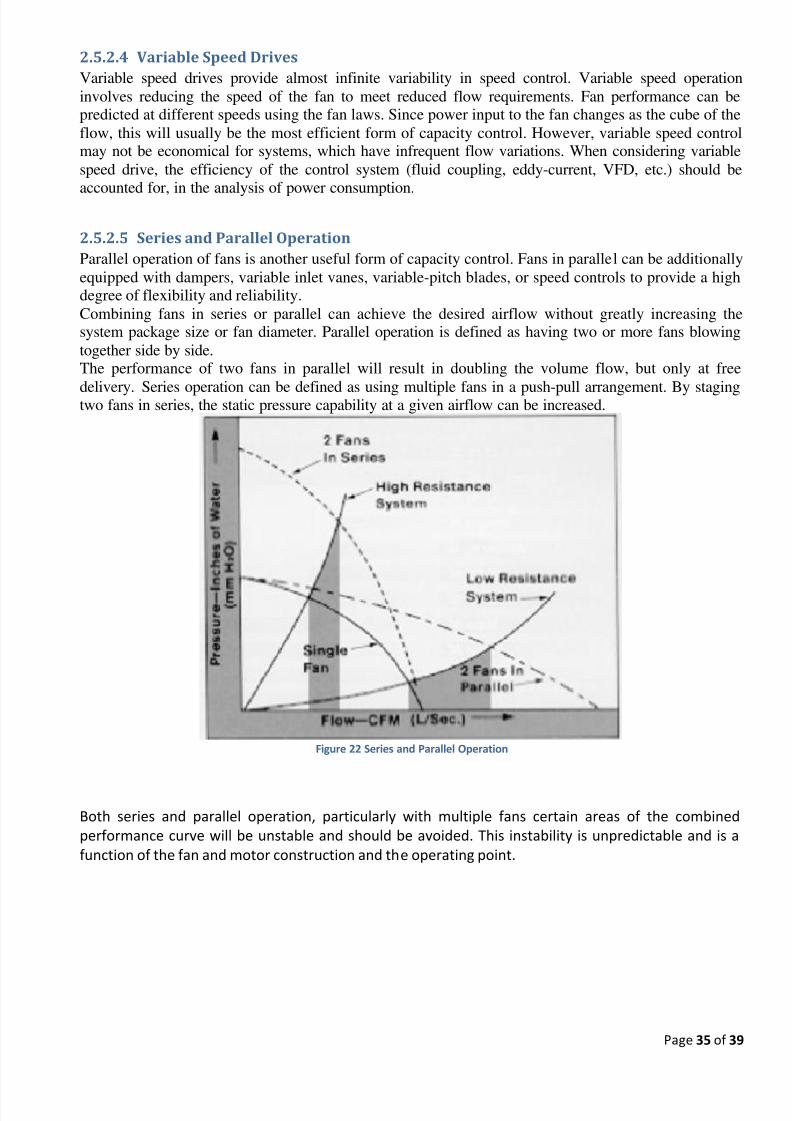
2.5.2.5 Series and Parallel Operation
Parallel operation of fans is another useful form of capacity control. Fans in parallel can be additionally
equipped with dampers, variable inlet vanes, variable-pitch blades, or speed controls to provide a highdegree of flexibility and reliability.
Combining fans in series or parallel can achieve the desired airflow without greatly increasing thesystem package size or fan diameter. Parallel operation is defined as having two or more fans blowing
together side by side.The performance of two fans in parallel will result in doubling the volume flow, but only at free
delivery. Series operation can be defined as using multiple fans in a push-pull arrangement. By stagingtwo fans in series, the static pressure capability at a given airflow can be increased.
Figure 22 Series and Parallel Operation
Both series and parallel operation, particularly with multiple fans certain areas of the combined
performance curve will be unstable and should be avoided. This instability is unpredictable and is a
function of the fan and motor construction and the operating point.
PUMPS AND PUMPING SYSTEM: Bureau of Energy Efficiency
PUMPS: SELECTION & TROUBLE SHOOTING Prof B V Babu Assistant Dean – ESD & GroupLeader (Head) - Chemical Engineering Birla Institute of Technology and Science
Improving Pumping System Performance: A Sourcebook for Industry: U.S. Department of Energy’s
Industrial Technologies Program (ITP) and the Hydraulic Institute (HI)
Application guide - Using variable speed drives (VSDs) in pump applications: ABB Drives
PUMP SELECTION CRITERIA : Armstrong Pumps Limited
PUMPS AND PUMPING SYSTEM: ENERGY CONSERVATION OPPORTUNITIES:
SHITANSHU PANDEY, MUSANGO LUNGU [ DEPARTMENT OF MECHANICAL ENGINEERING
MNIT, Jaipur]
FANS AND BLOWERS: Bureau of Energy Efficiency
Technical guide- SELECTING A FAN : ETRI Fans www.etrinet.com
Electrical Energy Equipment: Fans and Blowers- Energy Efficiency Guide for Industry in Aisa –
www.energyefficiencyasia.org
Fluidic and Microfluidic Pumps, Micropumps, Compressors, Fans and Blowers an Overview: