32
PUNJAB COMPETITIVENESS REPORT

PUNJAB COMPETITIVENESS REPORT

PUNJAB COMPETITIVENESS REPORT i
CONTENTS
2 COMPETITIVENESS AND THE ROLE OF PROVINCIAL GOVERNMENTS 2
2.1. Pakistan’s Ranking in Competitiveness 2
2.2. Competitiveness and Role of Provincial Governments 3
3 RELATIVE COMPETITIVENESS OF PUNJAB 4
3.1. Comparative Indicators by Province 4
3.2. The Economic Base of Punjab 7
4 PROCESS OF ADP ALLOCATIONS 8
4.1. Development Expenditure 8
4.2. Annual Development Plan 8
4.3. Development Planning Process 9
4.4. Approval of Annual Development Program 10
4.5. Execution of schemes 12
5 SIZE AND COMPOSITION OF ADP 15
5.1. Size and Financing of ADP 15 5.2. Sectoral Priorities 20
5.3. Medium Term Development Framework 24
6 ALTERNATIVE INSTRUMENTS FOR DEVELOPMENT PROGRAMMING 25
6.1. Punjab Development Fund 25
6.2. Private Financing of Infrastructure 25
6.3. Scope for PPPs 27
PUNJAB COMPETITIVENESS REPORT ii
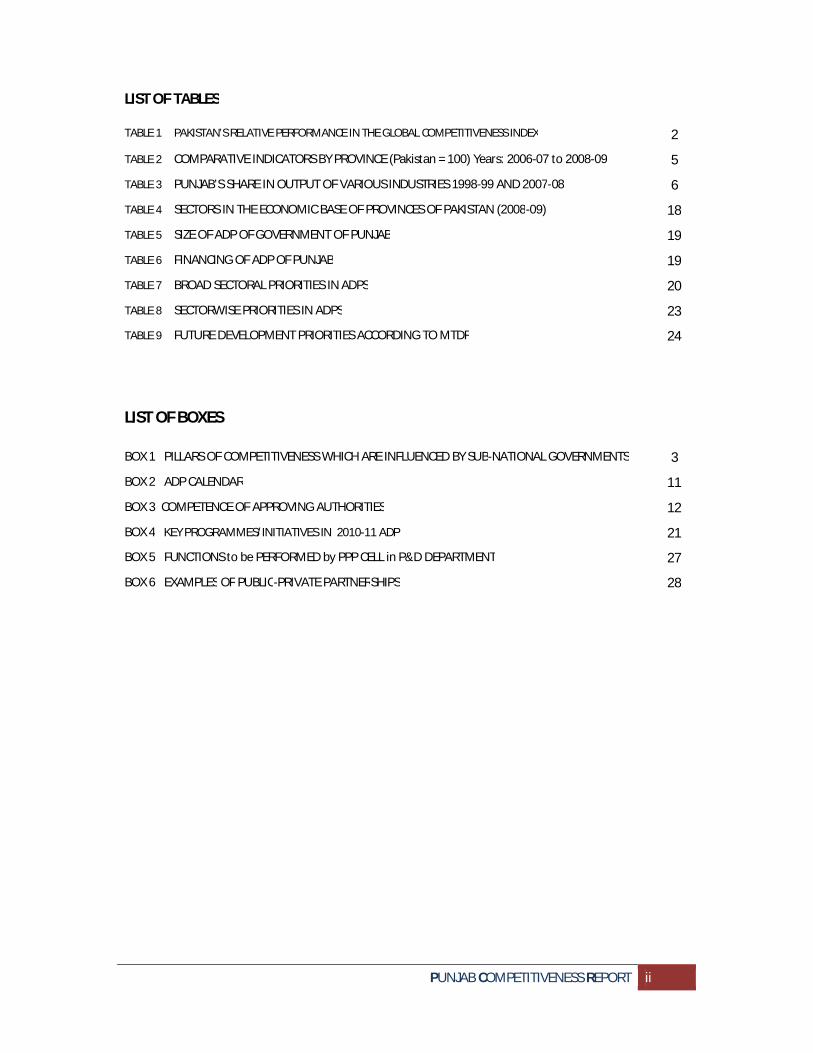
LIST OF TABLES TABLE 1 PAKISTAN’S RELATIVE PERFORMANCE IN THE GLOBAL COMPETITIVENESS INDEX 2
TABLE 2 COMPARATIVE INDICATORS BY PROVINCE (Pakistan = 100) Years: 2006-07 to 2008-09 5
TABLE 3 PUNJAB’S SHARE IN OUTPUT OF VARIOUS INDUSTRIES 1998-99 AND 2007-08 6
TABLE 4 SECTORS IN THE ECONOMIC BASE OF PROVINCES OF PAKISTAN (2008-09) 18
TABLE 5 SIZE OF ADP OF GOVERNMENT OF PUNJAB 19
TABLE 6 FINANCING OF ADP OF PUNJAB 19
TABLE 7 BROAD SECTORAL PRIORITIES IN ADPS 20
TABLE 8 SECTORWISE PRIORITIES IN ADPS 23
TABLE 9 FUTURE DEVELOPMENT PRIORITIES ACCORDING TO MTDF 24
LIST OF BOXES BOX 1 PILLARS OF COMPETITIVENESS WHICH ARE INFLUENCED BY SUB-NATIONAL GOVERNMENTS 3
BOX 2 ADP CALENDAR 11
BOX 3 COMPETENCE OF APPROVING AUTHORITIES 12
BOX 4 KEY PROGRAMMES/INITIATIVES IN 2010-11 ADP 21
BOX 5 FUNCTIONS to be PERFORMED by PPP CELL in P&D DEPARTMENT 27
BOX 6 EXAMPLES OF PUBLIC-PRIVATE PARTNERSHIPS 28

PUNJAB COMPETITIVENESS REPORT iii
ACRONYMS ADP Annual Development Program AIK Agricultural Income Tax
B.E Budget Estimate
BM-12 Budget Manual - 12
BOT Build, Operate and Transfer
CSR Composite Schedule Rate
DLI Development Linked Indicators
ECNEC Executive Committee of National Economic Council
EPC Engage, Procure and Construct
FBR Federal Board of Revenue
GDP Gross Domestic Product
GST General Sales Tax
IAA Infrastructure Authority Act
ICT Information and Communications technology
IT Information Technology
LCC Local Canal command
LRR Lahore Ring Road
MCA Model Concession Agreement
MDGS Millennium Development Goals
MICS Multiple Indicators Cluster Survey
MPA Member of Provincial Assembly MRS Market Rate System MTDF Medium term Development Framework
NFC National Finance Commission
P&D Planning and Development
PC Proforma
PDF Punjab Development Fund
PDWP Provincial Development Working Party
PMDGP Punjab MDGs Programme
PPP Public-Private Partnership
PRSP Poverty Reduction Strategy Paper
R.E Revised Estimate
SEZ Special Enterprise Zone
SME Small and medium enterprise
TEVTA/C Technical Education and Vocational Training Authority/ Center
TMA Tehsil Municipal Administration
TV Television
VAT Value Added Tax

PUNJAB COMPETITIVENESS REPORT 1
PUNJAB COMPETITIVENESS REPORT
There is increasing recognition of the role played by competitiveness in influencing the sustainable
rate of growth of a country/region. Competitiveness has been defined as “the ability to produce
goods and services which meet the test of international/domestic markets and generate relatively
high income and employment levels.”1 The focus of this report is on the role of sub-national
governments (provincial and local governments) in determining the level of competitiveness of a
region (in this case, the province of Punjab) within a country (Pakistan).
The report is organised as follows: Section 2 identifies the ranking of Pakistan in the Global
Competitiveness Index of the World Economic Forum and the particular pillars of competitiveness in
which the country does poorly. Based on a description of the role played by sub-national
governments in different pillars of competitiveness an assessment is made of the extent of
contribution that the provincial Government of Punjab can make to enhancing the overall level of
competitiveness of the region.
Section 3 presents the magnitude of different development indicators for the four provinces of
Pakistan. This enables an identification of the relative strengths and weaknesses of Punjab. This is
followed by quantification of employment ‘location quotients’ by economic sector to determine the
economic base of Punjab. The results are somewhat contrary to expectations.
Section 4 describes the existing process followed within the Government of Punjab for
determination of both sectoral and individual project/programme allocations within the ADP.
Proposals are formulated for greater involvement of other stakeholders, especially representatives
of the private sector, academia and civil society, in the determination of development priorities and
allocations.
Section 5 focuses on the development programme of the Government of Punjab. The trends in size,
financing and sectoral composition are highlighted. Key elements of the Medium Term Development
Framework (MTDF) upto 2012-13 are also presented. An assessment is made as to whether
development activity at the sub-national level in Punjab effectively addresses key issues of
competitiveness, identified in earlier sections.
Finally, in Section 6, there is a discussion on alternative instruments for development programming.
In particular, the pros and cons of an independent Punjab Development Fund with collaboration
from donors and the private sector are enumerated. This is followed by a more general statement of
the constraints to private financing of infrastructure in Pakistan currently. Proposals are then
presented for promoting public-private partnerships (PPPs) in Punjab in promising areas.
1 Taken mostly from the Global Competitiveness Report, 2009

PUNJAB COMPETITIVENESS REPORT 2
2. COMPETITIVENESS AND THE ROLE OF PROVINCIAL GOVERNMENTS 2.1. Pakistan’s Ranking in Competitiveness We first determine Pakistan’s relative performance in the Global Competitiveness Index of the
World Economic Forum by comparison in different pillars of competitiveness with other countries of
South Asia like Bangladesh, Sri Lanka and India and selected countries in East Asia like China,
Malaysia and Thailand who have done well and/or are competitors of Pakistan in export markets.
Among the seven countries, Pakistan has the lowest ranking alongwith Bangladesh, as shown in
Table 1. On the basis of the ratio of the index value for Pakistan to the average for the selected
countries, we determine in which pillars Pakistan performs well and in which it performs poorly. The
former include market size, financial market sophistication and goods market efficiency. The poorest
performance is observed in four pillars – higher education and training, health and primary
education, infrastructure and institutions.
TABLE 1 PAKISTAN’S RELATIVE PERFORMANCE IN THE GLOBAL COMPETITIVENESS INDEX
[Score (1– 7)]*
Pillar Country Ratio of Pakistan to
Average Pakistan Bangladesh India Sri Lanka China Malaysia Thailand
1. Institutions 3.3 3.1 4.2 3.8 4.4 4.5 4.0 0.825 2. Infrastructure 3.1 2.4 3.5 3.9 4.3 5.0 4.6 0.816 3. Macroeconomic
Stability 3.8 4.4 4.2 2.8 5.9 5.0 5.4 0.844
4. Health and Primary Education
3.9 4.5 4.8 5.7 5.7 5.9 5.5 0.765
5. Higher Education and Training
2.9 2.8 4.0 4.0 4.1 4.5 4.3 0.763
6. Goods Market Efficiency
4.0 3.8 4.4 4.5 4.5 4.8 4.5 0.917
7. Labor Market Efficiency
3.5 3.9 4.2 3.9 4.7 4.7 4.8 0.825
8. Financial Market Sophistication
4.2 4.2 5.1 4.2 4.1 5.4 4.5 0.929
9. Technological Readiness
2.9 2.4 3.3 3.3 3.4 4.5 3.7 0.863
10. Market Size 4.7 4.3 6.1 3.8 6.6 4.7 5.0 0.934 11. Business
Sophistication 3.8 3.5 4.8 4.5 4.5 4.8 4.4 0.877
12. Innovation 3.0 2.5 3.7 3.4 3.9 4.1 3.3 0.880 Overall 3.6 3.6 4.3 4.0 4.7 4.9 4.6 0.849
*Higher score means more competitiveness. ⇒ Biggest gaps in health and primary education; higher education and training; and infrastructure and institutions. Source: World Economic Forum
PUNJAB COMPETITIVENESS REPORT 3
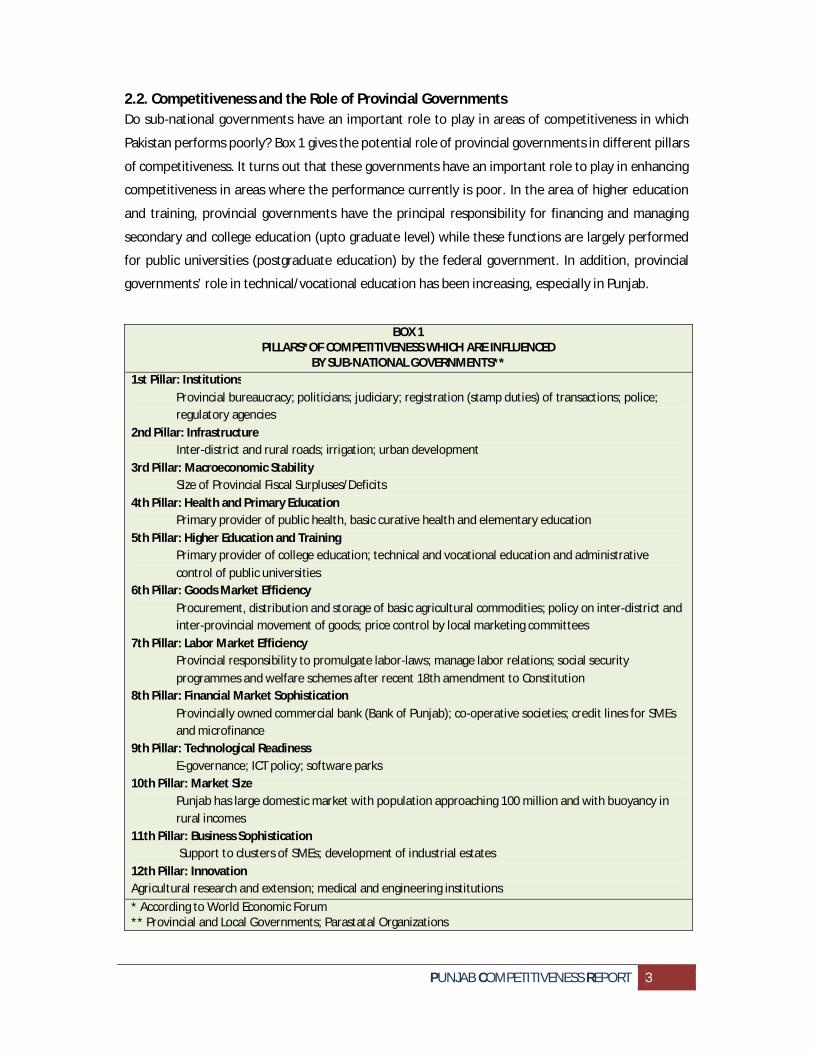
2.2. Competitiveness and the Role of Provincial Governments Do sub-national governments have an important role to play in areas of competitiveness in which
Pakistan performs poorly? Box 1 gives the potential role of provincial governments in different pillars
of competitiveness. It turns out that these governments have an important role to play in enhancing
competitiveness in areas where the performance currently is poor. In the area of higher education
and training, provincial governments have the principal responsibility for financing and managing
secondary and college education (upto graduate level) while these functions are largely performed
for public universities (postgraduate education) by the federal government. In addition, provincial
governments’ role in technical/vocational education has been increasing, especially in Punjab.
BOX 1 PILLARS*OF COMPETITIVENESS WHICH ARE INFLUENCED
BY SUB-NATIONAL GOVERNMENTS** 1st Pillar: Institutions
Provincial bureaucracy; politicians; judiciary; registration (stamp duties) of transactions; police; regulatory agencies
2nd Pillar: Infrastructure Inter-district and rural roads; irrigation; urban development
3rd Pillar: Macroeconomic Stability Size of Provincial Fiscal Surpluses/Deficits
4th Pillar: Health and Primary Education Primary provider of public health, basic curative health and elementary education
5th Pillar: Higher Education and Training Primary provider of college education; technical and vocational education and administrative control of public universities
6th Pillar: Goods Market Efficiency Procurement, distribution and storage of basic agricultural commodities; policy on inter-district and inter-provincial movement of goods; price control by local marketing committees
7th Pillar: Labor Market Efficiency Provincial responsibility to promulgate labor-laws; manage labor relations; social security programmes and welfare schemes after recent 18th amendment to Constitution
8th Pillar: Financial Market Sophistication Provincially owned commercial bank (Bank of Punjab); co-operative societies; credit lines for SMEs and microfinance
9th Pillar: Technological Readiness E-governance; ICT policy; software parks
10th Pillar: Market Size Punjab has large domestic market with population approaching 100 million and with buoyancy in rural incomes
11th Pillar: Business Sophistication Support to clusters of SMEs; development of industrial estates
12th Pillar: Innovation Agricultural research and extension; medical and engineering institutions * According to World Economic Forum ** Provincial and Local Governments; Parastatal Organizations

PUNJAB COMPETITIVENESS REPORT 4
Health (especially public health) and primary education are the principal responsibility of
provincial/local governments, although the private sector is making an increasing contribution in this
area. Pakistan is characterised by extremely low indicators of literacy, school enrolments, infant and
maternal mortality implying the need for higher priority to the basic social sectors.
Development of infrastructure is a shared responsibility among all levels of government. The federal
government has the primary role in development of trunk infrastructure like major highways; large
dams; power generation; gas exploration, extraction and distribution; and telecommunications.
Provincial/local governments also play an important role in promoting economic activity through
provision and maintenance of infrastructure like irrigation, inter-district highways and farm-to-
market roads, urban municipal services like water supply, sanitation, etc.
The role of provincial/local bureaucracy, politicians, judiciary, police and regulatory agencies is vital
from the viewpoint of cost of doing business for private establishments. Therefore, the contribution
of provincial governments to improving the business environment without incurring major
expenditures via institutions, the first pillar of competitiveness, can be enhanced by effectiveness of
sub-national institutions in terms of reduction in transactions costs (including bribes), streamlining of
approval and other processes, improved functioning of rule of law (especially with regard to
enforcement of contracts and property registration), greater transparency and heightened security
and better maintenance of law and order.
Overall, we have the conclusion that in pillars of competitiveness in which Pakistan performs poorly,
sub-national governments have a key role and there is need for such governments to focus more
their policies and actions on augmenting the competitiveness of economic agents within their
jurisdiction.
3. RELATIVE COMPETITIVENESS OF PUNJAB 3.1. Comparative Indicators by Province We turn to the relative position of Punjab among the four provinces of Pakistan in the magnitude of
different development indicators. Table 2 presents the relative position with respect to the average
for the country as a whole. The average value for the country level indicator is set at 100, even
though the level of the national indicator may be below some ideal value. The provincial values are
expressed as a percentage of the national value.
Contrary perhaps to expectations, productivity levels, the primary determinant of competitiveness,
are relatively low in Punjab. This is the case both in the agricultural and industrial sectors. While
yields of major crops like wheat, rice, cotton and sugarcane are higher in Punjab than in Khyber-
Pakhtunkhwa and Balochistan they are lower than in Sindh. This is due to relatively low levels of
fertilizer use and water availability per acre. This indicates that cropping patterns in Punjab need to
change, away from water-intensive crops like sugarance.

PUNJAB COMPETITIVENESS REPORT 5
TABLE 2 COMPARATIVE INDICATORS BY PROVINCE
(Pakistan = 100) Years: 2006-07 to 2008-09
Indicator Punjab Sindh K-PK Balochistan Pakistan AGRICULTURE Yield per Acre
Wheat 102 128 57 79 100 Rice 84 140 96 117 100 Cotton 101 101 72 62 100 Sugarcane 99 110 86 95 100
Fertilizer Use per Acre 95 132 86 98 100 Water Availability per Acre 75 242 57 70 100 Cropping Intensity 121 71 88 52 100
INDUSTRY Output to Inputs Ratio
All 91 108 117 78 100 Textiles 89 123 - - 100
EDUCATION Gross Enrolment Ratio
Primary 107 92 96 82 100 Middle 108 92 102 68 100 Matric 106 93 94 63 100
Literacy Ratio 102 104 87 90 100 LABOR FORCE Percentage of labor force with
Matric/Intermediate degree 98 108 98 84 100 Graduate/Post-graduate degree 79 162 87 68 100
Percentage of employment in formal sector 84 130 98 145 100 HEALTH Per 1000 population:
Doctors 138 58 33 49 100 Beds 99 78 124 152 100
POWER Per capita:
Installed Capacity 69 104 142 210 100 Electricity Generation 68 99 131 251 100 Electricity Consumption 103 105 80 101 100
Average Number of Outages 105 76 47 53 100 ROADS Per 100 Kms of land area 159 33 47 15 100 Vehicles per 100 persons 93 154 51 55 100
Indicator Punjab Sindh K-PK Balochistan Pakistan
MEDIA TV sets per 100 persons 122 84 65 30 100
INSTITUTIONAL Transactions Costs for resolving issues 118 76 47 32 100 Gifts or bribes expected in inspections 68 146 143 79 100
Sources: Provincial Development Statistics Pakistan Statistical Year Books Pakistan Social and Living Standards Measurement Survey Labor Force Survey Census of Manufacturing Industries World Bank

PUNJAB COMPETITIVENESS REPORT 6
Industrial efficiency is measured as the ratio of value added to factor inputs (capital and labor). On
the basis of data extracted from the Census of Manufacturing Industries (only large-scale units) of
2001, industrial productivity in
Punjab appears to be lower than for
the country as a whole by about 9
percent. Similarly, in the largest
sector, textiles, Punjab has
productivity almost 11 percent
below the national average. This may
be due to a relative concentration at
the lower end of value added in
cotton spinning as opposed to
weaving and garments.
Sindh has the highest productivity
due, in particular, to the locational
and advantage of proximity to the
port at Karachi. Punjab’s share in
output of major industries is given in
Table 3. Between 1998-99 and 2007-
08 out of the 16 industries covered,
Punjab has increased its share in
seven industries including beverages,
cigarettes, paper and paper board,
chemicals and electric motors. It has
lost share in five industries including
textiles, vegetable products and
cement.
In the area of education, Punjab
performs better. The literacy ratio is
about 4 percent above national average, and highest among provinces. This is explained by the fact
that gross enrolment ratios at the primary, middle and secondary levels are all the highest in the
country, due, in particular, to higher female enrolments. But Punjab falls behind in terms of the
human capital endowments of the labor force as measured by the proportion of workers with higher
TABLE 3 PUNJAB’S SHARE IN OUTPUT OF VARIOUS INDUSTRIES
1998-99 AND 2007-08 (%)
1998-99 2007-08 Trend
Vegetable Products 50 43 ↘
Sugar 57 57 →
Beverages 69 79 ↗
Cigarettes 44 52 ↗
Cotton Yarn 36 32 ↘
Cotton Cloth 63 32 ↘
Paper 60 90 ↗
Paper Board 78 95 ↗
Caustic Soda 100 100 →
Sulphuric Acid 30 46 ↗
Urea 57 66 ↗
Cement 43 40 ↘
Electric Motors 10 54 ↗
Electric Transformers 48 35 ↘
Tractors 100 100 →
Bicycles 100 100 →
Summary:
↗ Industries 7
→ Industries 4
↘ Industries 5
Source: Punjab Development Statistics Pakistan Economic Survey

PUNJAB COMPETITIVENESS REPORT 7
education (matric and above). Sindh and Khyber-Pakhtunkhwa are both ahead of Punjab in this
indicator.
The health sector performs relatively well in Punjab, with substantially higher availability of doctors
in relation to the population. However, the number of hospital beds per 1000 population is close to
the national average and, interestingly, the two smaller provinces do better in this indicator.
Turing to physical infrastructure, Punjab has the largest deficit between power generation and
consumption. It is not surprising, therefore, that the highest incidence currently of power outages is
in the province. The availability of power is clearly going to play a more important role in
determining the future growth prospects for Punjab.
On the institutional side, while there is evidence of more bureaucratic red-tape in Punjab, it appear
that the level of corruption associated with various types of inspections by provincial agencies is
lower, as highlighted by the World Bank Survey on Doing Business in Pakistan.
Overall, in comparison to the other provinces, Punjab does better in education, health, roads and
governance. The major constraining factors to competitiveness are the human capital endowments
of the labor force, use of inputs in agriculture and access to power. Consequently, productivity levels
in both industry and agriculture are lower than those in Sindh, although higher than in Khyber-
Pakhtunkhwa and Balochistan.
3.2. The Economic Base of Punjab Based on the competitive advantages and disadvantages, we have analysed the economic base of
Punjab in terms of employment. This has involved the computation of the ‘location quotient’ for
each sector of the economy as follows:
푙푐 =푒푒
where 푙푐 = location quotient, 0 ≤ 푙푐
푒 = share of employment in the jth sector of the ith province
푒 = share of employment in the jth sector of Pakistan
A sector is included in the economic base of a province if the location quotient for the sector
exceeds unity.
Sectors of Punjab with location quotients of greater than unity, as shown in Table 4, are manufacturing; construction; real estate, renting and business activities; community, social and
personal services and household economic activities. It is interesting that Punjab is moving from being an agricultural economy to an industrial and service economy. The share of employment, in particular, in manufacturing is relatively high due to the greater presence of SMEs, frequently in the
form of locational clusters with a strong export orientation. This is apparently in contrast to the

PUNJAB COMPETITIVENESS REPORT 8
earlier result of lower industrial efficiency. The explanation is that while competitiveness of the
large-scale manufacturing sector is relatively low, SMEs of Punjab are more buoyant and efficient. Therefore, the focus of development in Punjab should be more on this part of the industrial economy.
4. DEVELOPMENT PLANNING PROCESS
The bases of budget making by Provincial Governments are enshrined in Articles 118 to 124 of
Constitution of Islamic Republic of Pakistan, 1973. A similar process has also been prescribed for the
Federal Government in Articles 78 to 87 of the Constitution. Hence the budget making process both
at the Federal & Provincial levels is similar in nature. Budget making, for each fiscal year, takes place
from October - June. The Constitution also provides distinction between development and non-
development parts of the budget.
4.1 Development Expenditure
The development expenditure has been defined in the Punjab Budget Manual 2008 as the expenditure having the following characteristics:-
(i) It is designed to keep intact, enlarge and improve the physical resources of the country;
(ii) It improves the knowledge, skill, and productivity of the people; and
(iii) It encourages efficiency with which available resources are used.
The only exception to the above is the investment in human resource by the Departments of Health
and Education, which despite having the above features, is categorized as non-development
expenditure. This exception is, however, made because expenditure by these two departments is of
permanent nature and should, therefore, be met from permanent resources rather than from loan
or aid. In this way the source of funding also plays some part in determining the type of expenditure.
Following the above mentioned principles the expenditure in important sectors such as Irrigation,
Power, Communication and Transport etc. on replacement or expansion of existing capacity, or for
creation of new physical capacity is treated as development expenditure. In respect of civil works,
investment in building and roads are categorized as development expenditure. Similarly, the non-
recurring expenditure on housing and settlement projects and ancillary services such as water
supply, sewerage, electrification etc. is also part of the development expenditure.
4.2 Annual Development Plan (ADP)
Development expenditure is provided for according to plans each of which is intended to cover a
period of one year in case of short term, and about 3-6 years in case of medium term plans. Annual
Development Program, for a financial year is the statement showing the details of total development
expenditure proposed for various development schemes in different sectors / sub-sector for a year.

PUNJAB COMPETITIVENESS REPORT 9
4.3 Development Planning Process
Development process involves three main parts: the identification of schemes, the approval and
budgeting of schemes and the execution of schemes. These parts have been explained in the
following paragraphs:
Identification of Schemes Government departments are responsible for identification of development schemes. In this quest,
the departments are guided by Government’s vision, communicated through policy documents such
as Poverty Reduction Strategy Paper (PRSP) or Vision 2020. Ideally, a Government at the start of its
tenure in office should come up with its development priorities which should preferably be
integrated with national development strategy. The policy document also provides sectoral
outcomes for implementation of the development vision. These outcomes in turn provide direction
and targets to individual departments to form their respective development programs. In order to
have a predictable, well defined and clear planning process, the Departments need to come up with
medium and long term sector plans, clearly setting targets for each year. The annual development
plan should, therefore, flow from such sectoral / departmental plans of all departments keeping in
view the availability of resources.
Being need based is the other important characteristic of a good development program. In the developed countries the research by academia and professional bodies provide justification for various development initiatives. In developing countries this ‘luxury’ is seldom available. Therefore,
the development process is ad-hoc in nature. In Punjab, a Multiple Indicator Cluster Survey (MICS) was conducted in 2007 with the assistance of international development partners to identify need
for development initiatives in various districts of the province. It is, however, deplorable that the survey has not been properly utilized in development planning since then.
The Budget Manual, despite being a very elaborate document, does not provide specific steps which
need to be taken by the Provincial Government for identification of schemes. One, however, feels
that the Department Heads must consult surveys such as MICS and hold consultations with public
representatives, academia and other stakeholders to identify development schemes for their
sectors. Public representatives need to be given special importance in this process as they have the
knowledge of local needs. Recently need was felt to hold more consultation with elected leadership
of the Province for identification of development initiatives. Therefore, Punjab Government initiated
the process of holding pre-budget sessions of the Punjab Assembly. Through this session,
Government departments seek input of legislators on prospective development schemes. It is,
however, worth mentioning that the process of consultation needs to be further institutionalized for
effective consultations as presently many MPAs have been complaining that their input in the pre-
budget sessions was not given due importance in framing the development program for the
province. In addition, there is great need that the legislators are educated to play the role expected

PUNJAB COMPETITIVENESS REPORT 10
of them which entails providing guidance to bureaucracy on setting development priorities, sector
ceilings and monitoring effective use of development funds in whole of the province. At present the
legislators only seem to be worried about development schemes for their respective constituencies.
In this regard, orientation of the members of legislature is definitely required to apprise them of
their true role in the development planning process.
Many Governments face the problem of a big throw forward of development schemes sometime
due to delays in completion and on other occasions due to non-availability of funds. Sometimes the
throw forward occupies nearly all the fiscal space available for development program in a year.
Throw forward results in cost escalation of schemes. This is usually a bigger problem when a new
Government comes into office as the outgoing Governments usually leave a large portfolio of
incomplete schemes so as to force their followers to continue with their development priorities.
Incomplete schemes deserve to be financed to save already invested funds but it is also important
for the sitting Government to look into such portfolio and shunt out schemes which do not fit its
priority. This creates space for the Government for inclusion of new schemes that match its
priorities. This, however, needs to be done after careful review of each scheme and a cost benefit
analysis of continuing or leaving them. More importantly the shunting exercise needs to make non-
partisan decisions to ensure that beneficial schemes are not left out just because those were
initiated by outgoing schemes. It is also important to point out that Governments should assign
greater priority to schemes which could be completed within a year and thus do not contribute to
through forward.
4.4 Approval of Annual Development Program
The development budget estimates for the proposed new projects, together with the project
documents are submitted to the Planning and Development Board for appraisal. Each scheme or
project that is proposed under development allocations is put forth for appraisal using the Federal
Planning Commission (PC) forms. The PC-I form contains details about the project scope, location,
implementing authority, objectives, cost estimates, and a benefit analysis. At present the Planning
Commission has developed 14 different PC-1 forms for different sectors.
The departments must select individual schemes with a view to maximize national economic growth,
social development, generation of greater resources and meeting sectoral outcomes determined by
Government’s vision. However, due to competing demands of different sectors, the decision for
inclusion of a development scheme in the ADP hinges on project appraisal which includes technical,
social, commercial, financial and economic analysis/appraisal of a project. Project appraisal is
important to determine the most beneficial projects due to limited availability of resources for
development purpose.
Box 2 provides a brief description of steps carried out for formulation of Annual Development
Program with target dates:

PUNJAB COMPETITIVENESS REPORT 11
BOX 2
ADP CALENDAR Early December Copies of BM-12 form supplied by Finance Department to
Administrative Departments for furnishing information relating to development schemes proposed to be included in the ADP
20th December Administrative Departments return BM-12 form duly filled.
10th January to 15th February Meetings of competent forums / committees held in P&D Department for consideration of schemes identified by the Administrative Departments.
20th February First draft of ADP prepared by Finance Department and provided to Administrative Departments for scrutiny of schemes included in the first draft
20th February to 10th March Administrative Departments complete scrutiny of relevant part of development program and submit plan to P&D. Another round of meetings is held to determine the allocations for each scheme
10th March Ministry of Finance in consultation with Provincial Government determines the size of resource transfers to provinces and resources available for development. On the basis of this information Planning Commission fixes size of ADP for provinces.
End April Approval of size of ADP by National Economic Council
End May Submission of ADP to Cabinet for approval
Early June ADP submitted to Provincial Assembly for approval as part of budget.
The composition and competence of different forums responsible for approval of development schemes for inclusion in Annual Development Program subject to availability of resources is given in
Box 3.
It is important to point out that appraisal and scrutiny of proposed projects require that the forums / authorities examining different schemes have the capacity to examine technical and financial aspects of respective projects. PDWP, despite being the highest forum for approval of development
schemes, is sometimes criticized for its ability to effectively appraise schemes, simply because it is
very difficult for a single body to review such a large number of schemes. The meetings of this committee are convened at a very short notice which does not allow enough time to members to
examine the proposals before attending the meeting. Asymmetry in availability of technical
information between line departments and the approving authority (PDWP) is another reason for criticism of the working of PDWP. This asymmetry provides incentives for line departments to over-estimate the costs of projects. In order to curb this tendency, the Government has recently
embarked upon the idea of standardizing technical designs of different types of infrastructures. There is still need for the Government to control asymmetry of information between its different
agencies to ensure that there are no over-estimation of costs at the planning stage. One option for this is to get the estimates and technical designed prepared by Government departments cross
checked by independent experts.

PUNJAB COMPETITIVENESS REPORT 12
BOX 3 COMPETENCE OF APPROVING AUTHORITIES
DEVELOPMENT FORUM APPROVING AUTHORITY
Category-I Officer (Officers specified in Delegation of Financial Powers Rules)
Upto Rs.2 million
Departmental Development Sub-Committee (A Committee comprising the concerned Administrative Department and a representative each of Finance Department and Planning & Development Department not below the rank of a Deputy Secretary)
Rs.2 million - Rs.200 million
Provincial Development Working Party (A Committee comprising members from the Planning and Development Board including Chairman, Members / sector heads in P&D Department and Chief Economist, Finance Department, and the relevant department sponsoring the scheme not below the rank of an Additional Secretary
Rs.200 million - Rs.5,000 million
Executive Committee of National Economic Council (ECNEC) Finance Minister heads ECNEC. The members include Federal Ministers incharge of economic ministries, the Deputy Chairman Planning Commission, Chief Ministers and Provincial Ministers of concerned departments)
More than Rs.5,000 million
Determination of the size of Annual Development Program is also a contentious issue these days particularly due to the present trend to announce a development budget significantly higher than the last financial year for popular / political reasons even if this means over stretching the financial capacity of the Government. In case of Punjab, this tendency has become more and more visible during the last 5 years. This over-stretching of resources could undermine the whole development process as the payments could get stuck during implementation. It is, therefore, important that the role of Planning Commission and Finance Department is strengthened and insulated from political pressures to determine the sustainable size of development program for respective provinces.
The last step in preparation of ADP is its submission to Provincial Assembly as part of the budget. The Assembly debates the schemes included in the ADP. The members can bring to the attention of the house a certain project proposed to by the government using a cut motion. The cut motion creates occasion for debate in the Assembly regarding a specific allocation and government policy. After the debate the bill upon receiving a simple majority becomes gets approved. Schemes thus approved by the Provincial Assembly form part of the ADP.
4.5 Execution of Schemes After approval of the budget, funds for development schemes are released by Finance Department in respect of approved schemes. Usually these funds are released in quarterly installments. This allows Finance Department to match its expenditures with the available resources and provides room for it to make necessary adjustments in the development budget during the course of the year in case of any shortfall in the projected receipts. Thus the arrangement provides some flexibility to manage finances of the Government but this practice is termed by many as a reason for slow implementation in the public sector. During the FY2009-10, Punjab Government had to adjust the size of its Annual Development Program from Rs.172.0 billion to approximately Rs.135.0 billion, mainly on account of shortfalls in revenue. Such adjustments during the course of financial year

PUNJAB COMPETITIVENESS REPORT 13
create distortions in the overall direction and priorities of the development spending as the adjustment are usually carried out in an ad-hoc fashion. Government carries out its development program through contractors / contracting firms. These contractors are profit driven individuals. Delay in their payments causes cash flow problems for them and resultantly the implementation of development process slows down. Usually such delays are caused by delay in release of funds. Therefore, there is great need that process for release of funds and clearance of bills / cheques is simplified and made more predictable. In this regard accurate determination of size of development program could play an important part as explained above. Regarding smooth flow of funds it is extremely important that discretion of officials in Finance Department, P&D Board and Accountant General’s office is minimized. Use of Assignment Accounts for Administrative Departments for their development schemes is an interesting option to ensure free flow of funds. This account operates like a normal bank account and Finance Department, P&D or Accountant General’s office have no control over payments/cheque clearance. Further, the account unlike the other bank accounts is friendly for Government’s cash flows as outflow from Government’s account takes places only when it is required for actual disbursement to contractors. Another important aspect of development programs is inclusion of un-approved schemes and block allocations in the development plan. Bloc grants of Rs 9 million for development were made in 2009-10, representing 7 percent of the PSDP. These schemes/allocations are released on completion of the approval process. However, due to a number of steps involved in the approval process the execution of these schemes is usually delayed. It may be worthwhile mentioning here that a number of agencies i.e. sponsoring agency, P&D, Finance Department and executing agencies are involved in this process. Implementation process gets delayed if the case for approval / release of funds gets stuck in anyone of the above mentioned offices. Therefore, there is a clear need to discourage inclusion of unapproved schemes/blocks in the ADP. The execution of schemes is undertaken by the departments once the budget has been approved by the Provincial Assembly. Officials are empowered to carry out expenditures in accordance with the powers granted to them in the Delegation of Financial Powers. As long as the schemes have been approved and there are resources available, the funds are released to the departments at their request. However in case of shortfalls in revenue, cuts are imposed across the sectors. As noted above, this is likely to create distortions in the development plan. Similar distortion is created by intra-sector and inter-sector re-appropriations. It is extremely important that such re-allocations are minimized at the execution stage as these have the potential to change the complexion and direction of the development program authorized by the legislature.
At the execution stage the Government’s ability to monitor quality of execution is the biggest question mark on the development process as the Government implements most of its projects through private contractors. These contractors have an obvious incentive to make use of this inability to their personal gains. It is important that the Government builds this capacity and

PUNJAB COMPETITIVENESS REPORT 14
develops deterrence in the minds of contractors so that they produce the quality of work which matches the price that they charge the Government. It is also important that the Government disciplines its technical staff and creates incentive for them to abstain from collusion with contractors for personal gratification. According to many the efficiency of utilization of public money and poor quality of development works is the biggest problem faced by Government these days. Due to this a large portion of development funds is never used for producing public goods. In order to avoid such colossal loss of public money, the Government needs to streamline its procurement processes, automate release and payment procedures and enhance its monitoring capacity by ensuring availability of information, greater community participation and third party / random monitoring of development schemes.
The quality of project execution is closely related to input rates for infrastructure projects which form the basis of payments to contractors. Earlier Composite Schedule Rate (CSR) system was followed. This system provided input rates, subject to revision annually or bi-annually, based on cost of machinery, equipment and labor. Due to delay in revision of rates, CSR did not reflect the market prices of inputs. Hence, this system was replaced with Market Rate System (MRS) in 2004. Under this system, the input rates are revised every month by Finance Department in consultation with engineering departments of the Government. The switch to MRS was motivated with a view to pay the actual input costs (with reasonable profit) to contractors to get quality output. This system, however, has its own demerits. The biggest and most serious one is the inflationary impact, pushing up input rates manifold since its introduction. Some experts also believe that MRS provides opportunity to contractors to make additional profits if they can observe the direction of change in input costs. Therefore, there is a debate that the Government needs to shift to Engage Procure Construct (EPC) or Turnkey mode of contracting to protect its financial interest as this type of contracts protect interest of both the Government and the contractor. Government does not have to face the risk of increase in cost as in case of MRS and contractors can internalize the risk of inflation in their cost estimates.
During the execution phase there are three project related PC forms that are used to keep track of the implementation status of projects: the PC-III Form to be furnished by the 5th day of each month to the Planning and Development Board, the PC-IV Form, and the PC- V Form. These forms record the allocations, releases, expenditures, outputs indicators, achievements, and issues in implementation of the schemes.
Accounts are maintained by each department in either a manual format or a computerized format as per the accounting practices being followed in the department. After the completion of the budget cycle, post audit of accounts is carried out by independent auditors, and the audit reports are placed before the Public Accounts Committee of the Provincial Assembly that takes up irregularities on a case by case basis. Expenditure on replacement or expansion of existing capacity or creation of new physical capacity is categorized as development expenditure. Provision for development expenditure is made in the

PUNJAB COMPETITIVENESS REPORT 15
budget through the Annual Development Program (ADP). The plan comprises ongoing and new development schemes in different sectors. Sectoral allocations in ADP are determined by development priorities of the Government. ADP involves three main phases: identification of schemes, approval of schemes and execution. Identification of schemes is guided by development vision and priorities of the Government, outlined through policy documents and surveys to determine development needs. Consultations with public representatives, academia and other segments of society also play a key role in identification.
The identified schemes are presented to competent forums on prescribed PC-1 forms for approval. These forums approve individual schemes on the basis of technical, social, commercial, financial and economic appraisal and availability of resources. This stage is followed by approval of the development portfolio / ADP by the Provincial Assembly. At times un-approved schemes are also included in the program in anticipation of their approval by competent forums. Funds for ADP schemes are released to executing agencies either in full or quarterly installment based on availability of resources. These funds are used for execution by different officers in accordance with the authority delegated to them under Delegation of Financial Powers Rules. At times resource shortfall results in ad-hoc cuts in development budget. Ad-hoc cuts along with re-appropriations in approved ADP have the potential to change the direction and priorities set by legislature, therefore, these practices need to be minimized. Another important aspect of ADP is accurate determination of its size. Politicians usually like to project a bigger ADP every year for political mileage. This practice could land Government in severe financial problems as has been the case for Punjab in last 5 years. According to most experts the weakest link in whole development process is Government’s inability to monitor quality of execution of development works by contractors as they have an obvious incentive to cheat usually in collusion with officials. This weakness needs to be overcome through involvement of elected representatives, local community, independent evaluators and introduction of random checks for quality of execution by senior Government officials. Delays in execution and consequent cost over-runs also hamper Government’s efficiency of resource utilization. Many feel that a useful step to avoid cost over-runs and delays is standardization of different types of infrastructures and use of alternative modes of contracting such as turnkey or EPC contract. The accounts of development works are maintained by respective executing agencies which are audited by the Auditor General.
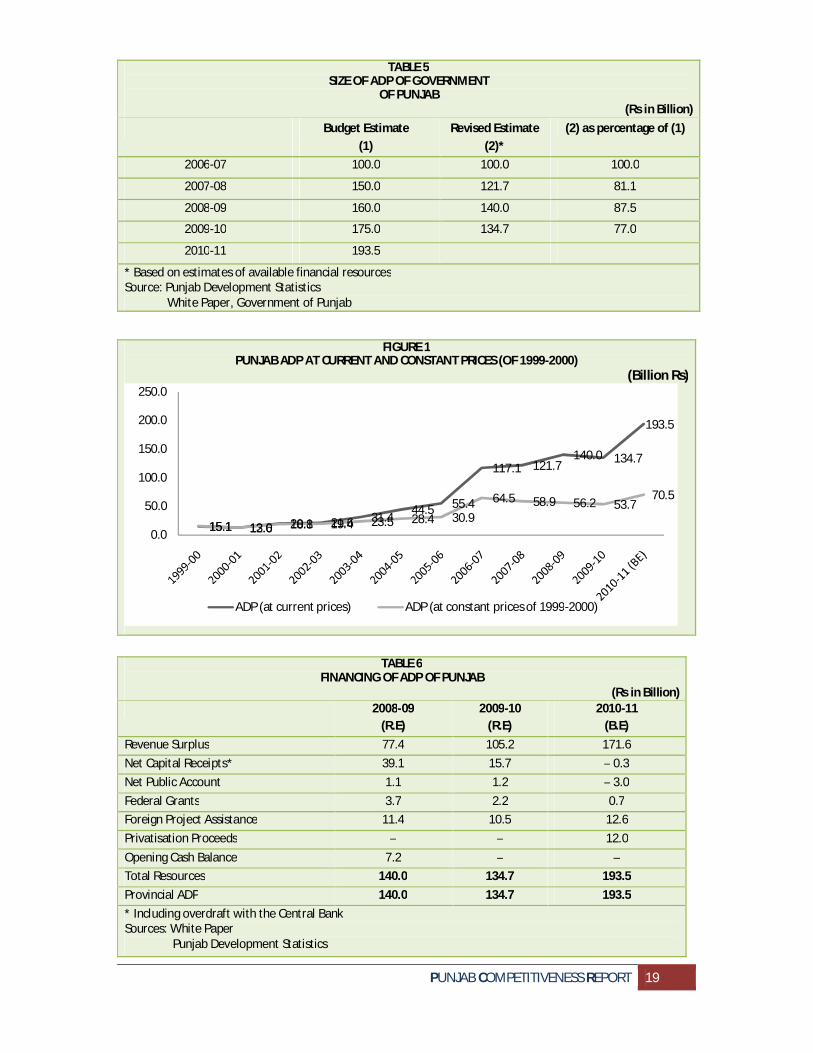
5. SIZE AND COMPOSITION OF ADP 5.1. Size and Financing of ADP Does the ADP of Punjab focus on removing the weaknesses in the competitiveness of the province? We look first at the overall size of the provincial development programme and then at priorities. Table 5 gives the evolution of the ADP since 2006-07. The big jump of almost 111 percent occurred in that year. This was the culmination of process of exponential increase in ADP which started in
2003-04 as the economy started demonstrating rapid growth and the fiscal space for development improved substantially.

PUNJAB COMPETITIVENESS REPORT 16
After 2006-07, the ADP has witnessed slow growth in nominal terms and actually a decline in real
terms (see Figure 1). Due to the paucity of resources and limits to borrowing there have been shortfalls of about 20 percent in the execution of the budgeted ADP in recent years. In fact, the level of development spending in 2009-10 at constant prices (of 1999-2000) was down by 17 percent in
relation to the peak level attained in 2006-07. This is despite resort to overdraft facilities in recent
years, as shown in Table 6.
The financial position of the Provinces is expected to improve dramatically following the 7th NFC Award. Consequently, the revenue surplus of the province is projected to increase by 36 percent in 2010-11, even after allowing for the increase of 50 percent in basic pay of employees. This will enable an increase of almost 44 percent in the size of the ADP next year, with minimal resort to borrowings.
It needs to be emphasised, however, that there are still some risks. First, the substantially larger fiscal transfers are based on optimistic growth rate in tax revenues of Federal Board of Revenue (FBR) of 25 percent which may not materialise, especially in the absence of a broad-based VAT. Also, privatisation proceeds of Rs 12 billion are expected in 2010-11. This target may also not be achieved given the depressed conditions in asset markets. In the medium run, a plan for privatisation of assets may be prepared which will include the sale of land and property in choice locations of cities in the province.
Further, even the enlarged size of the ADP next year is somewhat less than 2 percent of the provincial GDP. According to the Macroeconomic Framework prepared for the 7th NFC Award, higher allocations of up to 3.5 percent of the GDP are required if the competitive disadvantages of the province are to be removed quickly and if the regional economy is to achieve a growth rate of about 6 percent. Beyond the enhanced transfers under the 7th NFC, increases in the size of the provincial ADP will require more aggressive mobilisation of revenues from own sources of revenue of the province.
The resource mobilisation strategy of the Provincial Government of Punjab could consist of, first, development of the recently levied capital gains tax on property, following the abolition of the federal capital value tax, especially by updating the valuation tables. Second, enhancement of the presumptive tax rates on agricultural income, which are currently very low. Third, proper water pricing, through higher abiana charges to at least ensure full recovery of the operations and maintenance costs of the irrigation system. This has become essential to improve incentives for greater water efficiency, as the availability of water for agriculture becomes increasingly scarce. Simultaneously, some relatively small taxes like the tax on transfer of poverty, tax on professions, callings and trades may be abolished or handed over to local governments. The revenue loss is marginal at below Rs. 1 billion.
The revenue potential of tax reforms in provincial taxes is significant. They could add almost
50percent to the projected revenue from taxes in 2010-11 of Rs 40 billion. The AIT rates per acre are

PUNJAB COMPETITIVENESS REPORT 17
exceptionally low, at Rs 150 to Rs 250 per acre, representing less than 1percent of the net income.
These rates could be raised by a multiple factor leading to additional contribution from the AIT of
upto Rs 10 billion. Estimates are that the property tax collects only one-fourths of its revenue
potential as indicated by the ratio of assessed to market rental values. Over time, enhancement of
the former could fetch additional revenue of Rs 8 billion. The capital value tax could yield at least
another Rs 2 billion if the valuation tables are indexed to inflation, as has been done recently by the
Government of Sindh.
Turning to non-tax revenues, as highlighted above, a major source is abiana. In 2009-10 the
collection from abiana was Rs 2.7 billion in Punjab as compared to the direct costs of operations and
maintenance of the irrigation system of Rs 6.7 billion. Therefore, the extent of cost recovery is only
about 40 percent. The government of Punjab may announce a policy of raising the rates by, say, 20
percent annually, over the next five years so that, more or less, full cost recovery is achieved b the
end of the period.
Currently, the abiana is collected by season on a flat rate basis per acre of cropped area. The rate is
Rs 145 per acre for the Kharif season and Rs 85 per acre for the Rabi Season. There is no variation in
the rate by crop. Earlier, higher rates were charged for water-intensive crops like sugar cane and
rice, but this system was abandoned due to rent seeking behaviour by revenue collectors. In the
short run, the assessment of abiana may be linked to farm area and not to cropped area as this
policy discriminates against the small farmer. Also, there is a proposal for making the rate
progressive with respect to farm size, as a higher proportion of large farmers are located at the
beginning of a watercourse. In the long run, the scope for water metering will need to be examined.
On top of all this, there is the prospect for development of a broad-based sales tax on services as
part of the imminent reform of GST. This is potentially a large tax base including financial and
business services, private security services, repair services for automobiles, entertainment services,
large establishments within wholesale and retail trade, IT services and so on. Overall,
implementation of a well thought out revenue generation strategy, with political will and enhanced
capacity for tax administration, could raise the provincial tax-to-GDP ratio by upto two percent of
the Gross Regional Product. This will enable a rapid expansion in Punjab’s ADP.
However, a jump in the size of the provincial ADP will have significant downstream implications on
the level of operations and maintenance expenditure for the expanded network of infrastructure
and services. Fiscal space for this will require maintaining tight controls on costs of general
administration, on subsidies which are not well targeted to the poor and on discretionary
expenditures which have not been approved earlier in the Annual Budget passed by the Provincial
Assembly. Supplementary grants of Rs 20 billion were raised in 2009-10, equivalent to 6 percent of
total current expenditure. Overall, there will be need for innovations in the management of public
funds to promote economy, efficiency and transparency.

PUNJAB COMPETITIVENESS REPORT 18
TABLE 4 SECTORS IN THE ECONOMIC BASE OF PROVINCES OF PAKISTAN
(2008-09)
SECTOR Employment (Percentage) Location Quotient
Pakistan Punjab Sindh Khyber-Pakhtunkhwa
Balochistan Punjab Sindh Khyber-Pakhtunkhwa
Balochistan
Agriculture, Hunting and Forestry
44.91 44.46 45.37 44.04 50.99 0.99 1.01 0.98 1.14
Fishing 0.17 0.02 0.49 0.01 0.83 0.12 2.88 0.06 4.88
Mining and Quarrying 0.12 0.07 0.02 0.43 0.53 0.58 0.17 3.58 4.42
Manufacturing 13.02 15.08 12.41 7.46 3.36 1.16 0.95 0.57 0.26 Electricity, Gas and Water Supply 0.69 0.45 1.14 0.76 1.20 0.65 1.65 1.10 1.74
Construction 6.62 6.83 4.63 10.03 6.02 1.03 0.70 1.52 0.91
Wholesale and Retail Trade, Repair of Motor Vehicles, Motorcycles and Personal and Household Goods
15.16 14.94 15.86 14.74 15.28 0.99 1.05 0.97 1.01
Hotels and Restaurants 1.31 1.29 1.60 0.78 1.35 0.98 1.22 0.60 1.03 Transport, Storage and Communication 5.23 4.99 4.93 6.88 5.89 0.95 0.94 1.32 1.13
Financial Intermediation 0.55 0.44 0.96 0.31 0.17 0.80 1.75 0.56 0.31
Real Estate, Renting and Business Activities 1.01 1.08 1.01 0.82 0.57 1.07 1.00 0.81 0.56 Public Administration and Defence Compulsory Social Security
2.78 2.02 3.72 3.25 6.49 0.73 1.34 1.17 2.33
Education 4.07 3.42 4.50 6.17 4.69 0.84 1.11 1.52 1.15
Health and Social Work 1.28 1.28 1.16 1.48 1.63 1.00 0.91 1.16 1.27 Other Community, Social and Personal Service Activities
2.58 3.04 1.94 2.25 0.81 1.18 0.75 0.87 0.31
Activities of Private Households as Employers And Undifferentiated Production
0.49 0.58 0.27 0.55 0.18 1.18 0.55 1.12 0.37
Extraterritorial Organizations and Bodies 0.01 0.01 0.00 0.04 0.00 1.00 0.00 4.00 0.00
Source: Labor Force Survey
PUNJAB COMPETITIVENESS REPORT 19
FIGURE 1 PUNJAB ADP AT CURRENT AND CONSTANT PRICES (OF 1999-2000)
(Billion Rs)
15.1 13.0 20.1 21.6 31.4 44.5 55.4
117.1 121.7140.0 134.7
193.5
15.1 12.6 18.8 19.4 23.5 28.4 30.964.5 58.9 56.2 53.7
70.5
0.0
50.0
100.0
150.0
200.0
250.0
ADP (at current prices) ADP (at constant prices of 1999-2000)
TABLE 5 SIZE OF ADP OF GOVERNMENT
OF PUNJAB (Rs in Billion)
Budget Estimate (1)
Revised Estimate (2)*
(2) as percentage of (1)
2006-07 100.0 100.0 100.0
2007-08 150.0 121.7 81.1
2008-09 160.0 140.0 87.5
2009-10 175.0 134.7 77.0
2010-11 193.5
* Based on estimates of available financial resources Source: Punjab Development Statistics White Paper, Government of Punjab
TABLE 6 FINANCING OF ADP OF PUNJAB
(Rs in Billion) 2008-09
(R.E) 2009-10
(R.E) 2010-11
(B.E) Revenue Surplus 77.4 105.2 171.6 Net Capital Receipts* 39.1 15.7 – 0.3 Net Public Account 1.1 1.2 – 3.0 Federal Grants 3.7 2.2 0.7 Foreign Project Assistance 11.4 10.5 12.6 Privatisation Proceeds – – 12.0 Opening Cash Balance 7.2 – – Total Resources 140.0 134.7 193.5 Provincial ADP 140.0 134.7 193.5 * Including overdraft with the Central Bank Sources: White Paper Punjab Development Statistics

PUNJAB COMPETITIVENESS REPORT 20
5.2. Sectoral Priorities The broad sectoral priorities in the ADP are highlighted in Table 7. Social sectors and infrastructure
development account for bulk of the allocations, with a combined share of over 65 percent. The
share of production sectors,
primarily agriculture, has been
rising upto 2009-10 to 5
percent, but it is expected to
fall in 2010-11. Special
programmes and other
initiatives are expected to take
up a larger slice, upto 23
percent, of the ADP in 2010-
11. Therefore, the big increase
in allocations next year,
following the jump in the ADP
in the aftermath of the 7th
NFC Award, is likely to be in
services sectors, special and
other programmes. Box 4 gives
a listing of the key
programmes/initiatives in
2010-11.
We have highlighted earlier
that Punjab appears to be at a
competitive disadvantage in
terms of agricultural and
industrial productivity, caused
in particular, by relatively
limited use of agricultural
inputs, lower human capital
endowments of the labor force
and serious infrastructure gaps, especially in terms of availability of water and power. Does the
enhanced ADP in 2010-11 reflect adequate efforts at removing these constraints?
TABLE 7 BROAD SECTORAL PRIORITIES IN ADPS
2007-08 (R.E)
2008-09 (R.E)
2009-10 (R.E)
2010-11 (B.E)
Level (Rs in Billion)
A. Social Sectors 47.3 47.4 48.9 68.3
B. Infrastructure C. Development
32.5 57.7 51.5 59.3
D. Production Sectors 3.4 6.2 6.7 7.0
E. Services Sectors 3.0 3.2 2.4 7.1
F. Others 2.4 7.1 1.8 6.4
Total Core Programme 88.5 121.7 111.2 147.9
G. Special Programme 33.2 33.7 22.7 34.1
H. Others - - - 11.5
Total ADP 121.7 155.4* 133.9 193.5
Share (%)
A. Social Sectors 38.9 30.5 36.5 35.3
B. Infrastructure Development
26.7 37.1 38.5 30.6
C. Production Sectors 2.8 4.0 5.0 3.6
D. Services Sectors 2.5 2.0 1.8 3.7
E. Others 2.0 4.6 1.3 3.3
Total Core Programme 72.7 78.3 83.0 76.4
F. Special Programme 27.3 21.7 17.0 17.6
G. Others - - - 6.0
Total ADP 100.0 100.0 100.0 100.0
* This exceeded available financial resources. Source: White Paper.

PUNJAB COMPETITIVENESS REPORT 21
BOX 4 KEY PROGRAMMES/INITIATIVES IN
2010-11 ADP Education and Training
Provision of science labs in secondary schools Provision of computer/IT facilities in elementary schools Development of Daanish school system Training of teachers and managers Setting up of Punjab Education Endowment Funds (for scholarships) Four year Bachelor degree programme in colleges Establishment of Adult Literacy Centres Support to TEVTA/TEVTC
Health Expanded programme of immunisation TB and Hepatitis control programme Focus on secondary health care Improved diagnostic facilities Establishment of centres of excellence Enhanced focus on medical education
Water Supply Enhancing rural water supply in brackish areas
Regional Planning South Punjab Development Programme Punjab Economic Opportunities Programme
Roads Widening/improvement of existing inter-district roads Rehabilitation and upgradation of rural access roads
Irrigation Selective lining of irrigation channels Rehabilitation of LCC system Construction of small dams Small hydel power projects
Urban Development Provision of municipal services Master planning of big cities Harmonization of development controls and regulatory framework Urban infrastructure in intermediate cities
Agriculture and Food Productivity enhancement Promotion of agricultural research Development of renewable farm energy Provision of storage capacity through PPPs
Livestock Development of extension services Focus on veterinary education Better veterinary support services
Industry Development of Estates through PPPs Support to SME clusters
Information Technology Promote e-governance Provision of software technology parks and incubator centres Formulation of provincial ICT Policy
Tourism Development of existing tourist resorts
Special Infrastructure Completion of Lahore Ring Road (North) Detailed design for LRR (South)
Others Punjab Millennium Development Goals Programmes (PMDGP)

PUNJAB COMPETITIVENESS REPORT 22
Examination of the detailed sub-sectoral allocations in Table 8 reveals the following:
(i) Although the allocation for agriculture and livestock is proposed to be nearly doubled to Rs 5.2
billion next year, it will still account for only about 2.5 percent of the ADP. There is need for
launching a much more ambitious programme of agricultural research and extension including
development of drip irrigation and water harvesting, bio-genetic cotton varieties, improved
livestock breeds, better veterinary facilities and improvements in the supply chain of value
added crops like horticulture. The biggest gains from public investment are likely to be realised
from Punjabi agriculture.
(ii) Allocations for education are projected to increase by only 8 percent. In particular, the
increase in development expenditure on school education is only 1 percent and in higher
(college and secondary) education, 10 percent. The allocation for TEVTA, in the area of
vocational and technical education, is being raised to Rs 2 billion, while a new allocation of Rs
3 billion is being made for Daanish schools, representing local centres of excellence, and Rs 1.5
billion for medical colleges. Overall, the allocations for education are expected to aggregate to
about 15 percent of the ADP in 2010-11. Given the relatively low human capital endowments
of Punjab’s labor force, a minimum benchmark for the share of ADP allocation to education
and training may be 20 percent.
(iii) In the area of infrastructure development, the allocation for roads remains the largest sub-
sectoral of allocation, but is proposed to be enhanced by only 7 percent. As opposed to this
the allocation for irrigation is being raised by 35 percent, including a welcome new initiative
involving the construction of small dams. Given that Punjab is relatively well-endowed in terms
of the road network but needs to upgrade its irrigation system, the proposed growth rates in
allocations reflect appropriate priorities.
(iv) A new sector which has received significant allocation of Rs 2 billion for the first time in 2010-
11 is information technology. This will include initiatives for e-governance. This is also
welcome and over time will reduce transaction costs of business entities in the dealings with
government, an area in which Punjab performs poorly in relation to other provinces, due to
the presence of excessive ‘red tape’. Also, it is proposed to set up software technology parks
and incubator centres, especially to support small entrepreneurs.

PUNJAB COMPETITIVENESS REPORT 23
TABLE 8 SECTORWISE PRIORITIES IN ADPS
2009-10 (R.E) 2010-11 (B.E)
Allocation (Billion Rs)
Share (%)
Allocation (Billion Rs)
Share (%)
A. Social Sectors 48.9 36.5 68.3 35.3
Education 21.5 16.1 23.3 12.0
Health 9.5 7.1 14.5 7.5
Water Supply & Sanitation 8.3 6.2 9.5 4.9
Regional Planning 2.7 2.0 14.2 7.3
Others 5.0 4.3 6.2 3.1
B. Infrastructure Development 51.5 38.5 59.3 30.6
Roads 30.6 22.8 32.9 17.0
Irrigation 8.7 6.0 11.0 5.7
Urban Development 7.2 5.4 9.2 4.8
Others 5.0 4.3 6.2 3.1
C. Production Sectors 6.7 5.0 7.0 3.6
Agriculture 2.3 1.7 3.2 1.6
Livestock 1.2 0.9 2.0 1.0
Others (Industry, etc.) 3.2 1.8
D. Services Sectors 2.4 1.8 7.1 3.7
IT 0.2 0.1 2.0 1.0
Tourism 0.1 0.1 1.7 0.8
Emergency Services 1.5 1.1 2.0 1.0
Others
E. Others 1.8 1.3 6.4 3.3
Total Core Programme 111.2 83.0 147.9 76.4
F. Special Programmes 22.7 17.0 34.1 17.6
District/TMA Programme 11.1 8.3 12.0 6.2
Special Infrastructure 11.6 8.7 19.1 9.9
Others
Net Development Programme 133.9 100.0 182.0 94.1
G. Others 0.0 0.0 11.5 5.9
Daanish School System - - 3.0 1.6
TEVTA/TEVTC - - 2.0 1.0
DLIs for MDGs - - 6.5 3.3
Total ADP 133.9 100.0 193.5 100.0

PUNJAB COMPETITIVENESS REPORT 24
(v) As demonstrated earlier, levels of industrial efficiency are still lower in Punjab than in Sindh. But
only a token allocation of Rs 220 million is proposed for industrial development. There is a
strong case for substantially increasing the allocations for development of industrial estates and
provision of critical infrastructure like power and gas in close proximity to SME clusters, which
have traditionally been a source of dynamism in the Punjab economy but are now bogged down
by severe infrastructure constraints. In addition, service centres may be established at SME
clusters for access to credit and inputs, technical training, renting of machinery, etc.
(vi) The biggest percentage increase in allocations of 431 percent is for regional planning. Clearly,
this is in recognition of the growing disparities in development between metropolitan locations
and areas, for example, in the south of Punjab. This will contribute to a more balanced pattern
of regional development.
(vii) A lump sum allocation of Rs. 6.5 billion has been made for achieving the MDGs. This is also a
welcome step and highlights the enhanced priority for poverty reduction, food security and
human development. But this lump sum allocation will have to be converted into specific
programs and projects.
Overall, some attempts have been made to remove weaknesses in Punjab’s economy in terms of
competitiveness in the substantially
larger ADP of 2010-11 following the
7th NFC award. However, within the
overall resources envelope, a case
could have been made for smaller
allocations to roads and special
programmes and larger allocations
foragriculture and livestock, industry
and education.
5.3. Medium Term Development Framework (MTDF) The Government of Punjab has prepared a three year MTDF from
2010-11 to 2012-13, with the expectation that this will guide the
annual ADP allocations. Key features of the MTDF include, first, a management by results framework, especially in terms of achieving the
TABLE 9 FUTURE DEVELOPMENT PRIORITIES
ACCORDING TO MTDF (%)
2010-11 2011-12
2012-13
Budget MTDF MTDF MTDF
A. Social Sectors 35.4 37.5 39.0 40.1
B. Infrastructure Development
30.6 32.6 32.3 31.9
C. Production Sectors 3.6 3.8 4.2 4.5
D. Services Sectors 3.7 3.8 4.2 4.3
E. Others 3.3 3.5 3.7 4.0
Total Core Programme 76.4 81.3 83.5 84.9
F. Special Programme/Packages
23.6 18.7 16.5 15.1
Total ADP 100.0 100.0 100.0 100.0
ADP Size (Rs in Billion) 193.5 182.0 195.0 212.0

PUNJAB COMPETITIVENESS REPORT 25
Millennium Development Goals (MDGs), second, adequate funding for foreign aided and mega
projects, third, focus on lesser developed districts, fourth, emphasis on on-going projects and reduction of the throw-forward (which had approached Rs 700 billion in 2009-10, over five years ADP), fifth, continued emphasis on rural development and, sixth, stress on allocation to pro-poor
sectors in line with the MDGs.
Table 9 reveals that already in the first year there have been significant deviations from the MTDF in the actual ADP allocations. The share of special programme/packages is higher and that for social sector and infrastructure development are lower. There is a need to revert back to MTDF priorities in
subsequent years.
6. ALTERNATIVE INSTRUMENTS FOR DEVELOPMENT PROGRAMMING In this section we explain alternative instruments and financing sources for development
programming that have greater potential for involvement of the private sector, donors and other
stakeholders.
6.1. Punjab Development Fund One proposal which has been put forward is the establishment of a separate Punjab Development
Fund (PDF). The objective of this Fund is to instill joint responsibility and accountability of key public and private authorities in planning, implementing and monitoring projects/programmes which are
crucial to the province’s development needs, with financing possibly on a matching basis. The concept of the PDF makes sense if the coordination among stakeholders is undertaken for the
ADP as a whole. Otherwise, there is a danger of fragmentation of the development process, with diversion of planning and execution capacity only to selected projects/programmes. As far as donor
assistance is concerned, it is important to ensure that rupee counterpart funds are available, which is one of the objectives of the MTDF. Beyond this, the Planning and Development, Finance and line departments may be strengthened to implement more effectively the Paris principles of Aid
Effectiveness.
In addition, given the enhancement in the development role of the provinces following the 18th
Amendment to the Constitution and the 7th NFC Award, there is need for establishment of formal consultative/advisory bodies with representation from the private sector, academia and civil society in the province, for discussion on issues of economic policy and development strategy. These
periodic consultations should ideally be chaired by the Chief Minister.
6.2. Private Financing of Infrastructure Given the need to raise development spending to boast the rate of economic growth from about 4
percent currently to 6 percent, there is a need to diversify the sources of financing by involving the
private sector, both foreign and domestic, in the financing and management of commercially viable

PUNJAB COMPETITIVENESS REPORT 26
infrastructure, generally on BOT basis. But Infrastructure projects are complex, capital-intensive,
long gestation projects that involve multiple and often unique risks, and there are a large number of
constraints to financing of infrastructure, especially by the private sector, as follows:
Financial Factors
A combination usually of high capital costs and low operating costs implies that initial financing
costs are a large proportion of total costs.
Raising equity finance tends to the most challenging aspect of infrastructure project financing.
Most infrastructure projects yield returns after many years, and hence require longer tenor
finance, which is generally not available in the absence of a long term corporate bond market.
Insurance companies and pension funds are ideal candidates for supplying long tenor financing
but generally are unable to do so due to well-defined regulations in Pakistan forcing them to
make only low risk investments.
Fiscal Factors
An enabling fiscal environment is a pre-requisite for attracting private investment in
infrastructure, especially in the form of fiscal incentives like customs duty exemption on
machinery and tax holidays on profits.
These fiscal incentives are determined by the federal government and not by provincial
governments. Currently, in Pakistan, there is no favourable tax treatment of machinery
imported for infrastructure projects and tax holidays or accelerated depreciation allowances
are available only for limited periods. The minimum tax provisions (at 1 percent of turnover)
increase tax liabilities in initial years of a project.
Transactional Factors
Infrastructure projects require multiple clearances at federal, provincial and local levels. This is
a time consuming process not only due to the sheer number of approvals but also because
clearances are frequently sequential in character. The costs of doing business are further
enhanced by the presence of kickbacks in the system.
Transaction costs are enhanced, first, by lack of coordination between government
ministries/departments at different levels, second, by problems in contract negotiations and
delays in award of contracts and, third, limited capacity within government to execute
infrastructure projects. We have already highlighted the problems of ‘red-tape’ in dealings with
the provincial bureaucracy.

PUNJAB COMPETITIVENESS REPORT 27
6.3. Scope for PPPs PPPs can help meet the infrastructure gap but they are often complex transactions, needing a clear
specification of the services to be provided and an understanding of the way risks are to be allocated
between the public and private sectors. Capacity to effectively conceptualize, procure and manage
PPPs is very limited within the government in terms of development of appropriate legal and
regulatory frameworks, procurement guidelines, etc. The process of PPPs can be expedited by
preparation of Model Concession Agreements (MCA) for BOT projects, standard bidding documents,
etc.
Overall, it appears that the scope of PPPs is currently limited in Punjab for a number of reasons.
First, the overall investment climate in the country for the private sector is negative and risk
perceptions are high currently. Second, the experience with PPPs is very limited and there are no
major success stories. Third, as highlighted, no major fiscal incentives are available for private
investment in infrastructure. Fourth, the private sector is concerned about the generally low quality
of governance in the public sector, with the absence of proper legal and regulatory frameworks and
perceptions about the rise in levels of corruption (although less so in Punjab).
Therefore, even though gaps in infrastructure are large and growing in Punjab, expectations about
PPPs in infrastructure have to be modest initially. The proposed initial steps are as follows:
(a) Establishment of a PPP cell in the P&D Department to perform tasks described in Box 5.
(b) As envisaged in the MTDF, exploration of PPPs in storage capacity, development of industrial
estates and inter-district road network. Box 6 gives a list of relatively small and commercially
viable projects which can be executed in Punjab on the basis of a PPP.
BOX 5 FUNCTIONS TO BE PERFORMED BY PPP CELL IN P&D DEPARTMENT
Prepare legislation for a provincial Infrastructure Authority Act (IAA) to primarily focus on facilitating private developers/investors in securing administrative approvals, conflict resolution and fiscal concessions.
Prepare project development/feasibility studies for PPPs in areas indicated in Box 4, with modalities for project implementation including sources of finance and sharing.
Arrange competitive and transparent bidding of projects. Following passage of IAA, the PPP Cell may be upgraded to an Infrastructure Authority with the primary
objective of supporting the private sector in land acquisition, environmental and other clearances, access to services and financial closure.

PUNJAB COMPETITIVENESS REPORT 28
BOX 6 EXAMPLES OF PUBLIC-PRIVATE PARTNERTSHIPS
Examples of possible PPPs by Provincial Governments Special Enterprise Zones (SEZ) and Industrial Estates IT Parks Integrated Township and Convention Centres Technology Incubation Centres Commercial and Office Complexes Container Terminals (road transport) Hotel Resorts Minor Airports Bus Terminals Housing Schemes Multi-level Parking Complexes Warehousing Amusement /Entertainment/Theme Parks Agri/Horticulture Markets Specialized Institutions for Higher Education and Training Hospitals


