52
Punjab Road Safety & Traffic Way Ahead Navdeep Asija Research Scholar, Indian Institute of Technology Delhi Founder, Ecocabs 25 th October 2012

Punjab Road Safety & Traffic Way Ahead
Navdeep Asija
Research Scholar, Indian Institute of Technology Delhi
Founder, Ecocabs 25th October 2012

Punjab- India

Present Road Safety Approach
Pragmatic
To
More Scientific
•Road safety is
largely
preventable and
predictable
phenomena
•Road Safety is
No Accident
•Act of GOD?

Understanding Road Crash..
Environment
Humans
Vehicle
Accident is a failure in a subsystem, or the system as a whole that
damages one or more unit
54-62%
8-12%
28-34%

Haddon Matrix
Element Pre Crash In Crash Post Crash
Humans •Training
•Education
•Behavior
•Attitude
•Conspicuous
•Clothing on Pedestrian
& Cyclist
In Vehicle Restrains are
Fitted and Worn Emergency Medical
Services, Like First Aid
and Ambulance
Vehicle •Primary Safety
Breaking, Visibility & Space
Secondary Safety Like
Impact Restrains Salvage
Road •Delineation
•Road Geometry
•Surface Condition
•Visibility
•Road Safety Audit
•Road Side Safety
•Safety Behavior
Restoration of Road
and Traffic Devices
Conditions
Pre Crash In Crash Post Crash

Hand Railing Design

Design : Open Drain
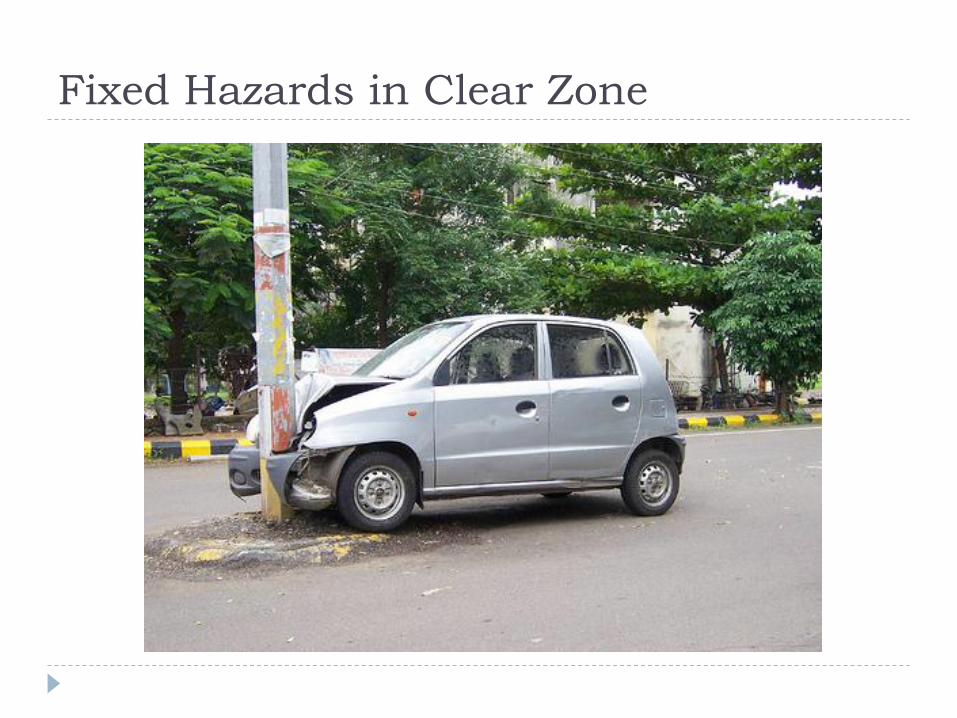
Fixed Hazards in Clear Zone

Human Error
Road Accidents are mainly due to human Errors ???
ROAD SAFETY IN INDIA
By
S.K. Mishra, Director (Road
Transport)
Ministry of Shipping, Road
Transport and Highways, Govt.
of India
An analysis carried out on the
accident data for the year 2003
shows that the main causes of road
accident in our country are: drivers’
fault (77.91%), pedestrian fault/fault
of passengers (1.36%), mechanical
defect in vehicles (2.01), bad roads
(1.32%) and other factors like bad
weather, cattle coming in the way,
fallen trees, road blockage, absence
of rear reflectors. road signage, non-
functioning of road signals etc.
(17.40%).

GDP & Sustainable Transport
Contribution of the Transport Sector to GDP : 6.4%
Contribution alone by Road Sector : 5.4%
Loss of GDP on Road Crashes : 3%
Net GDP @ National : 2.4%
We are able to achieve 2.4% of GDP by giving the life of
0.15 million young Indian
Trends & Practices
Understanding Road Safety in Punjab..

2690
2638 2655
2580
2793
3060
3363 3333
3588
3424 3389
2000
2200
2400
2600
2800
3000
3200
3400
3600
3800
2001 2002 2003 2004 2005 2006 2007 2008 2009 2010 2011
Fata
l R
oad
Accid
en
t D
eath
s in
Pu
nja
b
Year
Road Fatalities Trend in Punjab (2001-11)
Punjab Infrastructure
Regulatory Authority
Privatization
Started
10%
-5%

Factor Responsible for Reduction in Road
Fatalities
Transport Policy
Fuel Price
Excise Policy
Land Price – Land Use
Road Infrastructure
Enforcement Level
Evacuation Mechanism : Post Crash Scenario (108 & 1073)
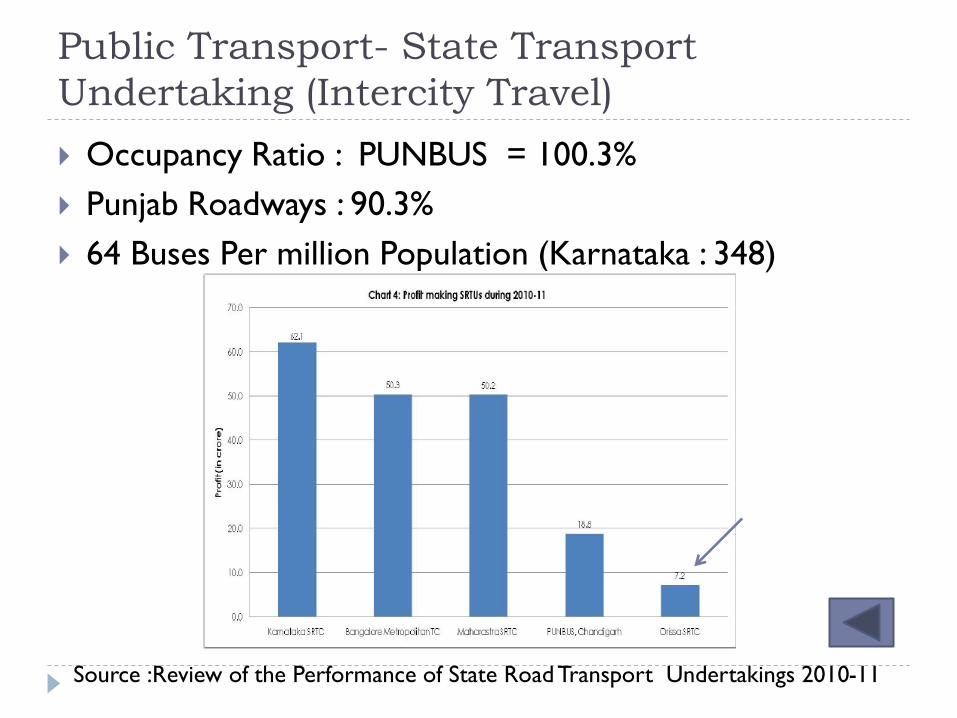
Public Transport- State Transport
Undertaking (Intercity Travel)
Occupancy Ratio : PUNBUS = 100.3%
Punjab Roadways : 90.3%
64 Buses Per million Population (Karnataka : 348)
Source :Review of the Performance of State Road Transport Undertakings 2010-11

Speed on Punjab State Road Sector Project
Source : Consultancy Services for Undertaking Road Surveys for Monitoring and Evaluation
of Project Indicators : Punjab Roads and Bridges Development Board
22,6 23,9 23,1
41,6 42,9 43,5
0
5
10
15
20
25
30
35
40
45
50
Upgradation Roads Rehabilitation Roads Periodic Maintenance
Roads
Avera
ge J
ou
rney S
peed
(km
/hr)
2005 2011

Fuel Pricing/Parking Policy
10% increase in fuel price typically reduces vehicle travel 2-3% (Johansson
and Schipper 1997; Goodwin, Dargay and Hanly 2004) so as Crashes and
Fatalities.

Punjab Road Network
Road Type Length in State Fatalities
Percentage
National Highways (NH) 1,739 Kms (2.79%) 36%
State Highways (SH) 1,503 Kms (2%) 46%
Major District Roads
(MDRs)
2,107 Kms
Other District Roads
(ODRs)
4,658 Kms
Link Roads (LR)
(PWD-27,229 Kms, PMB
– 26,801 Kms)
54,030 Kms
Total 62,298 Kms 83%
Urban; 1119;
35%
Rural; 2087;
65%
Rural Vs Urban Area Road Fatality Ratio

Traffic on different types of roads & fleet
composition in Punjab (2010)
5 3 6 3 11
32 35 31 35
10
41 43 41 42 74.1
15 12 14 13
3
0%
10%
20%
30%
40%
50%
60%
70%
80%
90%
100%
National
Highways
State Highways MDR ODR Modal Share
Bus Agro Car/Jeep/Taxi 2-W LCV, Truck Others

Registered Vehicle Vs. Involvement in Road
Crash
Buses
1%
Cars and
Station
Wagons
9%
Jeeps
1%
Taxis 0%
Three
Wheelers
1%
Two
Wheelers
76%
Four
Wheelers
Above
Trucks and
Lorries
3%
Three
Wheelers
0%
Tractor
9%
Others
0%
Two Wheelrs
15% Auto Rickshaw
2%
Car
19%
Jeep
8% Bus
11%
Truck
19%
Tractor
6%
Tempo
4%
Station Wagon
1%
Tractor
15%
Registered Vehicles (2011) Vehicle Involved in Crashes

Registered Motor Vehicles 2011
Year
Passenger Vehicle Goods Vehicles
Grand
Total Buses
Cars and
Station
Wagons Jeeps Taxis Three
Wheelers
Two
Wheeler
s
Trucks
and
Lorries
Three
Wheeler
s Tractor Others
2010-11 1317 40011 2410 1359 3554 376261 9812 0 5793 2227 442744
2010-11
(Cumulative) 28377 526681 57208 9393 61433 4332540 159179 20186 504310 12408 5711715
•Motor Vehicle Ration behind 1000 People is : 208
•19 people out of 1000 have Cars in Punjab
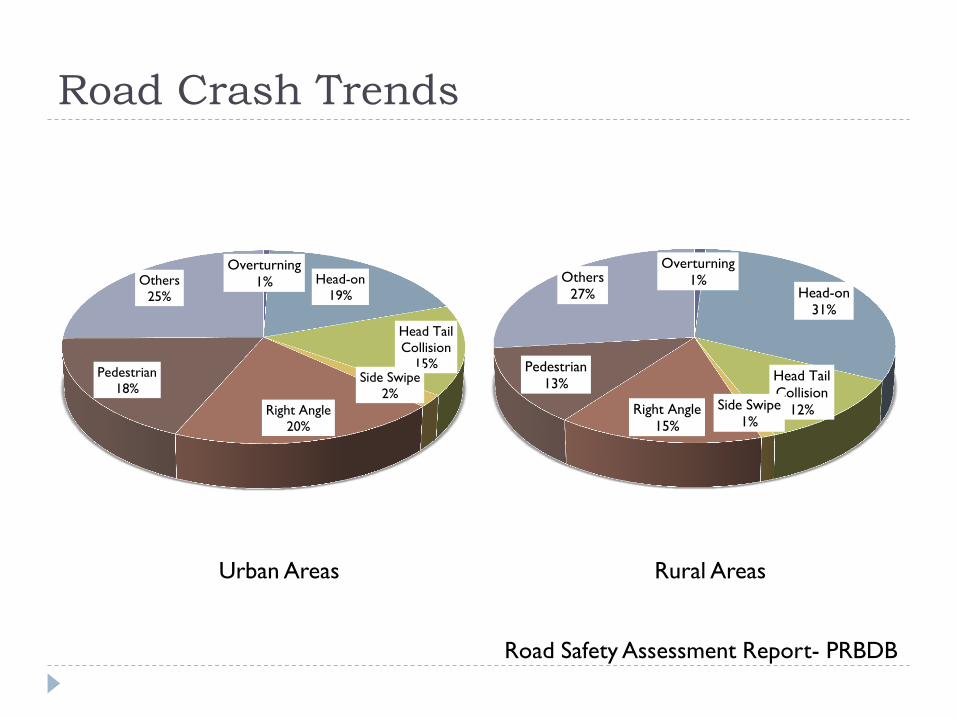
Road Crash Trends
Overturning
1% Head-on
19%
Head Tail
Collision 15%
Side Swipe
2%
Right Angle
20%
Pedestrian
18%
Others
25%
Road Safety Assessment Report- PRBDB
Urban Areas
Overturning
1% Head-on
31%
Head Tail
Collision
12% Side Swipe
1% Right Angle
15%
Pedestrian 13%
Others
27%
Rural Areas
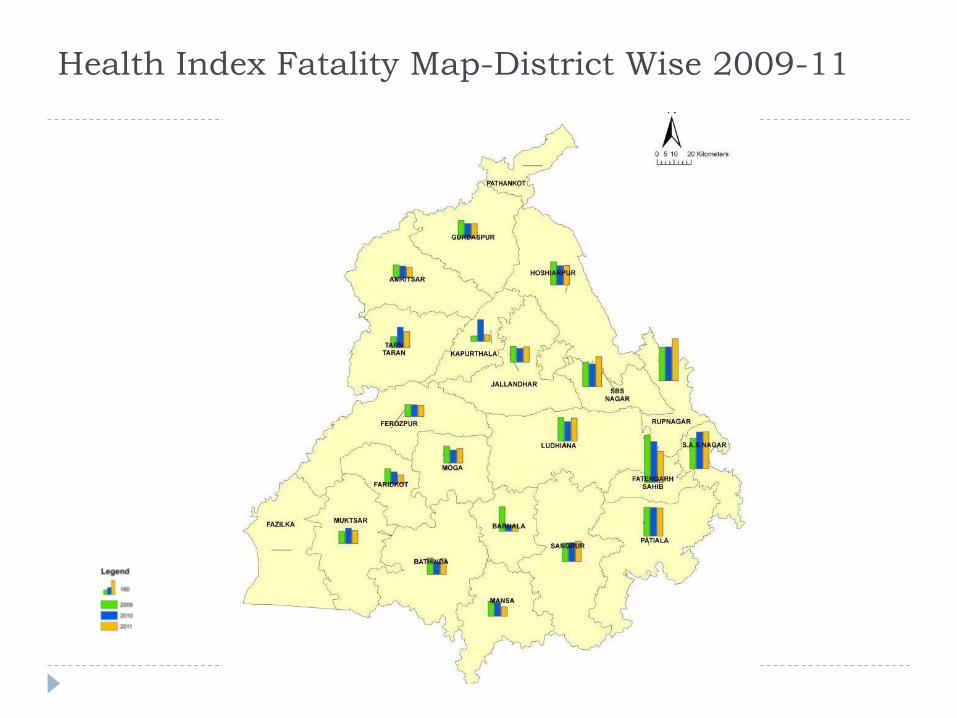
Health Index Fatality Map-District Wise 2009-11
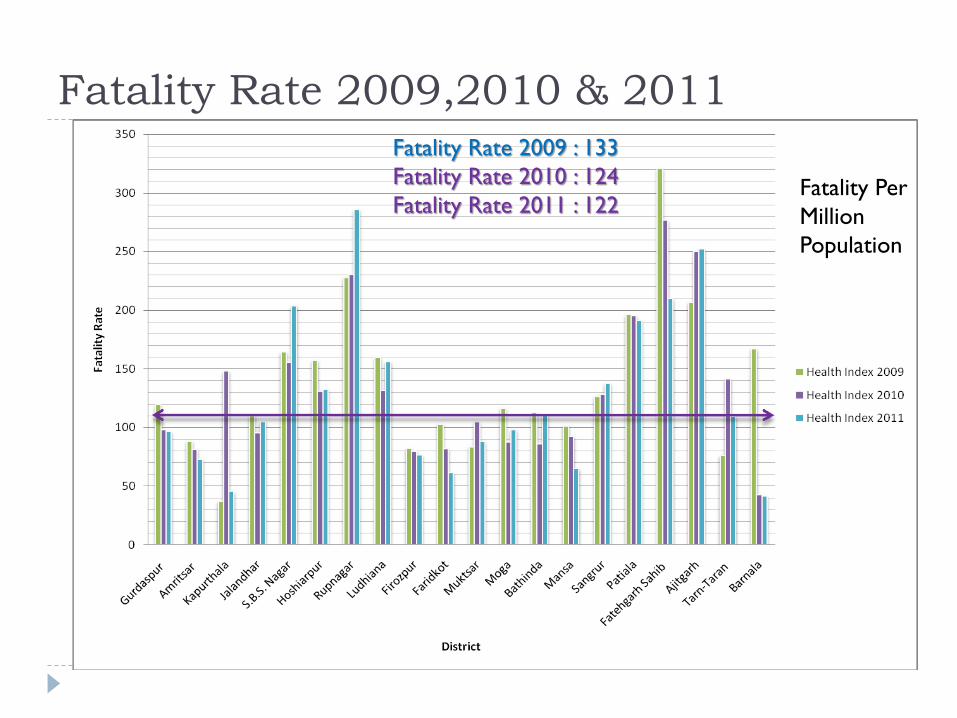
Fatality Rate 2009,2010 & 2011
Fatality Per
Million
Population
Fatality Rate 2009 : 133
Fatality Rate 2010 : 124
Fatality Rate 2011 : 122
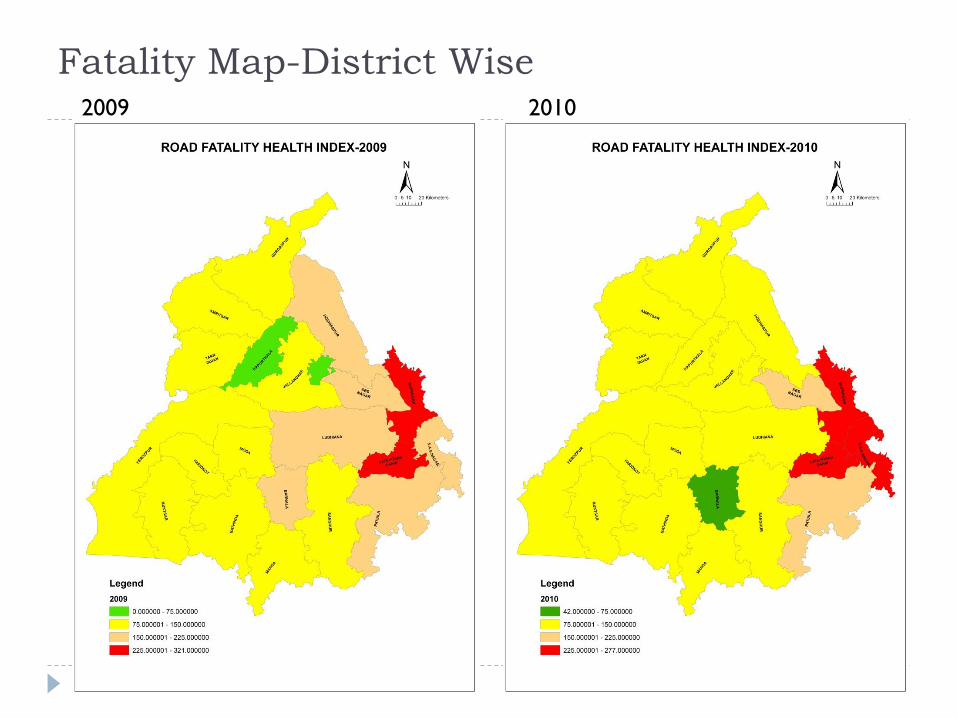
Fatality Map-District Wise 2009 2010

Fatality Map-District Wise 2011 2010
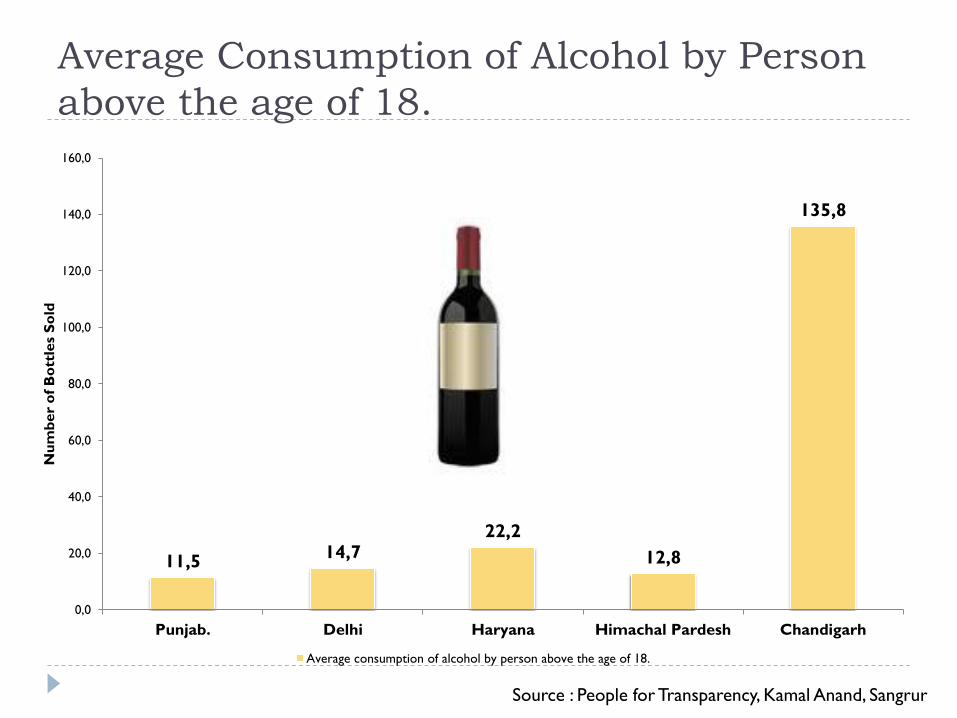
Average Consumption of Alcohol by Person
above the age of 18.
11,5 14,7
22,2
12,8
135,8
0,0
20,0
40,0
60,0
80,0
100,0
120,0
140,0
160,0
Punjab. Delhi Haryana Himachal Pardesh Chandigarh
Nu
mb
er
of
Bo
ttle
s S
old
Average consumption of alcohol by person above the age of 18.
Source : People for Transparency, Kamal Anand, Sangrur
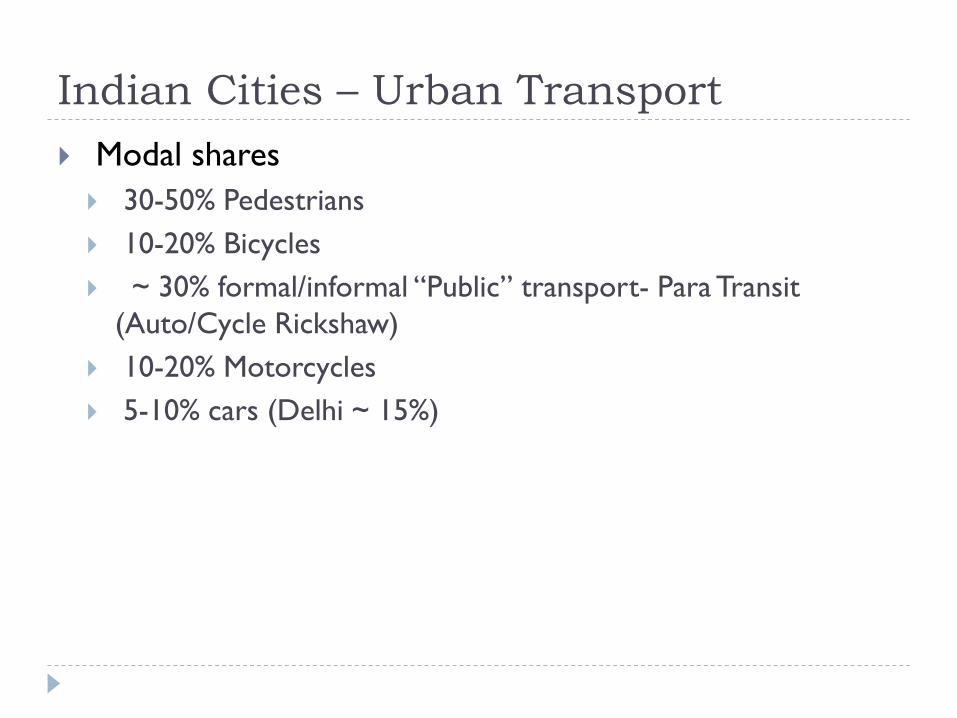
Indian Cities – Urban Transport
Modal shares
30-50% Pedestrians
10-20% Bicycles
~ 30% formal/informal “Public” transport- Para Transit
(Auto/Cycle Rickshaw)
10-20% Motorcycles
5-10% cars (Delhi ~ 15%)

Recognizing the Importance of Para Transit

Non Motor Transport
Motor Vehicles Non-Motor Transport
5,274,254 (2010)
5,71,1715 (2011) – 8% Growth 4,091,480
Animal Driven/Animal Slow Moving
Total NMT
Horses
and
Ponies Mules Donkey
Buffalo
(Male)
Cow
(Male) Camel
Cycle
Rickshaw
(Passenger)
Cycle Rickshaw
(Cargo)/Rehri
Rehri
(Four
Wheel) Bicycle
29810 96480 23390 85060 163130 21610 300000 120000 Unknown 3252000 4,091,480
Source :Statistical Abstract of Punjab 2010

Traffic Police
Enforcement…

About Police (Traffic Wing)
The Traffic Wing of Punjab was a separate wing till 1992. It was discontinued vide order No. 1/358/9141-11/SPL/3067 dated 03/08/1992.
The wing was revived in the year 2001 without creation of any new posts as it was ordered that it has to be staffed from within the existing resources.
There about 1950 people are managing the Traffic in
Punjab.
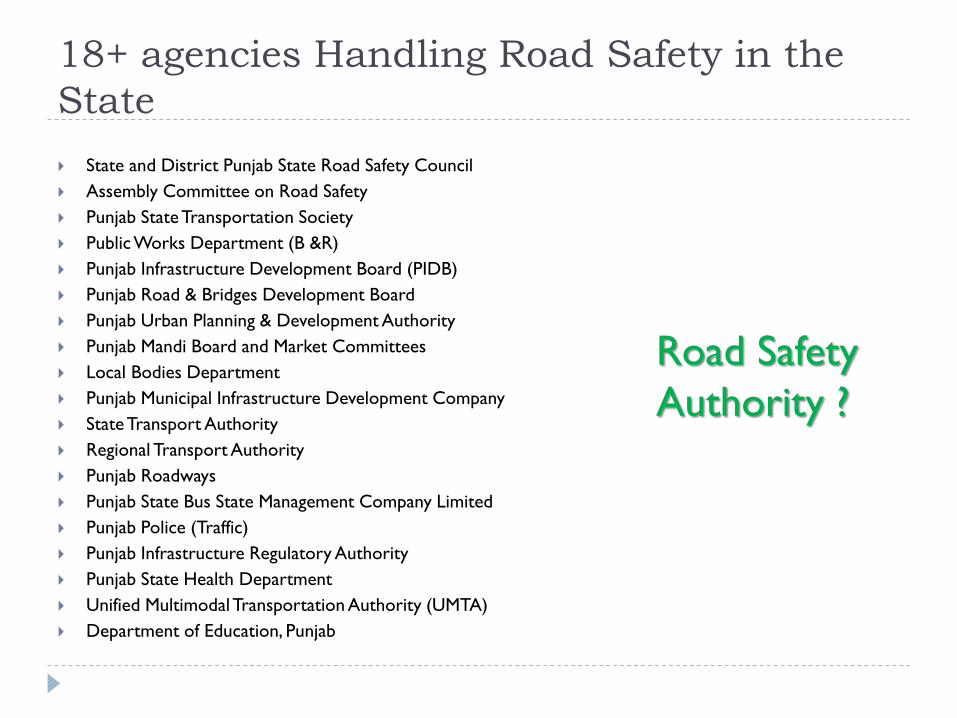
18+ agencies Handling Road Safety in the
State
State and District Punjab State Road Safety Council
Assembly Committee on Road Safety
Punjab State Transportation Society
Public Works Department (B &R)
Punjab Infrastructure Development Board (PIDB)
Punjab Road & Bridges Development Board
Punjab Urban Planning & Development Authority
Punjab Mandi Board and Market Committees
Local Bodies Department
Punjab Municipal Infrastructure Development Company
State Transport Authority
Regional Transport Authority
Punjab Roadways
Punjab State Bus State Management Company Limited
Punjab Police (Traffic)
Punjab Infrastructure Regulatory Authority
Punjab State Health Department
Unified Multimodal Transportation Authority (UMTA)
Department of Education, Punjab
Road Safety
Authority ?

Challans – Enforcement Drive
Type of Challans Number of
Challans Amount Collected (Rs)
2010 (Non-Compoundable)
2010 (Compoundable)
4,96,085
3,10,532 15,35,70,824.00
3,30,80,500.00
8,06,637 18,66,51,324.00
2011
(Non- Compoundable)
2011
(Compoundable)
6,18,352
3,60,362
16,20,74,960.00
3,81,42,540.00
9,78,714 20,02,17,500.00
January 2012 to July 2012 (Non-
Compoundable)
January 2012 to July 2012
(Compoundable)
4,01,754
2,30,276
12,05,29,483.00
2,97,50,409.00
6,32,030 15,02,79,892.00

Moving vs. Static Violations
Static
Moving
Total Challans
9,42,043 (2011)
Drink and Drive = 0.2% (1049)
Over speeding = 0.5% (2699)
Moving Violations
Static Violations

Legal Framework Courtesy : ArriveSafe, Chandigarh
Amendments in Motor Vehicle Act

Legal Framework : 174 CrPC, 304, 304A
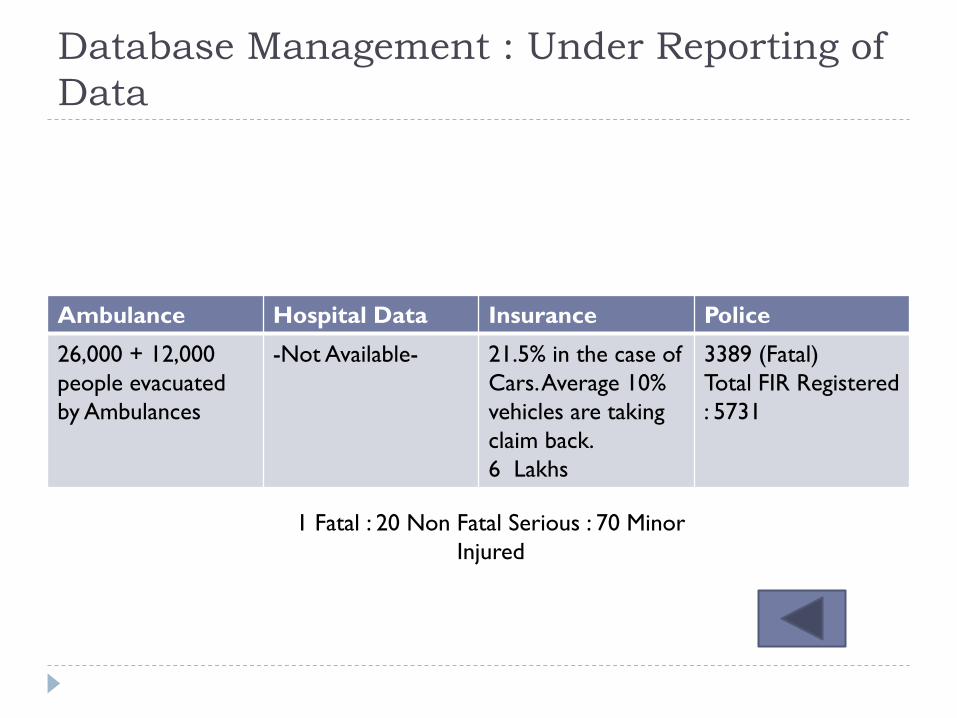
Database Management : Under Reporting of
Data
Ambulance Hospital Data Insurance Police
26,000 + 12,000
people evacuated
by Ambulances
-Not Available- 21.5% in the case of
Cars. Average 10%
vehicles are taking
claim back.
6 Lakhs
3389 (Fatal)
Total FIR Registered
: 5731
1 Fatal : 20 Non Fatal Serious : 70 Minor
Injured

Policies Vs Claim-Motor Insurance
215
33
98
42
72
31
108
44 40
207
113
0
50
100
150
200
250
Private Cars Two
wheelers
Goods
Carrying
Vehicles
(Public
Carriers -
other than
3 wheelers)
Goods
Carrying
Vehicles
(Private
Carriers -
other than
3 wheelers)
Goods
Carrying
Vehicles
(Public
Carriers -3
wheelers)
Goods
Carrying
Vehicles
(Private
Carriers-3
wheelers)
Passengers
Carrying
Vehicles -4
wheelers
Passengers
Carrying
Vehicles -3
wheelers
Special
Type of
Vehicles
Motor
Trade
(Road Risk
only)
Others
Claim/Policy Ratio (per 1000 vehicle)
Year 2009-10
Source :IRDA
Key Interventions
Actions
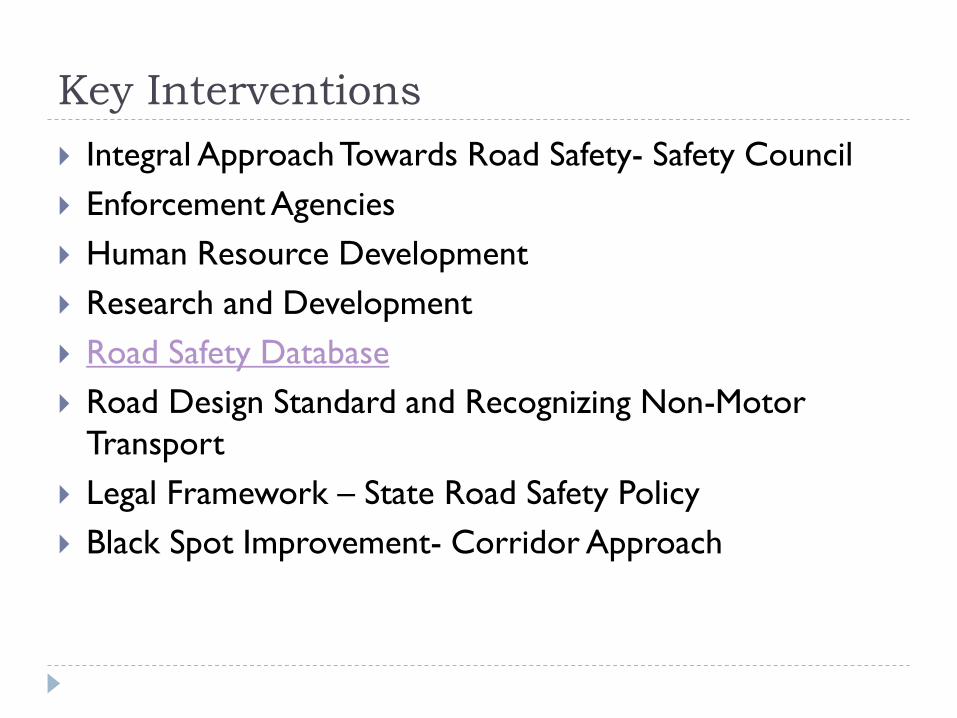
Key Interventions
Integral Approach Towards Road Safety- Safety Council
Enforcement Agencies
Human Resource Development
Research and Development
Road Safety Database
Road Design Standard and Recognizing Non-Motor
Transport
Legal Framework – State Road Safety Policy
Black Spot Improvement- Corridor Approach

Road Crash Database Management: Integrated Data
Evaluation System on Accidents
www.punjabroadsafey.org
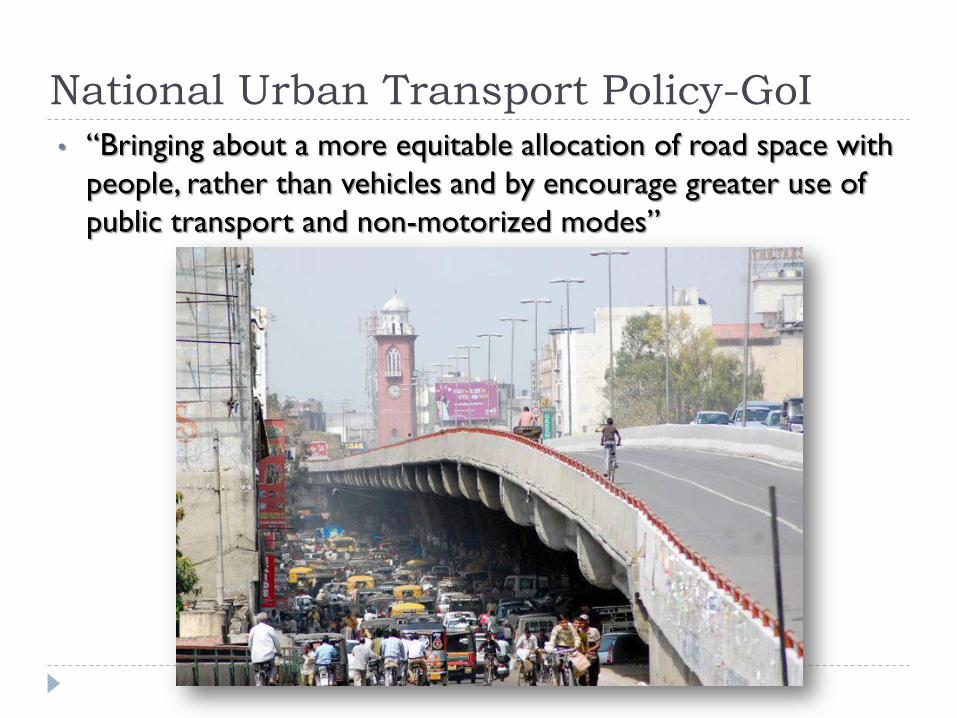
National Urban Transport Policy-GoI
• “Bringing about a more equitable allocation of road space with
people, rather than vehicles and by encourage greater use of
public transport and non-motorized modes”

NMT Inclusion : Approach to Golden Temple,
Amritsar- Before
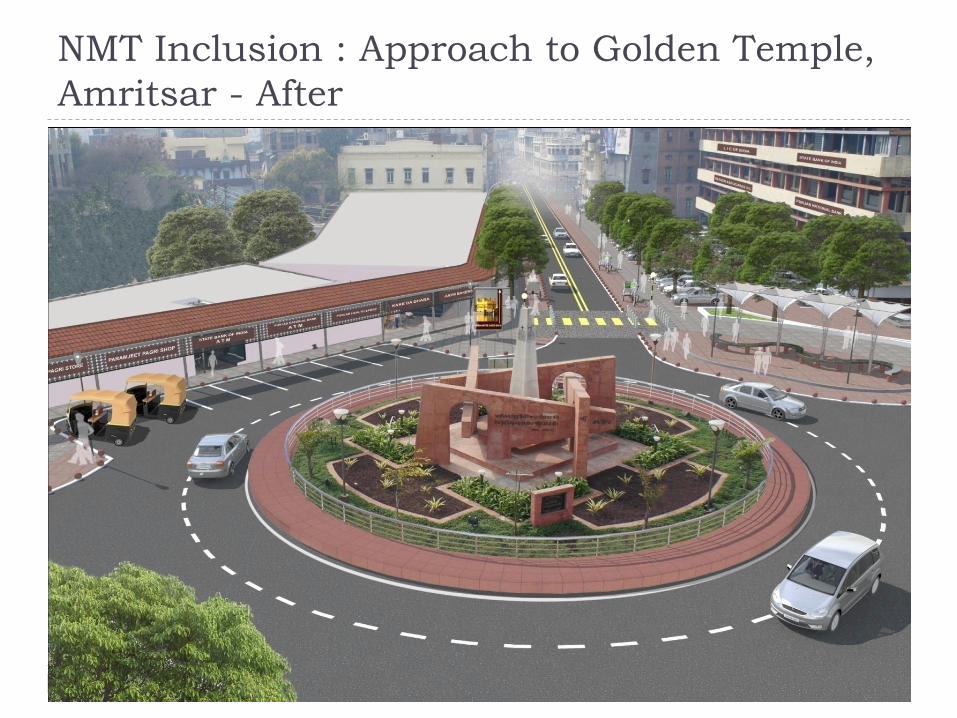
NMT Inclusion : Approach to Golden Temple,
Amritsar - After

Near Bharawan Da Dhaba,Amritsar- Present

Near Bharawan Da Dhaba,Amritsar- After
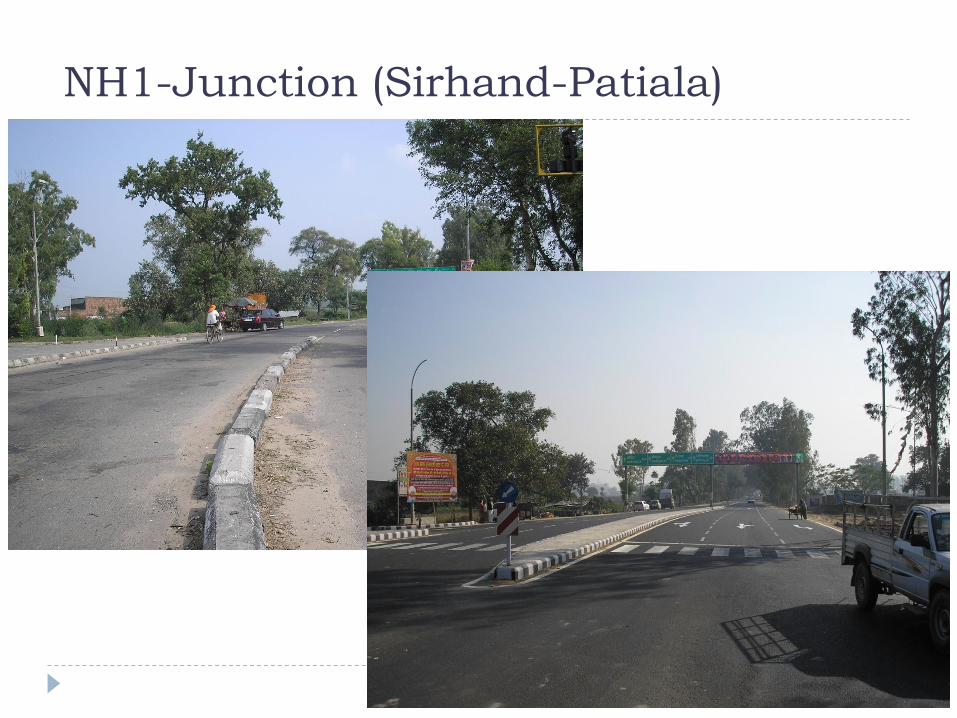
NH1-Junction (Sirhand-Patiala)

More View of NH Junction Improvement

6-2 Lane Converging Section
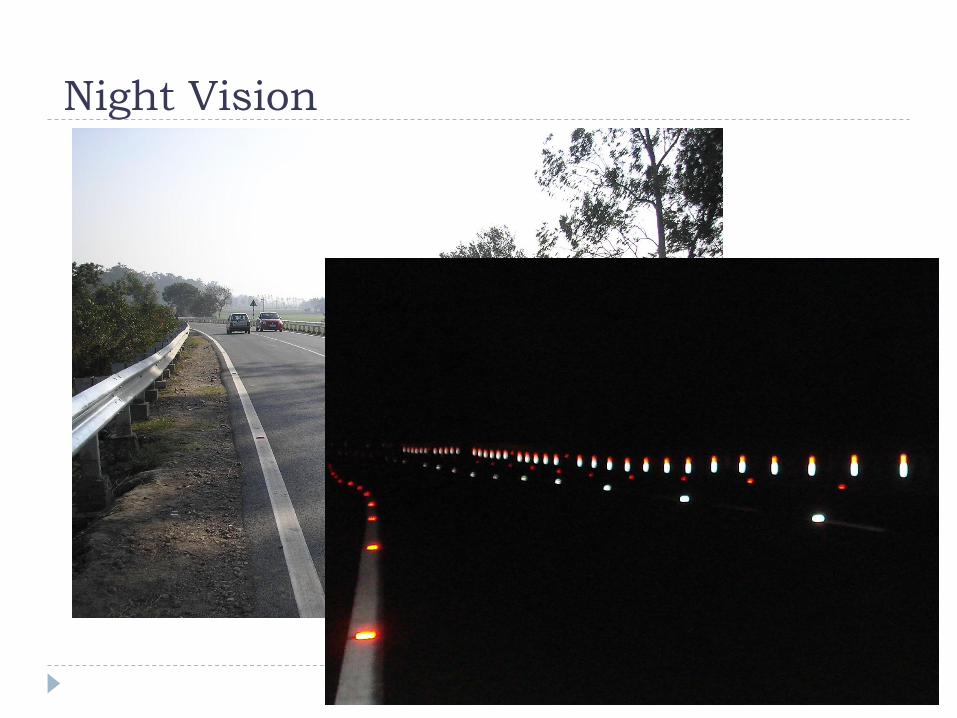
Night Vision

Khanpur Junction near Chandigarh
One Fatality Per Month
Zero Fatality : Three Months Observation
Thank You


