20
Purchasers’ Path to Promoting Higher Value in Health Care Peter V. Lee Pacific Business Group on Health Citizens’ Health Care Working Group – Salt Lake City, Utah July 22, 2005
| Date post: | 17-Dec-2015 |
| Category: |
Documents |
| Upload: | allan-dawson |
| View: | 220 times |
| Download: | 0 times |

Purchasers’ Path to Promoting Higher Value in Health Care
Peter V. LeePacific Business Group on Health
Citizens’ Health Care Working Group – Salt Lake City, UtahJuly 22, 2005
2
Pacific Business Group on Health: Mission and Priorities
Quality Measurement and Improvement
Value PurchasingConsumer Engagement
Mission: To improve the quality and availability of health care while moderating costs.
3
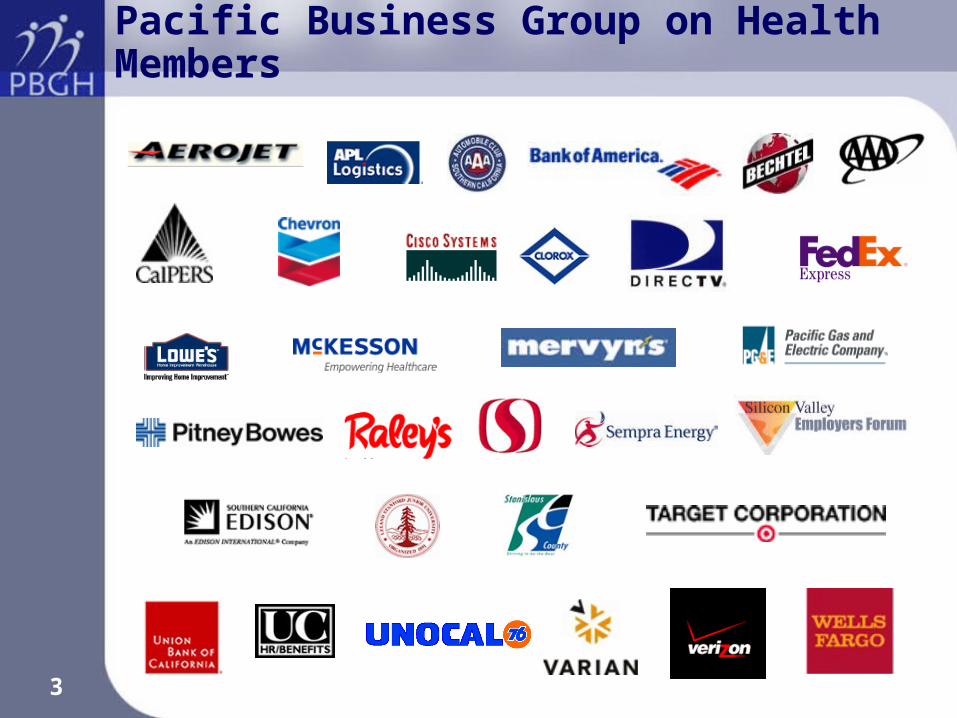
Pacific Business Group on Health Members
4
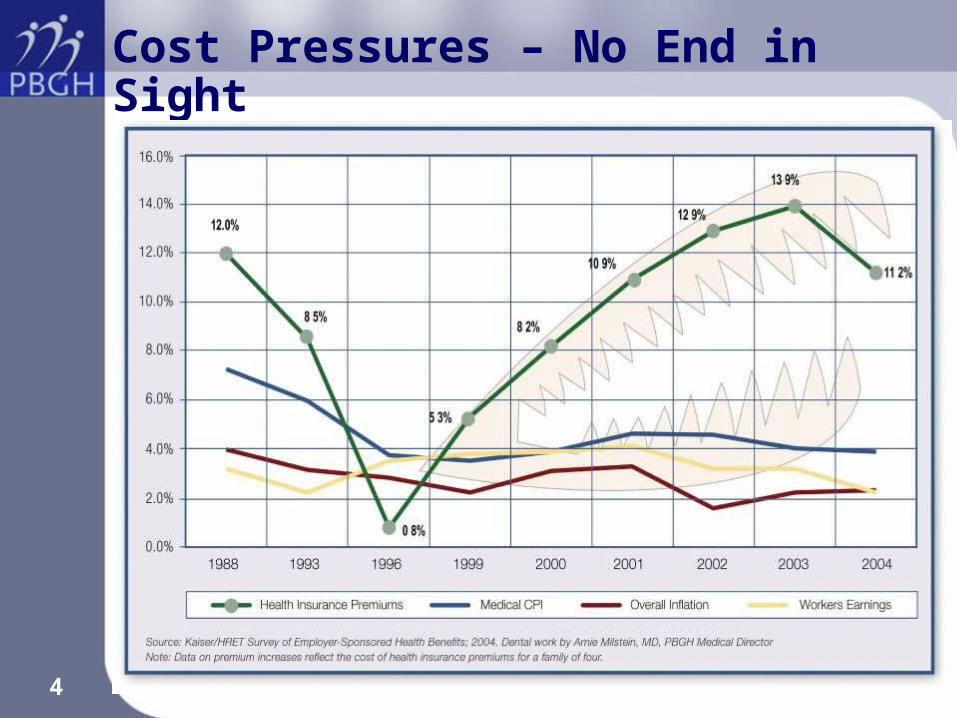
Cost Pressures – No End in Sight
5
Adherence to Quality Indicators
10.5%
22.8%
32.7%
40.7%
45.2%
45.4%
48.6%
53.0%
53.5%
53.9%
57.2%
57.7%
63.9%
64.7%
68.0%
68.5%
73.0%
75.7%
0% 20% 40% 60% 80% 100%
Alcohol Dependence
Hip Fracture
Ulcers
Urinary Tract Infection
Headache
Diabetes Mellitus
Hyperlipidemia
Benign Prostatic Hyperplasia
Asthma
Colorectal Cancer
Orthopedic Conditions
Depression
Congestive Heart Failure
Hypertension
Coronary Artery Disease
Low Back Pain
Prenatal Care
Breast Cancer
Percentage of Recommended Care Received
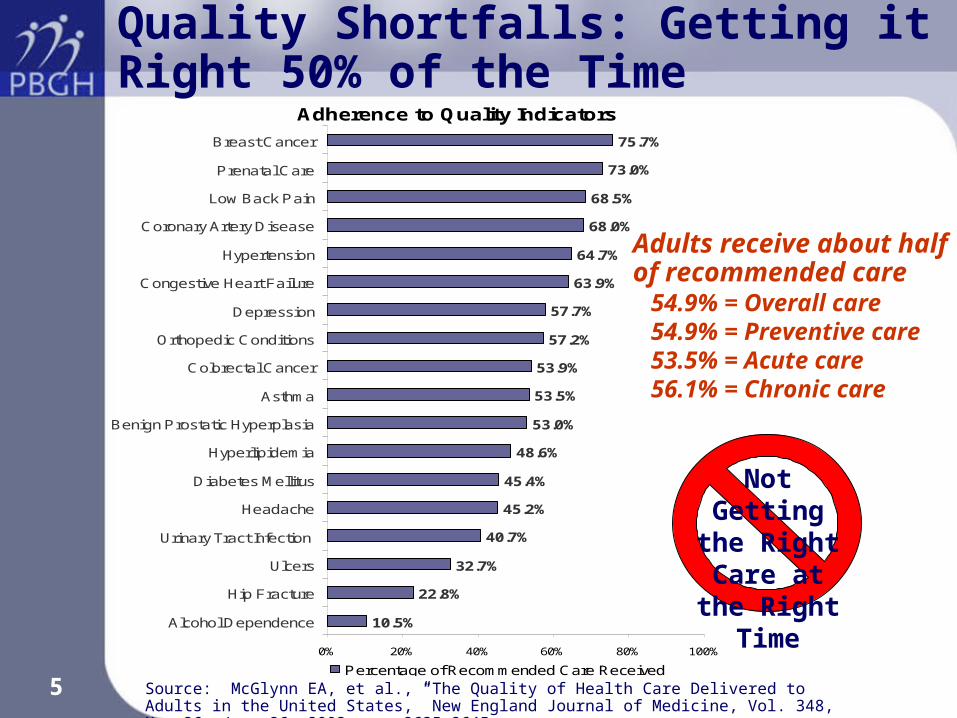
Quality Shortfalls: Getting it Right 50% of the Time
Adults receive about half of recommended care
54.9% = Overall care 54.9% = Preventive care 53.5% = Acute care56.1% = Chronic care
Not Getting the Right
Care at the Right Time
Source: McGlynn EA, et al., “The Quality of Health Care Delivered to Adults in the United States,” New England Journal of Medicine, Vol. 348, No. 26, June 26, 2003, pp. 2635-2645
6
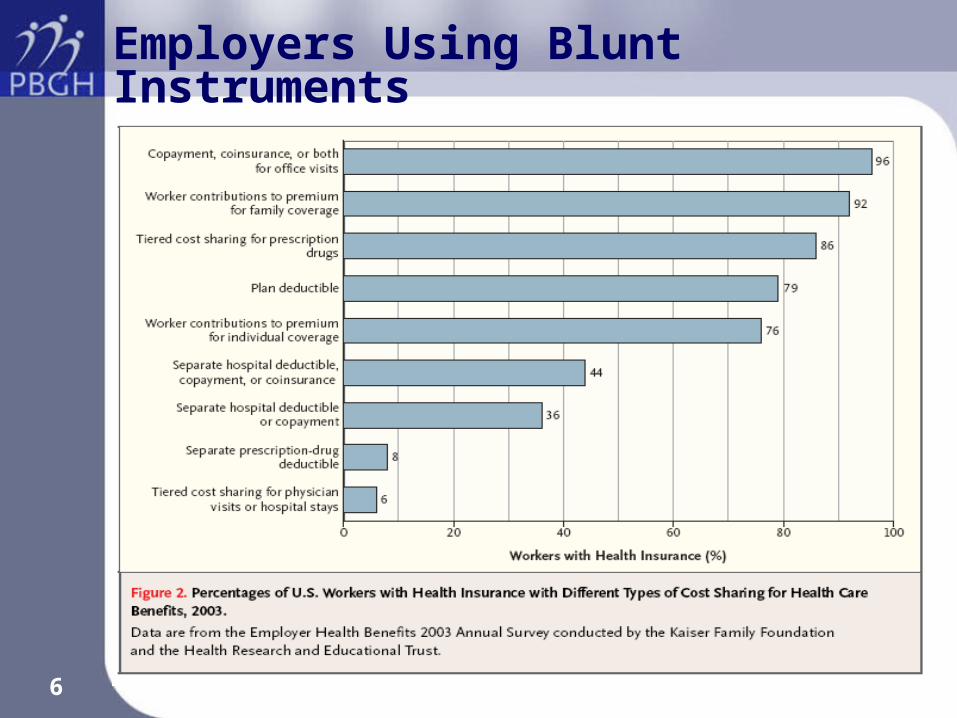
Employers Using Blunt Instruments
7
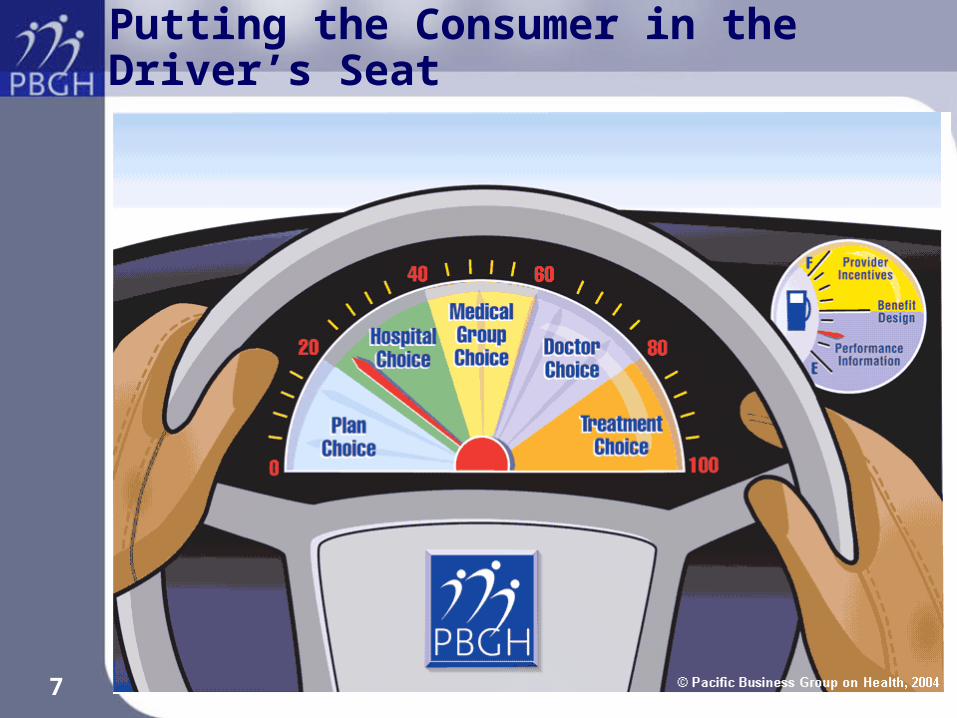
Putting the Consumer in the Driver’s Seat
8
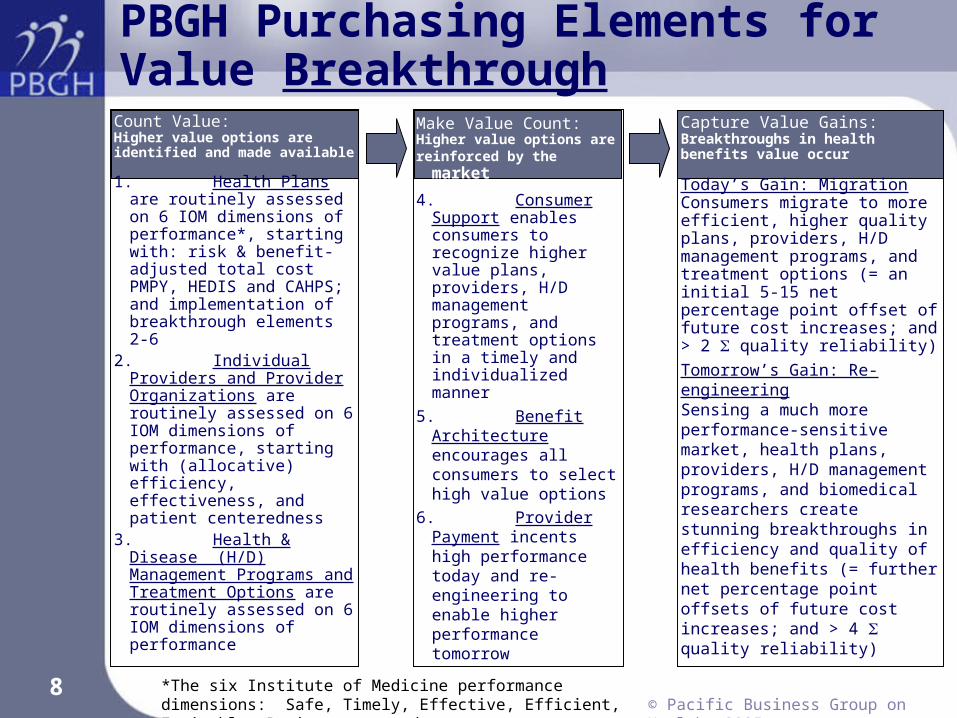
PBGH Purchasing Elements for Value Breakthrough
*The six Institute of Medicine performance dimensions: Safe, Timely, Effective, Efficient, Equitable, Patient-centered © Pacific Business Group on Health,
2005
Count Value:Higher value options areidentified and made available
1. Health Plans are routinely assessed on 6 IOM dimensions of performance*, starting with: risk & benefit-adjusted total cost PMPY, HEDIS and CAHPS; and implementation of breakthrough elements 2-6
2. Individual Providers and Provider Organizations are routinely assessed on 6 IOM dimensions of performance, starting with (allocative) efficiency, effectiveness, and patient centeredness
3. Health & Disease (H/D) Management Programs and Treatment Options are routinely assessed on 6 IOM dimensions of performance
Make Value Count:Higher value options arereinforced by the market
4. Consumer Support enables consumers to recognize higher value plans, providers, H/D management programs, and treatment options in a timely and individualized manner
5. Benefit Architecture encourages all consumers to select high value options
6. Provider Payment incents high performance today and re-engineering to enable higher performance tomorrow
Capture Value Gains:Breakthroughs in health benefits value occur
Today’s Gain: MigrationConsumers migrate to more efficient, higher quality plans, providers, H/D management programs, and treatment options (= an initial 5-15 net percentage point offset of future cost increases; and > 2 quality reliability)
Tomorrow’s Gain: Re-engineeringSensing a much more performance-sensitive market, health plans, providers, H/D management programs, and biomedical researchers create stunning breakthroughs in efficiency and quality of health benefits (= further net percentage point offsets of future cost increases; and > 4 quality reliability)
9
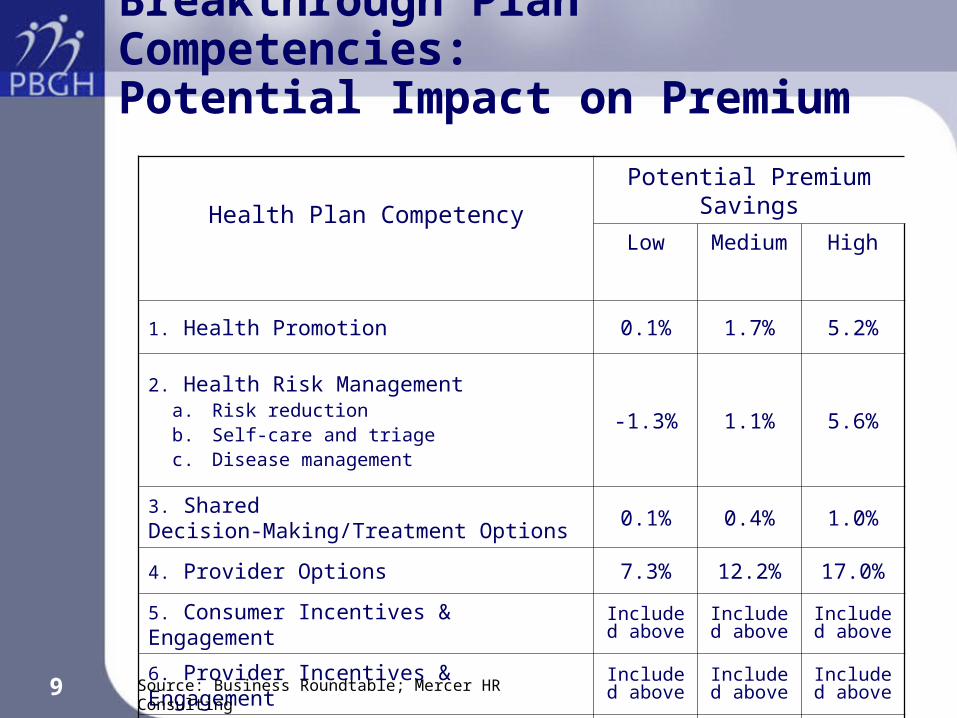
Breakthrough Plan Competencies: Potential Impact on Premium
Health Plan Competency
Potential Premium Savings
Low Medium High
1. Health Promotion 0.1% 1.7% 5.2%
2. Health Risk Managementa. Risk reductionb. Self-care and triagec. Disease management
-1.3% 1.1% 5.6%
3. Shared Decision-Making/Treatment Options 0.1% 0.4% 1.0%
4. Provider Options 7.3% 12.2% 17.0%
5. Consumer Incentives & EngagementIncluded above
Included above
Included above
6. Provider Incentives & EngagementIncluded above
Included above
Included above
TOTAL PREMIUM VALUE 6.2% 15.4% 28.8%
Source: Business Roundtable; Mercer HR Consulting
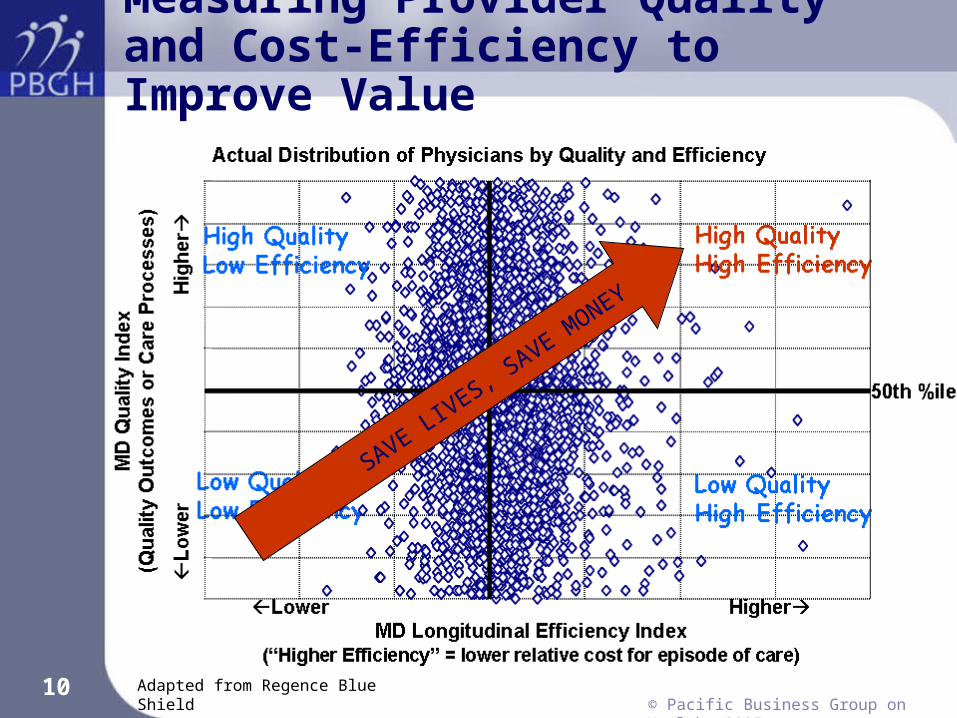
10 Adapted from Regence Blue Shield© Pacific Business Group on Health, 2005
SAVE LIVES, S
AVE MONEY
Measuring Provider Quality and Cost-Efficiency to Improve Value
11
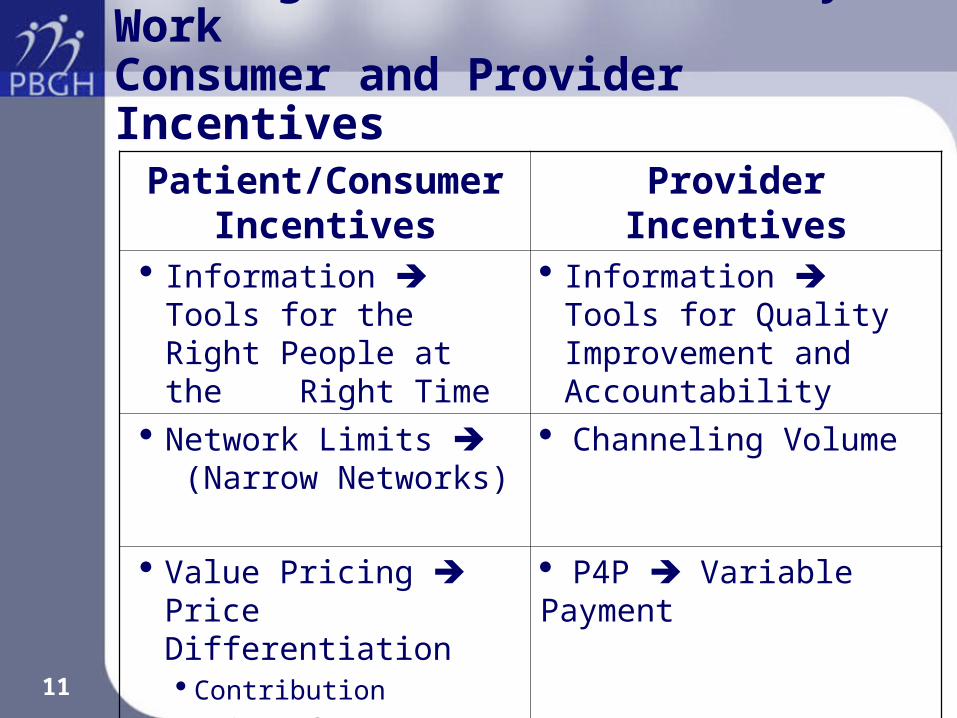
Putting Information & Money to WorkConsumer and Provider Incentives
Patient/Consumer Incentives
Provider Incentives
Information Tools for the Right People at the Right Time
Information Tools for Quality Improvement and Accountability
Network Limits (Narrow Networks)
Channeling Volume
Value Pricing Price Differentiation Contribution Point of Care
P4P Variable Payment
12
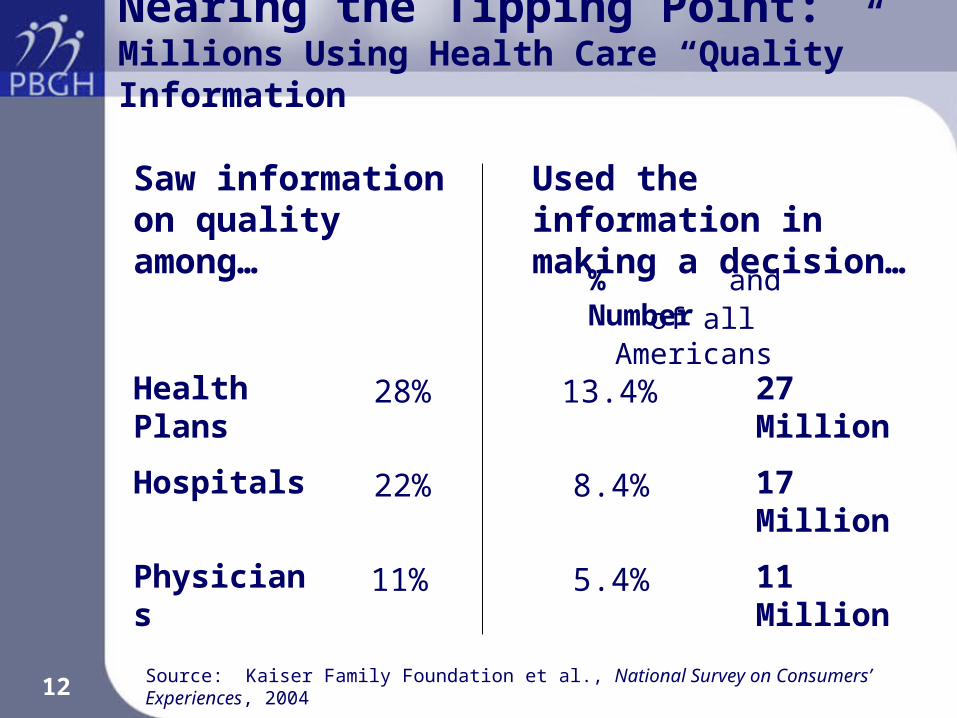
Nearing the Tipping Point:Millions Using Health Care “Quality” Information
Saw information on quality among…
Used the information in making a decision…
Physicians 11% 5.4% 11 Million
Hospitals 22% 8.4% 17 Million
Health Plans 28% 13.4% 27 Million
Source: Kaiser Family Foundation et al., National Survey on Consumers’ Experiences, 2004
of all Americans% and Number
13
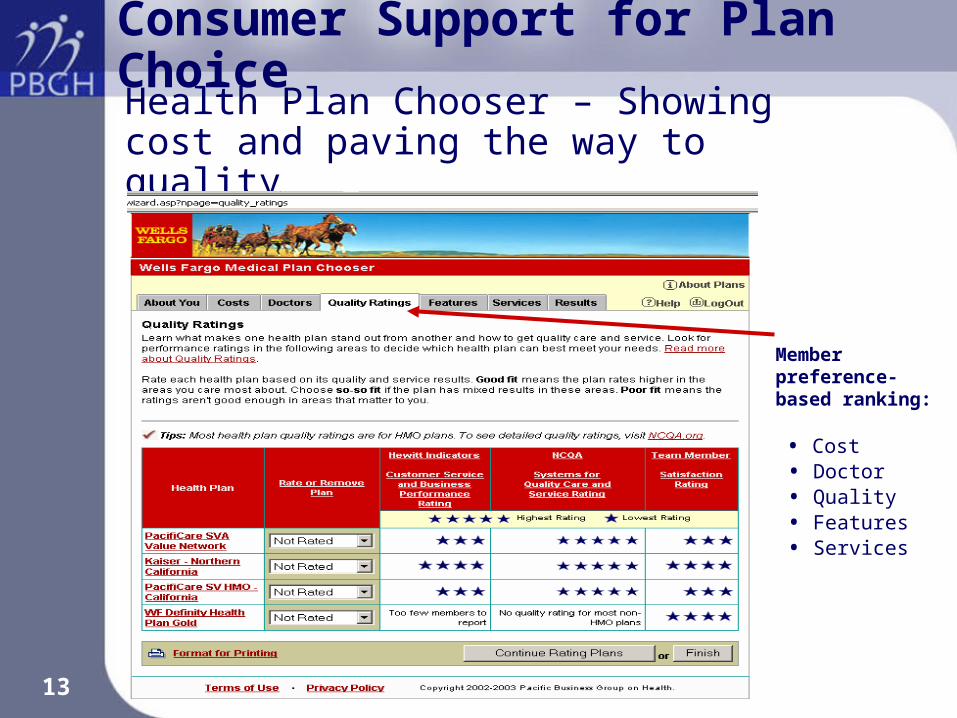
Health Plan Chooser – Showing cost and paving the way to quality
Consumer Support for Plan Choice
Member preference-based ranking:
• Cost • Doctor • Quality • Features • Services

CONFIDENTIAL14
Salary Level
<$40K $40-$80K & retirees
$80-$120K $120K plus
Health Net Monthly $$
$36 $86 $141 $187
% of Pay 1.3% 1.8% 1.8% 1.5%
Blue Cross Monthly $$
$172 $215 $274 $320
% of Pay 6.3% 4.5% 3.4% 2.6%
Source: University of California 2004
Supporting Equity:UC Employee’s Family Plan Cost
Consumer Incentives for Plan Choice

15
Hospital Choice Tools • Hospital quality linked to treatment choice information • Network, cost and quality information linked to tiered benefit design
Member preference-based ranking:
• Volume • Mortality • Complications • Length of Stay • Leapfrog • Cost • Patient Experience
Consumer Support for Hospital Choice
16
Rel
ati
ve
co
st
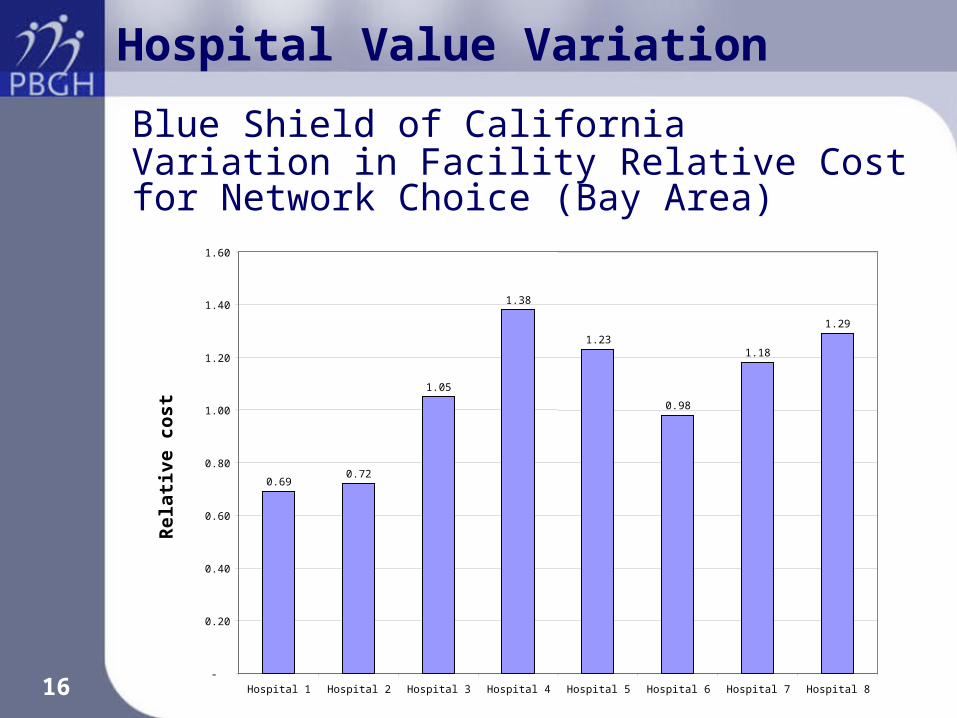
0.690.72
1.05
1.38
1.23
0.98
1.18
1.29
-
0.20
0.40
0.60
0.80
1.00
1.20
1.40
1.60
Hospital 1 Hospital 2 Hospital 3 Hospital 4 Hospital 5 Hospital 6 Hospital 7 Hospital 8
Blue Shield of California Variation in Facility Relative Cost for Network Choice (Bay Area)
Hospital Value Variation
17
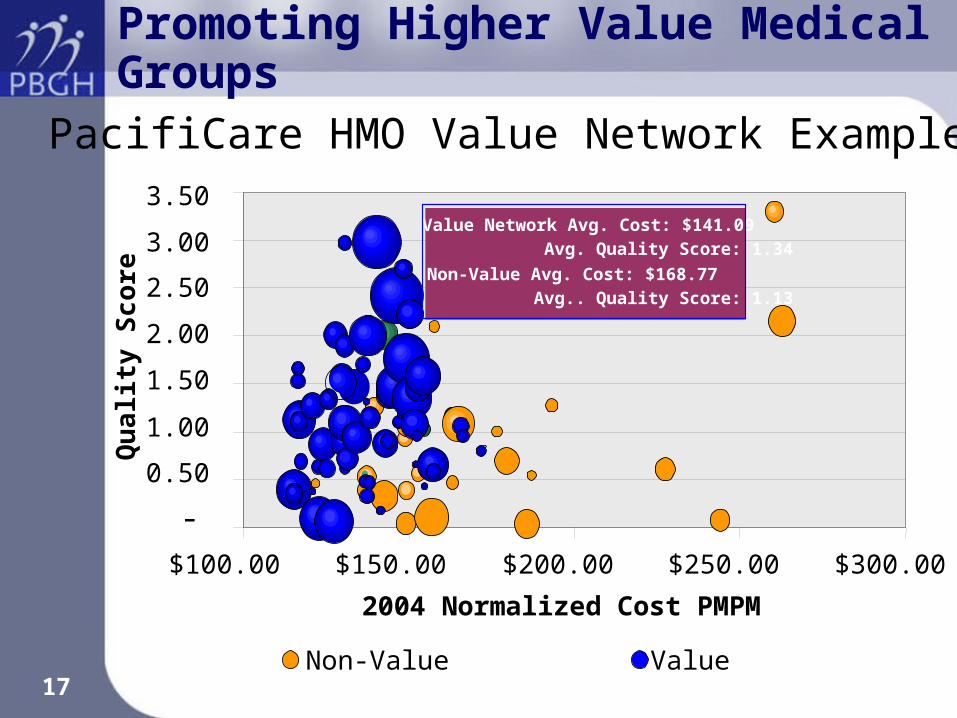
PacifiCare HMO Value Network Example
-
0.50
1.00
1.50
2.00
2.50
3.00
3.50
$100.00 $150.00 $200.00 $250.00 $300.00
2004 Normalized Cost PMPM
Qu
alit
y S
core
Non-Value Value
Value Network Avg. Cost: $141.09 Avg. Quality Score: 1.34
Non-Value Avg. Cost: $168.77 Avg.. Quality Score: 1.13
Promoting Higher Value Medical Groups
18
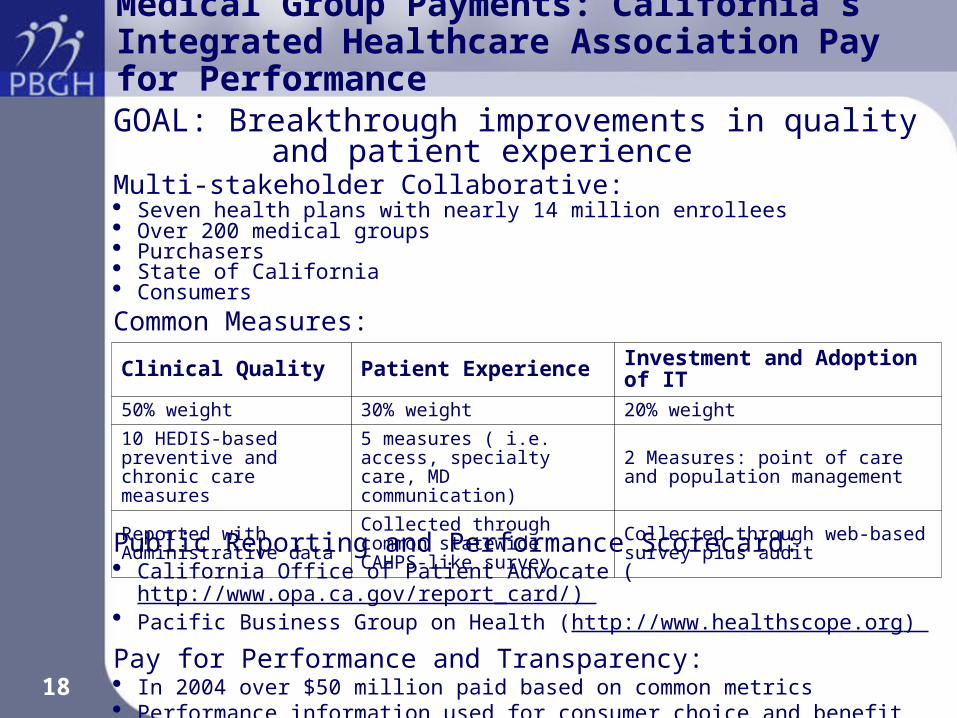
Medical Group Payments: California’s Integrated Healthcare Association Pay for Performance
GOAL: Breakthrough improvements in quality and patient experience
Multi-stakeholder Collaborative: Seven health plans with nearly 14 million enrollees Over 200 medical groups Purchasers State of California Consumers
Common Measures:Clinical Quality Patient Experience Investment and Adoption of IT50% weight 30% weight 20% weight
10 HEDIS-based preventive and chronic care measures
5 measures ( i.e. access, specialty care, MD communication)
2 Measures: point of care and population management
Reported with Administrative data
Collected through common statewide CAHPS-like survey
Collected through web-based survey plus audit
Public Reporting and Performance Scorecard: California Office of Patient Advocate (http://www.opa.ca.gov/report_card/) Pacific Business Group on Health (http://www.healthscope.org)
Pay for Performance and Transparency: In 2004 over $50 million paid based on common metrics Performance information used for consumer choice and benefit design
19
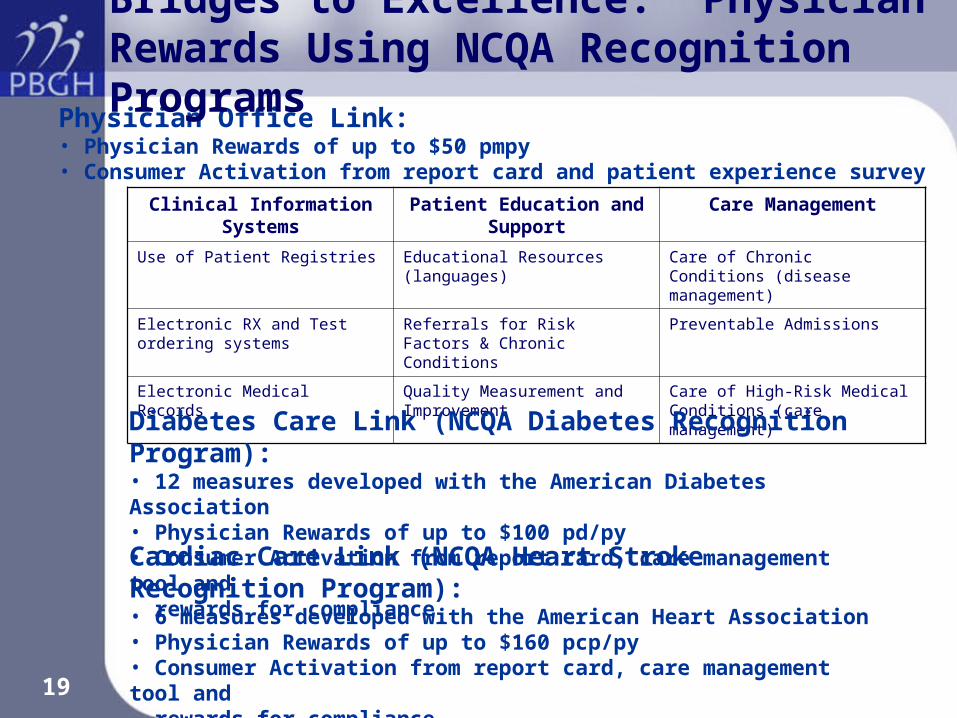
Clinical Information Systems
Patient Education and Support
Care Management
Use of Patient Registries Educational Resources (languages)
Care of Chronic Conditions (disease management)
Electronic RX and Test ordering systems
Referrals for Risk Factors & Chronic Conditions
Preventable Admissions
Electronic Medical Records Quality Measurement and Improvement
Care of High-Risk Medical Conditions (care management)
Physician Office Link: • Physician Rewards of up to $50 pmpy• Consumer Activation from report card and patient experience survey
Bridges to Excellence: Physician Rewards Using NCQA Recognition Programs
Diabetes Care Link (NCQA Diabetes Recognition Program):• 12 measures developed with the American Diabetes Association• Physician Rewards of up to $100 pd/py• Consumer Activation from report card, care management tool and rewards for compliance
Cardiac Care Link (NCQA Heart Stroke Recognition Program):• 6 measures developed with the American Heart Association• Physician Rewards of up to $160 pcp/py• Consumer Activation from report card, care management tool and rewards for compliance
20
PBGH & Where to Get More Information
To Learn More…
www.pbgh.org — an overview of PBGH programs and initiatives
www.HealthScope.org — consumer Web site with health plan and provider quality measurements
www.PacAdvantage.org — small group purchasing pool
http://chooser.pacadvantage.org — sample site to assist enrollees in plan selection
To subscribe to the PBGH E-Letter, go to www.pbgh.org/news/eletters


