27
| Date post: | 02-Jan-2016 |
| Category: |
Documents |
| Upload: | zeph-flowers |
| View: | 16 times |
| Download: | 0 times |

204-052-dp
PurposePurpose
• To survey the economic literature regarding North American (NA) integration in the agri-food sector– To summarize the lessons learned so far
– To identify knowledge gaps and suggest areas for future research
• Structure of presentation

304-052-dp
How useful are trade statistics as indicators of integration?How useful are trade statistics as indicators of integration?
• Generally provide good insights– Detailed information on volume, value, and commodity composition
of trade over time
– Lacks the precision of price-based studies
• Quality of data has improved but is still not superior– Unnerving differences between US and Mexican statistics
– Similar differences existed between US and Canadian statistics prior to initiation of joint data collection in 1990

404-052-dp
Continental agri-food trade has grown tremendously over CUSTA/NAFTA period
Billions of U.S. Dollars
0
2
4
6
8
10
12
1991 1992 1993 1994 1995 1996 1997 1998 1999 2000 2001 2002
U.S. Exports to Canada
Canadian Exports to U.S.
US Exports to Mexico
Mexican Exports to U.S.
Canadian Exports to Mexico
Mexican Exports to Canada

504-052-dp
Agricultural exports to the rest of the world have experienced modest growth over the same period
Billions of U.S. Dollars
0
10
20
30
40
50
60
1991 1992 1993 1994 1995 1996 1997 1998 1999 2000 2001 2002
U.S. Exports to ROW
Mexican Exports to ROW
Canadian Exports to ROW
Intra-NAFTA trade

604-052-dp
Canada and the US have become more dependent on their NAFTA partners, Mexico more diversified
Percent of total exports
46
20
88
66
29
85
0
10
20
30
40
50
60
70
80
90
100
Canada U.S. Mexico
1991-1993
2000-2002
North American Share of Agriculture and Agri-Food Exports

704-052-dp
Mexico’s main agricultural exports to the US reflect Mexico’s comparative advantages
Annual avg., millions USD
4
322
923
145
749
1949
879
0
500
1000
1500
2000
2500
Fruits Vegetables Beer
1991-1993
2000-2002

804-052-dp
Similarly, the main US agricultural exports to Mexico are indicative of the comparative advantages of US agriculture
Annual avg., millions USD
4
219
896
231
744
1932
786
0
500
1000
1500
2000
2500
Beef and beef varietymeats
Grains and feeds Fruits and vegetables
1991-1993
2000-2002
904-052-dp
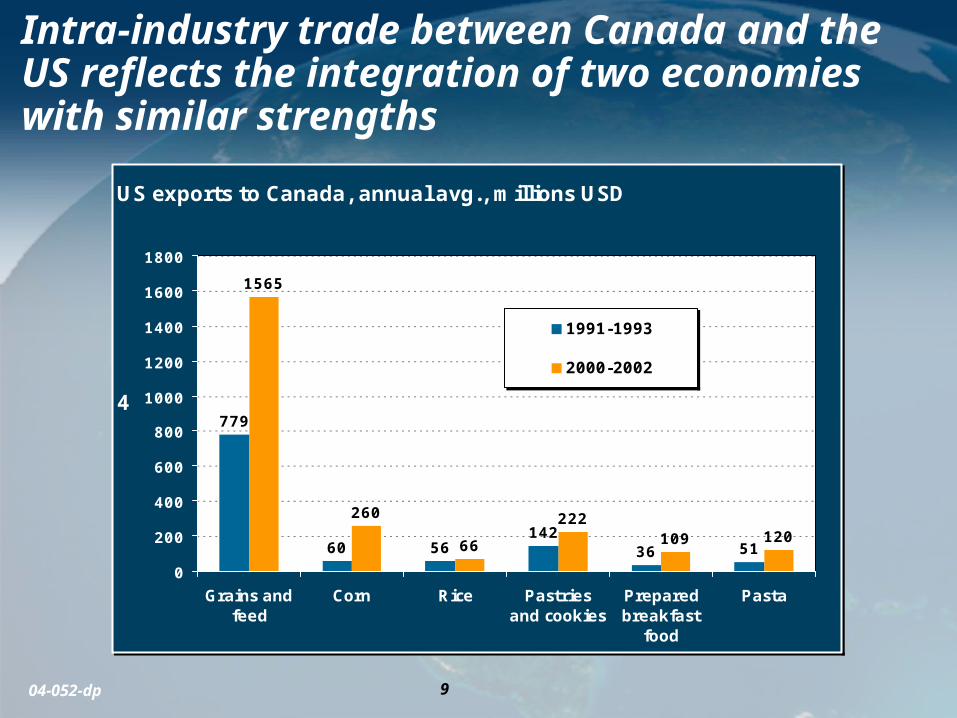
Intra-industry trade between Canada and the US reflects the integration of two economies with similar strengths
US exports to Canada, annual avg., millions USD
4779
60 56142
36 51
1565
260
66
222109 120
0
200
400
600
800
1000
1200
1400
1600
1800
Grains andfeed
Corn Rice Pastriesand cookies
Preparedbreakfast
food
Pasta
1991-1993
2000-2002
1004-052-dp
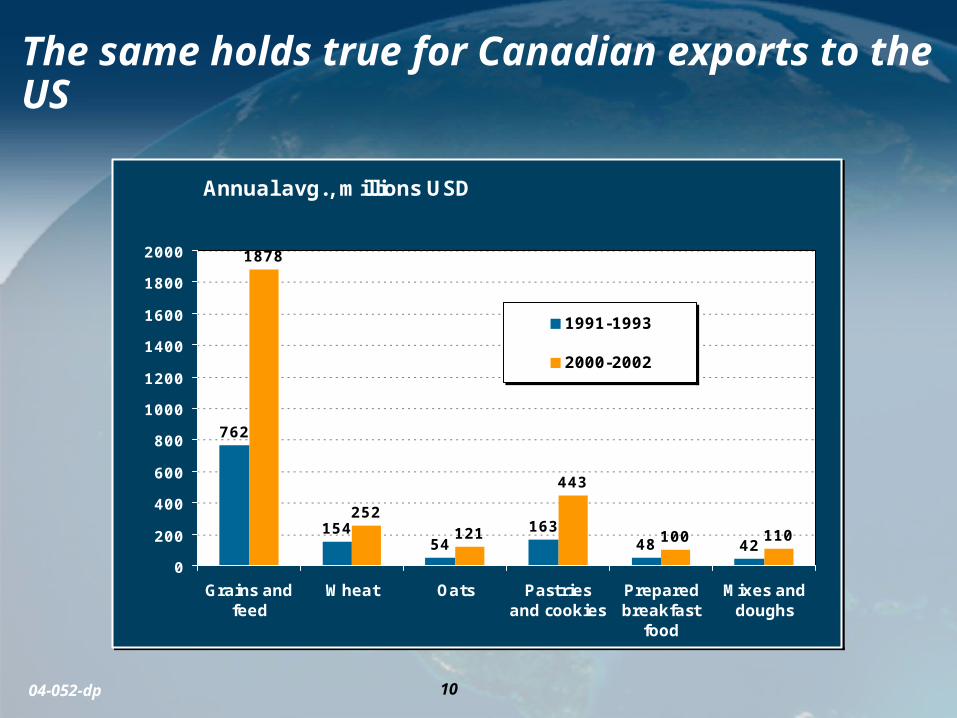
The same holds true for Canadian exports to the US
Annual avg., millions USD
4
762
15454
16348 42
1878
252121
443
100 110
0
200
400
600
800
1000
1200
1400
1600
1800
2000
Grains andfeed
Wheat Oats Pastriesand cookies
Preparedbreakfast
food
Mixes anddoughs
1991-1993
2000-2002
1104-052-dp
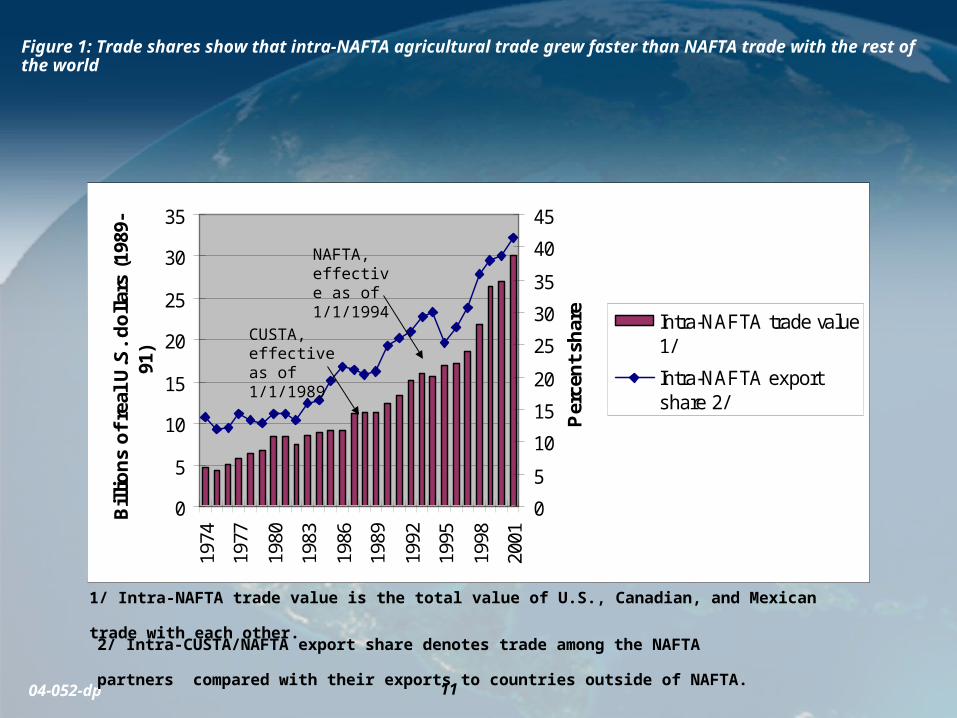
Figure 1: Trade shares show that intra-NAFTA agricultural trade grew faster than NAFTA trade with the rest of the world
0
5
10
15
20
25
30
3519
74
1977
1980
1983
1986
1989
1992
1995
1998
2001
Bil
lio
ns
of
real
U.S
. d
oll
ars
(198
9-91
)
0
5
10
15
20
25
30
35
40
45
Per
cen
t sh
are
Intra-NAFTA trade value1/
Intra-NAFTA exportshare 2/
NAFTA, effective as of 1/1/1994
CUSTA, effective as of 1/1/1989
2/ Intra-CUSTA/NAFTA export share denotes trade among the NAFTA partners compared
with their exports to countries outside of NAFTA.
1/ Intra-NAFTA trade value is the total value of U.S., Canadian, and Mexican trade with each other.
1204-052-dp
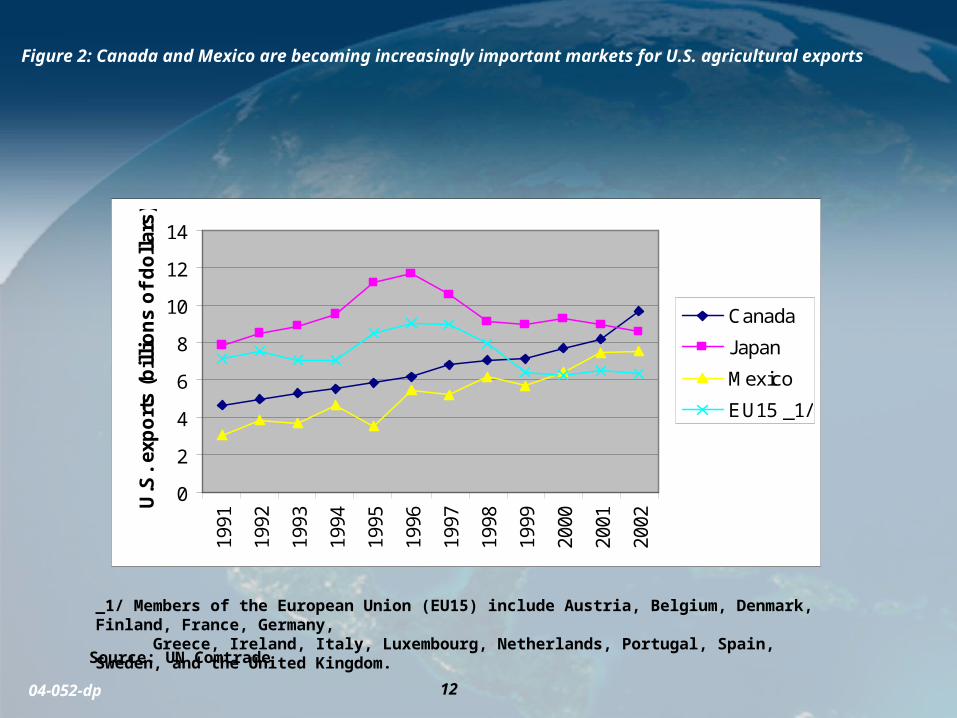
Figure 2: Canada and Mexico are becoming increasingly important markets for U.S. agricultural exports
_1/ Members of the European Union (EU15) include Austria, Belgium, Denmark, Finland, France, Germany, Greece, Ireland, Italy, Luxembourg, Netherlands, Portugal, Spain, Sweden, and the United Kingdom.
Source: UN Comtrade
0
2
4
6
8
10
12
1419
91
1992
1993
1994
1995
1996
1997
1998
1999
2000
2001
2002
U.S
. ex
po
rts
(bil
lio
ns
of
do
llar
s)
Canada
Japan
Mexico
EU15 _1/

1304-052-dp
Figure 3: The United States is also a very important agricultural market for exporters in Canada and Mexico
Source: UN Comtrade
0102030405060708090
1001991
1992
1993
1994
1995
1996
1997
1998
1999
2000
2001
2002
Part
ner
exp
ort
desti
nati
on
sh
are
s
Mexico
Canada
1404-052-dp
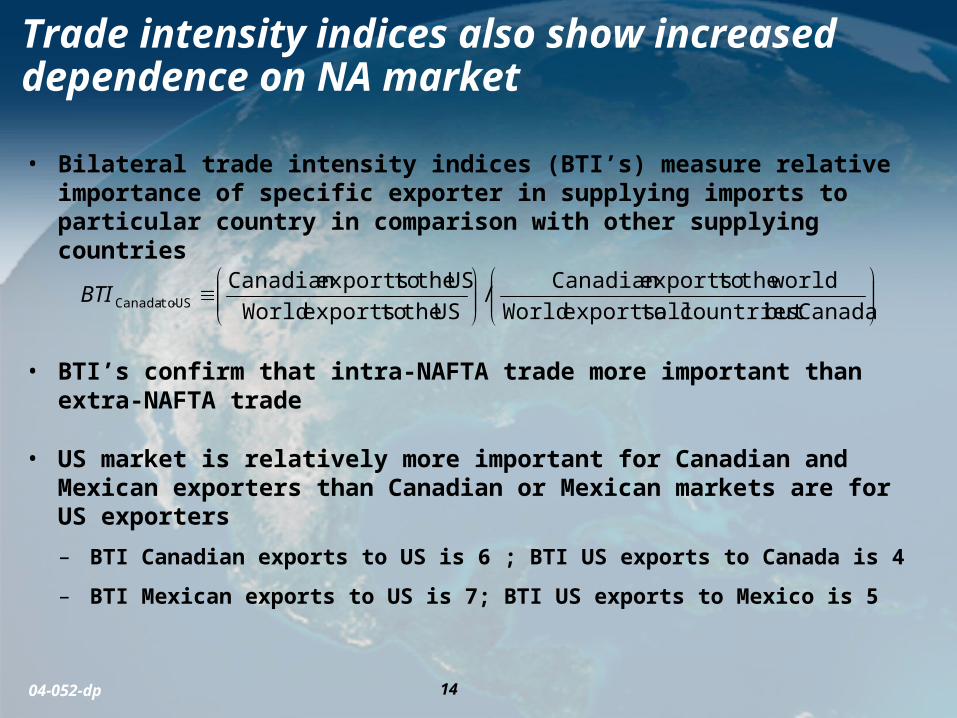
Trade intensity indices also show increased dependence on NA market
• Bilateral trade intensity indices (BTI’s) measure relative importance of specific exporter in supplying imports to particular country in comparison with other supplying countries
• BTI’s confirm that intra-NAFTA trade more important than extra-NAFTA trade
• US market is relatively more important for Canadian and Mexican exporters than Canadian or Mexican markets are for US exporters
– BTI Canadian exports to US is 6 ; BTI US exports to Canada is 4
– BTI Mexican exports to US is 7; BTI US exports to Mexico is 5
Canadabut countries all toexports World
world the toexportsCanadian /
US the toexports World
US the toexportsCanadian US-to-CanadaBTI

1504-052-dp
Composition of NA agri-food trade is changing
• Importance of bulk commodities declining
• Canada and U.S. trading more high-value processed products and intermediate goods
• Mexican exports now dominated by fresh produce and horticultural products, Mexican breweries also major force
• Intra-industry trade growing – particularly between Canada and US
– Sign that production processes cut across border
• Evidence of increasing trade complementarities since CUSTA/NAFTA
– Trade increasingly reflects comparative advantage

1604-052-dp
The trade criterion can be misleading
• Trade flows affected by many factors
• Discriminating monopolists segment markets to maximize profits
• Entrepreneurs may be indifferent as to with whom they trade
• Arbitrage may not be profitable due to transportation and marketing costs

1704-052-dp
Theoretical yardstick: Price-based view of
market integration
• Consistency with LOP, Dornbusch, Rogoff
• Nationality not important, Goldberg & Knetter
• A matter of degree, Fackler & Goodwin
• S.R. & L.R. dynamics of price adjustments, Fackler & Goodwin
• “Market connectedness,” McNew
• Rationale absence of arbitrage, Barrett
• Price variability, Hufbauer, Bradford & Lawrence
• “thickness” of product availability, Knetter & Slaughter

1804-052-dp
Laymen’s definitions
• Removal of barriers to commercial exchange, Robertson • No arbitrage rents, Harvey
• Market integration exists when product flows between countries are on the same terms and conditions as within countries, Knutson & Ochoa
• An integrated market consists of two or more economically interdependent but spatially separated markets in which there are no barriers that distort trade and investment activities across borders

1904-052-dp
Law of One Price holds for Canada-US agri-food trade
• Econometric studies quantifying the degree of integration in commodity markets
• Prices in Canada/U.S. beef and pork markets highly correlated, supply-managed sectors less so
• Policy changes have increased price co-integration
– Prices in Canada/U.S. wheat and barley markets more co-integrated following repeal of WGTA, NAFTA
• Asymmetrical price effects
– Price shocks originating in the U.S. have greater impact on Canadian prices than vice-versa
• Law of One Price less useful in US-Mexico context
– Incomplete exchange-rate pass through, high and variable Mexican inflation rate

2004-052-dp
Trade agreements not the only factors contributing to integration
• Geographical location & cultural heritage
• Technology: Advances in transportation, storage, and electronic communication
• Macroeconomic factors
– Level of development
– Exchange rates
• National policy goals• Market orientation of domestic policy key to capturing
benefits from trade agreements
– Trade agreements• Regional: CUSTA and NAFTA on market access,
investment• Multilateral: WTO’s URAA on export subsidies, domestic
support

2104-052-dp
Foreign direct investment is an important element of integration
• FDI in NA has grown tremendously since CUSTA/NAFTA
• Processed food demand in Canada, US, Mexico met more through FDI than trade
• Sales of US affiliates 2.5 times larger than exports of processed food to Canada or Mexico
Billions of U.S. Dollars
0
5
10
15
20
25
30
1990 1991 1992 1993 1994 1995 1996 1997 1998 1999 2000 2001
Sales by U.S.-owned affiliates
Imports from Canada and Mexico
Exports to Canada and Mexico
2204-052-dp
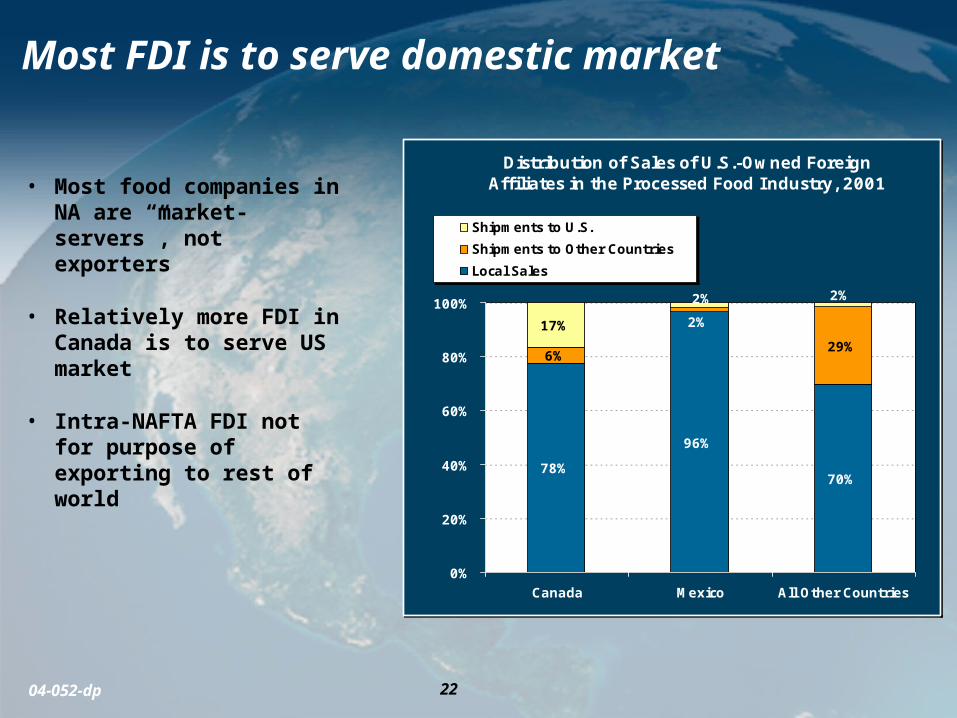
Most FDI is to serve domestic market
• Most food companies in NA are “market-servers”, not exporters
• Relatively more FDI in Canada is to serve US market
• Intra-NAFTA FDI not for purpose of exporting to rest of world
Distribution of Sales of U.S.-Owned Foreign Affiliates in the Processed Food Industry, 2001
70%
96%
78%
6%29%
2%17%
2% 2%
0%
20%
40%
60%
80%
100%
Canada Mexico All Other Countries
Shipments to U.S.
Shipments to Other Countries
Local Sales
2304-052-dp
Food firms display preference for majority ownership
• Desire for control over brand, technology, and market development drives ownership decisions
• Typical steps to market entry– Export to test market potential
– Strategic alliance with domestic firm
– Foreign direct investment through mergers and acquisitions
• International joint ventures offer advantages– Anti-trust policy, access to distribution networks
– Soft drink and brewing industries built solidly on international licensing
– Cross-border contracting in production agriculture

2404-052-dp
Big fish from Canada and Mexico now swim in bigger pond
• Large firms in Canada and Mexico expand to take advantage of continental market
– McCain (Canadian) operates 8 food processing facilities in US, one in Mexico
– Weston Foods (Canadian) has large and growing share of US bakery products market, ¾ total corporate sales in US market
– Gruma (Mexican) is largest producer of corn flour and tortillas in US, ½ total corporate sales in US market

2504-052-dp
Link between integration and performance deserves more attention
• More questions than answers
• Trade theory suggests gains from:– Specialization/comparative advantage
– Economies of scale
– Increased competition
– Knowledge spillovers
• Benefits should be greatest in Mexico– Lower capital/labour ratio, low labour productivity
– Higher agricultural tariffs
– Greater access to US market

2604-052-dp
Economic research needed to further policy discussions
– Extent of price integration• No studies of price co-movements in Mexico-US
agri-food markets & many US-Canada commodity markets remain unexamined
– Measurement of border transaction costs• As tariffs come down, impact of non-tariff
barriers ever more important• Useful in the design of regulations and standards
– Effect of integration on competition• Relationship between increasing trade &
investment and market power exercised by food companies
• Input into design and enforcement of competition policy

2704-052-dp
Economic research needed to further policy discussions
– Effect of integration on productivity• Identify and quantify economic gains arising
from trade and investment
• Useful in trade communications
– Distribution of gains from integration• Many sub-sectors/regions are better-off, but
some worse-off
• Input into design of policies to ease adjustment
– Other topics?


