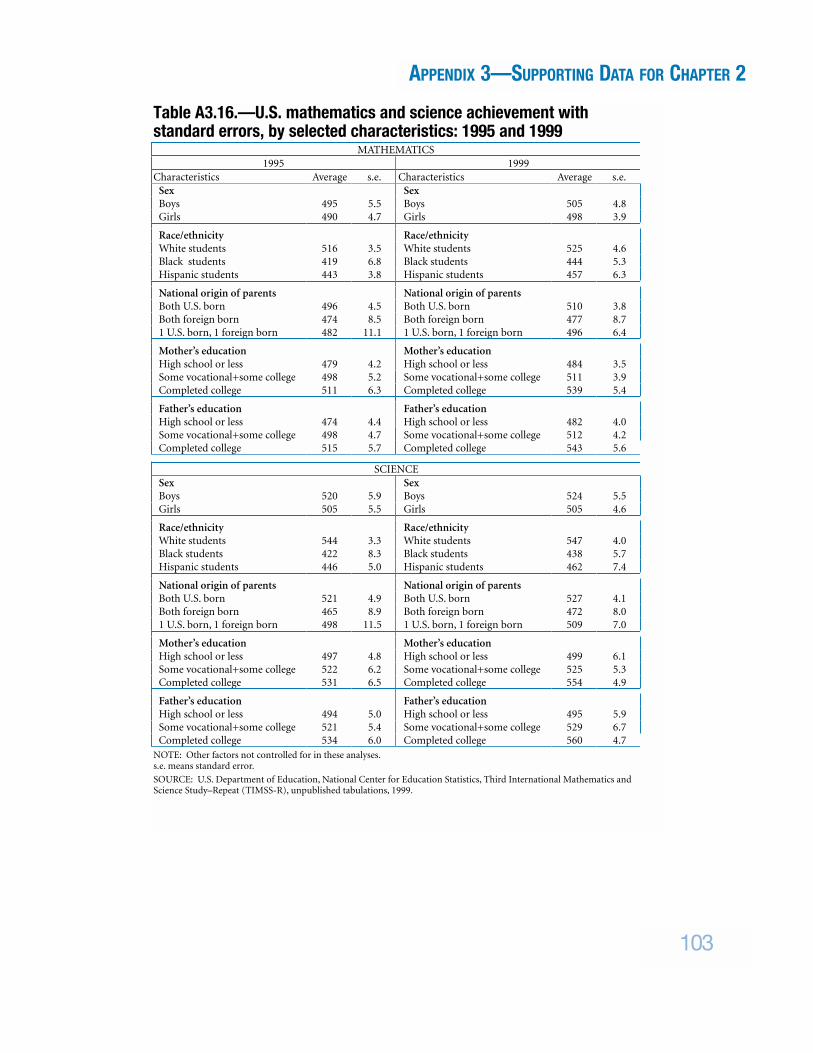
CHAPTER 3 TEACHING AND CURRICULUM KEY POINTS It is too early in the process of data analysis to provide strong evidence to suggest factors that may be related to patterns of achievement on TIMSS–R. However, differences in teaching and curriculum between the United States and other TIMSS–R nations were noted. U.S. eighth-grade students were less likely than their international peers to be taught mathematics by teachers who majored in mathematics, but as likely as others to be taught by teachers who majored in mathematics education. U.S. eighth-grade students were as likely as their international peers to be taught science by teachers with a college major or main area of study in biology, chemistry, or science education but less likely to be taught science by teachers with a degree in physics. A greater percentage of U.S. eighth-graders than of their international peers reported using computers frequently in mathematics and science classes. U.S. eighth-grade students spent less time than their international peers studying mathematics or sci- ence outside of school and doing mathematics or science homework outside of school.
Transcript
CHAPTER 3TEACHING AND CURRICULUM
KEY POINTS
It is too early in the process of data analysis to provide strong evidence to suggest factors that maybe related to patterns of achievement on TIMSS–R. However, differences in teaching and curriculumbetween the United States and other TIMSS–R nations were noted.
U.S. eighth-grade students were less likely than their international peers to be taught mathematics byteachers who majored in mathematics, but as likely as others to be taught by teachers who majoredin mathematics education.
U.S. eighth-grade students were as likely as their international peers to be taught science by teacherswith a college major or main area of study in biology, chemistry, or science education but less likelyto be taught science by teachers with a degree in physics.
A greater percentage of U.S. eighth-graders than of their international peers reported using computersfrequently in mathematics and science classes.
U.S. eighth-grade students spent less time than their international peers studying mathematics or sci-ence outside of school and doing mathematics or science homework outside of school.
Researchers, practitioners, and policymakers havepaid a great deal of attention to the preparation,ongoing professional development, instructionalpractices, and curricular focus of teachers. Muchof this attention has focused on developingprograms, teaching methods, and curriculummaterials to improve the achievement of allstudents. TIMSS–R collected data from students,teachers, and schools about systems, programs,curricular emphases, instructional practices, andother factors that have been put into place tosupport improved student learning.
The relationships between achievement andeducation-related background factors arecomplex. In this initial report, it was not possibleto explore the potential relationships betweenachievement and the context of teaching, learning,and curriculum in the United States and the otherparticipating nations with the care and thoughtneeded to be confident in our interpretations.Therefore, although this report presents findingson the context of teaching, learning, and curricu-lum in the United States and the 37 other nationsthat participated in TIMSS–R in 1999, it does notrelate any changes or differences in achievement tothese background factors. Examination of thesefactors is included to stimulate discussion of themany varied approaches taken by nations. Morein-depth analyses of the data that take intoaccount the complex systems that support studentlearning, as well as findings from the data-richTIMSS Video Study and the forthcomingTIMSS–R Videotape Classroom Study, willprovide a better basis for understanding theseinterconnections and will lead to importantfindings.
This chapter is organized into three sections, inthe following order:
� findings on the preparation and qualificationsof mathematics and science teachers, as well as their ongoing professional developmentactivities;
� findings on the intended and implementedmathematics and science curricula; and
� findings on classroom practices and activities.
The analyses that follow are limited to datacollected in 1999 for the 38 TIMSS–R nations. Forsome analyses in science, comparisons are limited
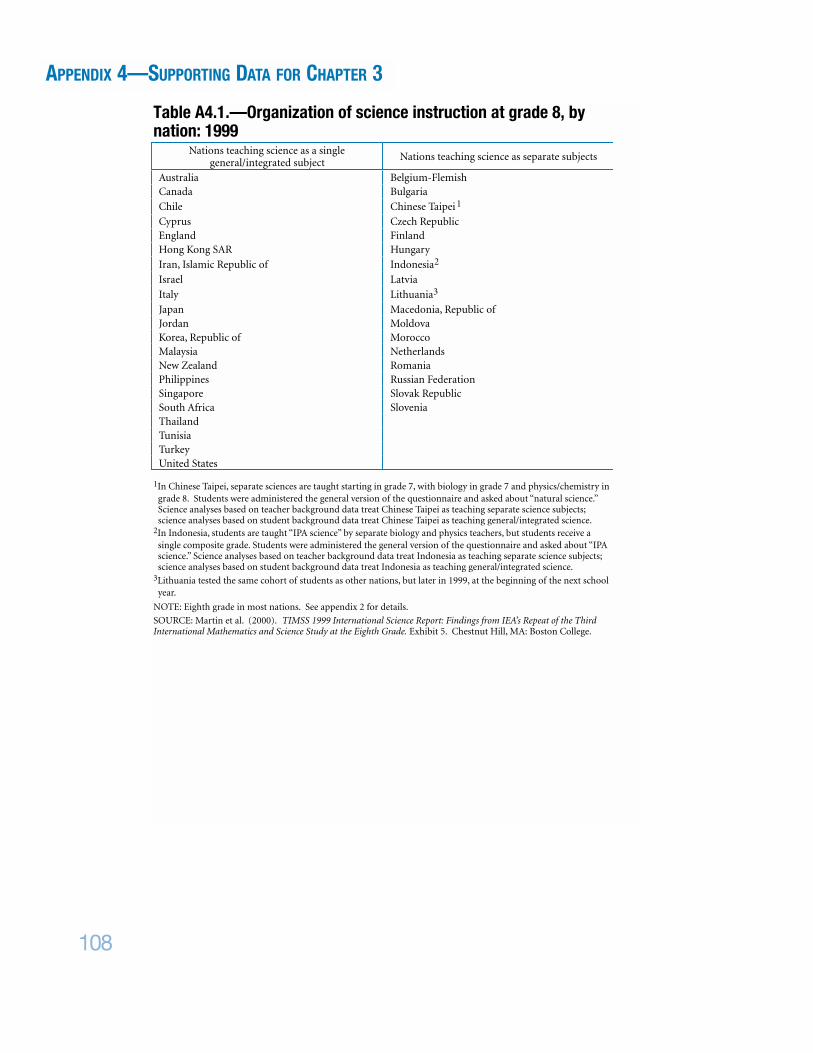
to the nations that generally organized scienceinstruction as a single, general/integrated subjector as separate subjects in 1999. Unless otherwiseindicated, the 38 TIMSS–R nations are comparedin the science analyses in this chapter. A list of thenations that generally organized science instruc-tion as a general/integrated subject or as separatesubjects at the eighth grade are provided in tableA4.1 in appendix 4.
TEACHER PREPARATION,QUALIFICATIONS, ANDPROFESSIONALDEVELOPMENTTIMSS–R collected information on the academicpreparation, qualifications, and ongoing profes-sional development of the mathematics andscience teachers of eighth-grade students.Teachers’ educational backgrounds and confi-dence in their abilities to teach mathematics andscience were some of the factors considered asindicators of the extent to which teachers areprepared to teach. Data collected in TIMSS–R donot, however, provide a complete picture ofteacher preparedness.
What educational backgroundsdid our mathematics teachershave in 1999?Over the last several years, some have argued thatit is important for teachers to have subject matterexpertise, and one indication of this is a major insubjects they teach, either at the bachelor’s ormaster’s level. TIMSS–R asked the mathematicsand science teachers of eighth-grade studentsabout their majors at the bachelor’s and master’slevel. Teachers could indicate that they had morethan one major or main area of study if applicable.U.S. eighth-grade students were less likely thantheir international peers to be taught by a mathe-matics teacher with a bachelor’s or master’s degreemajoring in mathematics. In 1999, 41 percent ofU.S. eighth-grade students had a mathematicsteacher whose bachelor’s degree or master’s major
44
CHAPTER 3—TEACHING AND CURRICULUM
or main area of study was in mathematics, asmaller percentage than the international averageof 71 percent of students (figure 25). Compared tothe United States, a higher percentage of studentsin 29 of the 37 other nations were taught by amathematics teacher with a bachelor’s or master’sor equivalent major in mathematics. Canada andItaly were the only nations that reported lowerpercentages than the United States.
U.S. eighth-grade students were as likely as theirinternational peers to be taught by a mathematicsteacher with a bachelor’s or master’s degree majorin mathematics education. Thirty-seven percentof U.S. eighth-grade students were taught mathe-matics by a teacher whose bachelor’s or master’smajor was in mathematics education. This iscomparable to the international average of 31percent of students.
45
CHAPTER 3—TEACHING AND CURRICULUM
Mathematics Mathematics Education
Science/Science Education
Education Other
0
20
40
60
80
100
Perc
enta
ge o
f stu
dent
s
41
71
3731
16
35
54
32
46
32
United States
International average*
Bachelor’s or master’s degree major*The item response rate for this question was less than 70 percent in some nations. See Mullis et al. (2000) for details.�Significant difference between U.S. average and international average in this category.
NOTE: Science includes biology, physics, chemistry, and science education.Based on mathematics teachers' reports of main area or areas of study for bachelor’s and/or master’s degree; more than one catego-ry could be selected.Eighth grade in most nations. See appendix 2 for details.The international average is the average of the national averages of the nations that reported data.
SOURCE: Mullis et al. (2000). TIMSS 1999 International Mathematics Report: Findings from IEA’s Repeat of the Third InternationalMathematics and Science Study at the Eighth Grade. Exhibit R3.1. Chestnut Hill, MA: Boston College.
Figure 25.—Eighth-grade mathematics teachers’ reports on theirmain area of study: 1999
What educational backgroundsdid our science teachers havein 1999?For this analysis, science teachers of U.S. studentswere compared to science teachers in othernations that generally taught science as ageneral/integrated science curriculum.1 Inaddition to the United States, 22 other nationsindicated they generally teach their eighth-gradestudents with this type of a science curriculum(see table A4.1). Unlike mathematics teachers,science teachers often obtained degrees in thedifferent content areas of science such as biology,physics, and chemistry. Therefore, it is importantto compare the percentage of students whoseteachers held a bachelor’s or master’s degree in oneof these specific areas. Teachers could indicate
that they had more than one major or main area ofstudy, if applicable.
In 1999, 47 percent of U.S. eighth-grade studentswere taught by science teachers with a collegemajor or main area of study in biology, 13 percentof our students were taught by science teacherswith a college major or main area of study inphysics, and 21 percent of our students weretaught by science teachers with a college major ormain area of study in chemistry (figure 26). Thepercentage of U.S. students taught by scienceteachers with a college major or main area of studyin biology or chemistry was similar to the interna-tional averages for these categories, while thepercentage of U.S. students taught science byteachers with a college major or main area of studyin physics was lower than the internationalaverage.
46
CHAPTER 3—TEACHING AND CURRICULUM
0
20
40
60
80
100
Perc
enta
ge o
f stu
dent
s
4742
13
23 2130
43 44
14
25
56
30
45
29
Bachelor’s or master’s degree major
Biology Physics Chemistry ScienceEducation
Mathematics/Mathematics
Education
Education Other
United States
International average1
2
�Significant difference between U.S. average and international average in this category.1The item response rate for this question was less than 70 percent in some nations. See Martin et al. (2000) for details.2Other may include areas of study in earth science fields.
NOTE: Based on science teachers’ reports of main area or areas of study for bachelor’s and/or master’s degree; more than one category could be selected.Eighth grade in most nations. See appendix 2 for details.The international average is the average of the national averages of the nations that reported teaching a general/integrated sciencecurriculum.
SOURCE: Martin et al. (2000). TIMSS 1999 International Science Report: Findings from IEA’s Repeat of the Third InternationalMathematics and Science Study at the Eighth Grade. Exhibit R3.1. Chestnut Hill, MA: Boston College.
Figure 26.—Eighth-grade science teachers’ reports on their mainarea of study: 1999
1The National Research Coordinator of each nation was asked to complete a questionnaire that, among other things, asked if sci-ence was taught as a general/integrated subject or as separate subjects such as Earth Science, Biology, Physics, and Chemistry. TheCouncil of Chief State School Officers (CCSSO) supplied information for the United States. The United States is one of 23 nationsin TIMSS–R that, in general, teaches science as a general/integrated subject at the eighth-grade level. The questionnaire did not dis-tinguish between general science and integrated science. See table A4.1 in appendix 4.
In addition to, or in lieu of, content area–specificdegrees, teachers can also major in science educa-tion. In 1999, 43 percent of U.S. eighth-gradescience students were taught by science teacherswith a bachelor’s or master’s degree major inscience education. This was similar to the interna-tional average of 44 percent.
How confident were mathematics teachers in their preparation to teachmathematics subjects?In addition to asking about the educational back-ground of teachers, TIMSS–R asked teachers howconfident they were to teach mathematics as agauge of their own sense of preparedness.
In general, more U.S. teachers of eighth-gradestudents reported feeling very well prepared toteach mathematics compared to their counter-parts in other nations in 1999. In mathematics,the United States was among the top group ofnations in which a large percentage of its studentswere taught by teachers who reported feeling “verywell prepared” to teach mathematics (figure 27).On average, 90 percent of U.S. eighth-graders hadteachers who felt “very well prepared” to teachacross the topics covered by the TIMSS–R mathe-matics framework. In this respect, the UnitedStates was similar to 9 nations and was higher than25 nations as well as the international average.
Ninety percent or more of U.S. eighth-gradestudents were taught by teachers who reportedthey were “very well prepared” to teach 7 of the 12 topics asked about.2 For the other 5 topics(measurement–units, instruments, and accuracy;geometric figures–definitions and properties;geometric figures–symmetry; simple probabilities–understanding and calculations; and coordinategeometry), 75 to 86 percent of U.S. eighth-graderswere taught by mathematics teachers who felt“very well prepared” to teach these topics. For 11of the 12 mathematics topics covered in TIMSS–R,the percentage of U.S. students taught by teacherswho felt “very well prepared” exceeded the inter-national average.
Interpretation of these data should take intoaccount cultural and curricular issues, however.For example, teachers in some cultures may bemore reserved about discussing their strengthsand abilities. Teachers’ reports on their confidencelevels to teach a subject area may be influenced bycultural norms and expectations. Moreover,teachers’ reports on their confidence levels mayalso reflect the emphases of the curricula they areexpected to teach. For example, if the mathemat-ics standards or curriculum emphasizes aparticular set of topics and does not emphasizeanother set of topics, teachers may feel lessprepared to teach those topics that they are notusually expected to present. Curricular issues aredealt with to a certain degree in TIMSS–R, and theareas emphasized in each nation’s curriculum aswell as the topics covered by teachers are discussedlater in this chapter.3 Cultural issues are outsidethe scope of TIMSS–R but can be found through-out the research literature.
47
CHAPTER 3—TEACHING AND CURRICULUM
2The 7 mathematics topics where 90 percent or more of U.S. eighth-grade students were taught by teachers who report they were“very well prepared” are fractions, decimals, and percentages; ratios and proportions; perimeter, area, and volume; algebraic represen-tation; evaluate and perform operations on algebraic expressions; solving linear equations and inequalities; representation and inter-pretation of data in graphs, charts, and tables.
3TIMSS–R collected information from the mathematics and science teachers of the eighth-graders about the curricular topics cov-ered and emphasized most in the classroom. TIMSS–R did not include an in-depth curriculum analysis, as in TIMSS.
48
CHAPTER 3—TEACHING AND CURRICULUM
Figure 27.—Teachers’ beliefs about their preparation to teachmathematics and science: 1999
Percentage of eighth-grade students whosemathematics teachers reported feeling very well
prepared to teach mathematics
Percentage of eighth-grade students whose scienceteachers reported feeling very well prepared to
teach scienceNation Percent Nation PercentMacedonia, Republic of 92 Macedonia, Republic of 72United States 90 Czech Republic 64Cyprus 89 Turkey 63Slovak Republic 89 New Zealand 59Jordan 88 United States 58Czech Republic 88 Indonesia 58New Zealand 88 Romania 57Romania 85 Morocco 57Australia 84 Cyprus 57(Israel)1 84 Jordan 57Netherlands 84 Australia 55Turkey 83 (Israel) 55Finland 81 South Africa 53Iran, Islamic Republic of 81 Netherlands 50Malaysia 81 Finland 47Indonesia 81 Belgium-Flemish 47Belgium-Flemish 80 Bulgaria 46Canada 79 Singapore 46Singapore 78 Canada 44Chinese Taipei 78 Italy 42Morocco 75 Chinese Taipei 42Latvia-LSS2 73 Iran, Islamic Republic of 42Hong Kong SAR 72 Philippines 41South Africa 71 Moldova 39Italy 69 Latvia-LSS2 37Bulgaria 66 Hong Kong SAR 34Moldova 64 Tunisia 32Philippines 64 Korea, Republic of 31Korea, Republic of 61 Thailand 30Hungary 59 Hungary 29Tunisia 51 Chile 29Slovenia 50 Malaysia 22Chile 44 Japan 17Thailand 32 England —Japan 23 Lithuania —England — Russian Federation —Lithuania — Slovak Republic —Russian Federation — Slovenia —
International average of 35 nations
73International average of 33 nations
46
Average is significantly higher than the U.S. averageAverage does not differ significantly from the U.S. averageAverage is significantly lower than the U.S. average
— Data not available.1The shading of Israel may appear incorrect; however, statistically its placement is correct.2Designated LSS because only Latvian-speaking schools were tested which represents 61 percent of the population.
NOTE: Eighth grade in most nations. See appendix 2 for details.Parentheses indicate nations not meeting international sampling and/or other guidelines. See appendix 2 for details.The international average is the average of the national averages of the nations that provided data.
SOURCE: Martin et al. (2000). TIMSS 1999 International Science Report: Findings from IEA’s Repeat of the ThirdInternational Mathematics and Science Study at the Eighth Grade. Exhibit R3.2. Chestnut Hill, MA: Boston College; Mullis et al. (2000). TIMSS 1999 International Mathematics Report: Findings from IEA’s Repeat of the Third InternationalMathematics and Science Study at the Eighth Grade. Exhibit R3.2. Chestnut Hill, MA: Boston College.
How confident were scienceteachers in their preparation to teach science subjects?Overall, the picture of teacher confidence inpresenting science topics appears different fromthe one described for mathematics. Fifty-eightpercent of U.S. eighth-graders had scienceteachers who felt “very well prepared” to teachacross the science topics covered in the TIMSS–Rframework (figure 27). In comparison to the 37other TIMSS–R nations, the United States wassimilar to 11 nations and was higher than 20nations as well as the international average. Itappears that science teachers reported feeling lessconfident about their preparedness to teacheighth-grade science topics than their mathemat-ics counterparts when considering theinternational average percentage of studentstaught by a teacher who felt “very well prepared”to teach mathematics (73 percent) or science (46percent), internationally.
Forty to sixty-five percent of U.S. eighth-gradestudents had science teachers who felt “very wellprepared” to teach 9 of the 10 topics asked about.In only one topic area, scientific methods andinquiry skills, did science teachers of more than 80percent of eighth-grade students in the UnitedStates feel “very well prepared” to teach.
Compared to the international average, the UnitedStates had a higher percentage of its studentstaught by science teachers who felt “very wellprepared” to teach in 4 of the 10 science topicareas: earth science–features; earth science–solarsystem; environmental and resource issues; andscientific methods and inquiry skills. In the other 6topic areas,4 the United States was similar to theinternational average.
Again, interpretation of these data should takeinto account possible cultural and curricularissues that can affect teachers’ reports of theirconfidence to teach subject-specific topics.
In what types of professionaldevelopment activities did our mathematics teachersparticipate?The United States asked mathematics and scienceteachers of TIMSS–R students to describe theirprofessional development experiences during the1998–99 school year, defined as June 1998 to May1999. Only U.S. teachers were asked about theirparticipation in 11 types of professional develop-ment activities5; thus, cross-national comparisonscannot be made.
Of the 11 types of professional development askedabout in the U.S. teacher questionnaires, within-district workshops or institutes and courses forcollege credit were generally the most frequenttypes of activities that mathematics teachers ofU.S. eighth-grade students participated in duringthe 1998–99 school year. On average, U.S. eighth-grade students were taught mathematics byteachers who attended 12 clock hours of within-district workshops or institutes and 9 clock hoursof courses for college credit6 over the course of ayear. These professional development activitiesmay or may not have been specifically mathemat-ics-focused.
In what types of professionaldevelopment activities did ourscience teachers participate?The story appears similar for the science teachersof U.S. students. Of the 11 types of professionaldevelopment activities asked about in the teacherquestionnaires, within-district workshops or insti-tutes and courses for college credit were generallythe most frequent types of activities that scienceteachers of U.S. eighth-grade students participatedin during the 1998–99 school year. On average,
49
CHAPTER 3—TEACHING AND CURRICULUM
4The 6 science topics where the United States had a similar percentage of students with teachers feeling “very well prepared” com-pared to the international average are biology–human systems; biology–plant and animal life; chemistry–matter; chemistry–chemicalreactivity; physics–types of energy; and physics–light.
5U.S. mathematics and science teachers were asked about their participation in the following 11 types of professional developmentactivities: within-district workshops or institutes; courses for college credit; out-of-district workshops and institutes; teacher col-laboratives or networks; out-of-district conferences; immersion or internship activities; receiving mentoring, coaching, lead teach-ing, or observation; teacher resource centers; committees or task forces; teacher study groups; and other forms of organized pro-fessional development. These questions were not asked in any other nation in TIMSS–R.
6This average includes teachers who did not take any courses for college credit; therefore, the average hours spent in such courses bythose teachers who took them may be underreported.
U.S. eighth-grade students were taught by ascience teacher who attended around 12 clockhours of within-district workshops or institutesand 12 clock hours of courses for college credit. Inaddition, science teachers of U.S. eighth-gradestudents spent almost 7 clock hours in committeesor task forces over the course of a year.
Did our mathematics teachersobserve one another teaching?Some research suggests that the experience ofteachers observing other teachers can contributeto the sharing of good practices. TIMSS–R askedthe mathematics and science teachers of U.S.eighth-grade students about the number of classperiods they observed other teachers in the lastyear and the number of periods other teachersobserved them in the past year. It is important tonote that the questionnaire did not ask teachersabout the purpose of their participation in obser-vation activities. Again, this question was askedonly of U.S. mathematics and science teachers.
In general, the mathematics teachers of U.S.eighth-grade students rarely participated in obser-vational activities. On average, U.S. eighth-gradestudents were taught by mathematics teacherswho spent 1 class period during the 1998–99school year observing other teachers and whowere observed by other teachers during 2 classperiods. There were no differences in the averagenumber of class periods mathematics teachersobserved other teachers or were observed by otherteachers based on years of teaching experience.
Did our science teachersobserve one another teaching?The science teachers of U.S. eighth-grade studentsalso rarely participated in observational activities.On average, U.S. eighth-graders were taught byscience teachers who observed other teachers for 1class period during the 1998–99 school year andwho were observed by other teachers for 1 classperiod. However, the situation was different forU.S. eighth-grade students whose science teachershad the fewest years of experience (0–5 years):their teachers spent approximately 3 periodsobserving other teachers, a greater number ofperiods than science teachers with more years ofexperience.
What topics were emphasizedin professional developmentactivities for U.S. mathematicsteachers?In addition to exploring the types of professionaldevelopment activities in which teachers of U.S.eighth-grade students participated, the U.S. math-ematics and science teacher questionnaires askedabout the topics emphasized during professionaldevelopment activities.
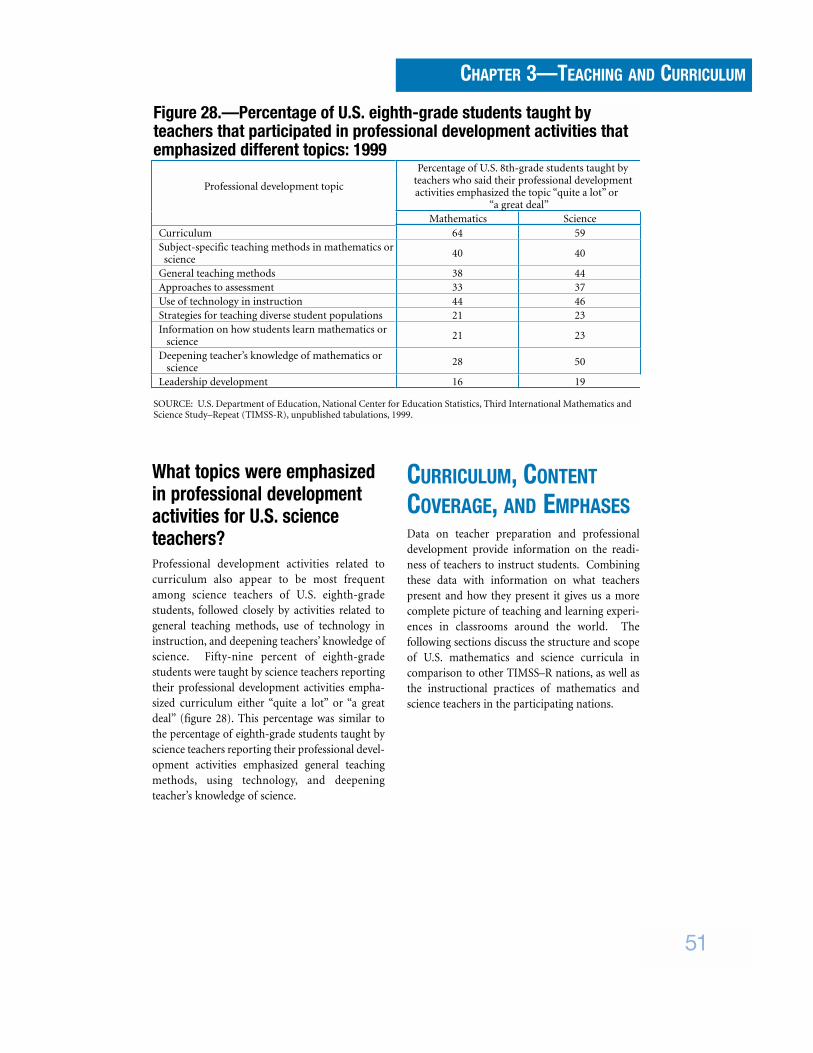
Overall, mathematics teachers of U.S. eighth-grade students reported their professionaldevelopment activities emphasized curriculummore than any other topic. Mathematics teacherswho stated their professional development activi-ties emphasized curriculum either “quite a lot” or“a great deal” taught 64 percent of U.S. eighth-grade students (figure 28). This was a higherpercentage than the percentage for any other topicasked about.
50
CHAPTER 3—TEACHING AND CURRICULUM
What topics were emphasizedin professional developmentactivities for U.S. scienceteachers?Professional development activities related tocurriculum also appear to be most frequentamong science teachers of U.S. eighth-gradestudents, followed closely by activities related togeneral teaching methods, use of technology ininstruction, and deepening teachers’ knowledge ofscience. Fifty-nine percent of eighth-gradestudents were taught by science teachers reportingtheir professional development activities empha-sized curriculum either “quite a lot” or “a greatdeal” (figure 28). This percentage was similar tothe percentage of eighth-grade students taught byscience teachers reporting their professional devel-opment activities emphasized general teachingmethods, using technology, and deepeningteacher’s knowledge of science.
CURRICULUM, CONTENTCOVERAGE, AND EMPHASESData on teacher preparation and professionaldevelopment provide information on the readi-ness of teachers to instruct students. Combiningthese data with information on what teacherspresent and how they present it gives us a morecomplete picture of teaching and learning experi-ences in classrooms around the world. Thefollowing sections discuss the structure and scopeof U.S. mathematics and science curricula incomparison to other TIMSS–R nations, as well asthe instructional practices of mathematics andscience teachers in the participating nations.
51
CHAPTER 3—TEACHING AND CURRICULUM
Figure 28.—Percentage of U.S. eighth-grade students taught byteachers that participated in professional development activities thatemphasized different topics: 1999
Professional development topic
Percentage of U.S. 8th-grade students taught byteachers who said their professional developmentactivities emphasized the topic “quite a lot” or
“a great deal”Mathematics Science
Curriculum 64 59Subject-specific teaching methods in mathematics or science
40 40
General teaching methods 38 44Approaches to assessment 33 37Use of technology in instruction 44 46Strategies for teaching diverse student populations 21 23Information on how students learn mathematics or science
21 23
Deepening teacher’s knowledge of mathematics or science
28 50
Leadership development 16 19
SOURCE: U.S. Department of Education, National Center for Education Statistics, Third International Mathematics andScience Study–Repeat (TIMSS-R), unpublished tabulations, 1999.
Who sets the curriculum inTIMSS–R nations?Most of the 38 TIMSS–R nations have imple-mented a national mathematics and sciencecurriculum. Australia, Canada, and the UnitedStates are the three TIMSS–R nations with region-ally or locally determined curricula. Curriculumis determined at the state or provincial level inAustralia and Canada. Curriculum is determinedat the local level in the United States. Throughoutthis report, we treat Australia, Canada, and theUnited States as if they each had a nationalcurriculum, for comparative purposes. However,it is important to remember that these threenations do not have national curricula in mathe-matics and science.
How much of each TIMSS–Rcontent area did the intendedU.S. curriculum cover? In an effort to better understand the mathematicsand science achievement of eighth-grade students,TIMSS–R collected information on each nation’smathematics and science curricula as it wasintended to be taught to students.7 This informa-tion can put achievement results in perspective byrevealing those content areas that most eighth-grade students have been exposed to in theireducational experiences up to and includingeighth grade, and those that they have not yet beenexposed to.8 For example, if the intended mathe-matics or science curriculum in a nation does notemphasize the topics in a particular content area,or only a select group of students is intended tolearn a particular topic, then we would be lesslikely to expect that nation’s students to performwell in that content area on TIMSS–R.
Across the five content areas in mathematics andthe six content areas in science examined inTIMSS–R, the intended U.S. mathematics andscience curricula appear to have had a higherpercentage of overall coverage of the TIMSS–Rcontent areas than the international average. Inmathematics, 93 percent of the topics included inthe content areas overall were intended to betaught to all or almost all (at least 90 percent) ofU.S. students in 1999. The international averageof intended coverage to all or almost all studentswas 75 percent of the topics in the five mathemat-ics content areas. One hundred percent of thetopics in three mathematics content areas—frac-tions and number sense; measurement; and datarepresentation, analysis, and probability—wereintended to be taught to all or almost all U.S.eighth-grade students. Eighty-five percent of thetopics in geometry and 82 percent of the topics inalgebra were intended to be covered.
Similarly, 86 percent of the topics in the six sciencecontent areas overall were intended to be taught toall or almost all (at least 90 percent) of U.S.students in 1999. The international average acrossthe TIMSS–R nations was 62 percent. Onehundred percent of the topics in five of the sixscience content areas—earth science; biology;physics; environmental and resource issues; andscientific inquiry and the nature of science—wereintended to be taught to all or almost all U.S.eighth-grade students. Fifty percent of topics inchemistry were intended to be covered.
52
CHAPTER 3—TEACHING AND CURRICULUM
7Findings are based on information provided by each nation’s National Research Coordinator (NRC). In the United States, thisinformation was provided by the Council of Chief State School Officers.
8Schmidt, McKnight, et al. (1997) and Schmidt, Raizen, et al. (1997) conducted in-depth analyses of the mathematics and sciencetopics covered in the textbooks and curriculum guides used in nations as well as the depth of the topics presented. TIMSS–R didnot collect information on the depth of coverage of topics by mathematics and science teachers. Comparisons between the find-ings of Schmidt et al. and TIMSS–R cannot be made here.
How much of the mathematicscurriculum was taught?TIMSS–R asked mathematics and science teachersof eighth-grade students about the curriculumthat is actually taught in the classroom. Like infor-mation about the intended curriculum,information about what is actually taught can putachievement scores into perspective by revealingwhat content areas have and have not beencovered by the time students near completion ofthe eighth grade.
The percentage of eighth-graders whose teachersreported they had taught each content area inmathematics and science varied across theTIMSS–R nations. “Taught” is defined as the sum
of percentages of students whose teachersreported these areas as either taught before thisyear or taught more than five periods this year.Four of the five mathematics content areas—frac-tions and number sense; measurement; datarepresentation, analysis, and probability; andalgebra—were taught to between 91 percent and99 percent of U.S. eighth-grade students, whichwas higher than the international average of theTIMSS-R nations for each of these content areas.On the other hand, 65 percent of U.S. eighth-grade students were taught geometry according totheir mathematics teachers, a percentage similar tothe international average (figure 29).
53
CHAPTER 3—TEACHING AND CURRICULUM
0
20
40
60
80
100
Perc
enta
ge o
f stu
dent
s
Content areas
9995
9186
92
5965
58
98
88
United States
International average
Fractions andnumber sense
Measurement Data representation,analysis, and probability
Geometry Algebra
�Significant difference between U.S. average and international average in this category.
NOTE: “Taught” equals the sum of percentages of students whose mathematics teachers reported these content areas as either“taught before this year” or “taught more than five periods this year.”Eighth grade in most nations. See appendix 2 for details.The international average is the average of the national averages of the nations that reported data.
SOURCE: U.S. Department of Education, National Center for Education Statistics, Third International Mathematics and ScienceStudy-Repeat (TIMSS-R), unpublished tabulations, 1999.
Figure 29.—Percentage of U.S. eighth-grade students “taught”mathematics content areas: 1999
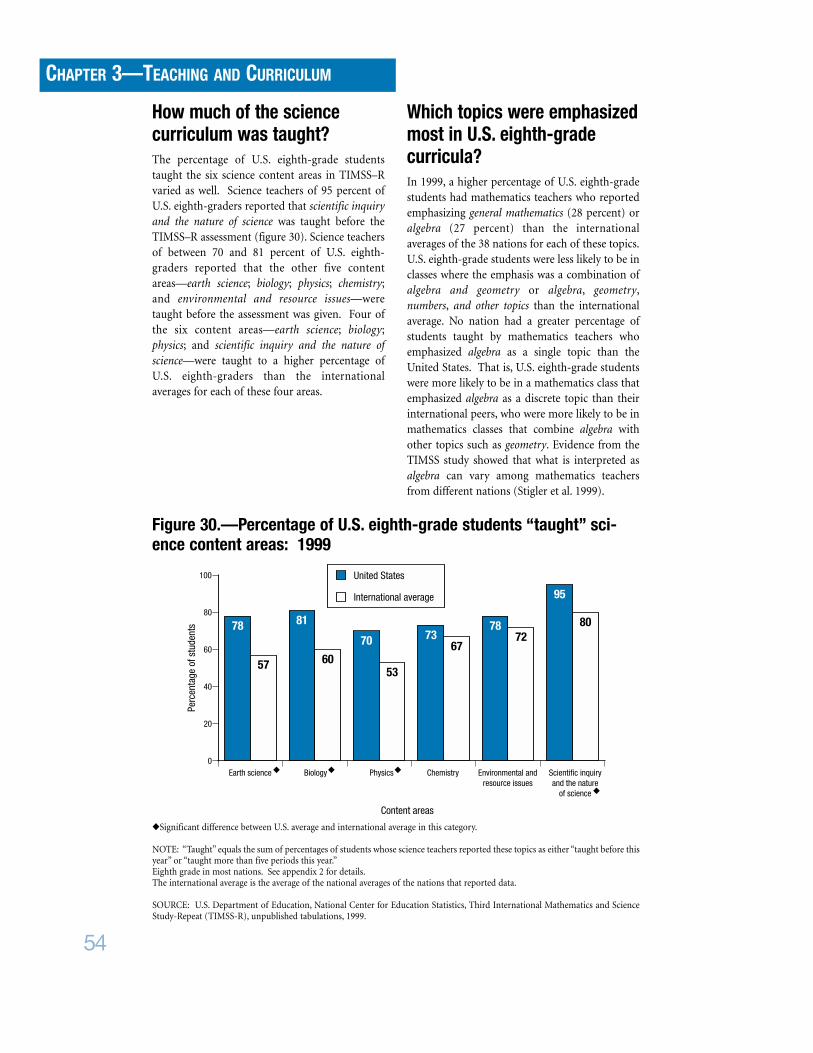
How much of the sciencecurriculum was taught?The percentage of U.S. eighth-grade studentstaught the six science content areas in TIMSS–Rvaried as well. Science teachers of 95 percent ofU.S. eighth-graders reported that scientific inquiryand the nature of science was taught before theTIMSS–R assessment (figure 30). Science teachersof between 70 and 81 percent of U.S. eighth-graders reported that the other five contentareas—earth science; biology; physics; chemistry;and environmental and resource issues—weretaught before the assessment was given. Four ofthe six content areas—earth science; biology;physics; and scientific inquiry and the nature ofscience—were taught to a higher percentage ofU.S. eighth-graders than the internationalaverages for each of these four areas.
Which topics were emphasizedmost in U.S. eighth-gradecurricula?In 1999, a higher percentage of U.S. eighth-gradestudents had mathematics teachers who reportedemphasizing general mathematics (28 percent) oralgebra (27 percent) than the internationalaverages of the 38 nations for each of these topics.U.S. eighth-grade students were less likely to be inclasses where the emphasis was a combination ofalgebra and geometry or algebra, geometry,numbers, and other topics than the internationalaverage. No nation had a greater percentage ofstudents taught by mathematics teachers whoemphasized algebra as a single topic than theUnited States. That is, U.S. eighth-grade studentswere more likely to be in a mathematics class thatemphasized algebra as a discrete topic than theirinternational peers, who were more likely to be inmathematics classes that combine algebra withother topics such as geometry. Evidence from theTIMSS study showed that what is interpreted asalgebra can vary among mathematics teachersfrom different nations (Stigler et al. 1999).
�Significant difference between U.S. average and international average in this category.
NOTE: “Taught” equals the sum of percentages of students whose science teachers reported these topics as either “taught before thisyear” or “taught more than five periods this year.”Eighth grade in most nations. See appendix 2 for details.The international average is the average of the national averages of the nations that reported data.
SOURCE: U.S. Department of Education, National Center for Education Statistics, Third International Mathematics and ScienceStudy-Repeat (TIMSS-R), unpublished tabulations, 1999.
Figure 30.—Percentage of U.S. eighth-grade students “taught” sci-ence content areas: 1999
The majority of U.S. eighth-grade students were ina science class where the teacher emphasized oneof three subjects the most: general/integratedscience, earth science, or physical science. Forty-onepercent of U.S. eighth-grade students were in aclass where general/integrated science was empha-sized, which is lower than the internationalaverage (58 percent) of the nations that generallyteach general/integrated science. The 28 percent ofU.S. students whose teachers emphasized earthscience was above the international average of 5percent, and the 21 percent of U.S. eighth-gradestudents whose teachers emphasized physicalscience was also higher than the internationalaverage of 11 percent. Fewer U.S. eighth-gradestudents had teachers who emphasized biology (5percent) or physics (2 percent) than the interna-tional averages (14 percent and 6 percent,respectively).
Did the TIMSS–R nations’curricula accommodatestudents with varying degreesof interests and abilities?The United States was one of 30 TIMSS–R nationsthat addressed the issue of students having varyinglevels of interests and abilities in their mathemat-ics curricula, and one of 27 nations that addresseddifferentiation in their science curricula.9 The twomost common approaches to addressing differen-tiation in mathematics and science classes wereteaching the same curriculum to all students, withteachers adapting to different student needs, or“streaming” students by grade or ability level.These approaches have also been taken in theUnited States.
When schools were asked how their mathematicsclasses accommodated students with differentabilities or interests in mathematics and science,schools of 79 percent of U.S. eighth-gradestudents responded that enrichment mathematicswas offered, which was above the internationalaverage of 58 percent.10 In science, schools of 34percent of U.S. eighth-grade students said theyoffered enrichment science classes, a lowerpercentage than the international average of 50
percent. In addition, 64 percent of U.S. eighth-grade students were in schools that offeredremedial mathematics, similar to the internationalaverage of 72 percent. Seventeen percent of U.S.eighth-grade students were in schools offeringremedial science, a lower percentage than theinternational average of 53 percent.
CLASSROOM PRACTICESAND ACTIVITIESTIMSS–R asked eighth-grade students and theirmathematics and science teachers about variouspractices and activities that took place in the class-room, including use of calculators in mathematicslessons and use of computers and the Internet inscience and mathematics lessons. The kinds ofskills that students are asked to practice and thetypes of activities that they participate in duringlessons can promote and reinforce learning,particularly when combined with a coherent andwell-planned curriculum. Students’ and teachers’reports of some of the practices and activities inthe classroom are presented below.
What kinds of skills did U.S.mathematics and scienceteachers report asking theirstudents to use duringlessons?Mathematics teachers of eighth-grade studentswere surveyed on whether they asked theirstudents to perform each of the following in “mostor every lesson”: explain the reasoning behind anidea; represent and analyze relationships usingtables, charts, or graphs; work on problems withno solution; write equations to represent relation-ships; and practice computational skills. A greaterpercentage of U.S. eighth-grade students wereasked by their mathematics teachers to write equa-tions to represent relationships in most or everylesson (54 percent) than the international average(43 percent). U.S. students were as likely to beasked by their mathematics teachers to practiceeach of the other skills as their international peers.
55
CHAPTER 3—TEACHING AND CURRICULUM
9Based on information provided by each nation’s National Research Coordinator (NRC).10School information provided by the principal or head administrator of the school.
A similar question was asked of science teachers inall 38 TIMSS–R nations. Science teachersreported on whether they asked their eighth-gradestudents in “most or every lesson” to explain thereasoning behind an idea; represent and analyzerelationships using tables, charts, or graphs; workon problems with no solution; write explanationsabout what was observed and why it happened; orput events or objects in order. Eighty percent ofU.S. eighth-grade students were asked by theirscience teachers to explain the reasoning behindan idea in most or every science lesson, a higherpercentage than the international average of 67percent of students. A majority of U.S. eighth-grade students (59 percent) were also asked bytheir science teachers to write explanations aboutwhat was observed and why it happened in mostor every science lesson, which was similar to theinternational average of 52 percent. U.S. eighth-grade students were also as likely as theirinternational peers to be asked to represent andanalyze relationships, work on problems with nosolution, and put events or objects in order inmost or every science lesson.
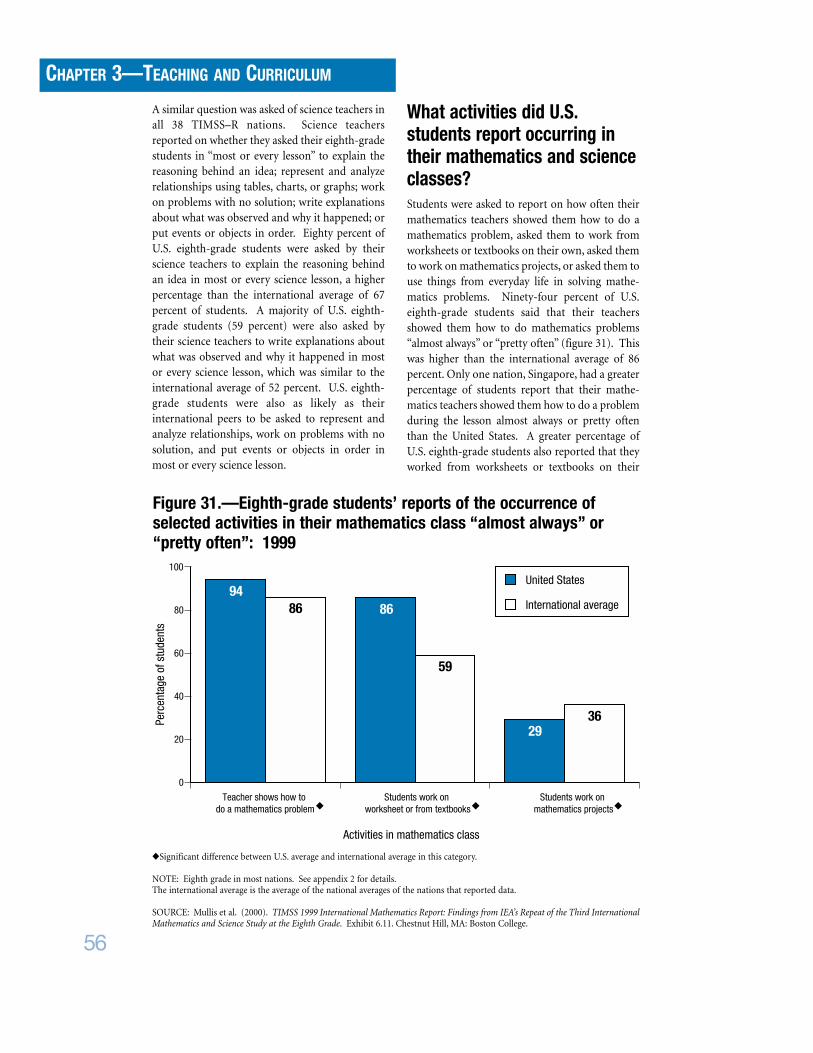
What activities did U.S.students report occurring intheir mathematics and scienceclasses?Students were asked to report on how often theirmathematics teachers showed them how to do amathematics problem, asked them to work fromworksheets or textbooks on their own, asked themto work on mathematics projects, or asked them touse things from everyday life in solving mathe-matics problems. Ninety-four percent of U.S.eighth-grade students said that their teachersshowed them how to do mathematics problems“almost always” or “pretty often” (figure 31). Thiswas higher than the international average of 86percent. Only one nation, Singapore, had a greaterpercentage of students report that their mathe-matics teachers showed them how to do a problemduring the lesson almost always or pretty oftenthan the United States. A greater percentage ofU.S. eighth-grade students also reported that theyworked from worksheets or textbooks on their
56
CHAPTER 3—TEACHING AND CURRICULUM
0
20
40
60
80
100
Perc
enta
ge o
f stu
dent
s
Activities in mathematics class
9486
59
2936
United States
International average
Teacher shows how to do a mathematics problem
Students work on worksheet or from textbooks
Students work on mathematics projects
86
�Significant difference between U.S. average and international average in this category.
NOTE: Eighth grade in most nations. See appendix 2 for details.The international average is the average of the national averages of the nations that reported data.
SOURCE: Mullis et al. (2000). TIMSS 1999 International Mathematics Report: Findings from IEA’s Repeat of the Third InternationalMathematics and Science Study at the Eighth Grade. Exhibit 6.11. Chestnut Hill, MA: Boston College.
Figure 31.—Eighth-grade students’ reports of the occurrence ofselected activities in their mathematics class “almost always” or“pretty often”: 1999
own almost always or pretty often during mathe-matics lessons (86 percent) than the internationalaverage (59 percent). On the other hand, a smallerpercentage of U.S. students reported that theyworked on mathematics projects during theirmathematics lessons (29 percent) than the inter-national average (36 percent). Finally, TIMSS–Rdata indicate that 23 percent of U.S. eighth-gradestudents reported that they almost always usethings from everyday life in solving mathematicsproblems during their mathematics lessons. Thiswas a greater percentage than the internationalaverage of 15 percent (not included in figure).
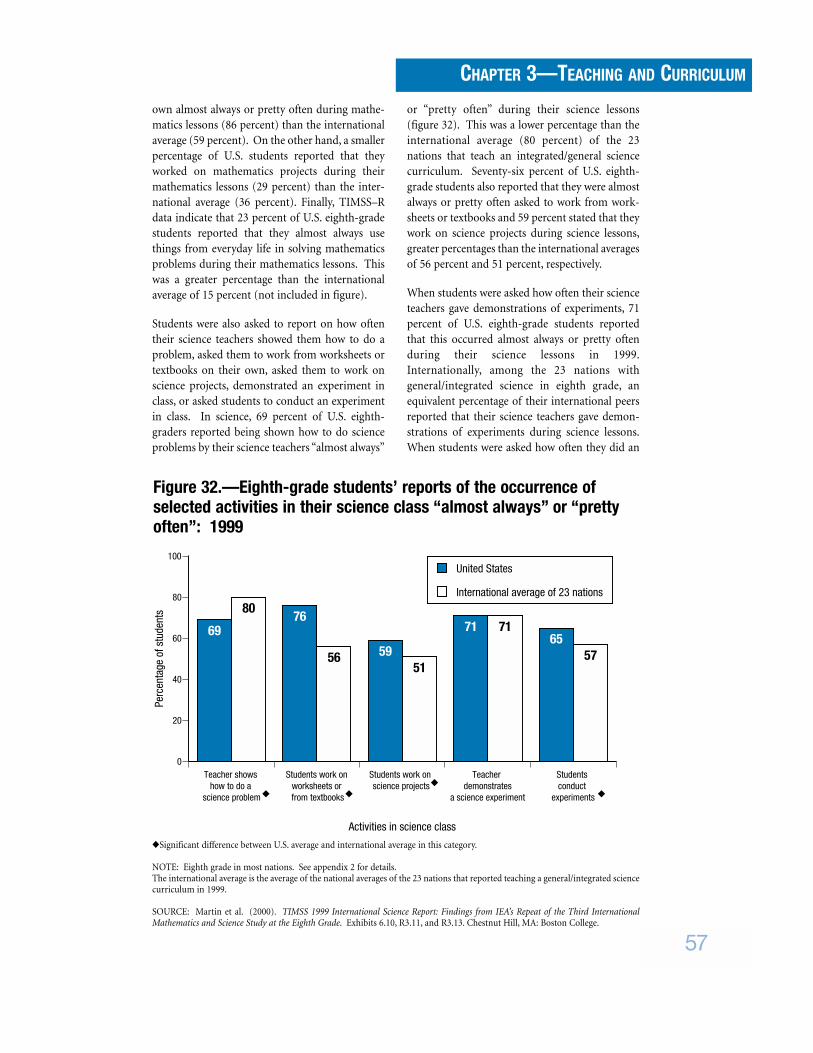
Students were also asked to report on how oftentheir science teachers showed them how to do aproblem, asked them to work from worksheets ortextbooks on their own, asked them to work onscience projects, demonstrated an experiment inclass, or asked students to conduct an experimentin class. In science, 69 percent of U.S. eighth-graders reported being shown how to do scienceproblems by their science teachers “almost always”
or “pretty often” during their science lessons(figure 32). This was a lower percentage than theinternational average (80 percent) of the 23nations that teach an integrated/general sciencecurriculum. Seventy-six percent of U.S. eighth-grade students also reported that they were almostalways or pretty often asked to work from work-sheets or textbooks and 59 percent stated that theywork on science projects during science lessons,greater percentages than the international averagesof 56 percent and 51 percent, respectively.
When students were asked how often their scienceteachers gave demonstrations of experiments, 71percent of U.S. eighth-grade students reportedthat this occurred almost always or pretty oftenduring their science lessons in 1999.Internationally, among the 23 nations withgeneral/integrated science in eighth grade, anequivalent percentage of their international peersreported that their science teachers gave demon-strations of experiments during science lessons.When students were asked how often they did an
57
CHAPTER 3—TEACHING AND CURRICULUM
0
20
40
60
80
100
Perc
enta
ge o
f stu
dent
s
69
8076
56 5951
71 7165
57
United States
International average of 23 nations
Activities in science class
Teacher shows how to do a
science problem
Students work on worksheets or from textbooks
Students work on science projects
Teacher demonstrates
a science experiment
Students conduct
experiments
�Significant difference between U.S. average and international average in this category.
NOTE: Eighth grade in most nations. See appendix 2 for details.The international average is the average of the national averages of the 23 nations that reported teaching a general/integrated sciencecurriculum in 1999.
SOURCE: Martin et al. (2000). TIMSS 1999 International Science Report: Findings from IEA’s Repeat of the Third InternationalMathematics and Science Study at the Eighth Grade. Exhibits 6.10, R3.11, and R3.13. Chestnut Hill, MA: Boston College.
Figure 32.—Eighth-grade students’ reports of the occurrence ofselected activities in their science class “almost always” or “prettyoften”: 1999
experiment or practical investigation in theirscience lesson, 65 percent of U.S. eighth-gradersreported that this occurred almost always or prettyoften during their science lessons. This repre-sented a higher percentage of students than theinternational average of 57 percent.
How often did U.S. studentsuse calculators in their mathe-matics lessons? In 1999, 42 percent of U.S. eighth-grade studentsreported that they “almost always” used calcula-tors in their mathematics lessons. This was ahigher percentage of students than the interna-tional average (19 percent). In comparison to theUnited States, two nations—the Netherlands andAustralia—had a higher percentage of studentsresponding that they used calculators almostalways in their mathematics lessons. Eight percentof U.S. eighth-grade students reported never usingcalculators in their mathematics lessons, whichwas lower than the international average of 32percent of students.
Did students have access tocomputers and the Internet,and how did schools, teachers,and students report usingthese tools?Some believe that access to computers, software,and the Internet provides additional tools forteachers to create meaningful lessons from whichstudents can learn, helping to reinforce andsupplement their classroom learning. In short, itis believed that these technological tools can, whencoherently integrated into lessons, create addi-tional opportunities for learning.
Access to computers and the Internet is the firststep toward using these technological tools inteaching and learning mathematics and science.U.S. students had a high level of access to comput-ers and the Internet at home and at school relativeto eighth-graders in other nations in 1999. Eightypercent of U.S. eighth-graders reported that theyhad a computer in their home, a higher percentagethan the international average of 45 percent(figure 33). Fifty-nine percent of U.S. eighth-gradestudents reported having Internet access at home,
58
CHAPTER 3—TEACHING AND CURRICULUM
0
20
40
60
80
100
Perc
enta
ge o
f stu
dent
s 80
45
59
18
76
25
81
43
United States
International average
Have compter at home Have Internet access at home
Have Internet access at school
Have Internet access elsewhere
�Significant difference between U.S. average and international average in this category.
NOTE: Eighth grade in most nations. See appendix 2 for details.The international average is the average of the national averages of the nations that reported data.
SOURCE: Martin et al. (2000). TIMSS 1999 International Science Report: Findings from IEA's Repeat of the Third InternationalMathematics and Science Study at the Eighth Grade. Exhibits R1.1 and 6.17. Chestnut Hill, MA: Boston College.
Figure 33.—Eighth-grade students’ reports of access to computersand the Internet: 1999
76 percent reported access at school, and 81percent reported access elsewhere (e.g., libraries orcommunity centers); all of these percentages weregreater than the international averages.
Access to computers, software, and the Internetand, by extension, their use in and for mathemat-ics and science lessons, can be affected byshortages of these tools at school. Schools of 47percent of U.S. eighth-grade students reportedthat shortages of computers for instructionaffected mathematics instruction “some” or “a lot,”similar to the international average of 57 percent.Schools of 45 percent of U.S. eighth-gradestudents also reported that shortages of computersfor instruction affected science instruction “some”or “a lot,” a smaller percentage than the interna-tional average of 59 percent. In regard to computersoftware, schools of almost half of U.S. eighth-grade students reported that shortages affectedmathematics instruction and science instruction“some or a lot” (48 percent and 47 percent, respec-tively), which were similar to the internationalaverages.
U.S. eighth-grade students were more than twiceas likely as their peers in other nations to be in
schools with networked computer access to theInternet. Ninety-one percent of U.S. eighth-gradestudents were in schools that reported Internetaccess, a higher percentage than the internationalaverage of 41 percent. Internationally, an averageof 29 percent of students were in schools thatreported they had no Internet access at all and noplans to get it—more than a quarter of all studentssurveyed internationally. Less than 1 percent ofU.S. eighth-grade students were enrolled in aschool that reported no access to the Internet andno plans to obtain access.
Access to computers and the Internet is one thing,but using them is another. Eighth-grade studentswere asked how often they use computers in theirmathematics and science classes, and how oftentheir teachers use computers to demonstrate ideasin class.
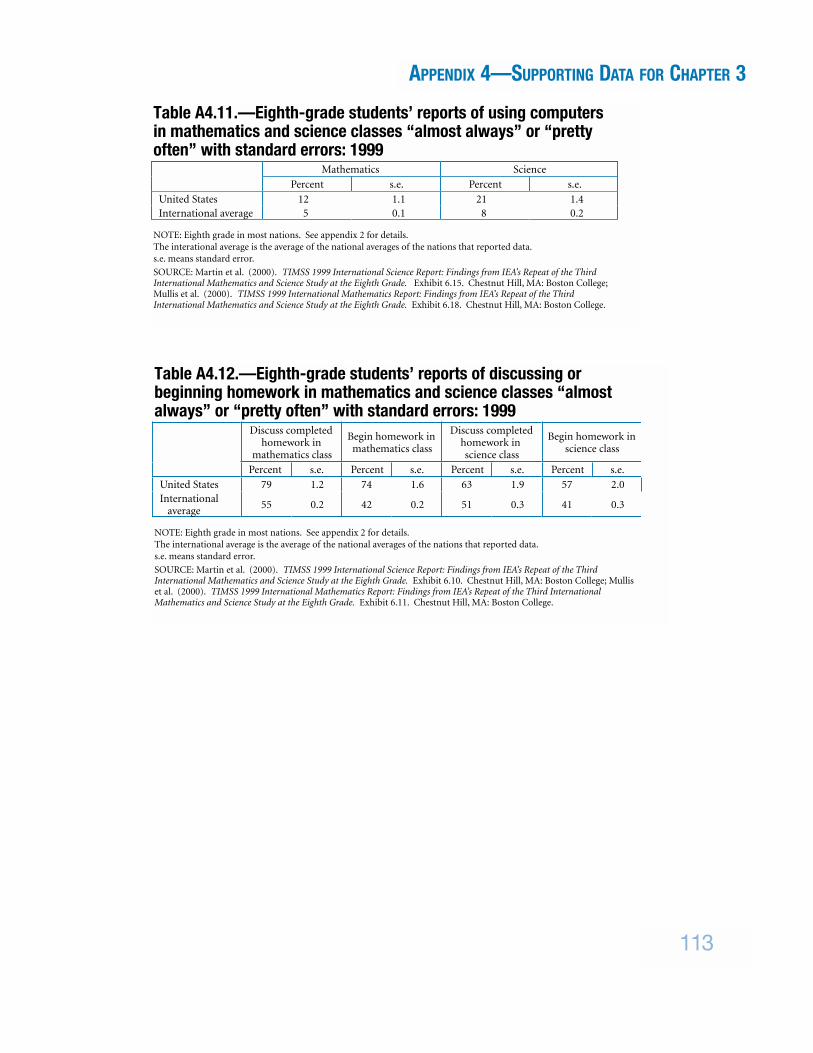
Twelve percent of U.S. eighth-graders reportedusing computers in mathematics class “almostalways” or “pretty often” in 1999, which was ahigher percentage than the international averageof 5 percent (figure 34). Sixty-one percent of U.S.eighth-grade students reported that they neverused computers in their mathematics classes,
59
CHAPTER 3—TEACHING AND CURRICULUM
Mathematics Science
0
20
40
60
80
100
Perc
enta
ge o
f stu
dent
s
12 521 8
United States
International average
�Significant difference between U.S. average and international average in this category.
NOTE: Eighth grade in most nations. See appendix 2 for details.The international average is the average of the national averages of the nations that reported data.
SOURCE: Martin et al. (2000). TIMSS 1999 International Science Report: Findings from IEA’s Repeat of the Third InternationalMathematics and Science Study at the Eighth Grade. Exhibit 6.15. Chestnut Hill, MA: Boston College; Mullis et al. (2000). TIMSS1999 International Mathematics Report: Findings from IEA’s Repeat of the Third International Mathematics and Science Study at theEighth Grade. Exhibit 6.18. Chestnut Hill, MA: Boston College.
Figure 34.—Eighth-grade students’ reports on using computers inmathematics and science classes “almost always” or “pretty often”:1999
which was below the international average of 80percent. Nine percent of U.S. eighth-gradestudents reported that their teachers usedcomputers to present mathematics ideas almostalways or pretty often, which was higher than theinternational average of 5 percent.
Among U.S. eighth-graders who indicated accessto the Internet, 13 percent reported they used e-mail to work with students in other schools onmathematics projects at least once a month, and17 percent said that they used the World WideWeb to access information for mathematicsprojects at least once a month. A higher percent-age of U.S. eighth-graders reported using theWorld Wide Web to access information for math-ematics projects than the international average.
In science, 21 percent of U.S. eighth-gradersreported using computers in science class “almostalways” or “pretty often” in 1999, which was higherthan the international average of 8 percent (figure34).11 Twenty percent of U.S. students reportedtheir teachers used computers to present scienceideas, which was higher than the internationalaverage of 10 percent.12 Among U.S. eighth-gradestudents who indicated access to the Internet, 9percent e-mailed students in other schools aboutscience projects at least once a month, and 29percent accessed information on the World WideWeb for science projects at least once a month.U.S. students’ use of e-mail in this way for science-related projects was lower than the internationalaverage, and use of the Internet to access scienceinformation for science-related projects washigher than the international average.13
How often did U.S. studentsdiscuss completed homeworkor begin homework in theirmathematics and scienceclasses?Many believe that homework is an important partof the learning process and that more homeworkleads to improvements in achievement. PriorTIMSS reports have not found a relationship
between amount of homework assigned or hoursspent on homework and achievement levels acrossnations (NCES, 1996, 1997c, 1998). That is, therewas no consistent pattern of greater amounts ofhomework relating to higher achievement onTIMSS.
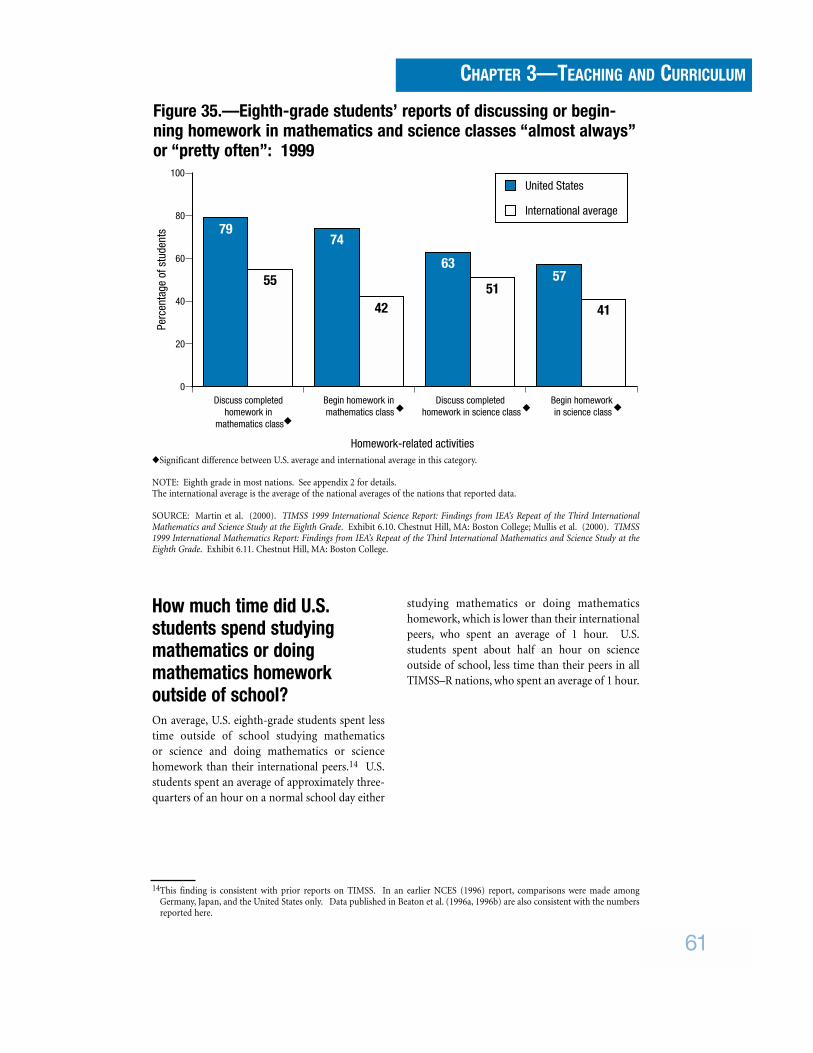
Homework can also be used to stimulate discus-sion in the classroom, however. TIMSS–R askedeighth-grade students how often they discuss theircompleted homework in their mathematics andscience classes. A higher percentage of U.S. eighth-grade students reported that they discussed theircompleted homework during mathematics classthan their international peers (figure 35). Whenasked whether they could begin their mathematicshomework in class, a higher percentage of U.S.students reported that they could than students in32 other nations. Seventy-four percent of U.S.eighth-graders reported that they “almost always”or “pretty often” could begin their mathematicshomework during class compared to the interna-tional average of 42 percent.
When compared to their peers in the 22 othernations that offer a general/integrated sciencecurriculum, a higher percentage of U.S. eighth-grade students reported that they discussed theirscience homework in class than their peers in 15nations. Sixty-three percent of U.S. eighth-gradersreported that they “almost always” or “prettyoften” discussed their completed sciencehomework in class compared to the internationalaverage of 51 percent (figure 35). Among thesesame nations, the United States had a higherpercentage of students who reported that theybegan their homework in science class than in 15nations. Fifty-seven percent of U.S. eighth-gradestudents reported that they “almost always” or“pretty often” could begin their science homeworkduring science class, compared to the interna-tional average of 41 percent.
60
CHAPTER 3—TEACHING AND CURRICULUM
11Comparisons among the 23 nations that generally teach general/integrated science.12Comparisons among the 23 nations that generally teach general/integrated science.13Comparisons among all 38 TIMSS–R nations.
How much time did U.S.students spend studying mathematics or doing mathematics homeworkoutside of school? On average, U.S. eighth-grade students spent lesstime outside of school studying mathematics or science and doing mathematics or sciencehomework than their international peers.14 U.S.students spent an average of approximately three-quarters of an hour on a normal school day either
studying mathematics or doing mathematicshomework, which is lower than their internationalpeers, who spent an average of 1 hour. U.S.students spent about half an hour on scienceoutside of school, less time than their peers in allTIMSS–R nations, who spent an average of 1 hour.
61
CHAPTER 3—TEACHING AND CURRICULUM
0
20
40
60
80
100Pe
rcen
tage
of s
tude
nts
Homework-related activities
79
55
74
42
63
5157
41
United States
International average
Discuss completed homework in
mathematics class
Begin homework in mathematics class
Discuss completed homework in science class
Begin homework in science class
�Significant difference between U.S. average and international average in this category.
NOTE: Eighth grade in most nations. See appendix 2 for details.The international average is the average of the national averages of the nations that reported data.
SOURCE: Martin et al. (2000). TIMSS 1999 International Science Report: Findings from IEA’s Repeat of the Third InternationalMathematics and Science Study at the Eighth Grade. Exhibit 6.10. Chestnut Hill, MA: Boston College; Mullis et al. (2000). TIMSS1999 International Mathematics Report: Findings from IEA’s Repeat of the Third International Mathematics and Science Study at theEighth Grade. Exhibit 6.11. Chestnut Hill, MA: Boston College.
Figure 35.—Eighth-grade students’ reports of discussing or begin-ning homework in mathematics and science classes “almost always”or “pretty often”: 1999
14This finding is consistent with prior reports on TIMSS. In an earlier NCES (1996) report, comparisons were made amongGermany, Japan, and the United States only. Data published in Beaton et al. (1996a, 1996b) are also consistent with the numbersreported here.
CHAPTER 4FUTURE DIRECTIONS
The findings presented in this report examine theperformance of U.S. eighth-grade students incomparison to their peers internationally. Mostimportantly, perhaps, this report documents themathematics and science performance of ourstudents between two points in time, a first for anyinternational study. Regular participation ininternational data collections, such as TIMSS andTIMSS–R, provides an unprecedented opportu-nity to examine the pace of change in education inthe United States and other nations over time,informing expectations of what can be achieved.
TIMSS and TIMSS–R were designed to documentthe mathematics and science performance ofnations in comparison to one another. Thesestudies were developed to document the systemsput into place to support school mathematics andscience teaching and learning in many differentnations and the outcomes of these systems asmeasured on a set of items agreed upon at theinternational level. TIMSS and TIMSS–R were notspecifically designed to indicate the success orfailure of specific improvement efforts in theUnited States.
Of course, as with any study, the findings also raisemany new questions, ones that can be pursuedthrough future analyses of the TIMSS andTIMSS–R data, through analyses of other large-scale data sets such as NAEP, or through futuredata collections. This report presents an initialexamination of the TIMSS and TIMSS–R data.Future reports are planned, and these will focus onmore in-depth analyses of the data. In addition,each nation participating in TIMSS–R will releaseits own analysis of the data. Insights from eachnation’s findings can add to our understanding ofwhat policies and practices may have contributedto observed changes in achievement. The TIMSSdata set has been available for analysis byresearchers, practitioners, and policymakers forsome time. The TIMSS–R data set will also bemade available in the first half of 2001. Finally, theresults of the TIMSS–R Benchmarking Projectinvolving 27 states, districts, and consortia ofdistricts, available in April 2001, will provide anopportunity to examine eighth-grade mathemat-ics and science achievement data at a more locallevel.
Among the many questions raised by the findingsin this report are the following:
� Why did U.S. students’ performance relative tothe international average decrease as gradelevels increase? What is happening in theintervening years between the fourth andeighth grades in the United States?
� Has the educational context for mathematicsand science changed in the United Statesbetween 1995 and 1999?
� What education-related background factorsare related to high achievement acrossnations? What education-related backgroundfactors are related to changes in achievementacross nations over time?
� What is the relationship between performancein mathematics and performance in science atthe student, school, and national levels?
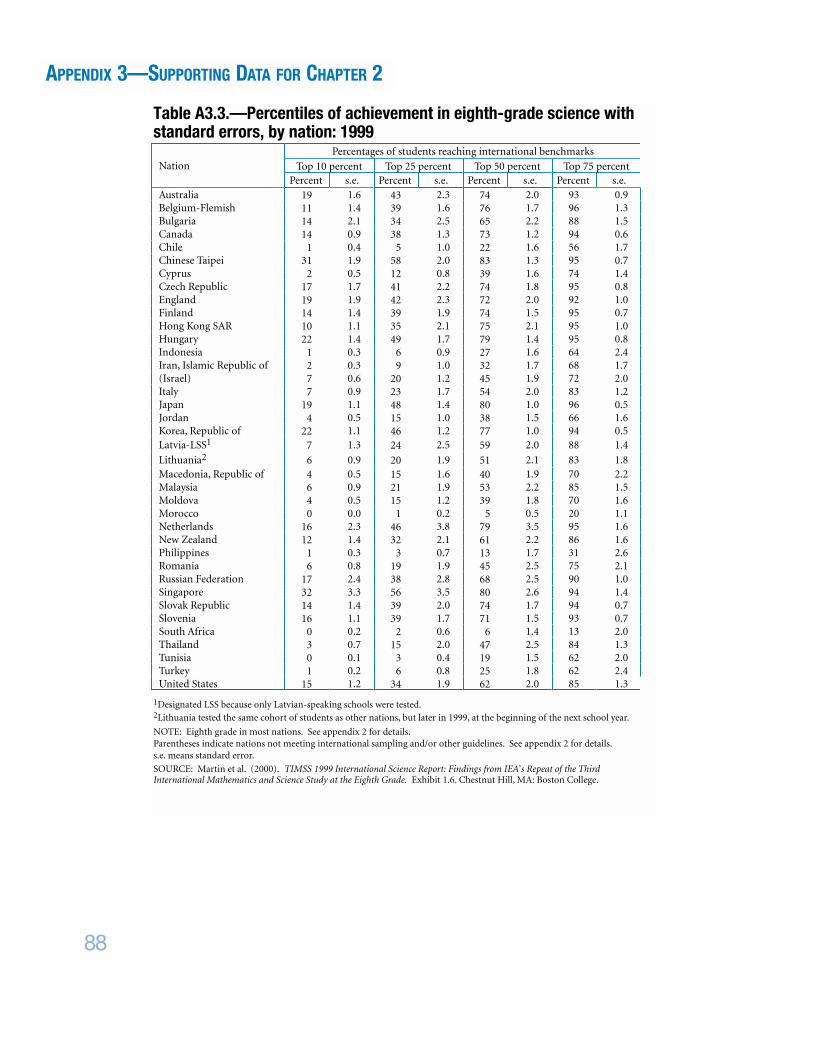
� What is the relationship between internationalbenchmarks of performance (e.g., top 10percent) and the actual assessment items?Which items are students at or above theinternational top 10 percent benchmark likelyto answer correctly? Which items are studentsat or above the international top 25 percentbenchmark likely to answer correctly?
� In what areas of mathematics have blackstudents in the United States been makingprogress? How does this progress relate topolicies at the national, state, and local levels?
� What are possible reasons for the achievementgap in science between girls and boys inTIMSS–R? Did girls and boys differ inachievement on the content areas? How dothese findings relate to decisions made at thenational, state, and local levels?
� When controlling for other factors, how dodifferent groups of U.S. students perform onTIMSS–R?
� What policies and practices have been insti-tuted in nations that experienced significantincreases and in those that experiencedsignificant decreases in achievement? What isthe relationship between these policies andpractices and achievement?
64
CHAPTER 4—FUTURE DIRECTIONS
Of course, there are many other questions that astudy such as this raises. And some of the questions raised cannot be answered solely byexamining data from TIMSS and TIMSS–R. It isexpected, however, that further analyses of TIMSSand TIMSS–R will help address many of thesequestions and raise new ones to be pursued infuture data collections. The additional components of TIMSS–R—that is, the TIMSS–RVideotape Classroom Study, the TIMSS–RBenchmarking Project, and the NAEP/TIMSS–RLinking Study—will add to the rich resourcesavailable for analysis and reflection. Moreover, itis hoped that TIMSS–R, including these compo-nent studies, will continue to stimulate discussionof the state of mathematics and science teachingand learning in the United States amongresearchers, policymakers, practitioners, parents,and students, much as TIMSS did.
65
CHAPTER 4—FUTURE DIRECTIONS
Works Cited
Beaton, A.E., Mullis, I.V.S., Martin, M.O.,Gonzalez, E.J., Smith, T.A., and Kelly, D.L.(1996a). Mathematics Achievement in theMiddle School Years: IEA’s Third InternationalMathematics and Science Study. Chestnut Hill,MA: Boston College.
Beaton, A.E., Martin, M.O., Mullis, I.V.S.,Gonzalez, E.J., Smith, T.A., and Kelly, D.L.(1996b). Science Achievement in the MiddleSchool Years: IEA’s Third InternationalMathematics and Science Study. Chestnut Hill,MA: Boston College.
Board on International Comparative Studies inEducation, National Research Council. (1990).A Framework and Principles for InternationalComparative Studies in Education. Washington,DC: National Academy Press.
Coleman, J.S., Hoffer, T., and Kilgore, S. (1981).Public and Private Schools: An Analysis of HighSchool and Beyond, a National LongitudinalStudy for the 1980s (NCES 82–230).Washington, DC: U.S. Government PrintingOffice.
Coleman, J.S., Hoffer, T., and Kilgore, S. (1982).High School Achievement. New York: BasicBooks.
Featherman, D. L. (1981). The Life-SpanPerspective. In The National ScienceFoundation’s 5-Year Outlook on Science andTechnology (vol. 2). Washington, DC: U.S.Government Printing Office.
Halsey, A.H., Heath, A.F., and Ridge, J.M. (1984).The Political Arithmetic of Public Schools. InG. Walford (Ed.), British Public School: Policyand Practice (pp. 9–44). Lewes, DE: FalmerPress.
Jencks, C. and Phillips, M. (1998). The Black-White Test Score Gap. Washington, DC:Brookings Institution.
Jimenez, E. and Lockheed, M.E. (Eds.). (1991).Private Versus Public Education: AnInternational perspective. Special issue ofInternational Journal of Educational Research,15.
Johnson, E.G. and Siegendorf, A. (1998). Linkingthe National Assessment of Educational Progress(NAEP) and the Third InternationalMathematics and Science Study (TIMSS):Eighth-Grade Results (NCES 98–500).Washington, DC: U.S. Government PrintingOffice.
Martin, M.O. and Gregory, K.D. (Eds.). (2000).TIMSS 1999 Technical Report. Chestnut Hill,MA: Boston College.
Martin, M.O., Mullis, I.V.S., Gonzalez, E.J.,Gregory, K.D., Smith, T.A., Chrostowski, S.J.,Garden, R.A., and O’Connor, K.M. (2000).TIMSS 1999 International Science Report:Findings from IEA’s Repeat of the ThirdInternational Mathematics and Science Study atthe Eighth Grade. Chestnut Hill, MA: BostonCollege.
Medrich, E.A. and Griffith, J.E. (1992).International Mathematics and ScienceAssessments: What Have We Learned? (NCES92–011). Washington, DC: U.S. GovernmentPrinting Office.
Mullis, I.V.S., Martin, M.O., Gonzalez, E.J.,Gregory, K.D., Garden, R.A., O’Connor, K.M.,Chrostowski, S.J., and Smith, T.A. (2000).TIMSS 1999 International Mathematics Report:Findings from IEA’s Repeat of the ThirdInternational Mathematics and Science Study atthe Eighth Grade. Chestnut Hill, MA: BostonCollege.
National Center for Education Statistics, U.S.Department of Education. (1996). PursuingExcellence: A Study of U.S. Eighth-GradeMathematics and Science Teaching, Learning,Curriculum, and Achievement in InternationalContext (NCES 97–198). L. Peak. Washington,DC: U.S. Government Printing Office.
National Center for Education Statistics, U.S.Department of Education. (1997a). NAEP 1996Mathematics Report Card for the Nation and theStates: Findings from the National Assessment ofEducational Progress (NCES 97–488). C.M.Reese, K.E. Miller, J. Mazzeo, and J.A. Dossey.Washington, DC: U.S. Government PrintingOffice.
68
WORKS CITED
National Center for Education Statistics, U.S.Department of Education. (1997b). NAEP1996 Science Report Card for the Nation and theStates (NCES 97–497). C.T. O’Sullivan, C.M.Reese, and J. Mazzeo. Washington, DC: U.S.Government Printing Office.
National Center for Education Statistics, U.S.Department of Education. (1997c). PursuingExcellence: A Study of U.S. Fourth-GradeMathematics and Science Achievement inInternational Context (NCES 97–255). M.Frase, P. Jakworth, L. Martin, M. Orland, E.Owen, L. Peak, W. Schmidt, L. Suter, S.Takahira, and T. Williams. Washington, DC:U.S. Government Printing Office.
National Center for Education Statistics, U.S.Department of Education. (1998). PursuingExcellence: A Study of U.S. Twelfth-GradeMathematics and Science Achievement inInternational Context (NCES 98–049). S.Takahira, P. Gonzales, M. Frase, and L.S.Salganik. Washington, DC: U.S. GovernmentPrinting Office.
National Center for Education Statistics, U.S.Department of Education. (1999). Digest ofEducation Statistics: 1998 (NCES 1999–036).Washington, DC: U.S. Government PrintingOffice.
National Center for Education Statistics, U.S.Department of Education. (2000a).Mathematics and Science in the Eighth Grade:Findings from the Third InternationalMathematics and Science Study (NCES2000–014). T. Williams, D. Levine, L. Jocelyn, P.Butler, C. Heid, and J. Haynes. Washington,DC: U.S. Government Printing Office.
National Center for Education Statistics, U.S.Department of Education. (2000b). TheCondition of Education: 2000 (NCES2000–062). Washington, DC: U.S. GovernmentPrinting Office.
National Center for Education Statistics, U.S.Department of Education. (2000c). NAEP 1999Trends in Academic Progress: Three Decades ofStudent Performance (NCES 2000–469). J.R.Campbell, C.M. Hombo, and J. Mazzeo.
Washington, DC: U.S. Government PrintingOffice.
National Science Board. (2000). Science andEngineering Indicators–2000 (NSB–00–1).Arlington, VA: National Science Foundation.
Riordan, C. (1997). Equality and Achievement: AnIntroduction to the Sociology of Education. NewYork: Addison Wesley Longman.
Robitaille, D.F., Schmidt, W.H., Raizen, S.,McKnight, C., Britton, E., and Nicol, C. (1993).Curriculum Frameworks for Mathematics andScience. TIMSS monograph no. 1. Vancouver,BC: Pacific Educational Press.
Schmidt, W.H., McKnight, C.C., Valverde, G.A.,Houang, R.T., and Wiley, D.E. (1997). ManyVisions, Many Aims, Volume 1: A Cross-NationalInvestigation of Curricular Intentions in SchoolMathematics. Dordrecht, Netherlands: KluwerAcademic Publishers.
Schmidt, W.H., Raizen, S.A., Britton, E.D.,Bianchi, L.J., and Wolfe, R.G. (1997). ManyVisions, Many Aims, Volume 2: A Cross-NationalInvestigation of Curricular Intentions in SchoolScience. Dordrecht, Netherlands: KluwerAcademic Publishers.
Sewell, W.H., Hauser, R.M., and Wolfe, W.C.(1976). Causes and Consequences of HigherEducation: Models of the Status AttainmentProcess. In W.H. Sewell, R.C. Hauser and D.L.Featherman (Eds.), Schooling and Achievementin American Society. New York: Academic Press.
Stigler, J.W., Gonzales, P., Kawanaka, T., Knoll, S.,and Serrano, A. (1999). The TIMSS VideotapeClassroom Study: Methods and Findings from anExploratory Research Project on Eighth-GradeMathematics Instruction in Germany, Japan, andthe United States (NCES 1999–074).Washington, DC: U.S. Government PrintingOffice.
Welch, C.M. (2000). United States. In D.F.Robitaille, A.F. Beaton, and T. Plomp (Eds.),The Impact of TIMSS on the Teaching andLearning of Mathematics and Science (pp.161–167). Vancouver, BC: Pacific EducationalPress.
69
WORKS CITED
Williams, T.H. and Carpenter, P.G. (1990). PrivateSchooling and Public Achievement. AustralianJournal of Education, 34 (1), 3–24.
Wilson, W.J. (1987). The Truly Disadvantaged: TheInner City, the Underclass, and Public Policy.Chicago: University of Chicago Press.
Wilson, W.J. (1996). When Work Disappears.Political Science Quarterly, 111, 567–595.
70
WORKS CITED
Appendix 1TIMSS Publications
The following reports are intended to serve asexamples of some of the numerous publicationsthat have been produced in relation to the 1995Third International Mathematics and ScienceStudy (TIMSS). For an extended version of thislist, please visit the NCES TIMSS web site athttp://nces.ed.gov/timss/timss95.
Gonzalez, E.J., Smith, T.A., and Kelly, D.L.(1996). Science Achievement in the MiddleSchool Years: IEA’s Third InternationalMathematics and Science Study. Chestnut Hill,MA: Boston College.
Beaton, A.E., Mullis, I.V.S., Martin, M.O.,Gonzalez, E.J., Kelly, D.L., and Smith, T.A.(1996). Mathematics Achievement in the MiddleSchool Years: IEA’s Third InternationalMathematics and Science Study. Chestnut Hill,MA: Boston College.
Martin, M.O., Mullis, I.V.S., Beaton, A.E.,Gonzalez, E.J., Smith, T.A., and Kelly, D.L.(1997). Science Achievement in the PrimarySchool Years: IEA’s Third InternationalMathematics and Science Study. Chestnut Hill,MA: Boston College.
Mullis, I.V.S., Martin, M.O., Beaton, A.E.,Gonzalez, E.J., Kelly, D.L., and Smith, T.A.(1997). Mathematics Achievement in thePrimary School Years: IEA’s Third InternationalMathematics and Science Study. Chestnut Hill,MA: Boston College.
Mullis, I.V.S., Martin, M.O., Beaton, A.E.,Gonzalez, E.J., Kelly, D.L., and Smith, T.A.(1998). Mathematics and Science Achievementin the Final Year of Secondary School: IEA’s ThirdInternational Mathematics and Science Study.Chestnut Hill, MA: Boston College.
National Center for Education Statistics, UnitedStates Department of Education. (1996).Pursuing Eexcellence: A Study of U.S. Eighth-Grade Mathematics and Science Teaching,Learning, Curriculum, and Achievement inInternational Context (NCES 97–198).
Washington, DC: U.S. Government PrintingOffice.
National Center for Education Statistics, UnitedStates Department of Education. (1997).Pursuing Excellence: A Study of U.S. Fourth-Grade Mathematics and Science Achievement inInternational Context (NCES 97–255).Washington, DC: U.S. Government PrintingOffice.
National Center for Education Statistics, UnitedStates Department of Education. (1998).Pursuing Excellence: A Study of U.S. Twelfth-Grade Mathematics and Science Achievement inInternational Context (NCES 98–049).Washington, DC: Government Printing Office.
National Center for Education Statistics, UnitedStates Department of Education. (1999).Highlights from TIMSS (NCES 1999–081).Washington, DC: U.S. Government PrintingOffice.
National Center for Education Statistics, UnitedStates Department of Education. (2000).Mathematics and Science in the Eighth Grade:Findings from the Third InternationalMathematics and Science Study (NCES2000–014). Washington, DC: U.S. GovernmentPrinting Office.
TIMSS Resource KitUnited States Department of Education. Office of
Educational Research and Improvement.(1997). Attaining Excellence: A TIMSS ResourceKit (ORAD 97–1010). Washington, DC: U.S.Government Printing Office.
Office of Educational Research and Improvement,United States Department of Education (1999).Attaining Excellence: TIMSS as a Starting Pointto Examine Mathematics Assessments (ORAD1999–1104). Washington, DC: U.S.Government Printing Office.
72
APPENDIX 1—TIMSS PUBLICATIONS
TIMSS Videotape ClassroomStudy ReportsNational Center for Education Statistics, United
States Department of Education. (2000).Highlights from the TIMSS Videotape ClassroomStudy (NCES 2000–094). Washington, DC:U.S. Government Printing Office.
Stigler, J.W., Gonzales, P., Kawanaka, T., Knoll, S.,and Serrano, A. (1999). The TIMSS VideotapeClassroom Study: Methods and Findings from anExploratory Research Project on Eighth-GradeMathematics Instruction in Germany, Japan, andthe United States (NCES 1999–074).Washington, DC: U.S. Government PrintingOffice.
Jakwerth, P.M., and Houang, R.T. (1999).Facing the Consequences: Using TIMSS for aCloser Look at U.S. Mathematics and ScienceEducation. Dordrecht, Netherlands: KluwerAcademic Publishers.
Schmidt, W.H., McKnight, C.C., and Raizen, S.A.(1997). A Splintered Vision: An Investigation ofU.S. Science and Mathematics Education.Dordrecht, Netherlands: Kluwer AcademicPublishers.
Schmidt, W.H., McKnight, C.C., Valverde, G.A.,Houang, R.T., and Wiley, D.E. (1997). ManyVisions, Many Aims Volume 1: A Cross-NationalInvestigation of Curricular Intentions in SchoolMathematics. Dordrecht, Netherlands: KluwerAcademic Publishers.
Schmidt, W.H., Raizen, S.A., Britton, E.D.,Bianchi, L.J., and Wolfe, R.G. (1997). ManyVisions, Many Aims Volume 2: A Cross-NationalInvestigation of Curricular Intentions in SchoolScience. Dordrecht, Netherlands: KluwerAcademic Publishers.
TIMSS Case Study ReportsOffice of Educational Research and Improvement,
United States Department of Education (1998).The Educational System in Japan: Case StudyFindings (SAI 98–3008). Washington, DC: U.S.Government Printing Office.
Office of Educational Research and Improvement,United States Department of Education.(1998). The Educational System in Germany:Case Study Findings (SAI 1999–3001).Washington, DC: U.S. Government PrintingOffice.
Office of Educational Research and Improvement,United States Department of Education (1998).The Educational System in the United States:Case Study Findings (SAI 1999–3000).Washington, DC: U.S. Government PrintingOffice.
Policy Publications Resultingfrom TIMSSNational Research Council. (1999). Global
Perspectives for Local Action: Using TIMSS toImprove U.S. Mathematics and ScienceEducation. Washington, DC: NationalAcademy Press.
Office of Educational Research and Improvement,United States Department of Education (1998).Policy Brief: What the Third InternationalMathematics and Science Study (TIMSS) Meansfor Systemic School Improvement. Washington,DC: U.S. Government Printing Office.
Silver, E.A. (1998). Improving Mathematics inMiddle School: Lessons from TIMSS and RelatedResearch (ORAD 98–1107). Washington, DC:U.S. Government Printing Office.
Wilson, L.D. and Blank, R.K. (1999). ImprovingMathematics Education Using Results fromNAEP and TIMSS. Washington, DC: Councilof Chief State School Officers.
73
APPENDIX 1—TIMSS PUBLICATIONS
Appendix 2Technical Notes
SAMPLING INFORMATIONTIMSS–R nations were asked to identify eligiblestudents based on a common set of criteria,allowing for adaptation to nation-specific situa-tions. The international desired populationconsisted of all students in the nation who wereenrolled in the upper of the two adjacent gradesthat contained the greatest proportion of thirteen-year-olds at the time of testing. In the UnitedStates and most other nations, this corresponds tograde 8. If the national desired population of anation fell below 65 percent, the nation’s name isannotated to reflect this fact (table A2.1).
The international guidelines specified the follow-ing sampling standards:
� The sample was to be representative of at least90 percent of students in the total populationeligible for the study. Therefore, nationalexclusion rates were required to be less than 10percent.
� The school participation rate without the useof replacement schools were required to be atleast 50 percent, and
� School and student participation rates (after replacements) were required to be 85percent or
� The combined participation rate (the productof school and student participation rates after replacements) were required to be at least75 percent.
Nations were also required to submit a samplingplan for approval by the TIMSS InternationalStudy Center.
All deviations from the international guidelinesare bolded in table A2.1.
A NOTE ON U.S.EXCLUSION RATESThe reported exclusion rate for the United Statesfor grade 8 TIMSS was 1.7 percent, and 3.9 percentfor TIMSS–R. The difference in the exclusion ratefor the United States between TIMSS andTIMSS–R may be explained as a difference inreporting procedures between the two studies,rather than an increase in the number of students
declared not eligible to participate in theTIMSS–R assessment.
For the four nations that sampled more than oneclassroom per school, including the United States,exclusion of students could have occured at threelevels: at the school level, at the classroom level,and at the student level. In the United States, therewas negligible exclusion at the school level in bothTIMSS and TIMSS–R. Tracking proceduresaccounted for exclusions of students withinselected classes, but did not account for wholeclassroom exclusion. Thus, the reported U.S.TIMSS grade 8 exclusion rate of 1.7 percentcovered only student-within-classroom exclu-sions, not whole classroom exclusions. It is likely,therefore, that this represents an underestimate ofthe overall exclusion rate.
For TIMSS–R, reporting procedures for exclusionrates in the United States were revised to permittracking of excluded classrooms. Thus, the UnitedStates reports an exclusion rate within classroomsof 1.1 percent and a classroom exclusion rate of2.8 percent in TIMSS–R, for a total within-schoolexclusion rate of 3.9 percent. The U.S. TIMSS–Rexclusion rate is consistent with experience in theNational Assessment of Educational Progress(NAEP) when accommodations are not offered.The available evidence thus points to no realchange in the level of exclusion for the UnitedStates in TIMSS–R compared to TIMSS.
WEIGHTING, SCALING ANDPLAUSIBLE VALUESBefore the data were analyzed, responses from thegroups of students assessed were assignedsampling weights to ensure that their representa-tion in TIMSS–R results matched their actualpercentage of the school population in the gradeassessed. Based on these sampling weights, theanalyses of TIMSS–R data were conducted in twomajor phases—scaling and estimation. During thescaling phase, item response theory (IRT) proce-dures were used to estimate the measurementcharacteristics of each assessment question.During the estimation phase, the results of thescaling were used to produce estimates of studentachievement. Subsequent analyses related theseachievement results to the background variables
76
APPENDIX 2—TECHNICAL NOTES
77
APPENDIX 2—TECHNICAL NOTES
Table A2.1.—Coverage of target population, by nation: 1999
1Designated LSS because only Latvian-speaking schools were tested.2Lithuania tested the same cohort of students as other nations, but later in 1999, at the beginning of the next school year.
SOURCE: Mullis et al. (2000). TIMSS 1999 International Mathematics Report: Findings from IEA’s Repeat of the Third InternationalMathematics and Science Study at the Eighth Grade. Exhibits 2, A.5, and A.8. Chestnut Hill, MA: Boston College.
78
APPENDIX 2—TECHNICAL NOTES
Table A2.2.—Student and school samples and participation rates, bynation: 1999
1Designated LSS because only Latvian-speaking schools were tested which represents 61 percent of the population.2Lithuania tested the same cohort of students as other nations, but later in 1999, at the beginning of the next school year.
SOURCE: Mullis et al. (2000). TIMSS 1999 International Mathematics Report: Findings from IEA’s Repeat of the ThirdInternational Mathematics and Science Study at the Eighth Grade. Exhibits A.6, A.7, and A.8. Chestnut Hill, MA: BostonCollege.
collected by TIMSS–R. TIMSS–R data areextremely important in terms of the cost to obtainthem and the reliance placed on the reports thatuse them. Therefore, the scaling and analysis ofthese data were carefully conducted and includeextensive quality control checks.
Weighting—Responses from the groups ofstudents were assigned sampling weights to adjustfor over-representation or under-representationfrom a particular group. For example, the UnitedStates desired to report information on theachievement of students in public and nonpublicschools. This required that the United States over-sample nonpublic school students to get enoughinformation for this group of students in order todo that. Sampling weights were applied to thedata for public and nonpublic students in order toensure that the U.S. student sample represents theoverall eighth-grade student population. The useof sampling weights is necessary for the computation of statistically sound, nationally-representative estimators. The weight assigned to astudent’s responses is the inverse of the probabilitythat the student would be selected for the sample.
When responses are weighted, none are discarded,and each contributes to the results for the totalnumber of students represented by the individualstudent assessed. Weighting also adjusts forvarious situations such as school and studentnonresponse because data cannot be assumed tobe randomly missing. The internationally-definedweighting specifications for TIMSS–R require thateach assessed student’s sampling weight should bethe product of (1) the inverse of the school’s prob-ability of selection, (2) an adjustment forschool-level nonresponse, (3) the inverse of theclassroom’s probability of selection, and (4) anadjustment for student-level nonresponse. AllTIMSS–R analyses are conducted using thesesampling weights.
Scaling—TIMSS–R used Item Response Theory(IRT) methods to produce score scales thatsummarized the achievement results. With thismethod, the performance of a sample of studentsin a subject area or sub-area could be summarizedon a single scale or a series of scales, even whendifferent students had been administered differentitems. Because of the reporting requirements forTIMSS–R and because of the large number ofbackground variables associated with the assess-
ment, a large number of analyses had to beconducted. The procedures TIMSS–R used for theanalyses were developed to produce accurateresults for groups of students while limiting thetesting burden on individual students.Furthermore, these procedures provided data thatcould be readily used in secondary analyses. IRTscaling provides estimates of item parameters(e.g., difficulty, discrimination) that define therelationship between the item and the underlyingvariable measured by the test. Parameters of theIRT model are estimated for each test question,with an overall scale being established as well asscales for each predefined content area specified inthe assessment framework. For example, in 1999the TIMSS–R assessment had five scales describingmathematics content strands, and science hadscales for six fields of science.
TIMSS 1995 utilized a one parameter IRT modelto produce score scales that summarized theachievement results. The TIMSS data wererescaled using a three parameter IRT model, tomatch the procedures used to scale the 1999TIMSS–R data. The move from a one parametermodel to a three parameter model was initiated toprovide better estimates of student achievement.After careful study of the rescaling process, theInternational Study Center concluded that the fitbetween the original TIMSS data and the rescaledTIMSS data met acceptable standards. However, asa result of rescaling, the average achievementscores of some nations changed from thoseinitially reported in 1996 (NCES 1996) and 1997(NCES, 1997c). The rescaled TIMSS scores arereported here.
Plausible Values—During the scaling phase,plausible values were used to characterize scalescores for students participating in the assessment.To keep student burden to a minimum, TIMSS–Radministered few assessment items to eachstudent—too few to produce accurate content-related scale scores for each student. To accountfor this, for each student TIMSS–R generated five possible content-related scale scores thatrepresented selections from the distribution ofcontent-related scale scores of students withsimilar backgrounds who answered the assessmentitems the same way. The plausible-values technol-ogy is one way to ensure that the estimates of theaverage performance of student populations andthe estimates of variability in those estimates are
79
APPENDIX 2—TECHNICAL NOTES
more accurate than those determined throughtraditional procedures, which estimate a singlescore for each student. During the construction ofplausible values, careful quality control stepsensured that the subpopulation estimates basedon these plausible values were accurate. Plausiblevalues were constructed separately for eachnational sample.
TIMSS–R uses the plausible-values methodologyto represent what the true performance of an indi-vidual might have been, had it been observed,using a small number of random draws from anempirically derived distribution of score valuesbased on the student’s observed responses toassessment items and on background variables.Each random draw from the distribution isconsidered a representative value from the distri-bution of potential scale scores for all students inthe sample who have similar characteristics andidentical patterns of item responses. The drawsfrom the distribution are different from oneanother to quantify the degree of precision (thewidth of the spread) in the underlying distribu-tion of possible scale scores that could have causedthe observed performances. The TIMSS–R plausi-ble values function like point estimates of scalescores for many purposes, but they are unlike truepoint estimates in several respects. They differfrom one another for any particular student, andthe amount of difference quantifies the spread inthe underlying distribution of possible scale scoresfor that student. Because of the plausible-valuesapproach, secondary researchers can use theTIMSS–R data to carry out a wide range ofanalyses.
ITEM DEVELOPMENT ANDREPLACEMENTTIMSS–R utilized the same assessment frameworkdesigned for TIMSS. Approximately one third ofthe original 1995 TIMSS assessment items werekept secure so that they could be included in the1999 TIMSS–R assessment to provide trend data.For the approximately two thirds of items thatwere released to the public, a panel of interna-tional assessment and content experts and theNational Research Coordinators (NRCs) of eachparticipating country developed and reviewedreplacement items that closely matched thecontent of the original items. Through thisprocess, over 300 science and mathematics itemswere developed as potential replacement items, ofwhich 277 items were carefully chosen to be fieldtested. Approximately 1000 students per countryparticipated in this field test.
All of the potential replacement items and thesecured items, as well as the questionnaires, werefield tested in 31 nations. Field test results for eachitem were carefully reviewed and examined forproblems. Items that did not perform well duringthe field test—based on a clear set of criteria—were either revised to correct the problem or setaside. Of the 277 potential replacement items, 202were selected based on the results of the field test.The item development process resulted in thereplacement of TIMSS items released to the publicwith new items that had similar characteristics interms of item format, performance expectation,content area, and difficulty level.
As a result, the TIMSS–R assessments consisted of298 items—96 non-released items and 202replacement items, organized into 26 blocks ofitems among 8 test booklets. A summary of itemcharacteristics in TIMSS and TIMSS–R isprovided below.
80
APPENDIX 2—TECHNICAL NOTES
Table A2.3.—Number of items by item format in main survey:1995 and 1999
SOURCE: Boston College, Third International Mathematics and Science Study–Repeat (TIMSS–R), FieldTest Report, Table 8.1, 1999.
TRANSLATION VERIFICATIONThe TIMSS–R instruments were prepared inEnglish and translated into the primary languageor languages of instruction in each nation. Inaddition, it was sometimes necessary to adapt theinstruments for cultural purposes, even in thenations that tested in English. Adaptations wereapproved by the International Study Center if theydid not in any way change the substance or intentof the question or answer choices. For example,use of the word “weight” may be an unfamiliarcolloquial term for “mass” to some students; achange from “weight” to “weight (mass)” would bean acceptable clarification in this case.
Each nation prepared translations of the instru-ments according to translation guidelinesestablished by the International Study Center.Adaptations to the instruments were documentedby each nation. The goal of the translation guide-lines was to produce translated instruments of thehighest quality that would provide comparabledata across participating nations.
Translated instruments were verified by an inde-pendent, professional translation agency prior tofinal approval and printing of the instruments.Nations were required to submit copies of the finalprinted instruments administered in TIMSS–R tothe International Study Center. Further details onthe translation process can be found in the TIMSS1999 Technical Report (Martin and Gregory, 2000).
81
APPENDIX 2—TECHNICAL NOTES
Table A2.4.—Number of mathematics items by content area inmain survey: 1995 and 1999
Content area TIMSS TIMSS–R
Algebra 27 28Data representation, analysis and probability 21 21Fractions and number sense 51 52Geometry 23 23Measurement 18 20Proportionality 11 11*Total 151 155
*Proportionality items in TIMSS–R distributed among other content areas. Therefore, TIMSS–R does not report proportionality as a separate content area.
SOURCE: Boston College, Third International Mathematics and Science Study–Repeat (TIMSS–R), Field TestReport, Table 8.2, 1999.
Table A2.5.—Number of science items by content area in mainsurvey: 1995 and 1999
Content area TIMSS TIMSS–R
Chemistry 19 19Earth science 22 22Life science 40 39Physics 40 39Environmental and resource issues * 6 12Scientific inquiry and the nature of science* 8 12Total 135 143
*The TIMSS–R Science Assessment reflects the inclusion of 10 new items in the areas of Environmental and Resource Issues and Scientific Inquiry and the Nature of Science. This will permit the results in these two content areas to be reported separately in TIMSS–R, which was not the case in TIMSS.
SOURCE: Boston College, Third International Mathematics and Science Study–Repeat (TIMSS–R), Field TestReport, Table 8.3, 1999.
ITEM SCORINGThe TIMSS–R assessments items included bothmultiple choice and free-response items. TheNational Research Coordinator (NRC) in eachnation was responsible for the scoring and codingof data in that nation, following established inter-national guidelines. The NRC and, in some cases,additional staff, attended in-depth trainingsessions to introduce participants to the TIMSS–Rcoding system and to provide extensive practice inscoring example items. The training sessions weregenerally conducted over several days.Information on within-country agreement amongcoders was collected and documented by theInternational Study Center. A percentage ofstudent responses in each nation were to be scored
independently by two coders. Information oncoding and scoring reliability was also used tocalculate cross-country agreement among thecoders. The International Study Center carefullymonitored and documented the reliability ofscoring within and across nations. The results ofcalculating reliability on scoring of the free-response items in each nation can be found inMartin et al. (2000) and Mullis et al. (2000).Further details on the item scoring process can befound in Martin and Gregory (2000).
TIMSS 1995PARTICIPATING NATIONSTable A2.6 describes the complete list of nationsthat participated in TIMSS 1995 at the fourth andeighth grades.
82
APPENDIX 2—TECHNICAL NOTES
83
APPENDIX 2—TECHNICAL NOTES
Table A2.6.—Fourth- and eighth-grade nations in TIMSS: 1995Nations that participated in
TIMSS at eighth grade (1995)Nations that participated in
TIMSS at fourth grade (1995)(Australia) (Australia)(Austria) (Austria)Belgium-Flemish(Belgium-French)(Bulgaria)Canada Canada(Colombia)Cyprus CyprusCzech Republic Czech Republic(Denmark)(England) (England)France(Germany)(Greece) GreeceHong Kong SAR Hong Kong SARHungary (Hungary)Iceland IcelandIran, Islamic Republic of Iran, Islamic Republic ofIreland Ireland(Israel) (Israel)(Italy)1 (Italy)1
Japan JapanKorea, Republic of Korea, Republic of(Kuwait) (Kuwait)(Latvia-LSS)2 (Latvia-LSS)2
(Lithuania)3
(Netherlands) (Netherlands)New Zealand New ZealandNorway NorwayPortugal Portugal(Romania)Russian Federation(Scotland) ScotlandSingapore SingaporeSlovak Republic(Slovenia) (Slovenia)(South Africa)SpainSwedenSwitzerland(Thailand) (Thailand)United States United States
Total Nations 42 27
1Italy was unable to provide the International Study Center at Boston College with their data in time for it to be included in the international reports for both the fourth and eighth grade in TIMSS 1995. However, their data for TIMSS 1995 appear in this report.2Designated LSS because only Latvian-speaking schools were tested.3Lithuania tested the same cohort of students as other nations, but later in 1999, at the beginning of the next school year.
NOTE: Only nations that completed the necessary steps for their data to appear in the reports from the InternationalStudy Center at Boston College are listed.Parentheses indicate nations not meeting international sampling and/or other guidelines at fourth, eighth or bothgrades in 1995. See NCES (1996) for details regarding eighth-grade data. See NCES (1997c) for details for fourth-grade data.
SOURCE: Mullis et al. (2000). TIMSS 1999 International Mathematics Report: Findings from IEA’s Repeat of the ThirdInternational Mathematics and Science Study at the Eighth Grade. Exhibit A.1. Chestnut Hill, MA: Boston College.
Appendix 3Supporting Data for Chapter 2
86
APPENDIX 3—SUPPORTING DATA FOR CHAPTER 2
Table A3.1.—Average mathematics and science achievement ofeighth-grade students with standard errors, by nation: 1999
Mathematics ScienceNation Average s.e. Nation Average s.e.Australia 525 4.8 Australia 540 4.4Belgium-Flemish 558 3.3 Belgium-Flemish 535 3.1Bulgaria 511 5.9 Bulgaria 518 5.4Canada 531 2.5 Canada 533 2.1Chile 392 4.4 Chile 420 3.7Chinese Taipei 585 4.0 Chinese Taipei 569 4.4Cyprus 476 1.8 Cyprus 460 2.4Czech Republic 520 4.2 Czech Republic 539 4.2England 496 4.2 England 538 4.8Finland 520 2.7 Finland 535 3.5Hong Kong SAR 582 4.3 Hong Kong SAR 530 3.7Hungary 532 3.7 Hungary 552 3.7Indonesia 403 4.9 Indonesia 435 4.5Iran, Islamic Republic of 422 3.4 Iran, Islamic Republic of 448 3.8(Israel) 466 3.9 (Israel) 468 4.9Italy 479 3.8 Italy 493 3.9Japan 579 1.7 Japan 550 2.2Jordan 428 3.6 Jordan 450 3.8Korea, Republic of 587 2.0 Korea, Republic of 549 2.6Latvia-LSS1 505 3.4 Latvia-LSS1 503 4.8
Lithuania2 482 4.3 Lithuania2 488 4.1Macedonia, Republic of 447 4.2 Macedonia, Republic of 458 5.2Malaysia 519 4.4 Malaysia 492 4.4Moldova 469 3.9 Moldova 459 4.0Morocco 337 2.6 Morocco 323 4.3Netherlands 540 7.1 Netherlands 545 6.9New Zealand 491 5.2 New Zealand 510 4.9Philippines 345 6.0 Philippines 345 7.5Romania 472 5.8 Romania 472 5.8Russian Federation 526 5.9 Russian Federation 529 6.4Singapore 604 6.3 Singapore 568 8.0Slovak Republic 534 4.0 Slovak Republic 535 3.3Slovenia 530 2.8 Slovenia 533 3.2South Africa 275 6.8 South Africa 243 7.9Thailand 467 5.1 Thailand 482 4.0Tunisia 448 2.4 Tunisia 430 3.4Turkey 429 4.3 Turkey 433 4.3United States 502 4.0 United States 515 4.6
International average of 38 nations
487 0.7International average of 38 nations
488 0.7
1Designated LSS because only Latvian-speaking schools were tested which represents 61 percent of the population.2Lithuania tested the same cohort of students as other nations, but later in 1999, at the beginning of the next school year.
NOTE: Eighth grade in most nations. See appendix 2 for details.Parentheses indicate nations not meeting international sampling and/or other guidelines. See appendix 2 for details.The international average is the average of the national averages of the 38 nations.s.e. means standard error.
SOURCE: Martin et al. (2000). TIMSS 1999 International Science Report: Findings from IEA’s Repeat of the ThirdInternational Mathematics and Science Study at the Eighth Grade. Exhibit 1.1. Chestnut Hill, MA: Boston College;Mullis et al. (2000). TIMSS 1999 International Mathematics Report: Findings from IEA’s Repeat of the ThirdInternational Mathematics and Science Study at the Eighth Grade. Exhibit 1.1. Chestnut Hill, MA: Boston College.
87
APPENDIX 3—SUPPORTING DATA FOR CHAPTER 2
Table A3.2.—Percentiles of achievement in eighth-grademathematics with standard errors, by nation: 1999
NationPercentages of students reaching international benchmarks
Top 10 percent Top 25 percent Top 50 percent Top 75 percentPercent s.e. Percent s.e. Percent s.e. Percent s.e.
1Designated LSS because only Latvian-speaking schools were tested which represents 61 percent of the population.2Lithuania tested the same cohort of students as other nations, but later in 1999, at the beginning of the next school year.
NOTE: Eighth grade in most nations. See appendix 2 for details.Parentheses indicate nations not meeting international sampling and/or other guidelines. See appendix 2 for details.s.e. means standard error.
SOURCE: Mullis et al. (2000). TIMSS 1999 International Mathematics Report: Findings from IEA’s Repeat of the ThirdInternational Mathematics and Science Study at the Eighth Grade. Exhibit 1.6. Chestnut Hill, MA: Boston College.
12231112
141
311
76
3316
2155
333
377
43
1240
14805
15461415
04019
37543038
366173324316841
75
182064116826
17123416
04525
11937754039
116
47
28
88
APPENDIX 3—SUPPORTING DATA FOR CHAPTER 2
Table A3.3.—Percentiles of achievement in eighth-grade science withstandard errors, by nation: 1999
NationPercentages of students reaching international benchmarks
Top 10 percent Top 25 percent Top 50 percent Top 75 percentPercent s.e. Percent s.e. Percent s.e. Percent s.e.
1Designated LSS because only Latvian-speaking schools were tested.2Lithuania tested the same cohort of students as other nations, but later in 1999, at the beginning of the next school year.
NOTE: Eighth grade in most nations. See appendix 2 for details.Parentheses indicate nations not meeting international sampling and/or other guidelines. See appendix 2 for details.s.e. means standard error.
SOURCE: Martin et al. (2000). TIMSS 1999 International Science Report: Findings from IEA’s Repeat of the ThirdInternational Mathematics and Science Study at the Eighth Grade. Exhibit 1.6. Chestnut Hill, MA: Boston College.
19111414
131
21719141022
1277
194
227
64640
1612
16
17321416
0301
15
7476657322833974727475792732455480387759
51405339
57961134568807471
647192562
43393438
558124142393549
69
202348154624
20152115
14632
31938563939
215
36
34
89
APPENDIX 3—SUPPORTING DATA FOR CHAPTER 2
Tabl
e A3
.4.—
Aver
age
eigh
th-g
rade
ach
ieve
men
t in
mat
hem
atic
s co
nten
t are
as w
ith s
tand
ard
erro
rs, b
y na
tion:
199
9Fr
acti
ons
and
nu
mbe
r se
nse
Mea
sure
men
tD
ata
repr
esen
tati
on, a
nal
ysis
, an
d pr
obab
ility
Geo
met
ryA
lgeb
ra
Nat
ion
Ave
rage
s.e.
Nat
ion
Ave
rage
s.e.
Nat
ion
Ave
rage
s.e.
Nat
ion
Ave
rage
s.e.
Nat
ion
Ave
rage
s.e.
Au
stra
lia51
94.
3A
ust
ralia
529
4.9
Au
stra
lia52
26.
3A
ust
ralia
497
5.7
Au
stra
lia52
05.
1B
elgi
um
-Fle
mis
h55
73.
1B
elgi
um
-Fle
mis
h54
94.
0B
elgi
um
-Fle
mis
h54
43.
8B
elgi
um
-Fle
mis
h53
54.
1B
elgi
um
-Fle
mis
h54
04.
6B
ulg
aria
503
6.6
Bu
lgar
ia49
76.
6B
ulg
aria
493
6.1
Bu
lgar
ia52
45.
9B
ulg
aria
512
5.1
Can
ada
533
2.5
Can
ada
521
2.4
Can
ada
521
4.5
Can
ada
507
4.7
Can
ada
525
2.4
Ch
ile40
34.
9C
hile
412
4.9
Ch
ile42
93.
8C
hile
412
5.4
Ch
ile39
94.
3C
hin
ese
Taip
ei57
64.
2C
hin
ese
Taip
ei56
63.
4C
hin
ese
Taip
ei55
95.
1C
hin
ese
Taip
ei55
75.
8C
hin
ese
Taip
ei58
64.
4C
ypru
s48
13.
0C
ypru
s47
14.
0C
ypru
s47
24.
6C
ypru
s48
44.
6C
ypru
s47
91.
6C
zech
Rep
ubl
ic50
74.
8C
zech
Rep
ubl
ic53
55.
0C
zech
Rep
ubl
ic51
35.
9C
zech
Rep
ubl
ic51
35.
5C
zech
Rep
ubl
ic51
44.
0E
ngl
and
497
3.8
En
glan
d50
73.
8E
ngl
and
506
8.0
En
glan
d47
14.
2E
ngl
and
498
4.9
Fin
lan
d53
13.
8Fi
nla
nd
521
4.7
Fin
lan
d52
53.
8Fi
nla
nd
494
6.0
Fin
lan
d49
83.
1H
ong
Kon
g SA
R57
94.
5H
ong
Kon
g SA
R56
75.
8H
ong
Kon
g SA
R54
75.
4H
ong
Kon
g SA
R55
64.
9H
ong
Kon
g SA
R56
94.
5H
un
gary
526
4.2
Hu
nga
ry53
83.
5H
un
gary
520
5.9
Hu
nga
ry48
94.
3H
un
gary
536
4.1
Indo
nes
ia40
64.
1In
don
esia
395
5.1
Indo
nes
ia42
34.
4In
don
esia
441
5.1
Indo
nes
ia42
45.
7Ir
an, I
slam
ic
Rep
ubl
ic o
f43
74.
5Ir
an, I
slam
ic
Rep
ubl
ic o
f40
14.
7Ir
an, I
slam
ic
Rep
ubl
ic o
f43
06.
0Ir
an, I
slam
ic
Rep
ubl
ic o
f44
72.
9Ir
an, I
slam
ic
Rep
ubl
ic o
f43
44.
9
(Isr
ael)
472
4.4
(Isr
ael)
457
5.1
(Isr
ael)
468
5.1
(Isr
ael)
462
5.4
(Isr
ael)
479
4.5
Ital
y47
15.
0It
aly
501
5.0
Ital
y48
44.
5It
aly
482
5.6
Ital
y48
13.
6Ja
pan
570
2.6
Japa
n55
82.
4Ja
pan
555
2.3
Japa
n57
55.
1Ja
pan
569
3.3
Jord
an43
23.
2Jo
rdan
438
4.4
Jord
an43
67.
8Jo
rdan
449
7.1
Jord
an43
95.
3K
orea
, Rep
ubl
ic o
f57
02.
7K
orea
, Rep
ubl
ic o
f57
12.
8K
orea
, Rep
ubl
ic o
f57
64.
2K
orea
, Rep
ubl
ic o
f57
33.
9K
orea
, Rep
ubl
ic o
f58
52.
7La
tvia
-LSS
149
63.
7La
tvia
-LSS
150
53.
5La
tvia
-LSS
149
54.
8La
tvia
-LSS
152
25.
6L
atvi
a-L
SS1
499
4.3
Lith
uan
ia2
479
4.3
Lith
uan
ia2
467
4.0
Lith
uan
ia2
493
3.6
Lith
uan
ia2
496
5.8
Lit
huan
ia2
487
3.7
Mac
edon
ia,
Rep
ubl
ic o
f43
74.
7M
aced
onia
, R
epu
blic
of
451
5.2
Mac
edon
ia,
Rep
ubl
ic o
f44
26.
2M
aced
onia
, R
epu
blic
of
460
6.1
Mac
edon
ia,
Rep
ubl
ic o
f46
54.
0
Mal
aysi
a53
24.
7M
alay
sia
514
4.6
Mal
aysi
a49
14.
0M
alay
sia
497
4.4
Mal
aysi
a50
54.
8M
oldo
va46
54.
2M
oldo
va47
94.
9M
oldo
va45
05.
7M
oldo
va48
15.
0M
oldo
va47
73.
7M
oroc
co33
53.
6M
oroc
co34
83.
5M
oroc
co38
33.
5M
oroc
co40
72.
2M
oroc
co35
34.
7N
eth
erla
nds
545
7.1
Net
her
lan
ds53
85.
8N
eth
erla
nds
538
7.9
Net
her
lan
ds51
55.
5N
eth
erla
nds
522
7.7
New
Zea
lan
d49
35.
0N
ew Z
eala
nd
496
5.3
New
Zea
lan
d49
75.
0N
ew Z
eala
nd
478
4.2
New
Zea
lan
d49
74.
7P
hili
ppin
es37
86.
3P
hili
ppin
es35
56.
2P
hili
ppin
es40
63.
5P
hili
ppin
es38
33.
4P
hili
ppin
es34
55.
8R
oman
ia45
85.
7R
oman
ia49
14.
9R
oman
ia45
34.
7R
oman
ia48
76.
4R
oman
ia48
15.
2R
uss
ian
Fed
erat
ion
513
6.4
Ru
ssia
n F
eder
atio
n52
76.
0R
uss
ian
Fed
erat
ion
501
4.8
Ru
ssia
n F
eder
atio
n52
26.
0R
uss
ian
Fed
erat
ion
529
4.9
Sin
gapo
re60
85.
6Si
nga
pore
599
6.3
Sin
gapo
re56
26.
2Si
nga
pore
560
6.7
Sin
gapo
re57
66.
2Sl
ovak
Rep
ubl
ic52
54.
8Sl
ovak
Rep
ubl
ic53
73.
3Sl
ovak
Rep
ubl
ic52
14.
6Sl
ovak
Rep
ubl
ic52
77.
3Sl
ovak
Rep
ubl
ic52
54.
6Sl
oven
ia52
73.
7Sl
oven
ia52
33.
7Sl
oven
ia53
04.
2Sl
oven
ia50
66.
2Sl
oven
ia52
52.
9So
uth
Afr
ica
300
6.0
Sou
th A
fric
a32
94.
8So
uth
Afr
ica
356
3.8
Sou
th A
fric
a33
56.
6So
uth
Afr
ica
293
7.7
Th
aila
nd
471
5.3
Th
aila
nd
463
6.2
Th
aila
nd
476
4.0
Th
aila
nd
484
4.4
Th
aila
nd
456
4.9
Tun
isia
443
2.8
Tun
isia
442
3.1
Tun
isia
446
5.1
Tun
isia
484
4.4
Tun
isia
455
2.7
Turk
ey43
04.
3Tu
rkey
436
6.5
Turk
ey44
63.
3Tu
rkey
428
5.7
Turk
ey43
24.
6U
nit
ed S
tate
s50
94.
2U
nit
ed S
tate
s48
23.
9U
nit
ed S
tate
s50
65.
2U
nit
ed S
tate
s47
34.
4U
nit
ed S
tate
s50
64.
1
Inte
rnat
ion
al a
vera
ge
of 3
8 n
atio
ns
487
0.7
Inte
rnat
ion
al a
vera
ge
of 3
8 n
atio
ns
487
0.7
Inte
rnat
ion
al a
vera
ge
of 3
8 n
atio
ns
487
0.7
Inte
rnat
ion
al a
vera
ge
of 3
8 n
atio
ns
487
0.7
Inte
rnat
ion
al a
vera
ge
of 3
8 n
atio
ns
487
0.7
1 Des
ign
ated
LSS
bec
ause
on
ly L
atvi
an-s
peak
ing
sch
ools
wer
e te
sted
wh
ich
rep
rese
nts
61
perc
ent
of t
he
popu
lati
on.
2 Lit
huan
ia te
sted
th
e sa
me
coh
ort
of s
tude
nts
as
oth
er n
atio
ns,
bu
t la
ter
in 1
999,
at
the
begi
nn
ing
of t
he
nex
t sc
hoo
l yea
r.
NO
TE
: E
igh
th g
rade
in m
ost
nat
ion
s. S
ee a
ppen
dix
2 fo
r de
tails
.Pa
ren
thes
es in
dica
te n
atio
ns
not
mee
tin
g in
tern
atio
nal
sam
plin
g an
d/or
oth
er g
uid
elin
es.
See
appe
ndi
x 2
for
deta
ils.
Th
e in
tern
atio
nal
ave
rage
is t
he
aver
age
of t
he
nat
ion
al a
vera
ges
of t
he
38 n
atio
ns.
s.e.
mea
ns
stan
dard
err
or.
SOU
RC
E:
Mu
llis
et a
l. (
2000
).
TIM
SS 1
999
Inte
rnat
iona
l Mat
hem
atic
s R
epor
t: F
indi
ngs
from
IE
A’s
Rep
eat o
f the
Thi
rd I
nter
nati
onal
Mat
hem
atic
s an
d Sc
ienc
e St
udy
at th
e E
ight
h G
rade
. E
xhib
it 3
.1. C
hes
tnu
t H
ill, M
A: B
osto
n C
olle
ge.
Tabl
e A3
.5.—
Aver
age
eigh
th-g
rade
ach
ieve
men
t in
scie
nce
cont
ent a
reas
with
sta
ndar
d er
rors
, by
natio
n: 1
999
Ear
th s
cien
ceLi
fe s
cien
ceP
hysi
csC
hem
istr
yE
nvir
onm
enta
l an
d re
sou
rce
issu
esSc
ien
tifi
c in
quir
y an
d th
e n
atu
re o
f sc
ien
ceN
atio
nA
vera
ges.
e.N
atio
nA
vera
ges.
e.N
atio
nA
vera
ges.
e.N
atio
nA
vera
ges.
e.N
atio
nA
vera
ges.
e.N
atio
nA
vera
ges.
e.A
ust
ralia
519
6.1
Au
stra
lia53
04.
4A
ust
ralia
531
6.3
Au
stra
lia52
05.
0A
ust
ralia
530
6.3
Au
stra
lia53
54.
9B
elgi
um
-Fle
mis
h53
33.
5B
elgi
um
-Fle
mis
h53
54.
6B
elgi
um
-Fle
mis
h53
03.
5B
elgi
um
-Fle
mis
h50
83.
3B
elgi
um
-Fle
mis
h51
33.
5B
elgi
um
-Fle
mis
h52
64.
9B
ulg
aria
520
5.7
Bu
lgar
ia51
46.
9B
ulg
aria
505
5.8
Bu
lgar
ia52
75.
7B
ulg
aria
483
6.4
Bu
lgar
ia47
95.
6C
anad
a51
93.
7C
anad
a52
33.
8C
anad
a52
13.
8C
anad
a52
15.
4C
anad
a52
13.
5C
anad
a53
25.
1C
hile
435
7.0
Ch
ile43
13.
7C
hile
428
5.6
Ch
ile43
55.
2C
hile
449
4.8
Ch
ile44
14.
7C
hin
ese
Taip
ei53
83.
0C
hin
ese
Taip
ei55
03.
3C
hin
ese
Taip
ei55
23.
9C
hin
ese
Taip
ei56
34.
3C
hin
ese
Taip
ei56
74.
0C
hin
ese
Taip
ei54
04.
9C
ypru
s45
95.
4C
ypru
s46
83.
8C
ypru
s45
92.
9C
ypru
s47
03.
4C
ypru
s47
54.
3C
ypru
s46
74.
6C
zech
Rep
ubl
ic53
36.
9C
zech
Rep
ubl
ic54
44.
1C
zech
Rep
ubl
ic52
64.
2C
zech
Rep
ubl
ic51
25.
2C
zech
Rep
ubl
ic51
65.
7C
zech
Rep
ubl
ic52
25.
7E
ngl
and
525
3.9
En
glan
d53
36.
2E
ngl
and
528
4.5
En
glan
d52
45.
5E
ngl
and
518
5.8
En
glan
d53
85.
1Fi
nla
nd
520
5.5
Fin
lan
d52
04.
0Fi
nla
nd
520
4.4
Fin
lan
d53
54.
5Fi
nla
nd
514
7.1
Fin
lan
d52
84.
0H
ong
Kon
g SA
R50
64.
3H
ong
Kon
g SA
R51
65.
5H
ong
Kon
g SA
R52
34.
9H
ong
Kon
g SA
R51
55.
2H
ong
Kon
g SA
R51
84.
9H
ong
Kon
g SA
R53
12.
8H
un
gary
560
3.9
Hu
nga
ry53
54.
0H
un
gary
543
4.3
Hu
nga
ry54
84.
7H
un
gary
501
6.6
Hu
nga
ry52
65.
9In
don
esia
431
6.4
Indo
nes
ia44
83.
6In
don
esia
452
5.5
Indo
nes
ia42
53.
9In
don
esia
489
4.8
Indo
nes
ia44
64.
3Ir
an, I
slam
icR
epu
blic
of
459
5.2
Iran
, Isl
amic
Rep
ubl
ic o
f43
73.
7Ir
an, I
slam
icR
epu
blic
of
445
5.7
Iran
, Isl
amic
Rep
ubl
ic o
f48
74.
1Ir
an, I
slam
icR
epu
blic
of
470
5.5
Iran
, Isl
amic
Rep
ubl
ic o
f44
65.
3
(Isr
ael)
472
5.2
(Isr
ael)
463
4.0
(Isr
ael)
484
5.3
(Isr
ael)
479
4.7
(Isr
ael)
458
4.0
(Isr
ael)
476
8.3
Ital
y50
25.
9It
aly
488
4.6
Ital
y48
04.
1It
aly
493
4.8
Ital
y49
15.
4It
aly
489
4.6
Japa
n53
36.
2Ja
pan
534
5.4
Japa
n54
42.
9Ja
pan
530
3.1
Japa
n50
65.
5Ja
pan
543
2.8
Jord
an44
63.
5Jo
rdan
448
4.1
Jord
an45
93.
6Jo
rdan
483
5.5
Jord
an47
66.
0Jo
rdan
440
5.5
Kor
ea, R
epu
blic
of
532
2.7
Kor
ea, R
epu
blic
of
528
3.6
Kor
ea, R
epu
blic
of
544
5.1
Kor
ea, R
epu
blic
of
523
3.7
Kor
ea, R
epu
blic
of
523
4.5
Kor
ea, R
epu
blic
of
545
7.3
Latv
ia-L
SS1
495
5.4
Latv
ia-L
SS1
509
3.9
Latv
ia-L
SS1
495
3.9
Latv
ia-L
SS1
490
3.7
Latv
ia-L
SS1
493
5.2
Latv
ia-L
SS1
495
4.7
Lith
uan
ia2
476
4.4
Lith
uan
ia2
494
4.6
Lith
uan
ia2
510
4.3
Lith
uan
ia2
485
4.6
Lith
uan
ia2
458
5.1
Lit
huan
ia2
483
6.4
Mac
edon
ia,
Rep
ubl
ic o
f46
44.
2M
aced
onia
,R
epu
blic
of
468
4.9
Mac
edon
ia,
Rep
ubl
ic o
f46
36.
0M
aced
onia
,R
epu
blic
of
481
6.1
Mac
edon
ia,
Rep
ubl
ic o
f43
24.
2M
aced
onia
,R
epu
blic
of
464
3.6
Mal
aysi
a49
14.
2M
alay
sia
479
5.4
Mal
aysi
a49
44.
1M
alay
sia
485
3.5
Mal
aysi
a50
24.
4M
alay
sia
488
4.5
Mol
dova
466
4.2
Mol
dova
477
3.9
Mol
dova
457
5.5
Mol
dova
451
5.6
Mol
dova
444
6.2
Mol
dova
471
3.9
Mor
occo
363
3.3
Mor
occo
347
2.8
Mor
occo
352
4.2
Mor
occo
372
4.8
Mor
occo
396
5.1
Mor
occo
391
4.2
Net
her
lan
ds53
47.
2N
eth
erla
nds
536
7.2
Net
her
lan
ds53
76.
5N
eth
erla
nds
515
6.4
Net
her
lan
ds52
68.
5N
eth
erla
nds
534
6.5
New
Zea
lan
d50
45.
8N
ew Z
eala
nd
501
5.6
New
Zea
lan
d49
94.
7N
ew Z
eala
nd
503
4.9
New
Zea
lan
d50
35.
2N
ew Z
eala
nd
521
6.8
Ph
ilipp
ines
390
5.0
Ph
ilipp
ines
378
5.7
Ph
ilipp
ines
393
6.3
Ph
ilipp
ines
394
6.5
Ph
ilipp
ines
391
7.6
Ph
ilipp
ines
403
5.5
Rom
ania
475
5.5
Rom
ania
475
6.0
Rom
ania
465
6.8
Rom
ania
481
6.1
Rom
ania
473
6.6
Rom
ania
456
5.5
Ru
ssia
n F
eder
atio
n52
95.
1R
uss
ian
Fed
erat
ion
517
6.5
Ru
ssia
n F
eder
atio
n52
96.
3R
uss
ian
Fed
erat
ion
523
8.0
Ru
ssia
n F
eder
atio
n49
56.
6R
uss
ian
Fed
erat
ion
491
4.9
Sin
gapo
re52
17.
3Si
nga
pore
541
7.2
Sin
gapo
re57
06.
7Si
nga
pore
545
8.3
Sin
gapo
re57
78.
3Si
nga
pore
550
5.9
Slov
ak R
epu
blic
537
4.3
Slov
ak R
epu
blic
535
6.2
Slov
ak R
epu
blic
518
4.1
Slov
ak R
epu
blic
525
4.9
Slov
ak R
epu
blic
512
4.5
Slov
ak R
epu
blic
507
3.9
Slov
enia
541
4.3
Slov
enia
521
3.9
Slov
enia
525
4.4
Slov
enia
509
5.4
Slov
enia
519
3.4
Slov
enia
513
4.3
Sou
th A
fric
a34
84.
8So
uth
Afr
ica
289
7.3
Sou
th A
fric
a30
86.
7So
uth
Afr
ica
350
4.0
Sou
th A
fric
a35
08.
5So
uth
Afr
ica
329
6.4
Th
aila
nd
470
3.9
Th
aila
nd
508
4.5
Th
aila
nd
475
4.2
Th
aila
nd
439
4.3
Th
aila
nd
507
3.0
Th
aila
nd
462
4.2
Tun
isia
442
2.7
Tun
isia
441
5.0
Tun
isia
425
6.3
Tun
isia
439
3.7
Tun
isia
462
5.0
Tun
isia
451
3.4
Turk
ey43
54.
6Tu
rkey
444
4.5
Turk
ey44
14.
0Tu
rkey
437
5.0
Turk
ey46
13.
6Tu
rkey
445
6.3
Un
ited
Sta
tes
504
4.2
Un
ited
Sta
tes
520
4.1
Un
ited
Sta
tes
498
5.5
Un
ited
Sta
tes
508
4.8
Un
ited
Sta
tes
509
6.4
Un
ited
Sta
tes
522
4.3
Inte
rnat
ion
alav
erag
e of
38
nat
ion
s48
80.
9In
tern
atio
nal
aver
age
of 3
8n
atio
ns
488
0.7
Inte
rnat
ion
alav
erag
e of
38
nat
ion
s48
80.
9In
tern
atio
nal
aver
age
of 3
8n
atio
ns
488
0.8
Inte
rnat
ion
alav
erag
e of
38
nat
ion
s48
80.
7In
tern
atio
nal
aver
age
of 3
8n
atio
ns
488
0.7
1 Des
ign
ated
LSS
bec
ause
on
ly L
atvi
an-s
peak
ing
sch
ools
wer
e te
sted
wh
ich
rep
rese
nts
61
per
cen
t of
th
e po
pula
tion
.2 L
ithu
ania
test
ed t
he
sam
e co
hor
t of
stu
den
ts a
s ot
her
nat
ion
s, b
ut
late
r in
199
9, a
t th
e be
gin
nin
g of
th
e n
ext
sch
ool y
ear.
NO
TE
: E
igh
th g
rade
in m
ost
nat
ion
s. S
ee a
ppen
dix
2 fo
r de
tails
.Pa
ren
thes
es in
dica
te n
atio
ns
not
mee
tin
g in
tern
atio
nal
sam
plin
g an
d/or
oth
er g
uid
elin
es.
See
app
endi
x 2
for
deta
ils.
Th
e in
tern
atio
nal
ave
rage
is t
he
aver
age
of t
he
nat
ion
al a
vera
ges
of t
he
38 n
atio
ns.
s.e.
mea
ns
stan
dard
err
or.
SOU
RC
E:
Mar
tin
et
al.
(200
0).
TIM
SS 1
999
Inte
rnat
iona
l Sci
ence
Rep
ort:
Fin
ding
s fr
om I
EA’
s R
epea
t of t
he T
hird
Int
erna
tion
al M
athe
mat
ics
and
Scie
nce
Stud
y at
the
Eig
hth
Gra
de.
Exh
ibit
3.1
. Ch
estn
ut
Hill
, MA
: Bos
ton
Col
lege
.
90
APPENDIX 3—SUPPORTING DATA FOR CHAPTER 2
91
APPENDIX 3—SUPPORTING DATA FOR CHAPTER 2
Table A3.6.—Percent correct on mathematics assessment itemexamples with standard errors, by nation: 1999
1Designated LSS because only Latvian-speaking schools were tested which represents 61 percent of the population.2Lithuania tested the same cohort of students as other nations, but later in 1999, at the beginning of the next school year.
NOTE: Eighth grade in most nations. See appendix 2 for details.Parentheses indicate nations not meeting international sampling and/or other guidelines. See appendix 2 for details.The international average is the average of the national percentages of the 38 nations.s.e. means standard error.
SOURCE: Boston College, International Study Center, Third International Mathematics and Science Study–Repeat(TIMSS–R), unpublished tabulations, 1999; Mullis et al. (2000). TIMSS 1999 International Mathematics Report: Findingsfrom IEA’s Repeat of the Third International Mathematics and Science Study at the Eighth Grade. Exhibits 2.3, 2.9, and 2.18.Chestnut Hill, MA: Boston College.
55655258
7754146485778452025284880267844
35255638
85541
64349835749
333382034
43
29422232
550213417283435
59
192739125235
25171916
22518
32030573636
121
91026
24
37624142
8663446343262461414302453136132
23163226
53832
93840725337
420102029
33
92
APPENDIX 3—SUPPORTING DATA FOR CHAPTER 2
Table A3.7.—Percent correct on science assessment item examples withstandard errors, by nation: 1999
1Designated LSS because only Latvian-speaking schools were tested which represents 61 percent of the population.2Lithuania tested the same cohort of students as other nations, but later in 1999, at the beginning of the next school year.NOTE: Eighth grade in most nations. See appendix 2 for details.Parentheses indicate nations not meeting international sampling and/or other guidelines. See appendix 2 for details.The international average is the average of the national percentages of the 38 nations.s.e. means standard error.SOURCE: Boston College, International Study Center, Third International Mathematics and Science Study–Repeat (TIMSS–R),unpublished tabulations, 1999; Martin et al. (2000). TIMSS 1999 International Science Report: Findings from IEA’s Repeat of the ThirdInternational Mathematics and Science Study at the Eighth Grade. Exhibits 2.3, 2.13, and 2.18. Chestnut Hill, MA: Boston College.
3023
326
224
61931172011
5296
195
307
67242
2028
236
32881424
21
12
44452038115513264626362819
9152228125420
142131
82
3638171930722123
314132335
26
48512843
8442730424032382021352346195226
38202019
75842
42233495033
328191730
31
93
APPENDIX 3—SUPPORTING DATA FOR CHAPTER 2
Table A3.8.—U.S. eighth-grade mathematics and science achievementwith standard errors, by selected characteristics: 1999
Mathematics ScienceCharacteristics Average s.e. Characteristics Average s.e.
Sex SexBoys 505 4.8 Boys 524 5.2Girls 498 3.8 Girls 505 4.6
Race/ethnicity Race/ethnicityWhite students 525 4.6 White students 547 4.0Black students 444 5.3 Black students 438 5.7Hispanic students 457 6.3 Hispanic students 462 7.4
National origin of parents National origin of parentsBoth U.S. born 510 3.8 Both U.S. born 527 4.1Both foreign born 477 8.7 Both foreign born 472 8.01 U.S. born, 1 foreign born 496 6.4 1 U.S. born, 1 foreign born 509 7.0
Mother’s education Mother’s educationHigh school or less 484 3.5 High school or less 499 6.1Some vocational + some college
511 3.9Some vocational + some college
525 5.3
Completed college 539 5.4 Completed college 554 4.9
Father’s education Father’s educationHigh school or less 482 4.0 High school or less 495 5.9Some vocational + some college
512 4.3Some vocational + some college
529 6.7
Completed college 543 5.6 Completed college 560 4.7
Public/nonpublic school Public/nonpublic schoolPublic school students 498 4.3 Public school students 510 4.9Nonpubic school students 526 7.4 Nonpublic school students 548 7.1
NOTE: Other factors not controlled for in these analyses.s.e. means standard error.
SOURCE: U.S. Department of Education, National Center for Education Statistics, Third International Mathematics andScience Study–Repeat (TIMSS–R), unpublished tabulations, 1999.
94
APPENDIX 3—SUPPORTING DATA FOR CHAPTER 2
Table A3.9.—Average mathematics and science achievement of eighth-grade students with standard errors, by sex, by nation: 1999
485 0.8 489 0.9International average of 38 nations
480 0.9 495 0.9
1Designated LSS because only Latvian-speaking schools were tested which represents 61 percent of the population.2Lithuania tested the same cohort of students as other nations, but later in 1999, at the beginning of the next school year.
NOTE: Eighth grade in most nations. See appendix 2 for details.Parentheses indicate nations not meeting international sampling and/or other guidelines. See appendix 2 for details.The international average is the average of the national averages of the 38 nations.s.e. means standard error.
SOURCE: Martin et al. (2000). TIMSS 1999 International Science Report: Findings from IEA’s Repeat of the Third InternationalMathematics and Science Study at the Eighth Grade. Exhibit 1.11. Chestnut Hill, MA: Boston College; Mullis et al. (2000). TIMSS1999 International Mathematics Report: Findings from IEA’s Repeat of the Third International Mathematics and Science Study at theEighth Grade. Exhibit 1.11. Chestnut Hill, MA: Boston College.
95
APPENDIX 3—SUPPORTING DATA FOR CHAPTER 2
Table A3.10.—Comparisons of eighth-grade mathematics achievementwith standard errors, by nation: 1995 and 1999
Nations with unapproved sampling procedures at the classroom level in 1995
(Israel)4 513 6.2 482 4.7 7.8
(South Africa)4 278 9.2 275 6.8 11.5
(Thailand)4 516 6.1 467 5.1 7.9
1Designated LSS because only Latvian-speaking schools were tested.2Lithuania tested the same cohort of students as other nations, but later in 1999, at the beginning of the next school year.3Difference is calculated by subtracting the 1995 score from the 1999 score. Detail may not sum to totals due to rounding.4Israel, South Africa and Thailand experienced significant difficulties with meeting international guidelines in 1995. These nations’ averages are not included in the international average.
NOTE: Eighth grade in most nations. See appendix 2 for details. Parentheses indicate nations not meeting international sampling and/or other guidelines in 1995, 1999, or both years. Seeappendix 2 for details regarding 1999 data. See NCES (1996) for detatils for 1995 data.The international average is the average of the national averages of the 23 nations.The 1995 scores are based on re-scaled data.s.e. means standard error.
SOURCE: Mullis et al. (2000). TIMSS 1999 International Mathematics Report: Findings from IEA’s Repeat of the ThirdInternational Mathematics and Science Study at the Eighth Grade. Exhibit 1.3. Chestnut Hill, MA: Boston College.
68
-1610
9-26
-113
54
-6-26
17
1011
-10-12
-40
-19
2
-32
-3
-49
96
APPENDIX 3—SUPPORTING DATA FOR CHAPTER 2
Table A3.11.—Comparisons of eighth-grade science achievement withstandard errors, by nation: 1995 and 1999
Nations with unapproved sampling procedures at the classroom level in 1995
(Israel)4 509 484 5.7
(South Africa)4 263 243 7.9
(Thailand)4 510 482 4.0
1Designated LSS because only Latvian-speaking schools were tested.2Lithuania tested the same cohort of students as other nations, but later in 1999, at the beginning of the next school year.3Difference is calculated by subtracting the 1995 score from the 1999 score. Detail may not sum to totals due to rounding.4Israel, South Africa and Thailand experienced significant difficulties with meeting international guidelines in 1995. These nations’ averages are not included in the international average.
NOTE: Eighth grade in most nations. See appendix 2 for details. Parentheses indicate nations not meeting international sampling and/or other guidelines in 1995, 1999, or both years. Seeappendix 2 for details regarding 1999 data. See NCES (1996) for detatils for 1995 data.The international average is the average of the national averages of the 23 nations.The 1995 scores are based on re-scaled data.s.e. means standard error.
SOURCE: Martin et al. (2000). TIMSS 1999 International Science Report: Findings from IEA’s Repeat of the ThirdInternational Mathematics and Science Study at the Eighth Grade. Exhibit 1.3. Chestnut Hill, MA: Boston College.
142
-2719
8-16
52016
-151
-53
27
253
-117
-123
-82
3
-25
-20
-28
8.3
13.7
6.2
6.3
11.1
4.7
97
APPENDIX 3—SUPPORTING DATA FOR CHAPTER 2
Table A3.12.—Comparisons of percentages of eighth-grade students reaching the TIMSS–R 1999 top 10 percent international benchmark of mathematics achievement with standard errors: 1995 and 1999
Nations with unapproved sampling procedures at the classroom level in 1995
(Israel)4 1.5 0.7 1.6
(South Africa)4 0.2 0.2 0.3
(Thailand)4 2.1 0.8 2.3
1Designated LSS because only Latvian-speaking schools were tested.2Lithuania tested the same cohort of students as other nations, but later in 1999, at the beginning of the next school year.3Difference is calculated by subtracting the 1995 score from the 1999 score. Detail may not sum to totals due to rounding.4Israel, South Africa and Thailand experienced significant difficulties with meeting international guidelines in 1995. These nations’ averages are not included in the international average.
NOTE: Eighth grade in most nations. See appendix 2 for details.Parentheses indicate nations not meeting international sampling and/or other guidelines in 1995, 1999, or both years. Seeappendix 2 for details regarding 1999 data. See (NCES 1996) for details for 1995 data.The international average is the average of the national averages of the 23 nations.The 1995 scores are based on re-scaled data.s.e. means standard error.
SOURCE: Martin et al. (2000). TIMSS 1999 International Science Report: Findings from IEA’s Repeat of the ThirdInternational Mathematics and Science Study at the Eighth Grade. Exhibit 1.7. Chestnut Hill, MA: Boston College.
111919
94
198
2813
07
3436
5
312
85
12461413
6
14
8
0
10
12231112
311
73316
16
3337
7
414
85
15461415
9
15
6
0
4
14
-83
-1-80530
-1023
130020
-123
1
-3
0
-5
98
APPENDIX 3—SUPPORTING DATA FOR CHAPTER 2
Table A3.13.—Comparisons of percentages of eighth-grade students reaching the TIMSS–R 1999 top 10 percent international benchmark of science achievement with standard errors: 1995 and 1999
Nations with unapproved sampling procedures at the classroom level in 1995
(Israel)4 1.8 0.8 2.0
(South Africa)4 0.5 0.2 0.6
(Thailand)4 1.3 0.7 1.5
1Designated LSS because only Latvian-speaking schools were tested.2Lithuania tested the same cohort of students as other nations, but later in 1999, at the beginning of the next school year.3Difference is calculated by subtracting the 1995 score from the 1999 score. Detail may not sum to totals due to rounding.4Israel, South Africa and Thailand experienced significant difficulties with meeting international guidelines in 1995. These nations’ averages are not included in the international average.
NOTE: Eighth grade in most nations. See appendix 2 for details.Parentheses indicate nations not meeting international sampling and/or other guidelines in 1995, 1999, or both years. Seeappendix 2 for details regarding 1999 data. See NCES (1996) for details for 1995 data.The international average is the average of the national averages of the 23 nations.The 1995 scores are based on re-scaled data.s.e. means standard error.
SOURCE: Martin et al. (2000). TIMSS 1999 International Science Report: Findings from IEA’s Repeat of the ThirdInternational Mathematics and Science Study at the Eighth Grade. Exhibit 1.7. Chestnut Hill, MA: Boston College.
17122411
32117
914
27
2120
4
31511
61333151613
13
12
1
6
3-1
-1030
-421801
-223
31004
-1002
1
-4
0
-2
19111414
217191022
28
1922
7
61612
61732141615
14
8
0
3
99
APPENDIX 3—SUPPORTING DATA FOR CHAPTER 2
Table A3.14.—Comparisons of percent correct in mathematics content areaswith standard errors: 1995 and 1999
1Designated LSS because only Latvian-speaking schools were tested.2Lithuania tested the same cohort of students as other nations, but later in 1999, at the beginning of the next school year.3Israel, South Africa and Thailand experienced significant difficulties with meeting international guidelines in 1995. These nations’ averages are not included in the international average.
NOTE: Eighth grade in most nations. See appendix 2 for details.Parentheses indicate nations not meeting international sampling and/or other guidelines in 1995, 1999, or both years. See appendix 2for details regarding 1999 data. See NCES (1996) for details for 1995 data.The international average is the average of the national averages of the 23 nations.The 1995 scores are based on re-scaled data.s.e. means standard error.
SOURCE: Mullis et al. (2000). TIMSS 1999 International Mathematics Report: Findings from IEA’s Repeat of the Third InternationalMathematics and Science Study at the Eighth Grade. Exhibit 3.4. Chestnut Hill, MA: Boston College.
100
APPENDIX 3—SUPPORTING DATA FOR CHAPTER 2
Table A3.14.—Comparisons of percent correct in mathematics content areas with standard errors: 1995 and 1999—Continued
Nation
Percent correct in mathematics content areasData represenation, analysis,and probability trend items
1Designated LSS because only Latvian-speaking schools were tested.2Lithuania tested the same cohort of students as other nations, but later in 1999, at the beginning of the next school year.3Israel, South Africa and Thailand experienced significant difficulties with meeting international guidelines in 1995. These nations’ averages are not included in the international average.
NOTE: Eighth grade in most nations. See appendix 2 for details.Parentheses indicate nations not meeting international sampling and/or other guidelines in 1995, 1999, or both years. See appendix 2for details regarding 1999 data. See NCES (1996) for details for 1995 data.The international average is the average of the national averages of the 23 nations.The 1995 scores are based on re-scaled data.s.e. means standard error.
SOURCE: Mullis et al. (2000). TIMSS 1999 International Mathematics Report: Findings from IEA’s Repeat of the Third InternationalMathematics and Science Study at the Eighth Grade. Exhibit 3.4. Chestnut Hill, MA: Boston College.
101
APPENDIX 3—SUPPORTING DATA FOR CHAPTER 2
Table A3.15.—Comparisons of percent correct in science content areas with standard errors: 1995 and 1999
1Designated LSS because only Latvian-speaking schools were tested.2Lithuania tested the same cohort of students as other nations, but later in 1999, at the beginning of the next school year.3Israel, South Africa and Thailand experienced significant difficulties with meeting international guidelines in 1995. These nations’ averages are not included in the international average.
NOTE: Eighth grade in most nations. See appendix 2 for details.Parentheses indicate nations not meeting international sampling and/or other guidelines in 1995, 1999, or both years. See appendix 2for details regarding 1999 data. See NCES (1996) for details for 1995 data.The international average is the average of the national averages of the 23 nations.The 1995 scores are based on re-scaled data.s.e. means standard error.
SOURCE: Martin et al. (2000). TIMSS 1999 International Science Report: Findings from IEA’s Repeat of the Third InternationalMathematics and Science Study at the Eighth Grade. Exhibit 3.4. Chestnut Hill, MA: Boston College.
102
APPENDIX 3—SUPPORTING DATA FOR CHAPTER 2
Table A3.15.—Comparisons of percent correct in science content areas with standard errors: 1995 and 1999—Continued
Nations with unapproved sampling procedures at the classroom level in 1995
(Israel)3 62 0.9 62 0.7 73 1.3 69 1.2
(South Africa)3 37 1.2 34 0.7 38 1.3 35 1.0
(Thailand)3 59 0.9 53 0.8 50 1.1 45 1.0
1Designated LSS because only Latvian-speaking schools were tested.2Lithuania tested the same cohort of students as other nations, but later in 1999, at the beginning of the next school year.3Israel, South Africa and Thailand experienced significant difficulties with meeting international guidelines in 1995. These nations’ averages are not included in the international average.
NOTE: Eighth grade in most nations. See appendix 2 for details.Parentheses indicate nations not meeting international sampling and/or other guidelines in 1995, 1999, or bothyears. See appendix 2 for details regarding 1999 data. See NCES (1996) for details for 1995 data.The international average is the average of the national averages of the 23 nations.The 1995 scores are based on re-scaled data.s.e. means standard error.
SOURCE: Martin et al. (2000). TIMSS 1999 International Science Report: Findings from IEA’s Repeat of the ThirdInternational Mathematics and Science Study at the Eighth Grade. Exhibit 3.4. Chestnut Hill, MA: Boston College.
103
APPENDIX 3—SUPPORTING DATA FOR CHAPTER 2
Table A3.16.—U.S. mathematics and science achievement withstandard errors, by selected characteristics: 1995 and 1999
MATHEMATICS1995 1999
Characteristics Average s.e. Characteristics Average s.e.Sex SexBoys 495 5.5 Boys 505 4.8Girls 490 4.7 Girls 498 3.9
Race/ethnicity Race/ethnicityWhite students 516 3.5 White students 525 4.6Black students 419 6.8 Black students 444 5.3Hispanic students 443 3.8 Hispanic students 457 6.3
National origin of parents National origin of parentsBoth U.S. born 496 4.5 Both U.S. born 510 3.8Both foreign born 474 8.5 Both foreign born 477 8.71 U.S. born, 1 foreign born 482 11.1 1 U.S. born, 1 foreign born 496 6.4
Mother’s education Mother’s educationHigh school or less 479 4.2 High school or less 484 3.5Some vocational+some college 498 5.2 Some vocational+some college 511 3.9Completed college 511 6.3 Completed college 539 5.4
Father’s education Father’s educationHigh school or less 474 4.4 High school or less 482 4.0Some vocational+some college 498 4.7 Some vocational+some college 512 4.2Completed college 515 5.7 Completed college 543 5.6
Race/ethnicity Race/ethnicityWhite students 544 3.3 White students 547 4.0Black students 422 8.3 Black students 438 5.7Hispanic students 446 5.0 Hispanic students 462 7.4
National origin of parents National origin of parentsBoth U.S. born 521 4.9 Both U.S. born 527 4.1Both foreign born 465 8.9 Both foreign born 472 8.01 U.S. born, 1 foreign born 498 11.5 1 U.S. born, 1 foreign born 509 7.0
Mother’s education Mother’s educationHigh school or less 497 4.8 High school or less 499 6.1Some vocational+some college 522 6.2 Some vocational+some college 525 5.3Completed college 531 6.5 Completed college 554 4.9
Father’s education Father’s educationHigh school or less 494 5.0 High school or less 495 5.9Some vocational+some college 521 5.4 Some vocational+some college 529 6.7Completed college 534 6.0 Completed college 560 4.7
NOTE: Other factors not controlled for in these analyses.s.e. means standard error.
SOURCE: U.S. Department of Education, National Center for Education Statistics, Third International Mathematics andScience Study–Repeat (TIMSS-R), unpublished tabulations, 1999.
104
APPENDIX 3—SUPPORTING DATA FOR CHAPTER 2
Table A3.17.—Mathematics achievement of TIMSS-R 1999 nationsthat participated in 1995 at both the fourth and eighth grades relativeto the average across these nations with standard errors
1995 1999
Fourth grade Eighth grade
Nation Difference2 s.e. Nation Difference2 s.e.
(Australia) 3.0 Australia 4.7Canada 3.3 Canada 2.7Cyprus 3.1 Cyprus 1.9Czech Republic 3.1 Czech Republic 4.1(England) 3.3 England 4.0Hong Kong SAR 3.8 Hong Kong SAR 4.2(Hungary) 3.5 Hungary 3.6Iran, Islamic Republic of 4.8 Iran, Islamic Republic of 3.3(Italy) 4.5 Italy 4.6Japan 2.0 Japan 1.8Korea, Republic of 1.9 Korea, Republic of 2.0(Latvia-LSS)1 4.4 Latvia-LSS1 3.3(Netherlands) 2.9 Netherlands 6.8New Zealand 4.2 New Zealand 4.9Singapore 4.3 Singapore 5.9(Slovenia) 3.1 Slovenia 2.8United States 2.9 United States 3.8
International average of 17 nations
0.9International average of 17 nations
1.0
1Designated LSS because only Latvian-speaking schools were tested.2The difference between the national average and the international average for each of the 17 nations.
NOTE: Fourth and eighth grade in most nations. See appendix 2 for details.Parentheses indicate nations not meeting international sampling and/or other guidelines at fourth grade in 1995. SeeNCES (1997c) for details.The international average is the average of the national averages of the 17 nations.s.e. means standard error.
SOURCE: Mullis et al. (2000). TIMSS 1999 International Mathematics Report: Findings from IEA’s Repeat of the ThirdInternational Mathematics and Science Study at the Eighth Grade. Exhibit 1.4. Chestnut Hill, MA: Boston College.
0-12-4223
-3340 4
-130-75063
-1832
-4873 8 0
517
1 7
-48-4
-2858 8
-102-395563
-1916
-3380 6
-22
524
105
APPENDIX 3—SUPPORTING DATA FOR CHAPTER 2
Table A3.18.—Science achievement of TIMSS-R 1999 nations thatparticipated in 1995 at both the fourth and eighth grades relative tothe average across these nations with standard errors
1995 1999Fourth grade Eighth grade
Nation Difference2 s.e. Nation Difference2 s.e.
(Australia) 3.5 Australia 4.3Canada 3.0 Canada 2.1Cyprus 3.1 Cyprus 2.3Czech Republic 3.0 Czech Republic 4.1(England) 3.1 England 4.5Hong Kong SAR 3.3 Hong Kong SAR 3.5(Hungary) 3.3 Hungary 3.6Iran, Islamic Republic of 4.4 Iran, Islamic Republic of 3.7(Italy) 4.4 Italy 4.5Japan 1.9 Japan 2.4Korea, Republic of 2.2 Korea, Republic of 2.6(Latvia-LSS)1 4.7 Latvia-LSS1 4.9(Netherlands) 3.1 Netherlands 6.5New Zealand 5.1 New Zealand 4.8Singapore 4.6 Singapore 7.6(Slovenia) 3.9 Slovenia 3.3United States 3.2 United States 4.5
International average of 17 nations
0.9International average of 17 nations
1.1
1Designated LSS because only Latvian-speaking schools were tested.2The difference between the national average and the international average for each of the 17 nations.
NOTE: Fourth and eighth grade in most nations. See appendix 2 for details.Parentheses indicate nations not meeting international sampling and/or other guidelines at fourth grade in 1995. SeeNCES (1997c) for details.The international average is the average of the national averages of the 17 nations.s.e. means standard error.
SOURCE: Martin et al. (2000). TIMSS 1999 International Science Report: Findings from IEA’s Repeat of the ThirdInternational Mathematics and Science Study at the Eighth Grade. Exhibit 1.4. Chestnut Hill, MA: Boston College.
2812
-641814-6-6
-134103962
-2717-910 828
514
16 9
-641514 528
-76-262524
-2121
-1544 9-9
524
Appendix 4Supporting Data for Chapter 3
108
APPENDIX 4—SUPPORTING DATA FOR CHAPTER 3
Table A4.1.—Organization of science instruction at grade 8, bynation: 1999
Nations teaching science as a singlegeneral/integrated subject
Nations teaching science as separate subjects
Australia Belgium-FlemishCanada Bulgaria
Chile Chinese Taipei1
Cyprus Czech RepublicEngland FinlandHong Kong SAR Hungary
Iran, Islamic Republic of Indonesia2
Israel Latvia
Italy Lithuania3
Japan Macedonia, Republic ofJordan MoldovaKorea, Republic of MoroccoMalaysia NetherlandsNew Zealand RomaniaPhilippines Russian FederationSingapore Slovak RepublicSouth Africa SloveniaThailandTunisiaTurkeyUnited States
1In Chinese Taipei, separate sciences are taught starting in grade 7, with biology in grade 7 and physics/chemistry in grade 8. Students were administered the general version of the questionnaire and asked about “natural science.” Science analyses based on teacher background data treat Chinese Taipei as teaching separate science subjects; science analyses based on student background data treat Chinese Taipei as teaching general/integrated science.2In Indonesia, students are taught “IPA science” by separate biology and physics teachers, but students receive a single composite grade. Students were administered the general version of the questionnaire and asked about “IPA science.” Science analyses based on teacher background data treat Indonesia as teaching separate science subjects; science analyses based on student background data treat Indonesia as teaching general/integrated science.3Lithuania tested the same cohort of students as other nations, but later in 1999, at the beginning of the next school year.
NOTE: Eighth grade in most nations. See appendix 2 for details.
SOURCE: Martin et al. (2000). TIMSS 1999 International Science Report: Findings from IEA’s Repeat of the ThirdInternational Mathematics and Science Study at the Eighth Grade. Exhibit 5. Chestnut Hill, MA: Boston College.
109
APPENDIX 4—SUPPORTING DATA FOR CHAPTER 3
Table A4.2.—Eighth-grade mathematics teachers’ reports of theirmain area of study with standard errors: 1999
Area of study
Percentage of students whose mathematics teachers reported a major area of study
U.S. average International average*Percent s.e. Percent s.e.
*The item response rate for this question was less than 70 percent in some nations. See Mullis et al. (2000) fordetails.
NOTE: Eighth grade in most nations. See appendix 2 for details.Science includes biology, physics, chemistry, and science education.Based on mathematics teachers’ reports of major or main area of study for bachelor’s and/or master’s degree; morethan one category could be selected.The international average is the average of the national averages of the nations that reported data.s.e. means standard error.
SOURCE: Mullis et al. (2000). TIMSS 1999 International Mathematics Report: Findings from IEA’s Repeat of theThird International Mathematics and Science Study at the Eighth Grade. Exhibit R3.1. Chestnut Hill, MA: BostonCollege.
Table A4.3.—Eighth-grade science teachers’ reports of their mainarea of study with standard errors: 1999
Area of study
Percentage of students whose science teachers reported a major area of study
U.S. average International average*Percent s.e. Percent s.e.
*The item response rate for this question was less than 70 percent in some nations. See Martin et al. (2000) for details.
NOTE: Eighth grade in most nations. See appendix 2 for details.Based on science teachers’ reports of major or main area of study for bachelor’s and/or master’s degree; more than onecategory could be selected.The international average is the average of the national averages of the nations that reported data.s.e. means standard error.
SOURCE: Martin et al. (2000). TIMSS 1999 International Science Report: Findings from IEA’s Repeat of the ThirdInternational Mathematics and Science Study at the Eighth Grade. Exhibit R3.1. Chestnut Hill, MA: Boston College.
110
APPENDIX 4—SUPPORTING DATA FOR CHAPTER 3
Table A4.4.—Teachers’ beliefs about their preparation to teachmathematics and science with standard errors: 1999
Percentage of 8th-grade students whosemathematics teachers reported feeling very well
prepared to teach mathematics
Percentage of 8th-grade students whose scienceteachers reported feeling very well prepared to
teach scienceNation Percent s.e. Nation Percent s.e.Australia 84 2.7 Australia 55 1.8Belgium-Flemish 80 1.4 Belgium-Flemish 47 2.1Bulgaria 66 4.8 Bulgaria 46 1.9Canada 79 1.7 Canada 44 1.7Chile 44 2.8 Chile 29 1.9Chinese Taipei 78 2.6 Chinese Taipei 42 2.6Cyprus 89 0.9 Cyprus 57 1.4Czech Republic 88 1.8 Czech Republic 64 2.0England — — England — —Finland 81 1.9 Finland 47 1.7Hong Kong SAR 72 2.6 Hong Kong SAR 34 2.4Hungary 59 3.3 Hungary 29 1.4Indonesia 81 2.1 Indonesia 58 2.7Iran, Islamic Republic of 81 1.8 Iran, Islamic Republic of 42 2.8(Israel) 84 1.6 (Israel) 55 1.7Italy 69 2.3 Italy 42 2.1Japan 23 2.6 Japan 17 1.7Jordan 88 1.7 Jordan 57 2.6Korea, Republic of 61 2.5 Korea, Republic of 31 1.9Lativa-LSS* 73 2.1 Lativa-LSS* 37 1.5Lithuania — — Lithuania — —Macedonia, Republic of 92 1.0 Macedonia, Republic of 72 1.3Malaysia 81 2.5 Malaysia 22 2.3Moldova 64 3.2 Moldova 39 1.6Morocco 75 1.3 Morocco 57 1.4Netherlands 84 5.3 Netherlands 50 1.7New Zealand 88 1.9 New Zealand 59 2.1Philippines 64 2.3 Philippines 41 2.3Romania 85 1.3 Romania 57 1.5Russian Federation — — Russian Federation — —Singapore 78 2.7 Singapore 46 2.4Slovak Republic 89 1.5 Slovak Republic — —Slovenia 50 2.9 Slovenia — —South Africa 71 1.9 South Africa 53 2.8Thailand 32 3.0 Thailand 30 2.4Tunisia 51 2.6 Tunisia 32 1.9Turkey 83 1.6 Turkey 63 2.2United States 90 1.2 United States 58 1.5
International average of 35 nations
73 0.4International average of 33 nations
46 0.4
*Designated LSS because only Latvian-speaking schools were tested which represents 61 percent of the population. — Data not available.
NOTE: Eighth grade in most nations. See appendix 2 for details. Parentheses indicate nations not meeting international sampling and/or other guidelines. See appendix 2 for details.The international average is the average of the national averages of the nations that reported data.s.e. means standard error.
SOURCE: Martin et al. (2000). TIMSS 1999 International Science Report: Findings from IEA’s Repeat of the ThirdInternational Mathematics and Science Study at the Eighth Grade. Exhibit R3.2. Chestnut Hill, MA: Boston College; Mullis et al. (2000). TIMSS 1999 International Mathematics Report: Findings from IEA’s Repeat of the Third InternationalMathematics and Science Study at the Eighth Grade. Exhibit R3.2. Chestnut Hill, MA: Boston College.
111
APPENDIX 4—SUPPORTING DATA FOR CHAPTER 3
Table A4.5.—Percentage of U.S. eighth-grade students taught byteachers that participated in professional development activities thatemphasized different topics with standard errors: 1999
Professional Development Topic
Percentage of U.S. 8th-grade students taught by teacherswho said their professional development activities
emphasized the topic “quite a lot” or “a great deal”Mathematics Science
General teaching methods 38 3.4 44 3.9Approaches to assessment 33 3.1 37 3.9Use of technology in instruction 44 3.7 46 2.6Strategies for teaching diverse student populations
21 3.0 23 2.5
Information on how students learn mathematics or science
21 2.8 23 4.3
Deepening teacher’s knowledge of mathematics or science
28 3.4 50 2.4
Leadership development 16 2.6 19 2.4
NOTE: s.e. means standard error.SOURCE: U.S. Department of Education, National Center for Education Statistics, Third International Mathematics andScience Study–Repeat (TIMSS–R), unpublished tabulations, 1999.
Table A4.6.—Percentage of eighth-grade students “taught”mathematics content areas with standard errors: 1999
United States 99 0.7 91 1.6 92 1.7 65 2.9 98 0.9International average 95 0.3 86 0.5 59 0.7 58 0.7 88 0.5
NOTE: “Taught” equals the sum of percentages of students whose mathematics teachers reported these topics as either“taught before this year” or “taught more than five periods this year.”Eighth grade in most nations. See appendix 2 for details.The international average is the average of the national averages of the nations that reported data.s.e. means standard error.
SOURCE: U.S. Department of Education, National Center for Education Statistics, Third International Mathematics andScience Study–Repeat (TIMSS–R), unpublished tabulations, 1999.
Table A4.7.—Percentage of eighth-grade students “taught” sciencecontent areas with standard errors: 1999
United States 78 3.1 81 3.2 70 3.6 73 3.6 78 2.6 95 1.7International average
57 0.7 60 0.7 53 0.7 67 0.6 72 0.6 80 0.6
NOTE: “Taught” equals the sum of percentages of students whose science teachers reported these topics as either “taughtbefore this year” or “taught more than five periods this year.”Eighth grade in most nations. See appendix 2 for details.The international average is the average of the national averages of the nations that reported data.s.e. means standard error.
SOURCE: U.S. Department of Education, National Center for Education Statistics, Third International Mathematics andScience Study–Repeat (TIMSS–R), unpublished tabulations, 1999.
112
APPENDIX 4—SUPPORTING DATA FOR CHAPTER 3
Table A4.8.—Eighth-grade students’ reports of the occurrence ofselected activities in their mathematics class “almost always” or“pretty often” with standard errors: 1999
Teacher shows how to doa mathematics problem
Students work onworksheets or from
textbooks
Students work onmathematics projects
Percent s.e. Percent s.e. Percent s.e.
United States 94 0.6 86 0.7 29 1.3International average 86 0.2 59 0.2 36 0.2
NOTE: Eighth grade in most nations. See appendix 2 for details.The international average is the average of the national averages of the nations that reported data.s.e. means standard error.SOURCE: Mullis et al. (2000). TIMSS 1999 International Mathematics Report: Findings from IEA’s Repeat of the ThirdInternational Mathematics and Science Study at the Eighth Grade. Exhibit 6.11. Chestnut Hill, MA: Boston College.
Table A4.9.—Eighth-grade students’ reports of the occurrence of selectedactivities in their science class “almost always” or “pretty often” withstandard errors: 1999
United States 69 1.4 76 1.5 59 1.3 71 1.1 65 1.5International average of 23 nations
80 0.2 56 0.3 51 0.3 71 0.3 57 0.3
NOTE: Eighth grade in most nations. See appendix 2 for details.The international average is the average of the national averages of the 23 nations that reported teaching a general/integrated sciencecurriculum in 1999.s.e. means standard error.
SOURCE: Martin et al. (2000). TIMSS 1999 International Science Report: Findings from IEA’s Repeat of the Third InternationalMathematics and Science Study at the Eighth Grade. Exhibits 6.10, R3.11, and R3.13. Chestnut Hill, MA: Boston College.
Table A4.10.—Eighth-grade students’ reports of access to computersand the Internet with standard errors: 1999
United States 80 1.2 59 1.7 76 3.2 81 0.9International average 45 0.2 18 0.2 25 0.3 43 0.2
NOTE: Eighth grade in most nations. See appendix 2 for details.The interational average is the average of the national averages of the nations that reported data.s.e. means standard error.
SOURCE: Martin et al. (2000). TIMSS 1999 International Science Report: Findings from IEA’s Repeat of the ThirdInternational Mathematics and Science Study at the Eighth Grade. Exhibits R1.1 and 6.17. Chestnut Hill, MA: BostonCollege.
113
APPENDIX 4—SUPPORTING DATA FOR CHAPTER 3
Table A4.11.—Eighth-grade students’ reports of using computersin mathematics and science classes “almost always” or “prettyoften” with standard errors: 1999
Mathematics Science
Percent s.e. Percent s.e.
United States 12 1.1 21 1.4International average 5 0.1 8 0.2
NOTE: Eighth grade in most nations. See appendix 2 for details.The interational average is the average of the national averages of the nations that reported data.s.e. means standard error.
SOURCE: Martin et al. (2000). TIMSS 1999 International Science Report: Findings from IEA’s Repeat of the ThirdInternational Mathematics and Science Study at the Eighth Grade. Exhibit 6.15. Chestnut Hill, MA: Boston College;Mullis et al. (2000). TIMSS 1999 International Mathematics Report: Findings from IEA’s Repeat of the ThirdInternational Mathematics and Science Study at the Eighth Grade. Exhibit 6.18. Chestnut Hill, MA: Boston College.
Table A4.12.—Eighth-grade students’ reports of discussing orbeginning homework in mathematics and science classes “almostalways” or “pretty often” with standard errors: 1999
United States 79 1.2 74 1.6 63 1.9 57 2.0International average
55 0.2 42 0.2 51 0.3 41 0.3
NOTE: Eighth grade in most nations. See appendix 2 for details.The international average is the average of the national averages of the nations that reported data.s.e. means standard error.
SOURCE: Martin et al. (2000). TIMSS 1999 International Science Report: Findings from IEA’s Repeat of the ThirdInternational Mathematics and Science Study at the Eighth Grade. Exhibit 6.10. Chestnut Hill, MA: Boston College; Mulliset al. (2000). TIMSS 1999 International Mathematics Report: Findings from IEA’s Repeat of the Third InternationalMathematics and Science Study at the Eighth Grade. Exhibit 6.11. Chestnut Hill, MA: Boston College.
Appendix 5Comparisons of all TIMSS and TIMSS-R Nations
116
APPENDIX 5—COMPARISONS OF ALL TIMSS AND TIMSS-R NATIONS
HOW DOES THE UNITEDSTATES PERFORM INCOMPARISON TO ALLTIMSS AND TIMSS–RNATIONS?Variation in the number of nations in interna-tional studies conducted to date can makeinterpretation of international averages andcomparisons of performance of the United Statesto other nations difficult. This is particularly truewhen attempts are made to look at changes in therelative performance of the United States over theyears. However, TIMSS–R was specificallydesigned to allow for a direct comparison ofmathematics and science achievement of eighth-graders over 4 years' time. The establishment of acommon scale for the eighth grade components ofTIMSS and TIMSS–R allows us to develop the bestset of international comparisons, and the bestestimate of the relative international performanceof the United States to date. TIMSS included 42nations. TIMSS–R included 38 nations, of which26 are in common between TIMSS and TIMSS–R.Combining the scores of nations from TIMSS andTIMSS–R allows us to use a comparison group of54 nations for this purpose. Not only does thisincrease the overall number of nations with whichthe United States is compared, but this extendedlist will also go some way toward overcoming crit-icisms that the comparison group of nations in thepast has been biased toward developed nationswith a heavy European participation.
Any attempt to combine the results from TIMSSand TIMSS–R raises the question of whichnational average to use for the 26 nations thatparticipated in both TIMSS and TIMSS–R. Fromone point of view, it may be best to use the 1995scores from these nations even though they have a1999 score. In this case we would be comparing
nations on the basis of their first participation in aTIMSS-like assessment. On the other hand, it maybe most appropriate to use the most recent dataavailable and so use the 1999 scores for the 26nations in both studies. As it turns out, the resultsare quite similar, so for the purposes of this pres-entation we will use the most recent data (1999)for those nations that participated in TIMSS–R.
When looking at the data available for the 54nations that participated in either TIMSS,TIMSS–R, or both, at the eighth grade, the UnitedStates performed above the international averageof the 54 nations in mathematics. Seventeennations outperformed the United States, 22nations performed lower than the United States,and 14 nations performed similarly to the UnitedStates.
In science, the United States also performed abovethe international average of the 54 nations.Fourteen nations outperformed the United States,26 nations performed lower than the UnitedStates, and 13 nations performed similarly to theUnited States
The findings from this combinedTIMSS/TIMSS–R comparison are shown in tableA5.1.
Relative to other nations in mathematics andscience, the United States appears to have donebetter in science than in mathematics, if ‘better’ isdefined as fewer nations outperforming theUnited States in one subject or the other. That is,when looking at the achievement of all 54 nationsthat participated in TIMSS or TIMSS–R, 14nations outperformed the United States in eighthgrade science whereas 17 nations outperformedthe United States in eighth grade mathematics.These comparisons reflect the achievement of U.S.eighth-graders against the achievement of theirpeers in 53 other nations, the broadest spectrumof nations to date.
117
APPENDIX 5—COMPARISONS OF ALL TIMSS AND TIMSS-R NATIONS
Table A5.1.—Mathematics and science acheivement of TIMSS-R andTIMSS nations with standard errors: 1995 and 1999
Average is significantly higher than the U.S. averageAverage does not differ significantly from the U.S. averageAverage is significantly lower than the U.S. average
*Denotes score from 1995 (no 1999 score available).1The shading of Finland and Canada may appear incorrect; however, statistically its placement is correct.2Designated LSS because only Latvian-speaking schools were tested.3Lithuania tested the same cohort of students as other nations, but later in 1999, at the beginning of the next school year.
NOTE: Parentheses indicate nations not meeting international sampling and/or other guidelines in the year for which data are reported. See appendix 2 for details for 1999. See NCES (1996) for details for 1995.The international average is the average of the national averages of the 54 nations.1995 scores are based on re-scaled data.s.e. means standard error.
SOURCE: U.S. Department of Education, National Center for Education Statistics, Third International Mathematics and ScienceStudy–Repeat (TIMSS–R), unpubished tabulations, 1999.