24

Pusat Khidmat Maklumat At dena UNIVERSlTI MALAYSIA SARAW~
94300 Kota Samarahan
REAVY METALS CONTAMINATION IN SOILS COLLECTED FROM SEVERAL FARMLANDS IN KUCHING
AWANG KHAIRULANWAR BIN AWANG YUSUF
Faculty ofResource Science and Technology
UNIVERSITI MALAYSIA SARAWAK
2006
DECLARATION
No portion of work referred to this dissertation has been submitted in support of an
application for another degree of qualification of this or any university or institution of
higher learning.
fu0t--· ...........(. :.O..~... ............. Awang Khairulanwar Bin Awang Yusuf
Resource Chemistry Programme
Faculty of Resource Science and Technology
Universiti Malaysia Sarawak (UNIMAS)
11

ACKNOWLEDGEMENTS
Special thanks to my supervisor, Miss Devagi alp Kanakaraju for her advices, guidances
and constructive critics throughout this research. I also would like to gratefully thank the
staffs in Resource Chemistry, Faculty of Resource Science and Technology UNIMAS
and lab assistants for their help and support. Special thank also due to Agricultural
Department staff, Mr Liew and the owners of Siburan, Beratok and Matang farmland
who provided the samples for this study to be a successful one.
I would like to extend my sincerest thanks to all my friends, family members and to all
who were involved with this research for their invaluable help, support and
encouragement. May God Bless you all.
111
DECLARATION
ACKNOWLEDGEMENT
TABLE OF CONTENTS
LIST OF FIGURE
LIST OF TABLES
ABSTRACT
CHAPTER ONE
CHAPTER TWO
CHAPTER THREE
Pusal Khidmal Maklumat AkailenU UNIVERSlTI MALAYSIA SARAWAJ.
94~OO Kota SamarahaD
TABLE OF CONTENTS
11
111
IV
VI
VI
Vll
1.0 INTRODUCTION 1
1.1 OBJECTIVES 3
2.0 LITERATURE REVIEW 4
3.0 MATERIAL AND METHODS 9
3.1 Sample collection 9
3.2 Soil Analysis 10
3.2.1 Total Organic Matter Content 10
3.2.2 pH of Soil 10
3.2.3 Particle Size Analysis 11
3.2.4 Total Kjeldahl Nitrogen (TKN) 12
3.2.5 Total Phosphorus In soils 13
3.3 Heavy Metal Analysis 14
3.3.1 Heavy Metal Detennination 14
IV
CHAPTER FOUR
CHAPTER FIVE
REFERENCES
APPENDIX
3.3.2 Statistical Analysis 14
4.0 RESULTS AND DISCUSSION 15
4.1 Physico-chemical Analysis 15
4.1.1 Total Organic Matter Content 15
4.1.2 pH of Soil 16
4.1.3 Particle Size Analysis 17
4.1.4 Total Kjeldahl Nitrogen (TKN) 19
4.1.5 Total Phosphorus In Soil 20
4.2 Heavy Metal 21
4.2.1 Heavy Metal Concentration In Soils 21
4.2.2 Correlation Study 25
5.0 CONCLUSION 28
v
LIST OF FIGURE
Figure 3.1 Location of Matang, Siburan and Beratok in Kuching Division 9
LIST OF TABLES
Table 2.1 Nonnal range of heavy metals 7
Table 2.2 Value of maximum allowable limits (M.A.L) for heavy metal in
soil (KABATA-PENDIAS, 1995) 8
Table 4.1 Organic matter content in 3 fannlands in Kuching 16
Table 4.2 pH value of 3 fannlands of Kuching 17
Table 4.3 Distribution of different particle size fraction in soil of Siburan,
Beratok and Matang 18
Table 4.4 TKN content in Siburan, Beratok and Matang samples 29
Table 4.5 Total phosphorus content in Siburan, Beratok and Matang samples 20
Table 4.6.a Concentration of heavy metal in first sampling 23
Table 4.6.b Concentration of heavy metals in second sampling 24
Table 4.7 Two-Way ANOVA Without Replication analysis of heavy metal
distribution between sampling stations and sampling periods at
95% confidence limit 25
Table 4.8 Correlation coefficient test showing relationship between concentrations of heavy metals, organic matter content, pH, particles size distribution, total phosphorus content and total Kjeldahl nitrogen 27
vi

HEAVY METALS CONTAMINATION IN SOILS COLLECTED FROM SEVERAL FARMLANDS IN KUCHING
Awang Khairulanwar Bin Awang Yusuf
Resource Chemistry Programme
Faculty of Resource Science and Technology
Universiti Malaysia Sarawak (UNIMAS)
ABSTRACT
Heavy metals (Cu, Co, Cd, Pb, Mn, Zn) in soil samples used for agricultural purpose from three selected farmlands in
Kuching were examined in this study. The concentration of metals in the soils of the three farmlands showed wide
variation. Mn was found to be highly accumulated in all samples. Cd displayed the lowest concentration among metals
analyzed. The concentration of metals increased in the order of Cd < Co < Cu < Zn < Pb < Mn. All samples showed
high fraction of sand which ranged between 31 .0% and 81 .0%. Metals in soils collected showed positive correlation
with organic content in the increasing order of Cd < Co < Pb < Cu < Mn < Zn. Clay fraction showed positive
significant correlation with an metals. There is significant difference (Two-way ANDV A Without Replicate test) for
Pb, Mn and Zn concentration between the sampling stations. Pb concentrations showed significant difference (P < 0.05)
between sampling periods. Linear regression analysis showed negative relationship between metals with pH and total
phosphorus content. Negative relationship also showed by Co with Total Kjeldhal Nitrogen ..
Key words: Farmland; soil; heavy metals; agriculture
ABSTRAK
Logam berat (CII, Co, Cd. Pb, Mn, Zn) dalam sampe/ tanah yang digllnakan IIntuk tlljllan pertanian dari tiga keblln
pilihan di KlIehing te/ah dillji di da/am kajian ini. Kepekatan logam di dalam sampel tanah dari tiga kebun
menunjllkkan variasi yang tinggi. Mn didapati terkumplll dengan banyaknya di dalam semua sampel. Cd menunjukkan
kepekatan yang paling rendah berbanding dengan elemen lain. Kepekatan logam berat meningkat dalam tllmtan Cd <
Co < CII < Zn < Pb < Mn. Semlla sampel tanah didapati mempunyai peeahan tekstur pasir yang linggi di antara
31.0% hingga 81.0%. Kandllngan logam berat menunjllkkan kaitan kolerasi positij dengan kandllngan bahan organik
dalam tllmtan menaik Cd > Co > Pb > CII > Mn > Zn. Peeahan tekstllr tanah liat menunjllkkan hllbllngan kolerasi
positij dengan semua logam berat. Terdapat perbezaan yang signifikan (ANOVA dua hala tanpa ulangan) di an tara
kepekatan Pb, Mn dan Zn dengan lokasi persampelan. Kepekalan Pb menllnjukkan perbezaan signifikan (P < 0.05) di
antara masa persampelan. Kajian kolerasi menunjllkan hllbungan negatif di antara logam dengan pH serta jllmlah
kandlmganfosfoms. Hubllngan negatijjllga dilllnjukkan oleh Co dengan Jumlah Nitrogen Kjeldahl.
Kata kunei: Kebun; tanah; logam berat; pertanian
Vll

-
CHAPTER ONE
1.0 INTRODUCTION
Agriculture is one of the main economical sectors in Sarawak. There are so many
farmlands in Sarawak, both in urban and rural areas. These farmlands contributed a large
number of agricultural products. However, with various human activities at the farmland,
the soils are contaminated with various pollutants such as heavy metals, methane gas,
pathogen and pesticides.
Top soH covers most of the land surface to an average of only 20 cm. Soil is so essential
to earth and its livings. This is because soil contains precious natural resources (Park,
2001). It contained mineral and organic solids, aqueous and gaseous components. Soil is
a heterogeneous medium with a lot of elements inside it. With great variety of content,
soil responses to changes and conditions of its surrounding. Especially with many human
activities going on, soil properties may change and causes effect to the form and
bioavailability of metals. Human activities such as mining and usage of pesticides in
farmland may increase the concentration of heavy metals in soil (Alloway, 1995).
Elements such as Cadmium (Cd), Chromium (Cr), Lead (Pb) and Mercury (Hg) have
tendency to stay in organism's tissues and causes various diseases. The heavy metals may
occur naturally or due to human activities (Reeve, 1999). Contaminant and pollutant are
frequently used interchangeably. Pollutant covers any concentration of a potentially
harmful substance, whether or not adverse effects are observed (Holdgate, 1979). It can
exist in soil and sediment. In most cases, heavy metals exist as part of precipitated
mineral, in aqueous phase, or absorbed on the surface of a mineral (NRC, 2001).
Contaminant, heavy metals, can accumulate on the bottom of the sediment and stay in the
system for a long period of time. This is the result of its tendency to bind strongly with
suspended material (ATSDR, 1997). Heavy metals are nonbiodegradable and persistent
1
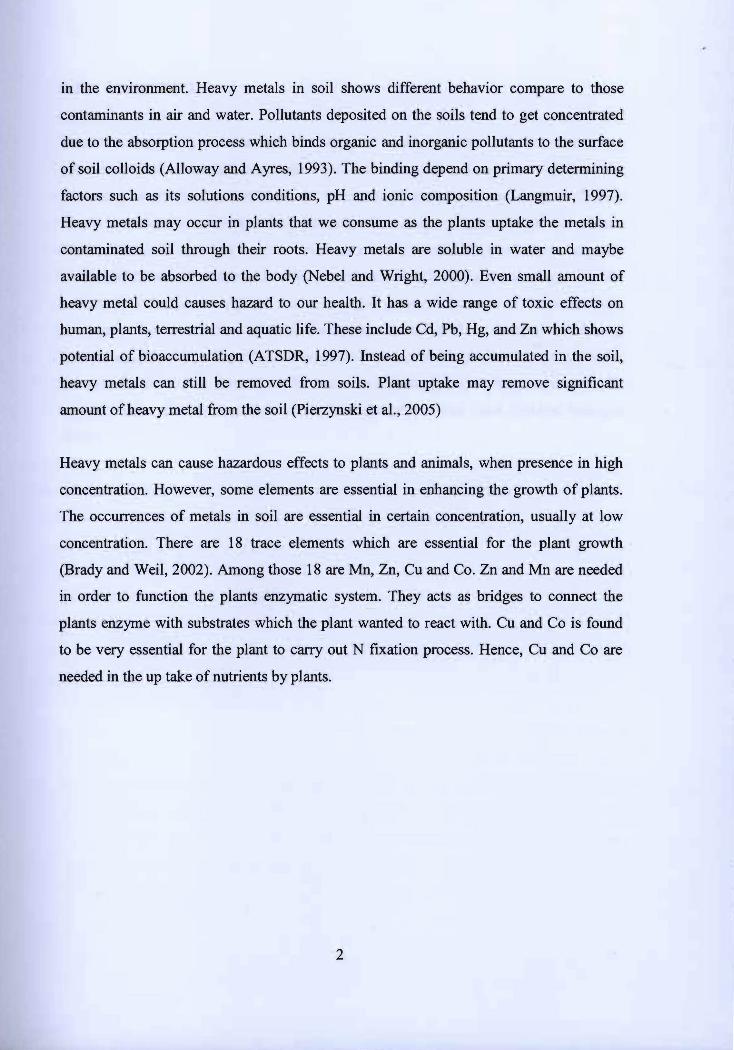
in the environment. Heavy metals in soil shows different behavior compare to those
contaminants in air and water. Pollutants deposited on the soils tend to get concentrated
due to the absorption process which binds organic and inorganic pollutants to the surface
of soil colloids (Alloway and Ayres, 1993). The binding depend on primary determining
factors such as its solutions conditions, pH and ionic composition (Langmuir, 1997).
Heavy metals may occur in plants that we consume as the plants uptake the metals in
contaminated soil through their roots. Heavy metals are soluble in water and maybe
available to be absorbed to the body (Nebel and Wright, 2000). Even small amount of
heavy metal could causes hazard to our health. It has a wide range of toxic effects on
human, plants, terrestrial and aquatic life. These include Cd, Pb, Hg, and Zn which shows
potential of bioaccumulation (ATSDR, 1997). Instead of being accumulated in the soil,
heavy metals can still be removed from soils. Plant uptake may remove significant
amount of heavy metal from the soil (Pierzynski et aI., 2005)
Heavy metals can cause hazardous effects to plants and animals, when presence in high
concentration. However, some elements are essential in enhancing the growth of plants.
The occurrences of metals in soil are essential in certain concentration, usually at low
concentration. There are 18 trace elements which are essential for the plant growth
(Brady and Weil, 2002). Among those 18 are Mn, Zn, Cu and Co. Zn and Mn are needed
in order to function the plants enzymatic system. They acts as bridges to connect the
plants enzyme with substrates which the plant wanted to react with. Cu and Co is found
to be very essential for the plant to carry out N fixation process. Hence, Cu and Co are
needed in the up take of nutrients by plants.
2
1.1 OBJECTIVES
Intensive usage of pesticides and other type of human activities like waste disposal,
vehicle exhaust, industrial production and fuel combustion have contributed to the
increasing level of heavy metals into the environment. Due to the mobilization of heavy
metals in the environment, these heavy metals will subsequently deposit into the soil and
eventually will be absorbed by plants. Agricultural soils may directly influence the public
health. Study on soil pollution is crucial as it promote a better understanding about the
pollution level of soils used for food crops. The primary objective in this study is to
determine the concentration of heavy metals in several soils from farmland of Matang,
Siburan and Beratok in Kuching. The metals of interest of this study are Cd, Cu, Pb, Zn,
Co and Mn. Other than that, this study also examined the soil characteristics namely pH,
organic matter, particle size distribution, total phosphorus and Total Kjeldahl Nitrogen
(TKN).
3

- -
CHAPTER TWO
r '--::.,...._
2.0 LITERATURE REVIEW
Soil is a collection of particles of disintegrated rock. Its variation will partly shows or
reflects the pattern of underlying rocks and deposits (Park, 2001). Soil is also the loose
mantle on the surface of the earth. Chemically, it can be defined as multicomponent,
open, biogeochemical systems (Aswathanarayana, 1999). Soil basically consists of
components such as minerals, organic compounds, living organisms, air and water. All of
these components can react with each other to progress the soil properties. Soil formation
is influenced by geological, environmental, and biological factors. The product, which is
the soil, is functional to these three factors (Andrews et al., 2004). Any changes or
happenings to the three factors will affect the soil properties. For heavy metal in soil, it
will occur naturally depend on the type and chemistry of the parent material, from which
the soil are derived. Anthropogenic inputs may lead to increase of contaminant levels,
exceeding those from natural sources (Ibrahim, 2004). Soils classification is different in
different country.
Heavy metals are elements which have atomic concentration of more than 6 g/cm3
(Alloway, 1995). Several heavy metals have tendency to concentrate in the upper layer or
horizon of many soil system. Its enrichment may be due to the fallout of wind-transported
pollutants, concentration of metal by plants from lower horizons or precipitated minerals,
or even due to complexing of metals by surface of minerals (Ibrahim, 2004). Heavy metal
originates from various types of sources that occurs naturally or caused by human
activities. For various reasons, determination of heavy metals in soil is carried out. These
include the measurement of total elementary content. Data gained from the measurement
will provide baseline knowledge to study changes in soil produce by elution, pollution,
plant uptake or agricultural manipulation (Ure, 1995). For assessment of agricultural and
environmental toxicity problems, data on total elementary content is vital.
4
PuRat Kbidmat Maklumat Akad mik UNT\'ERSrrr Mc\LAVSIO\ ARNWX
Various digestion methods are employed to study the metal content in soil samples.
Cheung et ai. (2003), suggested that for total heavy metals such as Cd, Cu, Pb and Zn,
mixture of HCI-HN02-HF can be used for microwave digestion. For acid leachable
metals, extraction can be done with HCI and HN03. Many studies have been carried out
on the metals pollution in various soils. An assessment on metals contamination in
mangrove sediments was carried out in Punta Mala Bay, Pasific Panama (Defew et aI.,
2004). It was found that Fe present in the highest mean value (9827 ppm), followed by
Zn (105 ppm), Pb (78.2 ppm), Cu (56.3 ppm) Ni (27.3 ppm) and Cr (23.3 ppm). Based on
the statistical analysis, using One-Way ANOVA, concentrations of Fe and Cr were not
significantly different between the monitored plots. Concentrations of Zn, Cu and Pb
were found to be significantly different between monitored plots.
Study carried out by Zauyah et ai. (2004), revealed that in cultivated ultisol soil in
Peninsular Malaysia contained highest content of Zn (59.9 mg/kg) followed by Cu (21.4
mg/kg) and Pb (19.4 mg/kg). Similar pattern of metals concentrations was observed for
cultivated inceptisoi. The highest metal was Zn (80.1 mglkg) followed by Cu (43.8
mg/kg) and Pb (13.2 mg/kg). The concentrations were obtained using the aqua regia
method. Besides heavy metals, the study also reported the soil pH. The pH for cultivated
ultisol was 6.06 and 6.8 for cultivated inceptisoi. The correlation studies of total heavy
metal concentrations and soil chemical properties showed that only total Zn and Pb was
positively correlated to pH.
Tam and Wong (2000) found out that concentration of heavy metals vary with it depth
and distance from the pollutant source. The concentrations of Cu, Pb and Zn were 4-25%
more enriched in the upper 0-10 cm of the top soil compared to 21-30 cm core of mudflat
sediments. Deeper it goes, the heavy metal concentrations will be lower (Turer and
Maynat, 2002). In the study of contamination of heavy metal on highway soils, less Pb
are founded as we go further away from the road (Turer and Maynat, 2002). However,
heavy metals have ability to move in few conditions. The redox condition, pH, and
organic ligand concentration are regarded as the major driving force for metal mobility
(Liang and Wong, 2003).
5

According to Chamber et aI. (undated), in their study on heavy metals loading into
agricultural land via manures, usage of manures in the agricultural activities can also
increase the heavy metals contamination. Using GIS, for each 5 km2 of agricultural area,
it was found that animal metals loading show highest loading of Zn (up to 3.3 kglha) and
Cu (up to 2.2 kglha). The high concentration of metals was found out to be due to the
existence of pig area in the sector. Other metals which was found includes Cr (up to
0.064 kglha), Cd (up to 0.007 kglha) and Pb (up to 0.073 kglha). They also found out that
poultry manures had Zn concentration of 400 mg/kg dm and Cu at 80 mg/kg dm. This is
2-5 times higher than the concentration of metals in the poultry feeds, reflecting the
efficiency of food dry matter conversion. Heavy metals can also be loaded in the
agricultural land via sewage sludge, inorganic fertilizer and agrochemicals (Alloway,
1995).
There are so many sources for contamination of soils with heavy metals. For exterior area
soil, which is by a road side, it was found that Pb and Zn are well contaminated here. Pb
has been found to be originated from gasoline and Zn is found to be originated from tire
(Pierzynski et aI., 2005). Vehicle that used the road has been found to be directly related
to both contaminations. For agricultural soils, high amount of Cd and Pb are related to
usage of fertilizers. Cd and Pb are found to be contaminated in soil which applied with
inorganic fertilizers (Pierzynski et aI., 2005).
According to Brady and Weil (2002), there are many factors that causmg the
contamination of heavy metals. These include the characteristic of the soil itself. For
leached, acidic, sandy soil, there was initially low concentration of elements inside it.
This is due to the deficiency of parent material in the elements. Acid leaching removed
much of the small quantity of trace element which originally occurred. The pH of soil
directly influence the occurrence of metal. In high pH concentration, amount of Cd
decreased while amount of Cu increased. The drainage and moistures control had been
found can influence the solubility of micronutrient, includes trace element, in soil. Proper
drainage of acidified soil will encourage the formation of oxidized Fe and Mn. Cropping
6
------------
II
~'~..P""""'"
will also influence the metals contamination level in soil. During harvesting, it was found
that a large amount of micronutrients are removed from the soil. Hence, decrease the
amount of the heavy metals.
If the pollutant source is similar, the concentration of heavy metals, according to
elements will follow a trend of order. Mangrove sediments from an area under
development and industrialization in Hong Kong follow this metals concentration trend
(Fe>Zn>Pb>Ni>Cu>Cr>Cd) (Ong Che and Cheung, 1998). Different pollutants will
increase different type of heavy metals. Agricultural activities, industrial activities,
combustion of car fuel and few others man produced pollutant will release different
heavy metals. Zn, Cu, Cd and Pb in sediments at Guang Zhou and Yen Long Creek are
high due to the attribution by the nearby municipal or industrial activities (Cheung et aI.,
2003). In Hong Kong, the printed board circuit industry contributes the most of the Cu
pollution (EPD, 1991).
Table 2.1 shows the normal range of heavy metals in soil suggested by Alloway (1995).
While value of maximum allowable limits (M.A.L) for heavy metal in soil are shown in
Table 2.2.
Table 2.1: Normal range of beavy metals
Element Concentration range (mg/kg)
Cu 2-250
Mn 20 -10000
Pb 2-300
Zn 1- 900
Cd 1-2
7

Table 2.2: Value of maximum allowable limits (M.A.L) for heavy metal in soil
(KABATA-PENDIAS, 1995)
Element Concentration (mg/kg)
Cd 5
Co 50
Cu 100
Pb 100
Zn 300
8
CHAPTER THREE
3.0 MATERIAL AND METHODS
3.1 Sample collection
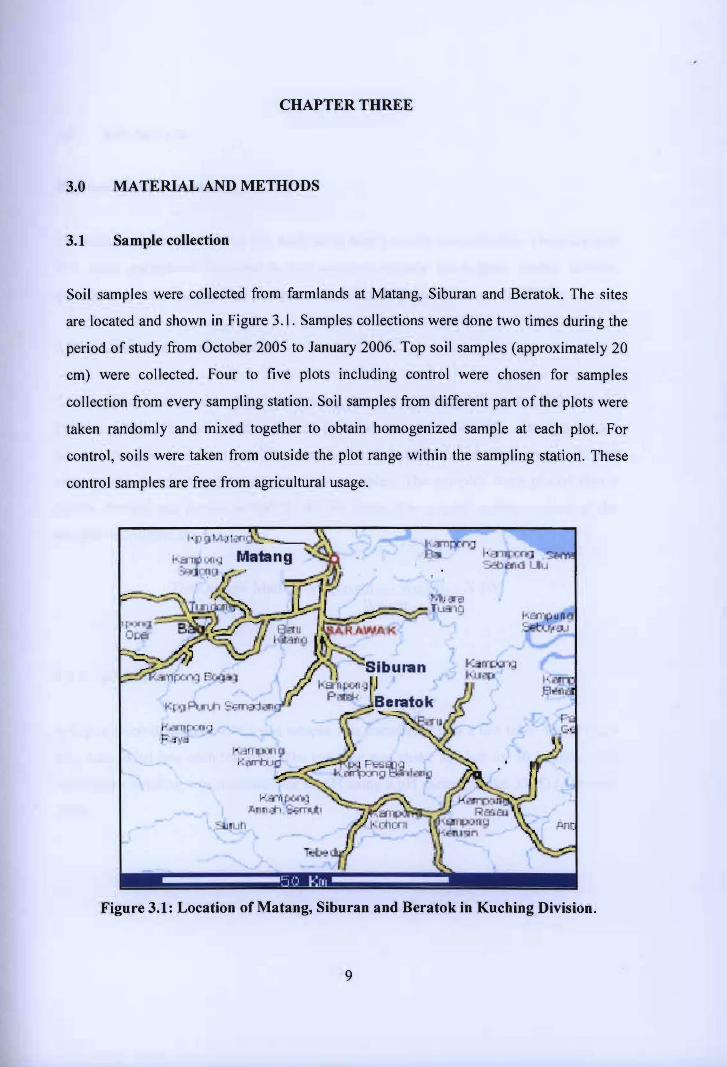
Soil samples were collected from farmlands at Matang, Siburan and Beratok. The sites
are located and shown in Figure 3.1. Samples collections were done two times during the
period of study from October 2005 to January 2006. Top soil samples (approximately 20
cm) were collected. Four to five plots including control were chosen for samples
collection from every sampling station. Soil samples from different part of the plots were
taken randomly and mixed together to obtain homogenized sample at each plot. For
control, soils were taken from outside the plot range within the sampling station. These
control samples are free from agricultural usage.
Figure 3.1: Location of Matang, Siburan and Beratok in Kuching Division.
9

3.2 Soil Analysis
Physico-chemical analysis
The main analysis involved in this study is on heavy metals concentration. There are also
five other parameters involved in soil analyses namely the organic matter content,
particle size analysis, pH, total phosphorus and Total Kjeldahl Nitrogen (TKN).
3.2.1 Total organic matter content
Total organic matter was determined using loss of ignition, LOI method at 550°C
(APHA, 1995). The soil sections (ca. 109) were oven dried (105°C) overnight until a
constant weight was achieved. The sample was then cooled in desiccators and 5 g of
sample was weighed and transferred into crucibles. The samples were placed into a
muffle furnace and heated at 550°C for 16 hours. The organic matter content of the
samples calculated as:
The Organic Matter, %= WeightlO~- Weight550 X 100 WeightI05
3.2.2 pH of soils
A 5 g of oven dried (at 105°C) soil sample was transferred into a test tube. Water (12.5
mL) was added into each test tube. The test tube was shake and left for 30 minutes. The
supernatant solution was measured for its pH using a pH meter (Model 3305) (Alloway,
1995).
10
3.2.3 Particle size analysis
This analysis was based on Stoke's Law using pipette method (USDA, 1984). Soil
samples were subjected to pretreatment and separation procedures.
Ten gram of 2 mm soil was added with ISO mL of H20 in a 2S0 mL conical flask. The
mixture was shaken overnight in a biospin. The mixture was transferred to alL cylinder
and the volume was then made up to 1L with distilled water. Twenty mililiters of
suspension was withdrawn from a depth of 10 cm below the surface and this fraction is
referred to as silt and clay. Clay fractions were obtained from a depth of 6 cm. They were
evaporated to dryness in oven at 10S°C. The supernatant was then decanted and
transferred to a 600 ml beaker and the process of addition and decantation of distilled
water was repeated until the supernatant was clear. The residue left was the sand
fractions. The clay, silt and sand percentage was calculated according to the following
equation:
Clay percentage:
We X 100
Silt percentage:
Sand percentage:
11
Where We = Weight of the oven dried clay fraction.
Ws= Weight of silt in the total volume of 1000 ml suspension.
Wts= Weight of the oven dried sand fraction.
3.2.4 Total Kjeldahl Nitrogen (TKN)
For determination of soil nitrogen, the Kjeldahl digestion method and distillation method
described by Chin (2000) was used. For digestion, 0.3 g of 0.05 mm soil were added to a
thick-wall rimless Pyrex test tube (25 x 200 mm approximately). Next, a scoop (about 1
g) of catalyst mixture was added. The catalyst consists of 100 g of sodium sulphate and 1
g of selenium. While rotating the test tube, 3 mL of concentrated sulphuric acid was
added. It was well mixed to ensure complete wetting of the soil and catalyst mixture. In
fume cupboard, the samples were digested on an electric heater rack for about one hour
or until the mixture is clear. When the reaction is vigorous, low heat was used for the first
15 minutes. The sides of the tubes were cooled and washed with a few mL of water to
prevent solidification of the mixture.
Then, digest was transferred into the electric distillation unit. The unit was set by adding
15 mL sodium hydroxide and distilling for 3 minutes. The distillate collected in 20 mL
boric acid in a tall beaker or conical flask. The distillate then titrated against 0.02 M
hydrochloric acid using 2 drops of each of methyl-red and bromocresol green indicators.
A blank determination through the same procedure was also prepared.
Calculation was made by:
Since 1 mL of 0.02 M HCI = 0.00028 of nitrogen, the nitrogen content as a percentage in
soil can be calculated as follow:
mL HCI used x molarity ofHCI x 0.00028 x 100
0.02 x wt. of soil taken in g
12
,..
3.2.5 Total Phosphorus in soils
Phosphorus in soils was detennined through digestion by Molybdenum Blue method.
First, 2.0 g of 2 mm soil was added to a tall fonn beaker. Then, 10 mL of digestion
mixture (I: I sulphuric acid-perchloric acid) was added. Using a watch glass, the beaker
was covered and the sample was digested until white dense fumes occur. It was heated
for another 20 minutes and left for cooling. The digest then filtered through filter paper
and transferred into a 100 mL flask and made up the volume.
Into a 100 mL beaker, 5 mL or appropriate aliquot of digest was pipetted. Three
milliliters of ammonium molybdate solution and 1 mL of sulphuric acid were then added.
Finally 5 mL of ascorbic acid were added. The sample was then heated until blue colour
developed. Sample was transferred into a 50 mL volumetric flask. The beaker was left to
cool down before it was washed with water for several times. The washing was added to
the flask. The volume was made up and the intensity was measured by using a UV -VIS
spectrometer at 600 nm.
To prepare the P calibration curve 1, 2, 3, 4, 5, 6 and 7 mL of the 10 ppm P standard
solution were pipetted into 100 mL beakers. Three milliliters of molybdate solution, 1
mL sulphuric acid and 5 mL ascorbic acid were added. The mixture was heated until blue
colour developed. The sample then left to cool down and then transferred into 50 mL
volumetric flasks. The amount of P in these solutions was 10, 20, 30, 40, 50, 60 and 70
Ilg respectively. The color intensity was measured. This method was adopted from Chin
(2000) of Department of Agricultural ofSarawak.
To calculate total P in soil, this equation was used:
Yx 100
wt. of soil taken in g x A
Y = amaunt of P in Ilg in the molybdate blue solution
A = aliquot of soil extract taken in mL
13

,..
3.3 Heavy metal analysis
3.3.1 Heavy metal detennination
According to the US Environmental Protection Agency (EPA, 1996);
1 g of sample was placed in beaker. Then, 10 mL of concentrated nitric acid was added to
the sample. Using a watch glass, the beaker was covered and heated « boiling point
temperature) for 15 minutes. After cooling, 5 mL of concentrated nitric acid was added to
the sample. Heating process was repeated, for 30 minutes instead of 15 minutes.
Additional nitric acid was added to the sample until no brown fumes given off. This
heating process reduced the solution amount until less then 5 mL. Sample was left to cool
down before adding 2 mL of water and 3 mL of 30% H20 2• Additional H20 2 was added
until effervescence ceased. This process took place for two hours and the sample amount
was reduced to less than 5 mL. After that, 10 mL of Hel was added and heated for 15
minutes. The sample was filtered and quantitatively transferred it to a 100 mL volumetric
flask. After made up the volume of the sample, using ionized water, the sample then
analyzed using Flame Atomic Absorption Spectroscopy (F AAS).
3.3.2 Statistical Analysis
The concentrations of heavy metals from the fannlands were tested using Two-way
ANOV A Without Replicate analysis. The heavy metals concentration obtained from the
soils collected from Matang, Siburan and Beratok at different sampling stations and
different sampling periods were analyzed for any significant difference. Metals were also
tested for relationship with soil characteristics by employing linear regression analysis
(Microsoft Excel).
14

CHAPTER FOUR
4.0 RESULTS AND DISCUSSION
4.1 Physico-chemical analysis
4.1.1 Total organic matter content
The percentage of organic matter for each of the sample was calculated using the LOI
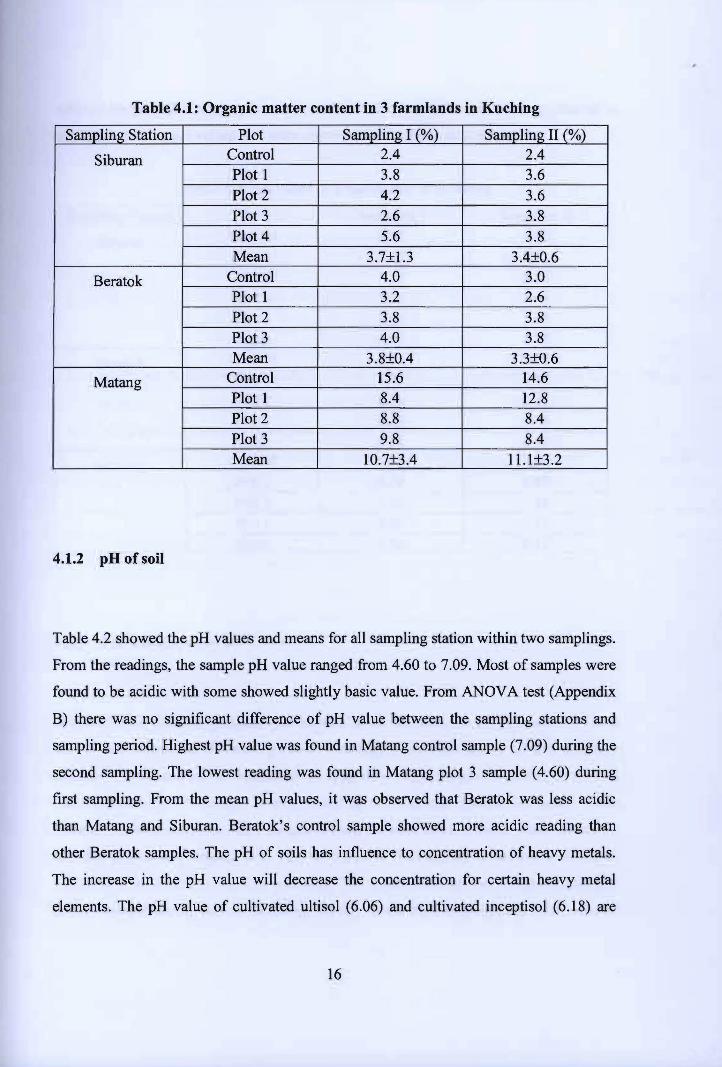
loss of ignition method. Table 4.1 showed the organic matter content and mean for all
sampling sites within 2 samplings. The percentage of organic matter for the soil samples
from these 3 sampling sites ranged from 2.4% to 15.6%. The highest reading within the
two samplings was found in Matang's control sample (15.6%) for the first sampling. The
lowest organic matter content was detected in Siburan control sample (2.4%) both in first
and second sampling. Based on the results, it was observed that the content of the
organic matter in Matang's samples are higher than those from Siburan and Beratok.
Matang station showed the highest mean from the two samplings. Compared to each plot
in the station, control sample of Matang showed higher organic matter content. While
control sample of Siburan showed lower organic matter content compared to Siburan's
samples. Lee (2004) in his study on sediment samples of mangrove wetland obtained
percentage of organic matter ranged from 5.23% to 10.71%, with the influenced of dry
and wet season. Compared to the mangrove organic matter content, the three farmlands
displayed higher range of organic matter. There was no significant difference between
sampling periods, according to the Two-Way ANOVA Without Replication (Appendix
B) analysis at 95% confidence limit. However, there was a significant difference (P <
0.05) between different sampling stations.
15
,...
Table 4.1: Organic matter content in 3 farmlands in Kuching
Sampling Station Plot Sampling I (%) 2.4ControlSiburan
Plot 1 3.8 4.2Plot 2
Plot 3 2.6 Plot 4 5.6 Mean 3.7±1.3
4.0ControlBeratok Plot 1 3.2 Plot 2 3.8
4.0Plot 3 Mean 3.8±0.4
Control 15.6Matang Plot 1 8.4 Plot 2 8.8 Plot 3 9.8 Mean 1O.7±3.4
Sampling II (%) 2.4 3.6 3.6 3.8 3.8
3.4±0.6 3.0 2.6 3.8 3.8
3.3±0.6 14.6 12.8 8.4 8.4
11.1±3.2
4.1.2 pH of soil
Table 4.2 showed the pH values and means for all sampling station within two samplings.
From the readings, the sample pH value ranged from 4.60 to 7.09. Most of samples were
found to be acidic with some showed slightly basic value. From ANOV A test (Appendix
B) there was no significant difference of pH value between the sampling stations and
sampling period. Highest pH value was found in Matang control sample (7.09) during the
second sampling. The lowest reading was found in Matang plot 3 sample (4.60) during
first sampling. From the mean pH values, it was observed that Beratok was less acidic
than Matang and Siburan. Beratok's control sample showed more acidic reading than
other Beratok samples. The pH of soils has influence to concentration of heavy metals.
The increase in the pH value will decrease the concentration for certain heavy metal
elements. The pH value of cultivated ultisol (6.06) and cultivated inceptisol (6.18) are
16


