+ All Categories
Home > Documents > Putnam Spectrum Fund

Putnam Spectrum Fund

Date post: 23-Oct-2014
Category:
Upload: putnam-investments
View: 16 times
Download: 0 times
Share this document with a friend
Description:
Veteran Portfolio Manager David L. Glancy pursues the potential of companies that use debt to achieve their business goals. Find out more about these two entrepreneurial funds.
1
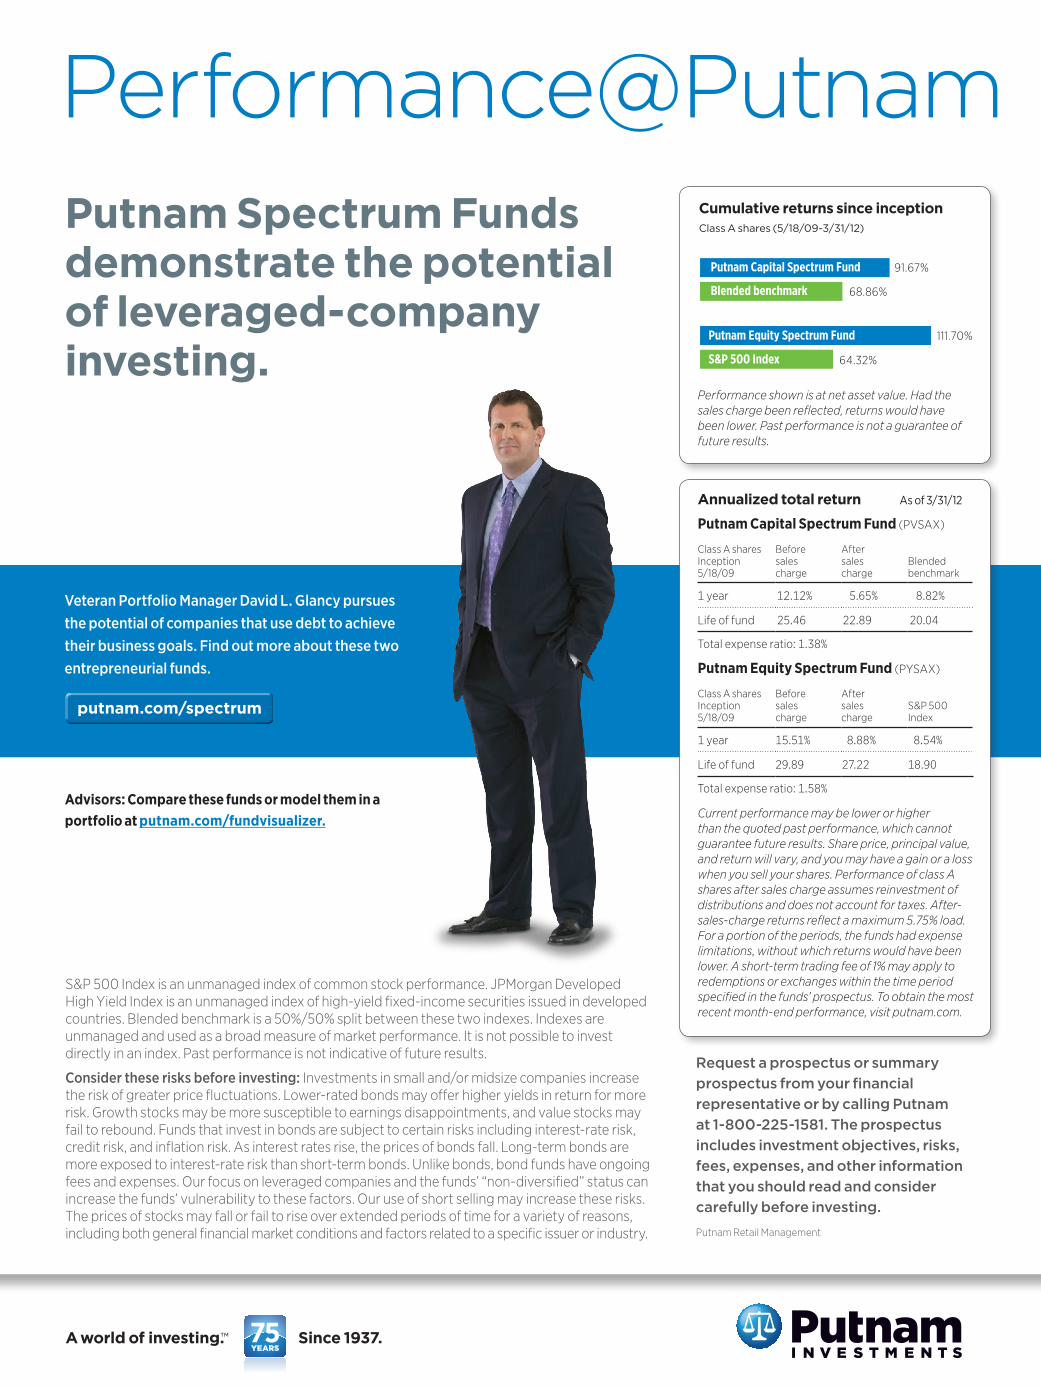
Performance@Putnam Putnam Spectrum Funds demonstrate the potential of leveraged-company investing. Veteran Portfolio Manager David L. Glancy pursues the potential of companies that use debt to achieve their business goals. Find out more about these two entrepreneurial funds. putnam.com/spectrum Advisors: Compare these funds or model them in a portfolio at putnam.com/fundvisualizer. S&P 500 Index is an unmanaged index of common stock performance. JPMorgan Developed High Yield Index is an unmanaged index of high-yield fixed-income securities issued in developed countries. Blended benchmark is a 50%/50% split between these two indexes. Indexes are unmanaged and used as a broad measure of market performance. It is not possible to invest directly in an index. Past performance is not indicative of future results. Consider these risks before investing: Investments in small and/or midsize companies increase the risk of greater price fluctuations. Lower-rated bonds may offer higher yields in return for more risk. Growth stocks may be more susceptible to earnings disappointments, and value stocks may fail to rebound. Funds that invest in bonds are subject to certain risks including interest-rate risk, credit risk, and inflation risk. As interest rates rise, the prices of bonds fall. Long-term bonds are more exposed to interest-rate risk than short-term bonds. Unlike bonds, bond funds have ongoing fees and expenses. Our focus on leveraged companies and the funds’ “non-diversified” status can increase the funds’ vulnerability to these factors. Our use of short selling may increase these risks. The prices of stocks may fall or fail to rise over extended periods of time for a variety of reasons, including both general financial market conditions and factors related to a specific issuer or industry. Request a prospectus or summary prospectus from your financial representative or by calling Putnam at 1-800-225-1581. The prospectus includes investment objectives, risks, fees, expenses, and other information that you should read and consider carefully before investing. Putnam Retail Management 91.67% 68.86% 111.70% 64.32% Putnam Capital Spectrum Fund Blended benchmark Putnam Equity Spectrum Fund S&P 500 Index Annualized total return As of 3/31/12 Putnam Capital Spectrum Fund (PVSAX) Class A shares Inception 5/18/09 Before sales charge After sales charge Blended benchmark 1 year 12.12% 5.65% 8.82% Life of fund 25.46 22.89 20.04 Total expense ratio: 1.38% Putnam Equity Spectrum Fund (PYSAX) Class A shares Inception 5/18/09 Before sales charge After sales charge S&P 500 Index 1 year 15.51% 8.88% 8.54% Life of fund 29.89 27.22 18.90 Total expense ratio: 1.58% Current performance may be lower or higher than the quoted past performance, which cannot guarantee future results. Share price, principal value, and return will vary, and you may have a gain or a loss when you sell your shares. Performance of class A shares after sales charge assumes reinvestment of distributions and does not account for taxes. After- sales-charge returns reflect a maximum 5.75% load. For a portion of the periods, the funds had expense limitations, without which returns would have been lower. A short-term trading fee of 1% may apply to redemptions or exchanges within the time period specified in the funds’ prospectus. To obtain the most recent month-end performance, visit putnam.com. Cumulative returns since inception Class A shares (5/18/09-3/31/12) Performance shown is at net asset value. Had the sales charge been reflected, returns would have been lower. Past performance is not a guarantee of future results.
Transcript

Performance@PutnamPutnam Spectrum Funds demonstrate the potential of leveraged-company investing.

Veteran Portfolio Manager David L. Glancy pursues the potential of companies that use debt to achieve their business goals. Find out more about these two entrepreneurial funds.

putnam.com/spectrum

Advisors: Compare these funds or model them in a portfolio at putnam.com/fundvisualizer.

S&P 500 Index is an unmanaged index of common stock performance. JPMorgan Developed High Yield Index is an unmanaged index of high-yield fixed-income securities issued in developed countries. Blended benchmark is a 50%/50% split between these two indexes. Indexes are unmanaged and used as a broad measure of market performance. It is not possible to invest directly in an index. Past performance is not indicative of future results.

Consider these risks before investing: Investments in small and/or midsize companies increase the risk of greater price fluctuations. Lower-rated bonds may offer higher yields in return for more risk. Growth stocks may be more susceptible to earnings disappointments, and value stocks may fail to rebound. Funds that invest in bonds are subject to certain risks including interest-rate risk, credit risk, and inflation risk. As interest rates rise, the prices of bonds fall. Long-term bonds are more exposed to interest-rate risk than short-term bonds. Unlike bonds, bond funds have ongoing fees and expenses. Our focus on leveraged companies and the funds’ “non-diversified” status can increase the funds’ vulnerability to these factors. Our use of short selling may increase these risks. The prices of stocks may fall or fail to rise over extended periods of time for a variety of reasons, including both general financial market conditions and factors related to a specific issuer or industry.

Request a prospectus or summary prospectus from your financial representative or by calling Putnam at 1-800-225-1581. The prospectus includes investment objectives, risks, fees, expenses, and other information that you should read and consider carefully before investing.

Putnam Retail Management

91.67%

68.86%

111.70%

64.32%

Putnam Capital Spectrum Fund

Blended benchmark

Putnam Equity Spectrum Fund

S&P 500 Index

Annualized total return As of 3/31/12

Putnam Capital Spectrum Fund (PVSAX)

Class A sharesInception 5/18/09

Before sales charge

After sales charge

Blended benchmark

1 year 12.12% 5.65% 8.82%

Life of fund 25.46 22.89 20.04

Total expense ratio: 1.38%

Putnam Equity Spectrum Fund (PYSAX)

Class A sharesInception 5/18/09

Before sales charge

After sales charge

S&P 500 Index

1 year 15.51% 8.88% 8.54%

Life of fund 29.89 27.22 18.90

Total expense ratio: 1.58%

Current performance may be lower or higher than the quoted past performance, which cannot guarantee future results. Share price, principal value, and return will vary, and you may have a gain or a loss when you sell your shares. Performance of class A shares after sales charge assumes reinvestment of distributions and does not account for taxes. After-sales-charge returns reflect a maximum 5.75% load. For a portion of the periods, the funds had expense limitations, without which returns would have been lower. A short-term trading fee of 1% may apply to redemptions or exchanges within the time period specified in the funds’ prospectus. To obtain the most recent month-end performance, visit putnam.com.

Cumulative returns since inceptionClass A shares (5/18/09-3/31/12)

Performance shown is at net asset value. Had the sales charge been reflected, returns would have been lower. Past performance is not a guarantee of future results.

Recommended