19
EDUCATIONSECTOR REPORTS PUTTING DATA INTO PRACTICE: Lessons From New York City By Bill Tucker October 2010
| Date post: | 16-Mar-2016 |
| Category: |
Documents |
| Upload: | education-sector |
| View: | 216 times |
| Download: | 2 times |
EDUCATIONSECTOR REPORTS
Putting Data into Practice:Lessons From New York City
By Bill Tucker
October 2010

ACKNOWLEDGEMENTS
Thanks to my Education Sector colleagues, in particular Elena Silva and Kelly Bathgate, for their help in thinking about issues related to data and learning, and to Kevin Carey and Robin Smiles for their support in the writing and editing of this paper. Susan Headden deserves special thanks for her careful editing and thoughtful feedback. Catherine Cullen provided invaluable help with the initial research and ideas contained in this report. My sincere appreciation also goes to the many people who were kind enough to read and comment on an earlier draft of this paper, including Ben Boer, Vincent Cho, Beverly Donohue, Eric Osberg, Baron Rodriguez, Jeffrey Wayman, and Emily Weiss. Finally, thank you to the dozens of educators, researchers, policy analysts, and experts who graciously offered their insights and knowledge to me throughout the research and writing of this report.
This report was funded by the Charles Stewart Mott Foundation. Education Sector thanks the foundation for their support. The views expressed in the paper are those of the author alone.
ABOUT THE AUTHOR
BILL TUCKER is managing director at Education Sector. He can be reached at [email protected].
ABOUT EDUCATION SECTOR
Education Sector is an independent think tank that challenges conventional thinking in education policy. We are a nonprofit, nonpartisan organization committed to achieving measurable impact in education, both by improving existing reform initiatives and by developing new, innovative solutions to our nation’s most pressing education problems.
© Copyright 2010 Education Sector
Education Sector encourages the free use, reproduction, and distribution of our ideas, perspectives, and analyses. Our Creative Commons licensing allows for the noncommercial use of all Education Sector authored or commissioned materials. We require attribution for all use. For more information and instructions on the com mercial use of our materials, please visit our website, www.educationsector.org.
1201 Connecticut Ave., N.W., Suite 850, Washington, D.C. 20036 202.552.2840 • www.educationsector.org
1EDUCATION SECTOR REPORTS: Putting Data Into Practicewww.educationsector.org
U.S. Secretary of Education Arne Duncan calls data “the driving force [behind education] reform.”1 With stronger data, the reasoning goes, policymakers can expose problems, identify effective teachers, more smartly allocate resources, and build political will for reform. In the classroom, better data can help educators identify learning gaps and behavior patterns so they can tailor instruction to individual students.
Such is the promise of data that, nationwide over the past decade, school districts and states have spent more than $1 billion to build and implement data systems to track and analyze statistical information about students and their learning.2 Data systems were a key criterion of the Obama administration’s Race to the Top competition, and by 2011, all 50 states will have systems to track individual student progress from year to year.3 Many school districts have built data systems as well.
But while there have been impressive advances in the collection and management of data used for
purposes of accountability, a 2009 report from the U.S. Department of Education found that “even in districts with a reputation for leadership in using data, electronic data systems are barely influencing classroom-level decision-making.”4 Many systems aren’t designed to provide data to teachers, let alone students. All too often, the preoccupation with data collection has overshadowed the ways in which data is—or isn’t—used.5
Progress, however, is being made, and few districts have embraced the use of data like New York City, the nation’s largest district with 1.1 million students and 90,000 educators. Data is a vital component of New York City’s aggressive strategy to hold educators accountable for student performance and to make sure they have all the tools and support they need to succeed.6 The district’s “inquiry teams,” groups of teachers who collaborate to help students based on shared information, rely heavily on data produced by an $80 million information storehouse called the Achievement Reporting and Innovation System, or
Stephanie ring is an educator who loves numbers. and it’s not just because she’s a high school math teacher. She also serves as her school’s data specialist, a savvy analyst who monitors things like course credits, test scores, and attendance records to make sure students are on track to graduate and getting enough attention from teachers who instruct as many as 150 students a day. For ring, who teaches at Brooklyn, n.Y.’s High School of telecommunications arts and technology, data is valuable only when she can act on it—not when a student is a senior and hopelessly far behind, but when he’s a freshman and just starting to fall short of the credits he’ll need to graduate on time. Data in hand, ring and her colleagues can then refine instructional practices and prescribe interventions, addressing the problem soon after it starts. For ring, data drives action. “What are we doing for these kids?” it prompts her to ask. “Did we talk to them? Did we move them?”

2 EDUCATION SECTOR REPORTS: Putting Data Into Practice www.educationsector.org
ARIS, a repository of statistical information about students.
With a couple of mouse clicks, classroom teachers can now get such data as interim test scores, subject grades, attendance records, and English language learner status on a single computer screen. Thanks to ARIS, a high school instructor who may have a student for just one period a day can now see how that student is progressing across all courses, and can identify students at risk of academic failure. Teachers are now also able to spot long-term learning trends, even for students who have moved often among schools and who have only just arrived in their class. After initial resistance, ARIS has won the
cautious support of the local principals union, and more than 65 percent of the district’s teachers now participate in inquiry teams.7
But ARIS has been fraught with problems, as well. Developers have confronted a tangle of antiquated systems that can’t talk to each other—information silos that prevented any one person from getting a complete picture of a student. And they continue to struggle with making the data timely and accurate and giving educators the time and training they need to use it well. In the process, they have learned that technology holds little value unless it is flexible, relevant, and provides the fine-grained information that teachers really need. Above all, the district has realized that building a data system is only the first step—what educators do with the data is the critical second. Building the conditions and demand for data-based analysis is often more difficult than collecting the data itself.
While New York’s size and the scope of its initiative make it unique, the district provides a rich and timely illustration of how data is being used in an urban
school system—and how it can be employed in smaller districts, as well. Seen from the perspective of both its obstacles and successes, New York’s experience holds valuable lessons for all school districts about how to succeed with the critical second component of the drive for data—using the information to improve student performance.
The Promise and Perils of DataData is used to inform decisions in almost every field of endeavor, from health care to sports, from criminal justice to finance. Film studios use data to decide what movies to produce.8 Police departments use it to predict and prevent crime. And credit card companies instantly compare transactions with historical patterns to spot potential fraud.
In health care, providers are beginning to use data from electronic records to reduce errors, cut costs, and improve patient outcomes. Effective use of electronic health records is one reason why the Veterans Health Administration now surpasses other health systems on standardized quality measures even though its patients are for the most part older, sicker, and poorer. Not only do these records allow for coordinated care by multiple physicians, they also enable more rapid identification of risk factors, making it possible, for instance, to detect kidney disease in veterans often before symptoms emerge.9
Likewise, the best teachers have always used information about their students to help them improve instruction—and they know that more and better information can lead to even better results. Yet, unlike for almost all other professionals who perform complex, demanding work, the information tools available to teachers have been remarkably limited. Most teachers still work isolated in their classrooms, with only their own eyes and rudimentary assessment tools to guide them. For the most part, they aren’t benefiting from sophisticated information-gathering tools, from their colleagues’ knowledge, or from analyses of thousands of similar situations—the very kind of information that physicians, police officers, and even sports executives use on a daily basis. Concludes a recent article from SRI International’s Center for Technology and Learning: “Teachers do not have the data-rich, performance-support, and information-feedback work environment that virtually
Above all, the district has realized that building a data
system is only the first step—what educators do with the data
is the critical second.

3EDUCATION SECTOR REPORTS: Putting Data Into Practicewww.educationsector.org
all other high-performance professionals … have at their disposal.”10
That is not to say that educational data doesn’t exist. On the contrary, it has been centrally collected since at least 1867 when the first federal Education Department was charged with “collecting such statistics and facts as shall show the condition and progress of education in the several States and Territories, and of diffusing such information.”11 But until recently, data almost always flowed one way: up. It went from school to district, from district to state, and from state to the federal government. It was retrospective in nature and designed almost exclusively to show compliance with state and federal regulations. Because the information was reported in aggregate, state agencies could provide policymakers with descriptive snapshots of student populations, but they couldn’t give them data about individual students and how those students changed over time.
The 2001 federal No Child Left Behind Act, which imposed new reporting requirements on states, sharpened the focus on data. The law required states to collect test data for individual students each year, meaning states could no longer rely on aggregated achievement information reported by local districts. (Student-level data can now be sorted by school, race, and a variety of other subgroups). At the same time, researchers and policymakers urged states to develop longitudinal data systems that would allow them to track individual students over time, across schools, through college, and into the work force. In 2002, only 15 states had a longitudinal data system.12 By 2008, 48 states did.13
But these systems often fail to give educators the information they need. While the amount of educational data collected continues to grow—Texas school districts alone respond to 104 data collections by the Texas Education Agency each year—the quality and utility of much of it remains questionable.14 Many systems have become de facto data morgues,15 used more often to perform autopsies of failed programs than to help educators and policymakers improve existing ones.16
Other fields have tackled similar problems. Hospitals, for example, collect data on patient outcomes and mortality rates so policymakers, administrators, and consumers can use it to make judgments about
entire institutions. But physicians require different types of information, such as measurements of vital signs and results of blood tests, to diagnose and treat individual patients.17 Likewise, in education, state and district officials want data that shows broad trends so they can assess a school’s or a district’s overall effectiveness. (This is accountability data.) Teachers want additional information, such as results from classroom assessments that may track weekly progress.
Health reformers have also demonstrated that electronic data systems will not improve performance on their own. Although they are essential, improved technology and better data are just the infrastructure for more substantive changes in the daily practices of providers. For example, officials at Central Pennsylvania’s Geisinger Health System, a model in its efforts to improve quality and control costs, quickly realized that the ability to share data across a variety of systems and contexts was not enough to improve
care. What was needed was a cultural change among its employees—a shift from working in isolation on single tasks to working together on tasks that are aligned.18
New York City’s Data StrategyIndividual teachers can benefit from access to analytical tools like ARIS. But New York City’s goal—to build evidence-based school cultures—is even more ambitious and requires both the tools and collaborative processes to use the information to improve student performance. Shael Suransky, deputy chancellor for the Division of Performance and Accountability, identifies the two key components of the district’s strategy: regular collection and analysis of assessment data—much of which can be found in ARIS—and the use of teacher inquiry teams.19
The best teachers have always used information about their
students to help them improve instruction.
4 EDUCATION SECTOR REPORTS: Putting Data Into Practice www.educationsector.org
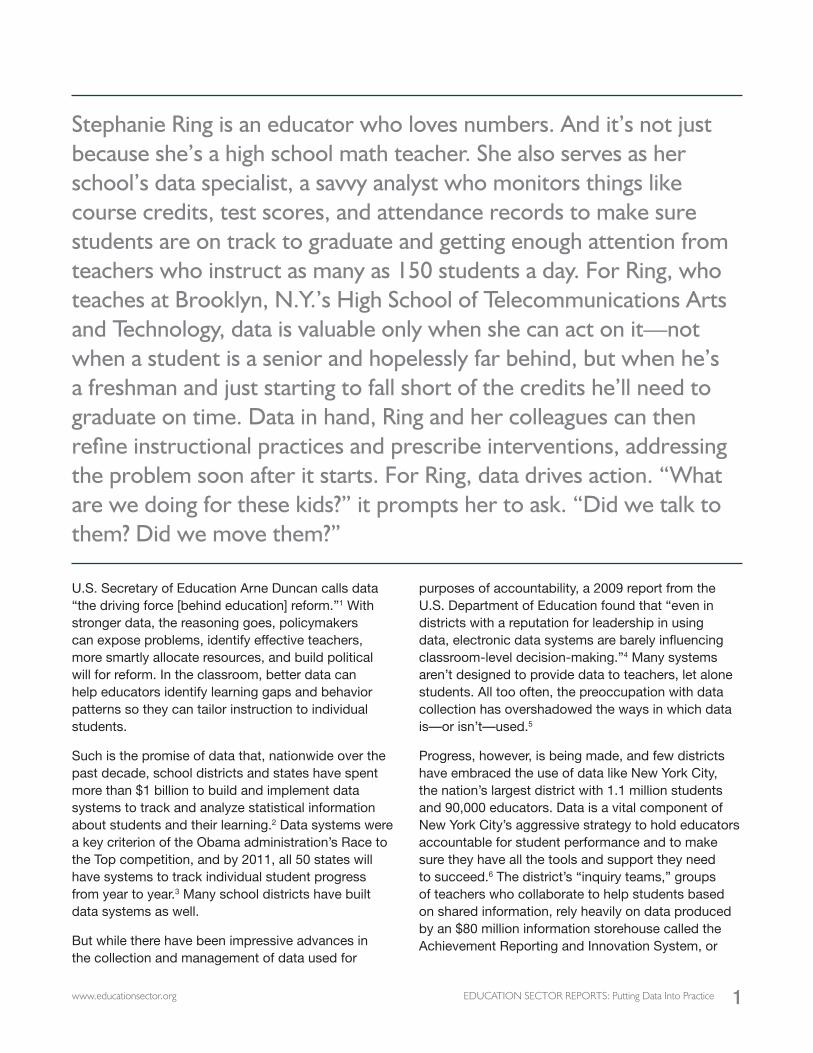
The inquiry teams focus intensively on small groups of students. A team of teachers and administrators looks at schoolwide data to identify a focus group—say, sixth-graders with scores of two or less on last year’s state English Language Arts test, which is graded on a scale of one to four. The team then studies both the students’ work and the data, and reviews instructional approaches: “How are these students being taught?” they ask each other. “How are they being grouped?” After answering these questions, the team develops a theory about why the students are not succeeding and begins to implement changes.20 Periodic or interim assessments, such as those from Columbia University’s Teachers College Reading and Writing Project, which measure recognition of letters and their corresponding sounds, are meant to help teachers gauge progress along the way. (See Figure 1.)
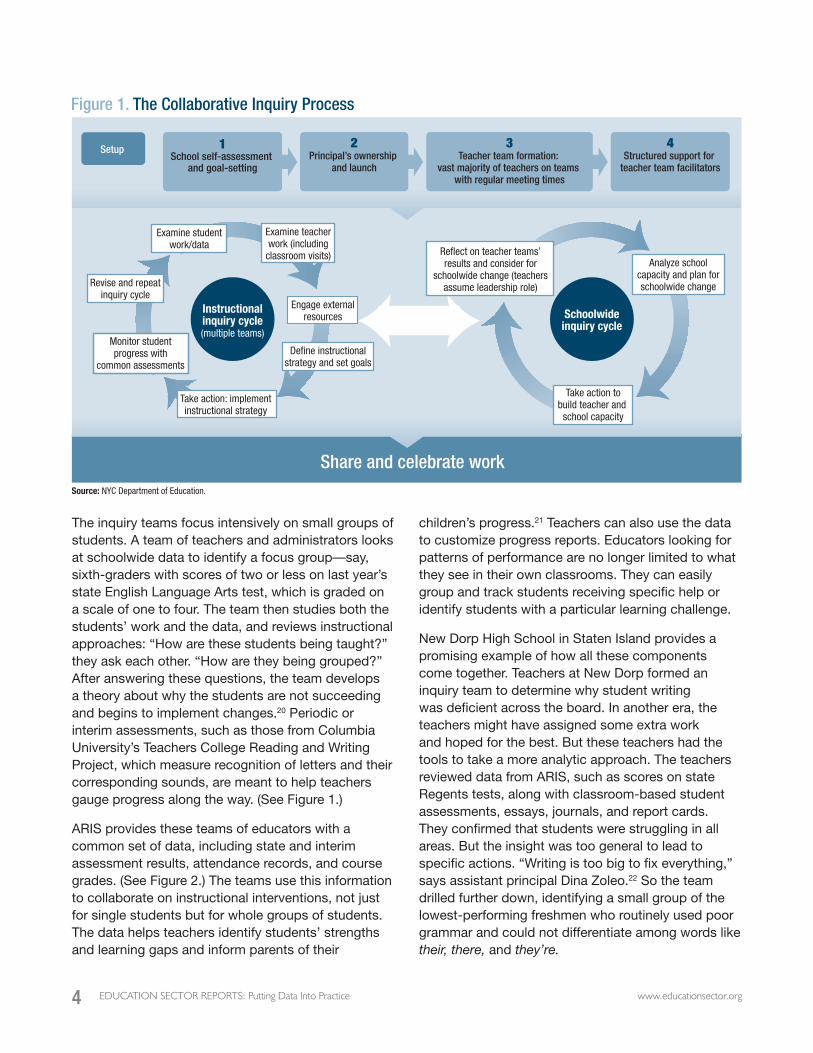
ARIS provides these teams of educators with a common set of data, including state and interim assessment results, attendance records, and course grades. (See Figure 2.) The teams use this information to collaborate on instructional interventions, not just for single students but for whole groups of students. The data helps teachers identify students’ strengths and learning gaps and inform parents of their
children’s progress.21 Teachers can also use the data to customize progress reports. Educators looking for patterns of performance are no longer limited to what they see in their own classrooms. They can easily group and track students receiving specific help or identify students with a particular learning challenge.
New Dorp High School in Staten Island provides a promising example of how all these components come together. Teachers at New Dorp formed an inquiry team to determine why student writing was deficient across the board. In another era, the teachers might have assigned some extra work and hoped for the best. But these teachers had the tools to take a more analytic approach. The teachers reviewed data from ARIS, such as scores on state Regents tests, along with classroom-based student assessments, essays, journals, and report cards. They confirmed that students were struggling in all areas. But the insight was too general to lead to specific actions. “Writing is too big to fix everything,” says assistant principal Dina Zoleo.22 So the team drilled further down, identifying a small group of the lowest-performing freshmen who routinely used poor grammar and could not differentiate among words like their, there, and they’re.
Figure 1. The Collaborative Inquiry Process
Source: NYC Department of Education.
1School self-assessment
and goal-setting
Setup 2Principal’s ownership
and launch
3Teacher team formation:
vast majority of teachers on teams with regular meeting times
4Structured support for
teacher team facilitators
Examine studentwork/data
Examine teacherwork (including
classroom visits)
Instructionalinquiry cycle(multiple teams)
Schoolwideinquiry cycle
Engage externalresources
Define instructionalstrategy and set goals
Take action: implementinstructional strategy
Monitor studentprogress with
common assessments
Revise and repeatinquiry cycle
Share and celebrate work
Reflect on teacher teams’results and consider for
schoolwide change (teachersassume leadership role)
Analyze schoolcapacity and plan forschoolwide change
Take action tobuild teacher and school capacity
5EDUCATION SECTOR REPORTS: Putting Data Into Practicewww.educationsector.org
Figure 2. How the ARIS system works
ARIS home page:
Student detail screen:
Sample report:
Source: NYC Department of Education.
6 EDUCATION SECTOR REPORTS: Putting Data Into Practice www.educationsector.org
Significantly, the New Dorp team included teachers from all subject areas. They observed each other’s classes to see how, and whether, critical writing skills were being taught. And what they found was illuminating: They discovered that grammar was rarely addressed across the curriculum, and that even in English classes, learning literary terms, like the difference between a metaphor and a simile, occupied more instructional time than lessons in such matters as syntax, punctuation, and verb agreement. The school responded by injecting grammar across the curriculum, including it as part of the grade on assignments such as history essays. The students examined by the inquiry team were canaries in the school’s coal mine. “The theory is that if you can move those students,” Zoleo says, “then we can move groups of students overwhelmingly.”23
A Rocky StartAs encouraging as its efforts have been, New Dorp is the exception when it comes to using data to improve instruction. Elsewhere in the district, getting this sort of information into the right hands, let alone getting teachers to use it to improve learning, has been anything but easy.
From the beginning, ARIS has fallen short of the grandiose promises made about it—that it would transform instruction, that it would provide all of the information teachers need, that it would allow parents to get involved in their children’s educations as never before. And it has been bedeviled by countless delays.24 Designers had several systems to integrate, and whatever errors these systems held made their way into ARIS. The district also had to replace its initial vendor, IBM, with another contractor. The delays served to only further inflame existing political opposition to the accountability strategy of schools Chancellor Joel Klein. Citing budget cuts and layoffs, many teachers and parents felt the money could have been better spent elsewhere.
In ARIS’s first year and a half, the results were decidedly underwhelming. A February 2008 article in the New York Post called the project a “disaster” and noted that almost half the budget had already been spent.25 And in October 2008, the New York Times reported that the system was still largely inoperable.26
The technical challenges proved much greater than anticipated. None of the underlying data on students resides in a single database: Attendance data lives in one system, grades in another, and test scores in others. Replacing all of these systems would have been almost impossible and certainly unaffordable. So, rather than collect all this information on its own, ARIS was developed to “sit on top” of all these systems, requiring just a single user name and password for access. But the systems used by New York—and many other districts—were not designed for this purpose, and many come from competing vendors. Each required costly software upgrades to allow ARIS to understand its data.
A series of rapid fixes followed. Wireless Generation, an education technology company that served as a subcontractor to IBM on the project, took over the development of ARIS, and an improved version was launched in November 2008. A site that allows parents to track their child’s progress was launched the following May.27 Soon critics were changing their tune. In August 2009, a poll by the New York City Office of the Public Advocate reported that most of the principals surveyed supported ARIS, even if a large majority still challenged the costs.28 Antoinette Isable, a representative for the principals union, the Council of School Supervisors and Administrators, told the New York Times: “While we were skeptical in the beginning, we have come to understand much of [ARIS’s] long-term value and importance.”29
At first, the ARIS training program focused on teaching the teachers—principals included—how to use the tools. There was less emphasis on how and why to apply them. During the 2008–09 school year, each school selected at least two educators to be trained. The district also offered instruction for principals so they could build awareness and support for the tool. But officials soon learned that it wasn’t enough just to supply the data and schedule the training sessions. Just as important, says Emily Weiss, chief of staff for the Division of Performance and Accountability, the district also had to “build the demand for data.” And to do that, they had to make it relevant.
There are two important prerequisites to building demand for data, Weiss says. First, educators must understand what the data is and what it means—they must become “data and assessment literate”—before
7EDUCATION SECTOR REPORTS: Putting Data Into Practicewww.educationsector.org
they can understand how to use it for instruction. Second, the operational structure of the school must accommodate teacher collaboration based on data. That means teachers must be encouraged to share data and talk about what they think it means. “We need to move to conversations among educators,” says Weiss, “not just individual data analysis.”30
That sort of collaboration—“shared accountability across multiple educators for the same students,” Weiss calls it—represents a significant change in the closed-door culture of many schools. Historically, notes Suransky, teachers haven’t felt comfortable discussing student performance—regardless of whether those students were failing or succeeding. Yet, Suransky says, instruction dramatically improves when student learning is openly discussed. This kind of atmosphere also encourages teachers to leverage their individual strengths and leadership skills.31 “I can’t over-emphasize the inquiry teams,” says Klein. “Pointy-headed people in the central office can’t figure this all out … we want the teachers to come together.”32 Accordingly, the city’s Department of Education has shifted the emphasis of its data training from the technical—how to log in to ARIS, how to generate reports—to the practical, using data as a component of applied professional development. Significantly, Weiss says, the training now starts from a specific question that teachers want answered.
Information That MovesEach school has a different perspective on which data is important. And there is a torrent of potential information to be gathered and analyzed at the classroom level, from homework scores to behavioral incidents, which every school collects in its own way. As for ARIS data, teachers say that it can become quickly outdated, preventing them from acting in time to help students who are struggling. Teachers tell Anne LaTarte, director of instructional and data tools for the city’s Education Department, that although ARIS gives them good information, “it doesn’t move frequently enough.” Since much of the data in ARIS is generated at the end of the academic year, it becomes less relevant as the following year goes on. And even though ARIS contains data from periodic assessments, the information doesn’t flow instantaneously across databases. If a test is given in
January, it may not load onto ARIS until February. So teachers have to go into separate databases to get the latest scores.33
Teachers also complain that ARIS is not as detailed as they would like it be. Properly designed assessments, for instance, can provide teachers with remarkably specific information about student performance; they can show how well a student seemed to grasp a math problem, for instance, or how fluently he was able to read certain letter pairings. Recently, the system was updated to allow educators to see not only overall student assessment scores, but also individual student performance on specific components of the state assessments.
But teachers, notes Carmina D’Angelo-Schiavi of P.S. 85 in Queens, “want to be able to see the whole child.” They want to understand their students in the context of their demographic makeup, their aptitudes in various subjects, and their prior learning history. And they want to be able to get all that information in one place. For instance, along with things like standardized test scores, D’Angelo-Schiavi would like simultaneous access to measures like Schools Attuned, an approach she uses to assess the learning strengths of her second-graders.34
Like the Schools Attuned material that D’Angelo-Schiavi finds so helpful, the most relevant data is that which is closely aligned with the teacher’s curriculum—quizzes, homework assignments, feedback on writing, and the like. But, because it varies so widely across classrooms, this micro-level data is usually not included in the accountability programs that states use to compare school performance. This is despite the fact that micro-level data is critical to improving day-to-day student performance, says Beverly Donohue, vice president of policy and research at New Visions for Public Schools, a school support organization responsible for working with 76 of the district’s public schools. The issue, Donohue says, “is not accountability versus micro-level student data.”35 Both types of data are valuable, but serve different purposes.
Suransky agrees, saying that the biggest drawback to ARIS is its inability to provide data on these frequent, classroom-based assessments. The city’s Education Department is responding with ARIS Local, an initiative that allows individual schools and teachers
8 EDUCATION SECTOR REPORTS: Putting Data Into Practice www.educationsector.org
between scores on classroom history tests and scores on state tests in history. The pilot of ARIS Local will also incorporate assessment data from open-ended, essay-type assignments.
The frequent, front-line use of data by educators is critical not only to improving student learning, it’s also essential to preventing and correcting the errors that plague so many data initiatives. In traditional
to add their own data points, such as classroom test scores, to ARIS so they can compare it to other demographic and standardized test data. This specific data won’t necessarily be comparable across schools, but the collection and reporting of it will be in a consistent format. LaTarte would also like to see data displayed in a way that would allow teachers to make comparisons they couldn’t before, such as
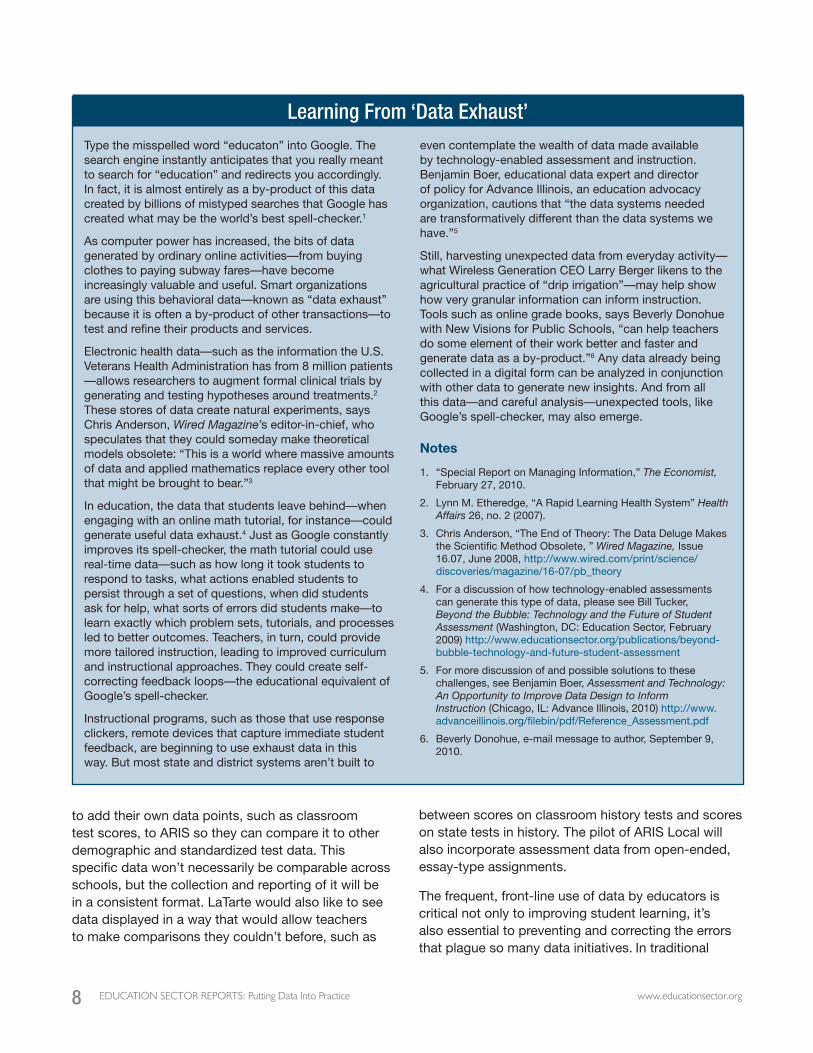
Learning From ‘Data Exhaust’ Type the misspelled word “educaton” into Google. The search engine instantly anticipates that you really meant to search for “education” and redirects you accordingly. In fact, it is almost entirely as a by-product of this data created by billions of mistyped searches that Google has created what may be the world’s best spell-checker.1
As computer power has increased, the bits of data generated by ordinary online activities—from buying clothes to paying subway fares—have become increasingly valuable and useful. Smart organizations are using this behavioral data—known as “data exhaust” because it is often a by-product of other transactions—to test and refine their products and services.
Electronic health data—such as the information the U.S. Veterans Health Administration has from 8 million patients —allows researchers to augment formal clinical trials by generating and testing hypotheses around treatments.2 These stores of data create natural experiments, says Chris Anderson, Wired Magazine’s editor-in-chief, who speculates that they could someday make theoretical models obsolete: “This is a world where massive amounts of data and applied mathematics replace every other tool that might be brought to bear.”3
In education, the data that students leave behind—when engaging with an online math tutorial, for instance—could generate useful data exhaust.4 Just as Google constantly improves its spell-checker, the math tutorial could use real-time data—such as how long it took students to respond to tasks, what actions enabled students to persist through a set of questions, when did students ask for help, what sorts of errors did students make—to learn exactly which problem sets, tutorials, and processes led to better outcomes. Teachers, in turn, could provide more tailored instruction, leading to improved curriculum and instructional approaches. They could create self-correcting feedback loops—the educational equivalent of Google’s spell-checker.
Instructional programs, such as those that use response clickers, remote devices that capture immediate student feedback, are beginning to use exhaust data in this way. But most state and district systems aren’t built to
even contemplate the wealth of data made available by technology-enabled assessment and instruction. Benjamin Boer, educational data expert and director of policy for Advance Illinois, an education advocacy organization, cautions that “the data systems needed are transformatively different than the data systems we have.”5
Still, harvesting unexpected data from everyday activity—what Wireless Generation CEO Larry Berger likens to the agricultural practice of “drip irrigation”—may help show how very granular information can inform instruction. Tools such as online grade books, says Beverly Donohue with New Visions for Public Schools, “can help teachers do some element of their work better and faster and generate data as a by-product.”6 Any data already being collected in a digital form can be analyzed in conjunction with other data to generate new insights. And from all this data—and careful analysis—unexpected tools, like Google’s spell-checker, may also emerge.
Notes
1. “Special Report on Managing Information,” The Economist, February 27, 2010.
2. Lynn M. Etheredge, “A Rapid Learning Health System” Health Affairs 26, no. 2 (2007).
3. Chris Anderson, “The End of Theory: The Data Deluge Makes the Scientific Method Obsolete, ” Wired Magazine, Issue 16.07, June 2008, http://www.wired.com/print/science/discoveries/magazine/16-07/pb_theory
4. For a discussion of how technology-enabled assessments can generate this type of data, please see Bill Tucker, Beyond the Bubble: Technology and the Future of Student Assessment (Washington, DC: Education Sector, February 2009) http://www.educationsector.org/publications/beyond-bubble-technology-and-future-student-assessment
5. For more discussion of and possible solutions to these challenges, see Benjamin Boer, Assessment and Technology: An Opportunity to Improve Data Design to Inform Instruction (Chicago, IL: Advance Illinois, 2010) http://www.advanceillinois.org/filebin/pdf/Reference_Assessment.pdf
6. Beverly Donohue, e-mail message to author, September 9, 2010.

9EDUCATION SECTOR REPORTS: Putting Data Into Practicewww.educationsector.org
compliance-oriented systems, in which data is collected, locked in a warehouse, and spit out without review, errors can easily creep in. By contrast, if the people closest to the data—students, parents, and teachers—are actually using the data, they will consistently update it and improve its accuracy, essentially creating a continuous process of checks and balances.
One barrier to getting the detailed information that teachers want is purely practical: the time and effort it takes to collect all of the information. Although new digital instructional tools, such as interactive math programs or simulated biology dissections, have the potential to make data entry automatic, many teachers still have to enter data tediously by hand. Developers of classroom tools have noticed. Larry Berger, CEO of Wireless Generation, considers saving teachers time to be a crucial element of any successful data product. To be effective, he says, a tool “needs to give teachers back more time in one month than it takes to train [them] to use it.” For example, digital tools can capture important data on a student’s use of grammar, providing instant feedback that gives the student more time to practice writing and the teacher more time for thoughtful feedback. Once educators overcome the challenge of digitizing information, Berger says, they often embrace the data tools.
New York’s School of One, a pilot sixth-grade math program that calibrates instruction to a students’ progress, offers one glimpse into this digital future. The school’s ambitious goal is to create an adaptable, minute-by-minute learning experience, challenging students just enough to keep them engaged and moving at the right pace. Each night, based on the results of that day’s lessons and diagnostic tests, a computer algorithm automatically creates a detailed lesson plan for the next day. If students fall short in grasping a certain concept, for example, the algorithm will devote more time to that goal. If students learn better using some methods as opposed to others, it adjusts accordingly. The lesson plan is e-mailed to teachers, who revise it as necessary.36 Early results are promising: An evaluation of the 2009 pilot by the Education Development Center’s Center for Children and Technology found that students gained 28 percentage points from pre-test to post-test. Perhaps more promising, 79 percent of students said they liked
going to school, and 75 percent of teachers thought it could transform the way that instruction in New York is tailored to individual students.37 (See Learning From ‘Data Exhaust’ on page 8.)
Beyond SchoolsIncreasingly, data is not just a tool for principals and teachers. It can empower students and families, as well. While Stephanie Ring intervenes with students who have drifted off course, her school also engages
students and their families to chart a new path on their own. Using a personalized College Readiness Tracker, a sort of GPS for on-time graduation developed by New Visions for Public Schools, these students can see exactly where they are—what classes and state Regents courses they have passed—and where they need to go. (See Figure 3.) This sort of predictive data is powerful because it allows students, and their families, to understand how their current actions affect their future goals. It’s also continuous and immediate, as with a GPS system that constantly monitors progress, anticipates traffic patterns based on historical data, and alerts a driver instantly after a missed turn—not 50 miles later. With the help of these tools, family engagement changes from a one-time, end-of-year event to an ongoing, substantive conversation.38
As do teachers, parents need to be convinced that time with data is time well spent—that they will gain enough to be able to really help their children. ARIS’s Parent Link, which provides parents with information about their children’s achievement, offers instructions in nine languages. (See Figure 4.) But, again, just
The frequent, front-line use of data by educators is critical not only to improving student learning, it’s also essential to
preventing and correcting the errors that plague so many
data initiatives.

10 EDUCATION SECTOR REPORTS: Putting Data Into Practice www.educationsector.org
providing access is not enough; educators have to encourage parents to use it. At P.S. 85, Principal Ann Gordon-Chang makes an extra effort to ensure that parents know about and understand how to use the portal. She staffs the school’s computer lab with multilingual teachers outside of school hours for special parent workshops. She provides food and opens the school on Saturdays. Already, says Gordon-Chang, parents appreciate that the data gives them a more complete and objective picture of their children than do teacher perceptions alone.39
Parent Link employed more strategies in a pilot effort to boost use by low-income families in 24 schools. Successful strategies include using parent and student volunteers; in one school, students train their parents and have them sign notes confirming they have logged in to Parent Link. Teachers have been trained in how to talk about data with parents. Another school opened its library early for ARIS workshops, and at another, a parent coordinator e-mailed parents who had not logged in.40 One school, located across from a homeless shelter, even created a resource room with a washer, dryer, and Internet access.41
Parents, moreover, are not the only adults who work with children outside of school. Other counselors and mentors need access to information from schools, and vice versa. By analyzing student achievement data along with information about community programs (such as the influence of a mentoring program on school attendance) experts can better evaluate the effectiveness of those services and target them appropriately. Sharing information across school-home-community boundaries means establishing positive, trusting relationships—relationships that don’t always exist. It also requires overcoming privacy barriers, both real and imagined.
The federal Family Educational Rights and Privacy Act prevents schools and teachers from sharing personally identifiable information about students with anyone outside the institution except parents. Narrow interpretations of the law have led many schools to restrict any information sharing at all. But parents can consent to release information, and several communities have developed ways to integrate data across a variety of programs. For example, in Jefferson County (Louisville), Ky., school officials get up-front parental consent for students participating in after-school programs through KidTrax, a tracking
system that requires students to swipe magnetic cards when they enter, for example, a Boys and Girls Club. The school system can then add that information to its own data warehouse and provide data about student achievement to after-school educators.42
Just seven miles from the Department of Education headquarters, data plays a prominent role at the Harlem Children’s Zone (HCZ), the model for the Obama administration’s Promise Neighborhoods initiative. The organization’s goal is to ensure the academic success of 15,000 Harlem children by putting them in “an enriching environment of college-oriented peers and supportive adult staff.” It touts a “comprehensive, data-driven approach.”43 Indeed, HCZ chief operating officer George Khaldun tells his staff that “if it’s not in the database, it didn’t happen.”44 But HCZ staff doesn’t have access to ARIS, with its wealth of information about the very youth the organization is trying to help. Nor do public school educators have access to HCZ
Figure 3. College Readiness Tracker
Source: New Visions for Public Schools.

11EDUCATION SECTOR REPORTS: Putting Data Into Practicewww.educationsector.org
data on programs, interventions, and other student information.45
Sophie Lippincott, former director of knowledge sharing in the Division of Performance and Accountability, sees the clear value of sharing ARIS information with community-based organizations, and she has been trying to begin a program to do so. “It’s obviously in our favor to have partner organizations using ARIS,” she says. The district has trained two organizations that are “gung-ho . . . and ready to go,” she says. But, here again, organizational silos are proving difficult to break. The developers of ARIS did not contemplate out-of-school use; because user authentication is based on the Education Department’s human resources databases, it is difficult for non-school employees to gain access.46 (The district has recently developed a temporary solution that enables schools to grant access to certain community partners.) (See Using Data Across Children’s Lives, on page 12.)
An Iterative ApproachWhile it’s still too early to judge the ultimate impact of New York’s data initiatives, there are positive signs that they are taking hold among educators and parents. When inquiry teams were first introduced by the city’s Department of Education, they were a highly structured add-on to existing work; schools assembled a special team, gave members additional compensation, and devoted new resources to the enterprise. But, increasingly, in schools like New Dorp, using data is embedded into existing teaching teams. Sixty-five percent of New York City educators are now participating in collaborative inquiry, up from 10 percent in the program’s first year. School quality reviews, in which experienced educators conduct evaluations of school practices, also report significant growth in data use among city schools.47 On an April 2010 survey, 77 percent of principals rated ARIS as “helpful” or “very helpful” in improving student outcomes, up from 47 percent two years
Figure 4. Parent Link Website
Source: NYC Department of Education.

12 EDUCATION SECTOR REPORTS: Putting Data Into Practice www.educationsector.org
earlier.48 Educator and parent usage of ARIS and its components also continues to rise: A total of 62,000 unique users logged in to the ARIS educator tools from July 2009 to March 2010. As of August 2009, 340,000 different parent accounts had been accessed at least once, most often during parent/teacher conferences.49 Officials with the Education
Department caution that they lack valid comparisons to gauge whether these numbers are high or low. And they are just now rolling out analytical tools to track usage patterns to help them determine how and why educators and parents use ARIS.
But to what extent has the drive for data reached down to the students it intends to help? The evidence
Using Data Across Children’s Lives Students in New York City schools interact with a number of public agencies and participate in a variety of out-of-school activities. All are likely to influence academic achievement. Yet educational data systems are mostly blind to students’ lives outside the classroom. At the same time, public agencies and community groups know little about the academic situations of the youth they serve.
As the school district is doing with ARIS, the city is working to consolidate disparate bits of data to get a more complete view of the citizens it serves. The city wants to coordinate services across nine city agencies, including those dealing with public health, homelessness, and juvenile justice. On average, a single family is involved with five different agencies, says Linda Gibbs, deputy mayor for Health and Human Services, “but they didn’t know about each others’ presence in the household.”1 Social services data is not yet integrated into ARIS. Nor is ARIS data available to the social workers who use a new system known as HHS-Connect.
Because of these gaps, educators and community leaders lack data to help them understand how these systems interact and to help them make decisions and coordinate their work. It means they can’t take advantage of powerful tools to detect patterns or risk factors across interventions —patterns that might be impossible to discern from school data alone. This cross-agency information is particularly important to serving at-risk youth, such as children in foster care, who are most likely to use multiple public services.
But in New York and elsewhere, schools and social service agencies are slowly improving their capacity to share data toward useful ends. Some examples:
● In St. Louis, the main objectives of Big Brothers and Big Sisters of Eastern Missouri are to improve attendance, behavior, and classroom success (“ABC”). But the organization had little information about what actually happened in their mentees’ classrooms. So, after getting privacy waivers from parents, officials secured access to school data about students’ attendance, tardiness, behavior, and grades. Now youth workers and mentors can step in, working with
parents to improve attendance, for example, and checking up on homework assignments if they see students going off course. They can also recognize and praise student success.2
● In California, the Youth Data Archive, run by the John W. Gardner Center for Youth and Their Communities at Stanford University, uses data from schools and community organizations to research questions, such as the association between Boys and Girls Club attendance and the development of proficiency among English language learners.3
● Nationwide, Intelligence for Social Policy (ISP) promotes the development and use of integrated data systems. Now working with nine jurisdictions, ISP grew out of Philadelphia’s Kids Integrated Data System, which houses data that helped shape the city’s dropout prevention initiatives. Dennis Culhane, one of ISP’s two principal investigators, says that four of the ISP sites include some educational data and that “all wish they did.” Integrated data, he says, is especially important across developmental transitions. For instance, during early childhood, he says, the “baton gets dropped all the time.”4
Still, these examples are nascent. And, without careful attention to the design of data initiatives, the potential to coordinate actions across the variety of organizations and adults supporting youth learning will go unmet.
Notes
1. Zachary Tumin, “New York’s HHS-Connect: IT Crosses Boundaries in a Shared-Mission World,” posted on Governing.com, August 24, 2009, http://www.governing.com/blogs/bfc/New-Yorks-HHS-Connect-IT.html
2. Jesse Bogan, “Big Brothers Big Sisters Breaks New Ground by Monitoring Student Progress” Stltoday.com, August 4, 2010, http://www.stltoday.com/news/local/metro/article_6c2e5fc1-4686-5f23-ab4a-58b59a991665.html
3. For more information see: http://gardnercenter.stanford.edu/current_initiatives/youth_archive.html
4. Dennis Culhane, in discussion with author, August 3, 2010; For more information on Intelligence for Social Policy see www.isppenn.org

13EDUCATION SECTOR REPORTS: Putting Data Into Practicewww.educationsector.org
to date suggests it has far to go. As LaTarte notes, the ultimate goal of data analysis is not just to identify gaps in knowledge so that instructors can re-teach. It is to help teachers understand why a student didn’t get something in the first place. LaTarte says that although teachers are getting steadily better at analyzing data, data analysis “is not yet leading to fundamental change in teacher practice or decision-making.” Both “educator capacity and the system itself,” she says, lack the means so far to transform learning.50
An initial Teachers College study on the implementation of inquiry teams echoed LaTarte’s conclusion, noting that while the teams were successful in using data to identify student needs, they were less skilled in developing strategies to address those needs.51 Knowing where a student stands is just the beginning; teachers also need things like instructional materials and guidance from peers to act on that information. And, ideally, those resources and interventions are connected to the issues identified in the data so that they are specifically relevant.
Likewise, among New York educators, tools that once seemed powerful are quickly becoming outdated as teachers seek to solve challenges that they didn’t even recognize before. At New Visions, Susan Fairchild, director of data analysis and applied research, is creating tools to help educators become what she calls “learning scientists.” She says that the next generation of early warning indicators to be used by Stephanie Ring and her colleagues will combine multiple types of data into tools that will not only identify at-risk students more quickly, but will also do so in finer detail. For example, just as the Department of Veterans Affairs has learned to identify risk factors for kidney disease even in the absence of visible symptoms, data may reveal heretofore unknown combinations of indicators that signal future problems for freshman who otherwise appear on track.
Reflecting on ARIS’s development, Suransky says that one of the biggest lessons has been the need to design technology tools in an iterative fashion, rather than all at once. He says he wishes that the school district had worked more closely with educators in the field. He also advises other districts to create prototypes of a number of tools, testing each with teachers and principals before taking them into full-scale development.
In the future, New York will work to transform ARIS from a large, centrally controlled system to one that provides core data with a flexible platform that others can build on—“more like an iPhone than a single application,” Suransky says.52
One such platform is already under way. This year, New Visions is launching the Datacation platform across its network of 76 schools. Customized to feature an automated version of the New Visions data tools, including the College Readiness Tracker, the platform will allow high schools to visualize, with charts, graphs, and animation, data extracted
from the same databases that ARIS draws on. And an online grade book will combine teachers’ daily data with information about state tests and credit accumulation information, allowing for combined analysis.53
Extraordinary PersistenceThe challenge for designers of data systems is no longer entirely technical; new tools for collecting, storing, sharing, and analyzing massive amounts of information are readily available. And while the initial investments in data capabilities, such as the states’ development of unique student and teacher identifiers, have been essential, the next phase—generating truly useful data at the student level—will not happen without a learner-centered approach. And that approach must be deeply embedded into the work flow of, incentives for, and actual day-to-day practices of educators.
The most successful data initiatives—especially those seeking to transform complex and costly industries—require extraordinary persistence and a deep commitment of resources over time.54 Data is most powerful when it’s used not just to automate systems,
Sixty-five percent of New York City educators are now participating in collaborative inquiry, up from 10 percent in
the program’s first year.

14 EDUCATION SECTOR REPORTS: Putting Data Into Practice www.educationsector.org
but to provide a catalyst for transforming how those systems work. Research shows that even in the most sophisticated companies and organizations, the effective use of data is an iterative process—a continuous cycle of use and discovery. But the research also shows that once people start using data effectively, they become more sophisticated; they demand data that is increasingly timely, relevant, and specific.55
School districts and state governments have made the difficult decisions to build institutional data systems, they have committed the financial resources, and they are working out the technical bugs. Now comes the hard part—using better information about teaching and learning to boost outcomes for every student.
Recommendations: Design Principles for Smarter Data SystemsThe country is now entering the second phase of a costly and concerted push to use data to improve educational outcomes. The challenge is no longer whether to build institutional data systems, but how to use the data that the best of these systems provide to make a difference in the classroom. Thus, a focus on actual educator use of data must drive the next decade of investment. And, considered in this regard, as an essential ingredient of good teaching, the nation’s investments in data appear to be seriously lacking. Five principles should inform these initiatives:
1. Systems must change from being institution-centered to learner-centeredDesigning learner-centered systems means moving from compliance-focused data, such as that required by federal programs, toward information that students, families, and teachers can actually employ to shape day-to-day instruction. Like a GPS navigation system, learner-centered systems would track individual student progress and guide the way toward a learning goal. These systems should combine hard data—both timely and accurate—with
qualitative information to give a full picture of learning and performance throughout a student’s academic career.
2. Information must flow across institutionsStudents are increasingly mobile, and not just across schools, districts, and states. They also span a number of different learning opportunities both during and after the school day. But a teacher can’t use information about a transfer student when it’s trapped in another district’s data system. A learner-centered system would operate across institutions; it would integrate important information from a wide variety of schools, programs, and interventions into a complete and accurate depiction of a student’s progress. It would allow all adults who work with students to better communicate with each other and to understand more about the students. And it would enable schools, districts, states, and the federal government to improve the accuracy, timeliness, and efficacy of data-gathering. Internet-based platforms that enable this seamless exchange of information—rather than costly projects to integrate systems on an ad hoc basis—are critical to learner-centered approaches.
3. Usefulness and usability must drive adoptionTo be successful, data initiatives must have an impact on the working relationships, incentives, and day-to-day practices of educators, without forcing them into uniform or standardized solutions. And unless systems are designed to be of obvious value to these educators—to give them insights into students—then their use will be limited. Data tools shouldn’t require extensive training or public relations campaigns to
Data is most powerful when it’s used not just to automate
systems, but to provide a catalyst for transforming how
those systems work.

15EDUCATION SECTOR REPORTS: Putting Data Into Practicewww.educationsector.org
convince educators of their value; they should be so intuitive and easy to use that educators will take advantage of them as a matter of course. Frequent usage also ensures accuracy, leading to better decision-making across the board.
4. Systems must be common, yet openData initiatives in the health field, such as the use of electronic medical records to improve care, provide the education business with an important lesson: Good governance is essential to ensure that common policies, technical standards, privacy protections, and usage protocols across institutions are enacted and monitored. This facilitates use and allows educators to easily exchange information. But that does not mean they should be monolithic. Such systems are neither effective nor easily adopted. Rather, districts, schools, and other programs must be able to tailor systems for their particular needs. “Smart” phones are examples of this sort of customization. They adhere to recognized protocols so they can operate across common networks, but the software accommodates countless unique applications, or “apps,” with which users can expand use of the device. State longitudinal data systems, which now exist separately from district systems, could be designed in a similar way; they could provide the core data for every district, but let districts tailor the information or go beyond the core as they choose.
5. The data must fit the goalThe best data allows users to not only assess performance—of students, educators, or administrations—but also to understand the processes that could improve learning. Its message should be not just “You’re failing.” It should be “Here’s where you are. Here’s where you need to go. And here are the suggested actions for getting you there.” High quality data can empower students, while teaching educators and institutions much about their practice. The most successful performance management initiatives—those that actually change practice and get results—will engage educators, reward use, and put student success and responsibility at the center.
Notes1. Maya T. Prabhu, “Forum Calls for Better Use of Data in
Education,” eSchoolNews 12, no. 4 (April 2009): 14, http://www.eschoolnews.com/media/eschoolnews/eSchoolNewsApril09.pdf
2. Author estimate based on federal and state expenditures.
3. 2009 Data Quality Campaign Annual Progress Report, November 2009, http://www.dataqualitycampaign.org/files/DQC_11-19.pdf
4. U.S. Department of Education, “Implementing Data-Informed Decision Making in Schools — Teacher Access, Supports, and Use,” 2009, http://www.gesci.org/assets/files/Knowledge%20Centre/Implementing%20Data%20Informed%20Decision%20Making%20in%20Schools-Teacher%20Access,%20Supports%20and%20Use.doc
5. For research on promising use and success factors, please see Mary Ann Lachat and Stephen Smith, “Practices That Support Data Use in Urban High Schools,” Journal of Education for Students Placed at Risk 10. no. 3 (2005): 333–349; and Jeffrey C. Wayman and Sam Stringfield, “Technology-Supported Involvement of Entire Faculties in Examination of Student Data for Instructional Improvement,” American Journal of Education 112 (August 2006).
6. For more information on New York’s Children First strategy, please see the New York City Department of Education website, 05/14/2010, http://schools.nyc.gov/Accountability/resources/childrenfirst/default.htm (May 14, 2010).
7. Shael Suransky, in discussion with author, July 9, 2010.
8. Ian Ayres, Super Crunchers: Why Thinking-by-Numbers Is the New Way to Be Smart (New York: Bantam, 2007).
9. Joel Kupersmith, Joseph Francis, Eve Kerr, Sarah Krein, Leonard Pogach, Robert M. Kolodner, and Jonathan B. Perlin, “Advancing Evidence-Based Care for Diabetes: Lessons From the Veterans Health Administration,” Health Affairs 26, no. 2 (2007): w156–w168, (published online January 26, 2007).
10. Valerie M. Crawford, Mark S. Schlager, William R. Penuel, and Yukie Toyama, “Supporting the Art of Teaching in a Data-Rich, High-Performance Learning Environment” in Linking Data and Learning, E. B. Mandinach and M. Honey, eds. (New York: Teachers College Press, in press) http://ctl.sri.com/publications/downloads/Crawford_etal_TechSupportArtTeaching.pdf
11. Thomas D. Snyder, ed., 120 Years of American Education: A Statistical Portrait (Washington, DC: National Center for Education Statistics, 1993) http://nces.ed.gov/pubs93/93442.pdf
12. Chrys Dougherty, A Policymaker’s Guide to the Value of Longitudinal Student Data (Denver, CO: Education Commission of the States, September 2002) http://www.dataqualitycampaign.org/files/Publications-Policymakers_Guide_to_Longitudinal_Student_Data_090102.pdf
13. See the Data Quality Campaign for annual reports on state data capabilities, www.dataqualitycampaign.org
14. TEA Data Collection, Analysis and Reporting Systems Investigation (TDCARSI) Issues and Recommendations (Austin,

16 EDUCATION SECTOR REPORTS: Putting Data Into Practice www.educationsector.org
TX: Texas Education Agency, January 27, 2009) http://ritter.tea.state.tx.us/tea/IBM_TDCARSI_Recommendation.pdf
15. Larry Berger, in discussion with author, Feb. 23, 2009.
16. For additional background information on different types of data for different types of uses, please see Glynn D. Ligon, Why Eva Baker Doesn’t Seem to Understand Accountability (Austin, TX: ESP Solutions Group, 2007) http://www.espsolutionsgroup.com/espweb/library.html
17. Valerie M. Crawford, Mark S. Schlager, William R. Penuel, and Yukie Toyama, “Supporting the Art of Teaching in a Data-Rich, High-Performance Learning Environment” in Linking Data and Learning.
18. “Stimulating Health Information Technology,” event sponsored by Health Affairs on March 10 2009, in Washington, D.C.
19. Shael Suransky, in discussion with author, July 9, 2010.
20. Marian Robinson, Patricia Kannapel, Joan Gujarati, Hakim Williams, and Andrea Oettinger, A Formative Study of the Implementation of the Inquiry Team Process in New York City Public Schools: 2007–08 Findings (New York: Consortium for Policy Research in Education, Teachers College, Columbia University, September 2008); Shael Suransky, in discussion with author, July 9, 2010.
21. Shael Suransky, in discussion with author, July 9, 2010,
22. “Teacher Team Inquiry: Sustaining Instructional Improvement at New Dorp High School,” Case Study, New York City Department of Education, Staten Island, NY, http://slcp.ed.gov/success-stories/teacher-team-inquiry-sustaining-instructional-improvement-at-new-dorp/ (accessed July 9, 2010).
23. Ibid.
24. ARIS was announced to much hoopla in March 2007. Schools Chancellor Joel Klein said it would “enable educators to tailor instruction to their students’ needs, and parents will able to get involved in their children’s educations like never before.” The district said that parents would get ARIS-generated reports on performance beginning that fall, and would have online access to the system next year. See Mary Hayes Weier, “Can an $80 Million IBM Deal Save New York City’s Schools?” Information Week, March 6, 2007, http://www.informationweek.com/news/infrastructure/management/showArticle.jhtml?articleID=197800547
25. Yoav Gonen, “Schools Computer an $80M ‘Disaster,’” NY Post, February 27, 2008, http://www.nypost.com/p/news/regional/item_GskUYOLHM49DrQElopcvfL;jsessionid=9500F75B516E639299DA229AC46BA888
26. Elissa Gootman, “As Schools Face Cuts, Delays on Data System Bring More Frustration,” New York Times, October 23, 2008, http://www.nytimes.com/2008/10/24/education/24aris.html?pagewanted=1&_r=1&emc=eta1; see also Elizabeth Green, “High Hopes for New ARIS Data Warehouse After Stumbles,” GothamSchools, October 24, 2008, http://gothamschools.org/2008/10/24/high-hopes-for-new-aris-data-warehouse-after-stumbles/; Elizabeth Green, “New Visions Tells Principals It ‘Overstated’ Problems With ARIS,” GothamSchools, Dec. 11, 2008, http://gothamschools.org/2008/12/11/new-visions-tells-principals-it-overstated-problems-with-aris/
27. See GothamSchools for a series of articles about ARIS: http://gothamschools.org/tag/aris/
28. Philissa Cramer, “Principals Are Optimistic About ARIS But Kinks Continue,” GothamSchools, August 29, 2009, http://gothamschools.org/2009/08/20/principals-are-optimistic-about-aris-but-kinks-continue/
29. Javier C. Hernandez, “Data System is Now Supported by Most Principals, Survey Says,” New York Times, August 20, 2009.
30. Emily Weiss, in discussion with author, April 26, 2010.
31. Shael Suransky, in discussion with author, July 9, 2010. For further discussion of the importance of safe collaboration space, see also “Teacher Team Inquiry: Sustaining Instructional Improvement at New Dorp High School.”
32. “Technology That Spurs Data-Driven Achievement,” panel discussion at Education Week Data Event, April 19, 2010.
33. Anne LaTarte, in discussion with author, April 26, 2010.
34. Carmina D’Angelo-Schiavi, in discussion with research assistant Catherine Cullen, March 5, 2009. For more information on Schools Attuned, see http://www.allkindsofminds.org/
35. Susan Fairchild and Beverly Donohue, in discussion with author, June 28, 2010.
36. Ta-Nehisi Coates, “The Littlest Schoolhouse,” The Atlantic, July/August 2010, http://www.theatlantic.com/magazine/archive/2010/07/the-littlest-schoolhouse/8132/1/
37. School of One Brochure, New York City Department of Education, http://schools.nyc.gov/NR/rdonlyres/9435AD08-90F3-42AA-838C-6372C3B5D2E6/0/SchoolofOneBrochure_FINAL.pdf (accessed July 16, 2010).
38. Barbara Taveras, Caissa Douwes, Karen Johnson, with Diana Lee and Margaret Caspe, New Visions for Public Schools: Using Data to Engage Families, (Cambridge, MA: Harvard Family Research Project, May 2010), http://www.hfrp.org/family-involvement/publications-resources/new-visions-for-public-schools-using-data-to-engage-families
39. Ann Gordon-Chang, in discussion with Catherine Cullen, March 5, 2009.
40. Heather Weiss, founder and director of the Harvard Family Research Project, guest post on The Quick and the Ed blog, http://www.quickanded.com/2010/03/five-big-ideas-for-data-rigor-without-mortis.html
41. Jennifer Saltzstein, program director, ARIS Parent Link, Webinar presentation, Data Driven: Making Student and School Data Accessible and Meaningful to Families, August 10, 2010, http://www.hfrp.org/publications-resources/browse-our-publications/webinar-brief-data-driven-making-student-and-school-data-accessible-and-meaningful-to-families
42. Marty Bell, Jefferson County Schools, in discussion with Catherine Cullen, March 2009
43. From Harlem Children’s Zone website, http://www.hcz.org/about-us/the-hcz-project (accessed May 24.2010).
44. George Khaldun, in discussion with author, March 6, 2009.

17EDUCATION SECTOR REPORTS: Putting Data Into Practicewww.educationsector.org
45. While ARIS is available to all New York City district public schools, it’s not available to charter schools, such as those operated by the Harlem Children’s Zone.
46. Sophie Lippencott, in discussion with author, May 5, 2010.
47. Shael Suransky, in discussion with author, July 9, 2010.
48. See Principal Satisfaction Survey, New York City Department of Education, April 2010, page 31, http://schools.nyc.gov/NR/rdonlyres/CD79D1EC-9B48-47B8-96F9-C2BC1AC0A4C9/0/PrincipalSurvey_SPRING2010_FINAL.PDF
49. Tools for better data on the frequency of use are currently under development, see Jennifer Saltzstein, Webinar presentation, Data Driven: Making Student and School Data Accessible and Meaningful to Families, August 10, 2010.
50. Anne LaTarte, in discussion with author, May 26, 2010.
51. Formative Study of the Implementation of the Inquiry Team Process in New York City Public Schools, http://www.cpre.org/index.php?option=com_content&task=view&id=258&Itemid=76
52. Shael Suransky, in discussion with author, July 9, 2010.
53. Additional New York City schools are also experimenting with homegrown data systems. See Anna Phillips, “Frustrated With City’s Data System, Teachers Build Their Own,” GothamSchools, September 15, 2010, http://gothamschools.org/2010/09/15/frustrated-with-citys-data-system-teachers-build-their-own/
54. For example, health provider Kaiser Permanente proved that better use of electronic medical data could significantly reduce costs and improve care. But change has been slow, expensive, and wrenching. According to BusinessWeek, Kaiser has spent $4 billion on the data effort and “encountered disgruntled doctors, system outages, and a temporary decrease in productivity as physicians get accustomed to the new system.” See Rachael King, “How Kaiser Went Paperless,” BusinessWeek, April 7, 2009 and Anna-Lisa Silvestre, Valerie M. Sue, and Jill Y. Allen, “If You Build It, Will They Come? The Kaiser Permanente Model of Online Health Care,” Health Affairs, March/April 2009.
55. Thomas Davenport, Don Cohen, and Al Jacobson, “Competing on Analytics” Working Knowledge Research Report, (Babson Park, MA: Babson Executive Education, May 2005).


