Page 1
PUTTING ELECTRIC LOGISTICS VEHICLES TO WORK IN SHENZHENBackground Volume: Setting the Stage for Full Utilization of ELVs in Shenzhen
INFRASTRUCTUREPOLICYVEHICLE QUALITY
BUSINESS MODEL SUMMARYBACKGROUND
Page 2
ROCKY MOUNTAIN INSTITUTERocky Mountain Institute (RMI)—an independent nonprofit founded in 1982—transforms global
energy use to create a clean, prosperous, and secure low-carbon future. It engages businesses,
communities, institutions, and entrepreneurs to accelerate the adoption of market-based solutions
that cost-effectively shift from fossil fuels to efficiency and renewables. RMI has offices in Basalt
and Boulder, Colorado; New York City; Oakland, California; Washington, D.C.; and Beijing.
Page 3
AUTHORSQiyu Liu, Ross McLane, Dave Mullaney,
Zhe Wang
* Authors listed alphabetically. All authors
from Rocky Mountain Institute unless
otherwise noted.
CONTACTSZhe Wang [email protected]
Qiyu Liu [email protected]
Dave Mullaney [email protected]
Ross McLane [email protected]
SUGGESTED CITATIONZhe Wang, Qiyu Liu, Dave Mullaney, Ross
McLane. Putting Electric Logistics Vehicles
to Work in Shenzhen: Setting the Stage for
Full Utilization of EVs in Shenzhen, Rocky
Mountain Institute, 2020.
All images from istock unless otherwise
noted.
MAJOR PARTNERS
Shenzhen Electric Vehicle
Operating Association
Shenzhen Electric Vehicle Operating
Association engages in six sectors
including public transportation, taxi,
logistics, rental, charging, and technical
services and establishes communication
platforms for government and enterprises,
organizes industrial investigations and key
discussions, develops industrial standards
and specifications, and participates
in policymaking. It strengthens the
integration and cooperation between
upstream and downstream players of
the new energy vehicle industry chain,
and promotes the healthy and orderly
development of the new energy vehicle
operation industry in Shenzhen.
National Engineering Laboratory for
Electric Vehicles
Authorized by the National Development
and Reform Commission in 2008, the
National Engineering Laboratory for
Electric Vehicles was established on the
basis of the Electric Vehicle Engineering
Technology Center of Beijing Institute of
Technology. The National Testing and
Management Platform for New Energy
Vehicles built by the Laboratory provides
data support for the research of new
energy vehicles technology and the
making of industrial policies.
AUTHORSRS
Page 4
BACKGROUND VOLUME: SETTING THE STAGE FOR FULL UTILIZATION OF EVS IN SHENZHEN | 3
The authors thank the following individuals/organizations for offering support on this work.
DST Vehicle Rental (Shenzhen) Co., Ltd.
Innovation Center for New Energy and
Smart Internet Vehicles of Shenzhen
JD Logistics
Xuehong Ji, North China University of
Technology
Cheng Li, China Academy of
Transportation Sciences
Dong Ma, Vehicle Emission Control
Center of Ministry of Ecology and
Environment
Potevio New Energy (Shenzhen) Co., Ltd.
Mengqing Shen, Research Institute of
Highway, Ministry of Transport
SF Express
Shenzhen Car Energy Net Service Co.,
Ltd.
Shenzhen China Electric Green Energy
Battery EV Operating Co., Ltd.
Shenzhen Pengdian Yueneng Energy
Technology Co., Ltd.
Shenzhen Shuimu Huacheng Electric
Transportation Co., Ltd.
Shenzhen TGood New Energy Co., Ltd.
Shenzhen Xinneng Logistics Co., Ltd.
Zhanhui Yao, China Automotive
Technology & Research Center
Special thanks to Energy Foundation
China for funding this series of reports.
ACKNOWLEDGMENTS
Page 5
BACKGROUND VOLUME: SETTING THE STAGE FOR FULL UTILIZATION OF EVS IN SHENZHEN | 3
EXECUTIVE SUMMARY .............................................................................................. 4
INTRODUCTION .............................................................................................................7The Urgency of Promoting ELV Adoption ........................................................................7The Importance of ELV Utilization ..................................................................................10Driving Factors of ELV Utilization .................................................................................... 11
SHENZHEN ELV MARKET INTRODUCTION ...................................................... 14Overview of the ELV Fleet and Charging Infrastructure in Shenzhen .............................. 14Vehicle Use Cases and Business Models ...................................................................... 14
POLICY OVERVIEW .....................................................................................................16Purchasing Subsidy .......................................................................................................16Road Privileges .............................................................................................................16Charging Station Establishment ..................................................................................... 17Electricity and Parking Costs for Charging ..................................................................... 17Operational Subsidy ......................................................................................................18
ELV UTILIZATION IN SHENZHEN ......................................................................... 20Introduction to Data Sources for this Analysis .............................................................. 20Comparative Analysis of Annual Operating Days ...........................................................21Comparative Analysis of Daily Operational Hours .........................................................25Comparative Analysis of Daily Driving Distance ............................................................26
CONCLUSIONS AND FURTHER RMI ANALYSIS .............................................29
ENDNOTES.....................................................................................................................31
TABLE OF CONTENTS
Page 6
4 | ROCKY MOUNTAIN INSTITUTE BACKGROUND VOLUME: SETTING THE STAGE FOR FULL UTILIZATION OF EVS IN SHENZHEN | 5
In recent years, China has placed significant emphasis on improving both
the environmental sustainability and operational efficiency of its logistics
industry. The government from the national to local level has sought to
promote logistics efficiency and sustainability through multiple pathways
including improved mode shares, enhancement of the operational
capabilities of logistics providers, and launching various green freight
demonstration projects.
Simultaneously, as electric vehicle technologies increasingly mature,
China’s electric vehicle (EV) industry has begun to evolve from being
highly policy dependent to a more sustainable state in which vehicle
and service quality are key business drivers. This combination of
technological development and policy resolve has led to rapid adoption
of electric logistics vehicles (ELVs), especially electric trucks and vans, in
Chinese cities.
This scaled adoption represents an inflection point in China’s long-
running efforts to reduce urban air pollution, energy use, and CO2
emissions. Furthermore, both EV production (including logistics vehicles)
and the deployment of supporting charging infrastructure have emerged
as key pillars to minimize the economic damage from the COVID-19
pandemic and to achieve high-quality, green economic development.
As the first city in China to vigorously promote the adoption of ELVs,
Shenzhen has deployed an innovative mix of strong government
support and competitive market mechanisms to achieve exceptional ELV
fleet growth, charging infrastructure deployment, and business model
development.
In order to support Shenzhen’s continued progress toward its goal of full
electrification of logistics vehicles and to heighten global awareness of
the city’s successes, Rocky Mountain Institute carried out an in-depth
analysis of Shenzhen’s ELV market in 2019. This resulted in the report
A New EV Horizon: Insights from Shenzhen’s Path to Global Leadership
in Electric Logistics Vehicles, which RMI published in June 2019. One
EXECUTIVE SUMMARY
Page 7
4 | ROCKY MOUNTAIN INSTITUTE BACKGROUND VOLUME: SETTING THE STAGE FOR FULL UTILIZATION OF EVS IN SHENZHEN | 5
EXECUTIVE SUMMARY
of the key goals of that report was to describe ELV driving patterns
and suggest measures such as policy modifications, infrastructure
enhancements, business model developments, and technology
innovations that would enable ELVs in Shenzhen to fully replace internal
combustion engine (ICE) vehicles.
Building on the foundation of A New EV Horizon, this body of research
uses a similar approach that combines data science with stakeholder
interviews to analyze the effects of four key factors (policy, infrastructure,
vehicle technology, and business models) on ELV utilization and
ELVs’ ability to fully replace ICE vehicles. Based on that analysis we
make recommendations on approaches to support accelerated ELV
replacement of ICE delivery vehicles in Shenzhen and globally. The
results of that analysis will be released as the following series of six
reports:
• Background Volume: Setting the Stage for Full Utilization of ELVs in
Shenzhen
• Policy Volume: Utilization Subsidies as a Lever to Accelerate the ELV
Market
• Infrastructure Volume: Enabling ELV Utilization through Well-Planned
Charger Deployment
• Vehicle Quality Volume: Identifying Pain Points in ELV Performance
That Reduce Utilization
• Business Model Volume: Improving Utilization of ELVs through
Innovations in Business and Ownership Models
• Summary Volume: Charting a Path to Fully Electrifying Goods and
Logistics Delivery
Page 8
6 | ROCKY MOUNTAIN INSTITUTE BACKGROUND VOLUME: SETTING THE STAGE FOR FULL UTILIZATION OF EVS IN SHENZHEN | 7
EXECUTIVE SUMMARY
As a background document, this report briefly introduces major policies
implemented in Shenzhen and progress achieved in the adoption and
use of ELVs in the city. We introduce the total cost of ownership (TCO) of
electric logistics vehicles and ICE vehicles, discuss the role of utilization
in driving future TCO superiority of ELVs, and explore current utilization
of ELVs in Shenzhen through analysis of vehicle telematics data.
We do this to set the stage for a deeper analysis of four key factors
affecting ELVs’ utilization: Shenzhen’s operational subsidy policy, the
suitability of charging infrastructure to ELV needs, vehicle failures and
maintenance downtime, and ownership models of ELVs (leasing versus
operator ownership). Subsequent reports in this series will focus on each
of those individual factors.
Page 9
6 | ROCKY MOUNTAIN INSTITUTE BACKGROUND VOLUME: SETTING THE STAGE FOR FULL UTILIZATION OF EVS IN SHENZHEN | 7
THE URGENCY OF PROMOTING ELV ADOPTION
As China’s economy has grown and evolved over the last 30 years, so
has its transportation sector, and that growth in scale and complexity
has been accompanied by a growth in energy use and CO2 emissions.
In 2017 the total energy consumption of China’s transportation sector
was 313 Mtoe and CO2 emissions were 889 million tons, accounting for
16% and 9.6% of the national total, respectively.1
While the scale of China’s 2017 transportation energy consumption
and emissions is substantial, considerable room for growth remains.
In 2015, for OECD countries, transportation accounted for 28% of CO2
emissions.2 Many analyses, including RMI’s Reinventing Fire: China
report, project that, if left unaddressed, China’s transport emissions
will converge to OECD levels as a share of emissions,3 resulting in 3.3
billion tons of CO2 emissions per year in 2030.
Due to the structure of the Chinese economy and its role in global
manufacturing and industry, freight transportation accounts for 60%
of the country’s total transport emissions,4 and is a major culprit in
its urban air quality problems. Furthermore, as China’s e-commerce
industry continues its rapid development and goods transport
continues to increase as a share of total urban transportation demand,
urban logistics will become an increasingly important driver of CO2
emissions, air pollution, and traffic congestion. Therefore, it is critical to
both improve the operational efficiency of the logistics sector and, at
the same time, reduce its emissions intensity.
As vehicle technologies and battery energy density have improved
substantially over the last decade, the electrification of logistics
vehicles has become an increasingly viable approach for cities to
achieve the complementary goals of reducing carbon emissions and
improving air quality. At present, minivans and light trucks are the
primary vehicles used in China for urban deliveries and are increasingly
being electrified.
INTRODUCTION
Page 10
8 | ROCKY MOUNTAIN INSTITUTE BACKGROUND VOLUME: SETTING THE STAGE FOR FULL UTILIZATION OF EVS IN SHENZHEN | 9
0.30
0.15
0.00
kg
Light Trucks Minivans
0.17 0.160.11
0.20
Exhibit 1
CO2 Emissions per km of ICE Vehicles and ELVs
ICE vehicles ELVs
Despite the relatively high carbon intensity of China’s electricity, due
to the substantial role that coal combustion plays in power generation,
electric minivans and light trucks can significantly improve the
emissions performance of urban freight delivery. Compared with ICE
vehicles of the same size, electric minivans and light trucks can reduce
unit carbon emissions by 15% and 30%, respectively (Exhibit 1).5
Shenzhen, a major technology hub on the Southeastern coast of China
and the home of some of China’s top EV manufacturers, is a global
leader in the deployment of electric vehicles, including ELVs. According
to Shenzhen Blue, the city’s sustainable development master plan, ELVs
in Shenzhen will account for 50% of the city’s total freight vehicles by
the end of 2020,6 decreasing annual particulate matter (PM) emissions
by 22 tons (Exhibit 2) and CO2 emissions by more than 500,000 tons
(Exhibit 3).7
INTRODUCTION
Page 11
8 | ROCKY MOUNTAIN INSTITUTE BACKGROUND VOLUME: SETTING THE STAGE FOR FULL UTILIZATION OF EVS IN SHENZHEN | 9
400
300
200
100
0
t
2020, 50% Electrified 2030, 100% Electrified 2050, 100% Electrified
(100% renewable grid)
102
185
309
083124
Exhibit 2
PM Emissions Reduction Potential of Logistics Vehicle Electrification
in Shenzheni
Without Electrification With Electrification
If Shenzhen continues to vigorously promote the electrification of
logistics vehicles and achieves 100% electrification by 2030, and a fully
decarbonized grid by 2050, its CO2 emissions would decline by about
6 million tons (Exhibit 3).8
i This analysis includes only vehicle tailpipe emissions and smokestack emissions from power plants, which may occur outside
of densely populated urban areas and therefore have lesser health impacts. It excludes other, more difficult to measure, sources
of PM such as road dust.
INTRODUCTION
Page 12
10 | ROCKY MOUNTAIN INSTITUTE BACKGROUND VOLUME: SETTING THE STAGE FOR FULL UTILIZATION OF EVS IN SHENZHEN | 11
700
600
500
400
300
200
100
0
10Kt
2020, 50% Electrified 2030, 100% Electrified 2050, 100% Electrified
(100% renewable grid)
204
382
631
0220255
Exhibit 3
CO2 Emissions Reduction Potential of Logistics Vehicle Electrification in
Shenzhen
Without Electrification With Electrification
THE IMPORTANCE OF ELV UTILIZATION
In this paper, we focus our analysis on the utilization of ELVs in Shenzhen,
outlining both challenges to ELV use and also supportive measures
being taken by both public and private sectors. A question that naturally
arises from any discussion of utilization, especially when vehicles are
being supported with public funds, is what the “right” level of utilization
is. After all, the purpose of subsidization is not the purchase of EVs, but
rather the retirement of ICE vehicles in favor of EVs. That is only possible
if EVs displace the use of ICE vehicles.
One way of defining the right level of utilization is to understand what
level produces TCO parity with ICE vehicles—and therefore supports
eventual market-led adoption without policy support. If policy can drive
utilization to that level, the need for further subsidization is obviated.
Under current price structures, ELVs’ lower operating expenses are able
to fully offset their higher upfront cost at a cumulative distance driven
INTRODUCTION
Page 13
10 | ROCKY MOUNTAIN INSTITUTE BACKGROUND VOLUME: SETTING THE STAGE FOR FULL UTILIZATION OF EVS IN SHENZHEN | 11
16
14
12
10
8
6
4
2
0
10,000 20,000 30,000 40,000 50,000 60,000 70,000 80,000 90,000 100,000
E-minivans break even at cumulitive driving
distance of 70,000 km
E-LDTs break even at cumulitive driving
distance of 90,000 km
Exhibit 4
Per km Cost Comparison between ICE Vehicles and ELVs
ICE LDT Electric LDT ICE Minivan Electric Minivan
RMB/km
Mileage (km)
of 70,000 km and 90,000 km for electric minivans and light trucks
respectively. That exceeds the actual average use of 40,000 km and
60,000 km, which means a financial loss to the ELV owners (Exhibit 4).
Given that utilization is core to the financial viability of ELVs as well as to
their ability to provide public benefits like clean air, utilization rate is a
crucial factor to evaluate the success of ELV deployment, and improving
that utilization rate has become a core focus of ELV promotion in
Shenzhen.
DRIVING FACTORS OF ELV UTILIZATION
The decision to use an ELV over a competitor ICE vehicle and the degree
to which it is utilized is driven by many factors. Those factors, and their
impact on purchase and use decisions, are:
INTRODUCTION
Page 14
12 | ROCKY MOUNTAIN INSTITUTE BACKGROUND VOLUME: SETTING THE STAGE FOR FULL UTILIZATION OF EVS IN SHENZHEN | 13
• Cost: The upfront cost premium of ELVs relative to ICE vehicles and
their ability to recoup upfront costs through ongoing savings. Currently,
lower operating costs favor the use of ELVs over ICE vehicles, but
problems in reliability and flexibility often outweigh those operating
cost advantages.
• Reliability: The ability to use ELVs with reasonable confidence in their
capacity to consistently service clients and generate revenue. The
reliability of ELVs has improved substantially over the last several years
in Shenzhen, but a gap relative to ICE vehicles remains.
• Flexibility: The ability to use ELVs in a variety of circumstances and
for a variety of tasks. Due to access restrictions that severely limit the
usability of ICE vehicles in the urban core, ELVs are the preferred choice
of operators for some types of urban logistics activities. However, low
vehicle range, high charging requirements, and the inability to safely
carry certain types of loads all limit the flexibility of ELVs in regional and
metropolitan applications.
• Safety: The ability to operate ELVs without specific risks to the operator
that do not exist in ICE vehicles (e.g., battery fires or weight-related
chassis failures). Similar to reliability, the safety record of ELVs has
improved but still falls short of ICE vehicles.
• User Comfort: The ability to provide a driver with a vehicle that maintains
comfort, employee morale, and retention. In the early stages of ELV
deployment, some models were regarded as low-quality vehicles that
gave a low-quality user experience. That problem has largely been
overcome. In many cases, ELV use is now actually preferred by drivers
due to less need to wait for urban entry and the absence of diesel tail
pipe fumes.
INTRODUCTION
Page 15
12 | ROCKY MOUNTAIN INSTITUTE BACKGROUND VOLUME: SETTING THE STAGE FOR FULL UTILIZATION OF EVS IN SHENZHEN | 13
As Shenzhen formulates its ongoing policy and infrastructure planning, it
seeks to ensure that all of the above decision drivers tilt in favor of ELVs
over ICE vehicles. It does this through multiple pathways. For example,
Shenzhen’s ELV promotion portfolio includes providing infrastructure to
enhance the ease of charging ELVs, a subsidy to reduce their cost, urban
entry permissions that enhance their ability to generate revenue, and
vehicle quality requirements that drive improved reliability and safety.
In the following sections, we introduce the ELV market in Shenzhen—
with a focus on utilization—and also the policy and infrastructure
framework that Shenzhen has devised to enable ELVs to fully replace ICE
vehicles on the road.
INTRODUCTION
Page 16
14 | ROCKY MOUNTAIN INSTITUTE BACKGROUND VOLUME: SETTING THE STAGE FOR FULL UTILIZATION OF EVS IN SHENZHEN | 15
To capture the potential carbon emissions reductions, air quality
improvement, and cost savings that ELVs offer, Shenzhen has
implemented a package of policies and infrastructure development
initiatives in the past five years to incentivize fleets to purchase and
use ELVs for urban deliveries. The result of this policy push has been
sustained exponential growth in both the ELV fleet and supporting
charging infrastructure.
OVERVIEW OF THE ELV FLEET AND CHARGING INFRASTRUCTURE
IN SHENZHEN
While Shenzhen is now the global leader in the promotion and
adoption of ELVs, in October 2015 the city had less than 300 registered
operational battery ELVs. Through a combination of vibrant market
activity and strong government support, that number had grown to
70,417 by the end of 2019, with more than 80% of the ELVs being
registered during or after 2017.9 The ELV fleet is composed of 39,363
minivans, 24,330 light trucks, and 5,597 medium vans.
While vigorously promoting the use of ELVs, Shenzhen is also actively
building out the infrastructure to meet the demand for charging from this
rapidly expanding vehicle fleet. By the end of 2019, about 83,000 public
chargers had been built in the city—including about 30,000 DC
fast chargers.10
VEHICLE USE CASES AND BUSINESS MODELS
Currently, ELVs in Shenzhen are mainly used in last-mile applications
including e-commerce and package express delivery, retailers and
supermarkets, cold chain and fresh goods, and medical supplies
in the city.
In terms of ownership, relatively few operators own their own ELVs.
Leasing models, including short-term rental, dominate the ELV market
in Shenzhen. At present, less than 2% of the ELVs in Shenzhen are
owned by the individuals or companies who operate the vehicles. The
other 98% are owned by leasing companies.11 Under this model, ELV
SHENZHEN ELV MARKET INTRODUCTION
Page 17
14 | ROCKY MOUNTAIN INSTITUTE BACKGROUND VOLUME: SETTING THE STAGE FOR FULL UTILIZATION OF EVS IN SHENZHEN | 15
SHENZHEN ELV MARKET INTRODUCTION
leasing firms purchase ELVs and then lease them out to individuals and
companies. As part of the lease, they include maintenance services,
charging services, and in some cases, even drivers.
Under this model, vehicle users can easily obtain ELVs through monthly
rental contracts, which are both affordable and provide significant
flexibility to adjust fleet size and composition in response to seasonality
of freight shipments. Furthermore, under this model much of the risk
associated with EV ownership is transferred to the leasing company that,
in many cases, is affiliated with a vehicle OEM and better able to manage
that risk.
For example, the risk of battery degradation or vehicle failure all sits
with the leasing companies, which have the in-house expertise to cost-
effectively deal with those problems. Furthermore, the planning and
deploying of charging infrastructure at scale is more easily carried out by
large leasing companies, which in turn provide charging as an element of
the overall lease package.
Finally, the leasing model is well suited to the cost structure of ELVs. Due
to the high capital costs and low operating cost of ELVs, well-capitalized
leasing companies are better positioned to own these vehicles than their
clients, which are often small-scale logistics businesses or even owner
operators with limited access to capital.
Page 18
16 | ROCKY MOUNTAIN INSTITUTE BACKGROUND VOLUME: SETTING THE STAGE FOR FULL UTILIZATION OF EVS IN SHENZHEN | 17
As the global pioneer of ELV deployment, in 2015 Shenzhen began
to implement a policy framework to support ELVs; and the city has
continuously refined that framework over the past five years. The major
elements of that framework have been a vehicle purchase subsidy,
preferred urban access for ELVs, a subsidy for charger installation,
discounted electricity and parking rates for ELV parking, and, most
recently, an innovative operational subsidy. Each of those elements are
summarized below.
PURCHASING SUBSIDY
Shenzhen began subsidizing the purchase of ELVs in 2015 and
has continuously fine-tuned its subsidization policy to support the
development of a healthy market. Over the years the magnitude of the
purchasing subsidy has been reduced in order to ensure that the subsidy
amount remained appropriate as ELV prices fell. Furthermore, the
subsidy has also tightened its technical requirements (especially battery
energy density) in order to ensure that it continued to drive improvement
in vehicle technology and capabilities.
Because EV purchase subsidization at the municipal level is tied to a
national subsidy that expired last year, the purchasing subsidy for ELVs
in Shenzhen was phased out along with the national subsidy in August
2019.12 However, unsubsidized ELVs in China are still not TCO competitive
with ICE vehicles under average operating conditions. As a result,
Shenzhen implemented an operational subsidy that features utilization
requirements, described below, to ensure continued TCO superiority
for ELVs.
ROAD PRIVILEGES
In order to encourage customers to use ELVs instead of ICE trucks for
deliveries, beginning in 2016 Shenzhen restricted access for diesel
trucks on many roads in the city. Only vehicles that have been verified
as ELVs and registered on Shenzhen’s data collection platform are
permitted to drive on those roads.13 For further detail please see
discussion of urban access policies for ELVs in RMI’s A New EV Horizon -
Insights From Shenzhen’s Path to Global Leadership in Electric Logistics
Vehicles report.
POLICY OVERVIEW
Page 19
16 | ROCKY MOUNTAIN INSTITUTE BACKGROUND VOLUME: SETTING THE STAGE FOR FULL UTILIZATION OF EVS IN SHENZHEN | 17
CHARGING STATION ESTABLISHMENT
In addition to incentives for the purchase and use of ELVs, Shenzhen
also has a framework to incentivize and support the construction of
EV (including ELV) charging infrastructure. Since 2013, the municipal
government has provided a subsidy for the deployment of charging
infrastructure by large-scale players. This focus on scale is to exclude
small players that historically were difficult to regulate and created a
disorderly market for charging where stations were poorly maintained
and experienced safety issues.
The standards to be considered a charging station operator of sufficient
scale are continuously developing. As of publication, the latest standards
include the following elements:
• Only companies that own chargers with a cumulative capacity of
8,000 kW or more in Shenzhen may apply for the subsidy (the same
company can apply for the subsidy again when the total additional
installed capacity after the first application reaches 3,000 kW).
• In 2020, for the first time, it is required that construction companies
connect the charger telematics systems to the unified charging facility
safety supervision platform of Shenzhen and upload operational data
in real time.14
For companies that qualify, the construction subsidy standard for a DC
charging facility is ¥400/kW ($60/kW). The subsidy standard for AC
chargers is ¥200/kW ($30/kW) for chargers with capacity higher than 40
kW and ¥100/kW ($15/kW) for chargers with capacity lower than 40 kW.
ELECTRICITY AND PARKING COSTS FOR CHARGING
Beginning July 2018, the Development and Reform Commission of
Shenzhen issued a regulation that provided certain concentrated
EV charging facilities, defined below, with industrial and commercial
electricity pricing of ¥0.17–¥1.03/kW ($0.025–$0.15/kW), depending
on the time of day. In order to ensure that those low rates are passed
on to customers, and therefore support the TCO advantages of EVs,
POLICY OVERVIEW
Page 20
18 | ROCKY MOUNTAIN INSTITUTE BACKGROUND VOLUME: SETTING THE STAGE FOR FULL UTILIZATION OF EVS IN SHENZHEN | 19
POLICY OVERVIEW
regulations require that charging station operators charge no more
than ¥0.8/kWh ($0.12/kWh) in excess of the cost of electricity they
receive from the grid.15 Due to the competition for customers, charging
companies typically charge less than the maximum allowed fee, although
this varies by location. Chargers in high demand areas with low land
availability, such as in the city center, are able to charge the full allowed
service fee.
Three requirements exist in order for a station to be qualified as a
concentrated charger:
• The facility should have at least 150 kw of total capacity and at least
three chargers.
• The facility should be operated by a registered charging
infrastructure operating company.
• Chargers at residential parking at homes or apartments do not
qualify. Residential rates apply for residential chargers even if other
conditions are met by the facility.
Furthermore, Shenzhen allowed EVs to enjoy two hours of free parking
per day in public parking lots and one hour of free road side parking per
day.16 This applies to ELV parking when making deliveries—enhancing
their convenience and overall value proposition.
OPERATIONAL SUBSIDY
In 2019 both national and municipal EV purchasing subsidies expired
before ELVs had attained unsubsidized TCO parity with competitor
ICE vehicles for most duty cycles. To continue to support ELVs’ value
proposition for commercial operators, Shenzhen designed and
implemented China’s first ELV operational subsidy. This new subsidy
aims to continue to incentivize the purchase and use of ELVs while
also driving consolidation and increased operational efficiency in the
urban delivery sector. Rather than being paid out at the time of vehicle
Page 21
18 | ROCKY MOUNTAIN INSTITUTE BACKGROUND VOLUME: SETTING THE STAGE FOR FULL UTILIZATION OF EVS IN SHENZHEN | 19
purchase, the operational subsidy is paid out yearly for three years as
long as the vehicle owner remains in compliance with three
subsidy conditions.
First is that the vehicle be used productively: only ELVs driving
15,000 km/year in the city of Shenzhen are eligible. In order to verify
compliance with the requirements of the operational subsidy, Shenzhen
has established a platform to collect and analyze telematics data.
Data sharing by the owners with this platform is a requirement for
subsidy eligibility. This data, in turn, supports not only subsidy eligibility
calculation, but also lays the foundation for evaluating and improving
policy measures such as preferential access regulations for ELVs
and logistics-specific charging network design. The second is that
the vehicle belong to a large-scale fleet—only fleets with substantial
numbers of vehicles are eligible for the subsidy. Finally the vehicle
receiving the subsidy must be of sufficient quality as measured by a
series of quality indicators, most importantly battery density. The details
of this eligibility framework are discussed more in depth in the
following volume.
At a high level, our research indicates that the policy has successfully
driven increased ELV utilization, maintained TCO superiority for ELVs
relative to ICE vehicles, and supported the deployment of higher-
quality vehicles. The policy does not appear to have meaningfully driven
market consolidation. In the next volume of this report, we review this
policy in depth, discuss its impacts on the market, and analyze if it has
accomplished its other stated goals.
POLICY OVERVIEW
Page 22
20 | ROCKY MOUNTAIN INSTITUTE BACKGROUND VOLUME: SETTING THE STAGE FOR FULL UTILIZATION OF EVS IN SHENZHEN | 21
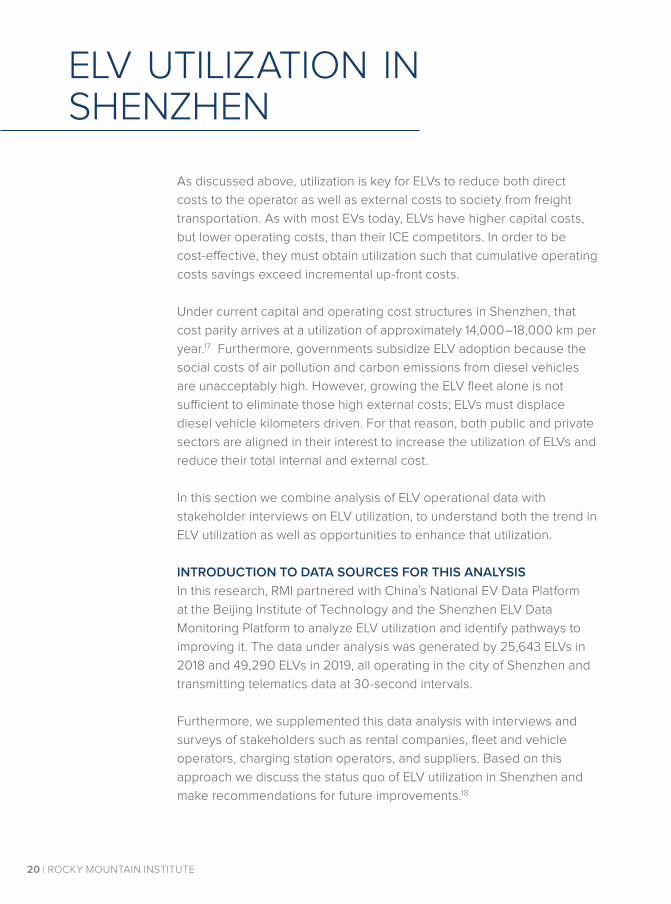
As discussed above, utilization is key for ELVs to reduce both direct
costs to the operator as well as external costs to society from freight
transportation. As with most EVs today, ELVs have higher capital costs,
but lower operating costs, than their ICE competitors. In order to be
cost-effective, they must obtain utilization such that cumulative operating
costs savings exceed incremental up-front costs.
Under current capital and operating cost structures in Shenzhen, that
cost parity arrives at a utilization of approximately 14,000–18,000 km per
year.17 Furthermore, governments subsidize ELV adoption because the
social costs of air pollution and carbon emissions from diesel vehicles
are unacceptably high. However, growing the ELV fleet alone is not
sufficient to eliminate those high external costs; ELVs must displace
diesel vehicle kilometers driven. For that reason, both public and private
sectors are aligned in their interest to increase the utilization of ELVs and
reduce their total internal and external cost.
In this section we combine analysis of ELV operational data with
stakeholder interviews on ELV utilization, to understand both the trend in
ELV utilization as well as opportunities to enhance that utilization.
INTRODUCTION TO DATA SOURCES FOR THIS ANALYSIS
In this research, RMI partnered with China’s National EV Data Platform
at the Beijing Institute of Technology and the Shenzhen ELV Data
Monitoring Platform to analyze ELV utilization and identify pathways to
improving it. The data under analysis was generated by 25,643 ELVs in
2018 and 49,290 ELVs in 2019, all operating in the city of Shenzhen and
transmitting telematics data at 30-second intervals.
Furthermore, we supplemented this data analysis with interviews and
surveys of stakeholders such as rental companies, fleet and vehicle
operators, charging station operators, and suppliers. Based on this
approach we discuss the status quo of ELV utilization in Shenzhen and
make recommendations for future improvements.18
ELV UTILIZATION IN SHENZHEN
Page 23
20 | ROCKY MOUNTAIN INSTITUTE BACKGROUND VOLUME: SETTING THE STAGE FOR FULL UTILIZATION OF EVS IN SHENZHEN | 21
ELV UTILIZATION IN SHENZHEN
As mentioned above, the utilization rate of ELVs is a key metric that
indicates the efficiency and feasibility of replacing ICE trucks with
ELVs. However, utilization is not necessarily straightforward to define.
Conceptually an efficiently utilized vehicle will perform the maximum amount
of productive work in a given time period. However, since it is difficult to
have an accurate assessment of the amount of productive work done, we
use a few metrics as proxies. Those metrics are:
• share of days in which a truck operates (referred to as operating days);
• hours of operation per operating day; and
• average daily driving distance on operating days.
COMPARATIVE ANALYSIS OF ANNUAL OPERATING DAYS
The most obvious indicator of poor utilization is a vehicle that never
drives. For that reason the first metric of utilization is the share of days in
which a vehicle actually operates, which we define as driving more than 5
kilometers. Vehicles register and connect to the data platform throughout
the year. Therefore, to normalize for the age of the vehicle, rather than
simply counting operating days for each vehicle, the research team adopted
the method of dividing the number of operating days by the total number of
days since it first connected to the platform.
We refer to this metric as share of operating days. Vehicles with a zero
share of operating days were excluded from analysis as they were
viewed as likely the product of a failure either in the data transmission or
recording systems, or potentially a vehicle that had suffered an accident or
maintenance problem that ended its useful life before it connected to
the platform.
While there is some variability, a large number of ELVs in Shenzhen have a
relatively low share of operating days. As shown in Exhibit 5, only 25% of all
ELVs had a share of operating days of 80% or higher, while 40% had a share
less than 50%. Only 10% of all ELVs achieved a 90% share, the average
share for ICE trucks of the same size. While the data on ELVs show an
increased share of operating days in 2019 compared with 2018,19 the gains
Page 24
22 | ROCKY MOUNTAIN INSTITUTE BACKGROUND VOLUME: SETTING THE STAGE FOR FULL UTILIZATION OF EVS IN SHENZHEN | 23
were small and there is still significant progress needed to match the
utilization rate of ICE vehicles.20
However, when discussing these results with vehicle operators, these
numbers seemed to understate actual ELV utilization. In surveys and
interviews, most vehicle operators indicated that an ELV typically
operated 24–25 days per month. This is much closer to the 90% share
of operating days that surveys indicated was typical for ICE trucks of the
same size.
Interviewees suggested that this low utilization, and the discrepancy
in observed share of operating days versus what was reported in
interviews, may be in part due to the purchase subsidy phase-out
process over the last year in Shenzhen. Before the operational subsidy
was announced, but after it was widely known that the purchase subsidy
was being discontinued, many companies chose to purchase ELVs
despite not actually having an immediate use for them.
This made the vehicles purchased inconsistent with the actual demand
for goods delivery. If that explanation is correct, it is reasonable to expect
that those vehicles will go into service as the existing ICE fleet is retired
or sold for second-life applications. This explanation is supported by a
reduction in the share of the ELV fleet that was idled in 2019 over 2018
(Exhibit 5).
While interviewees and survey respondents indicated that ELVs that
are actually in operation are more fully utilized than our data analysis
suggests, they did agree that they could not fully replace ICE vehicles.
First, EVs feature high battery weights and the current generation of ELV
chassis, especially light trucks, is not able to handle some of the dynamic
forces generated during normal vehicle operations. Therefore, ELVs could
only be loaded with about 60%–70% of the weight that ICE vehicles of
the same size could carry.21
Second, due to lost productivity from limited range and required charging
time, ELVs on average were not able to replace ICE vehicles on a 1:1 ratio
even for delivery tasks that they were physically able to carry out.
ELV UTILIZATION IN SHENZHEN
Page 25
22 | ROCKY MOUNTAIN INSTITUTE BACKGROUND VOLUME: SETTING THE STAGE FOR FULL UTILIZATION OF EVS IN SHENZHEN | 23
Exhibit 5
Share of Operating Days of ELVs in Shenzhen 2018 and 2019
25%
20%
15%
10%
5%
0%
0%–10%
10%–20%
20%–30%
60%–70%
30%–40
%
70%–80%
40%–50%
80%–90%
50%–60%
90%–100%
Percentage of Vehicles
Share of Operating Days
2018 2019
Taking a step further in the analysis and segmenting utilization by
vehicle type yields further insights into the underlying trend. One
key insight is that minivans, in terms of their share of operating days,
generally are better utilized than light trucks (Exhibit 6).
There are several reasons for this superior utilization. First, the duty
cycles of minivans are more amenable to electrification than light-duty
trucks (LDTs). Minivans are mainly used for express parcel deliveries and
in “Uber of Freight” (the most used Chinese platform is called Huolala)
applications. In both scenarios, loads are relatively small and of lower
density and routes traveled are typically lower-velocity, lower-distance
patterns in the urban core. Light trucks, on the other hand, haul heavier
and denser freight longer distances at higher speeds—often in suburban
areas. These differences drive differential utilization in three main ways:
ELV UTILIZATION IN SHENZHEN
Page 26
24 | ROCKY MOUNTAIN INSTITUTE BACKGROUND VOLUME: SETTING THE STAGE FOR FULL UTILIZATION OF EVS IN SHENZHEN | 25
• Subsidy eligibility and structure: First, only kilometers driven within
the city of Shenzhen count toward operational subsidy eligibility. LDTs
spend much of their time driving in the greater Pearl River Delta. As a
result, even though their routes are longer than minivans, their subsidy-
eligible kilometers per route are oftentimes lower than minivans driving
shorter distances.
Secondly, the operational subsidy is calculated according to the size
of the vehicle battery pack, with a marginally decreasing payment per
kWh. Because LDTs need larger battery packs, the overall subsidy is
lower relative to vehicle price than for LDTs. These two factors combine
to make the operational subsidy less valuable to LDTs and therefore less
effective in driving utilization.
• Urban access: One of the key drivers of ELV adoption and use is heavy
restriction of access for ICE vehicles to the city proper (see our previous
report A New EV Horizon for a comprehensive discussion of those
regulations and their effect on ELV adoption). Because LDTs operate
regionally, they are often not required to enter the urban core, negating
the incentives for ELV use that those access restrictions create.
• Vehicle capabilities: As alluded to earlier in this report, ELV chassis
are in some cases not up to the dynamic forces created by heavy
battery packs and heavy loads during sharp turns. Because LDTs have
both heavier battery packs and heavier denser loads, this problem
disproportionately affects them.
As a result of those three factors, electric LDTs are typically only used
when urban access is required. The impacts of those three factors on
the market can be seen below as light duty trucks annual operating days
(Exhibit 6).
ELV UTILIZATION IN SHENZHEN
Page 27
24 | ROCKY MOUNTAIN INSTITUTE BACKGROUND VOLUME: SETTING THE STAGE FOR FULL UTILIZATION OF EVS IN SHENZHEN | 25
Exhibit 6
Comparison of Share of Operating Days in 2019 between Minivans and
Light Trucks
20%
15%
10%
5%
0%
Percentage of Vehicles
Share of Operating Days
LDT Minivans
COMPARATIVE ANALYSIS OF DAILY OPERATIONAL HOURS
For each operating day of a vehicle, the time interval between its first
non-zero speed transmission and last non-zero speed transmission
on that day is defined as its daily operational hours. In 2018–2019, the
median daily operational time of an ELV in Shenzhen was approximately
five hours. While there was some improvement in average daily
operating hours between 2018 and 2019 (Exhibit 7), ELVs still significantly
lag an average of 10–14 hours compared with ICE trucks as reported in
interviews.22
ELV UTILIZATION IN SHENZHEN
0%–10%
10%–20%
20%–30%
60%–70%
30%–40
%
70%–80%
40%–50%
80%–90%
50%–60%
90%–100%
Page 28
26 | ROCKY MOUNTAIN INSTITUTE BACKGROUND VOLUME: SETTING THE STAGE FOR FULL UTILIZATION OF EVS IN SHENZHEN | 27
Exhibit 7
Distribution of Daily Average Operational Hours of ELVs in Shenzhen,
2018 and 2019
6,000
5,000
4,000
3,000
2,000
1,000
00 5 10 15 20
Count of vehicles
Operational hours
2018 2019
COMPARATIVE ANALYSIS OF DAILY DRIVING DISTANCE
Daily driving distance is another metric for utilization that describes how
far a given vehicle drives on an average operating day, as calculated
by the change in its odometer reading on the first and last ping from
its telematics box. This metric has improved substantially recently, with
the average daily driving distance of ELVs in Shenzhen increasing by
approximately 25% from 50–60 km in 2018 to 70–80 km in 2019
(Exhibit 8).23
Although it is still less than the average daily driving distance of 120–160
km of ICE delivery vehicles reported in interviews and surveys, there has
been a significant improvement.24 In order to understand the reasons for
ELV UTILIZATION IN SHENZHEN
Page 29
26 | ROCKY MOUNTAIN INSTITUTE BACKGROUND VOLUME: SETTING THE STAGE FOR FULL UTILIZATION OF EVS IN SHENZHEN | 27
the increasing driving distance, surveys and analysis of delivery fleets
using ELVs in Shenzhen were carried out by the research team.
Our analysis showed that several factors were at play in creating the
trend of improving utilization. First was continuous improvement in
battery energy density and ELV range on a single charge. Second was
improvement in the charging infrastructure that serves these vehicles
(discussed in depth in the following Infrastructure Volume). These two
improvements combined to reduce logistics companies’ ELV range
anxiety and led to increased driver acceptance of ELV’s operational
capabilities. Third, under the incentive structure of the operational
subsidy policy, increased utilization is financially rewarded. This has led
vehicle operators to attempt to meet the eligibility threshold of 15,000
km, resulting in an improvement of overall fleet utilization.
Exhibit 8
Daily Average driving distance Distribution of ELVs in Shenzhen
10%
8%
6%
4%
2%
0%
0–10
20–30
40–50
60–70
80–90
100–110
120–13
0
160–17
0
140–15
0
180–19
0
200–210
220–230
240–250
260–270
280–290
300–31
0
320–33
0
340–35
0
360–37
0
Percentage of Vehicles
KM
2018 2019
ELV UTILIZATION IN SHENZHEN
Page 30
28 | ROCKY MOUNTAIN INSTITUTE BACKGROUND VOLUME: SETTING THE STAGE FOR FULL UTILIZATION OF EVS IN SHENZHEN | 29
At the same time, it is worth noting that daily driving distance of electric
vans has improved more than electric trucks and on average electric
vans exceed the daily driving distance of electric trucks (Exhibit 9),
despite the fact that ICE trucks travel longer daily distances than ICE
vans. This is largely for the same reasons as discussed above in the
operating days section, where both vehicle technology and policies
were more suited to electrification of vans than trucks.
Exhibit 9
Daily Average driving distance Distribution of LDTs and Minivans in Shenzhen
in 2019
9%
8%
7%
6%
5%
4%
3%
2%
1%
0%
1–10
20–30
40–50
60–70
80–90
100–110
120–13
0
160–17
0
140–15
0
180–19
0
200–210
220–230
240–250
260–270
280–290
300–31
0
320–33
0
340–35
0
360–37
0
KM
Vehicle share
LDT Minivan
This lack of success in driving full utilization of electric trucks relative
to the success of efforts in driving the utilization of vans should be a
focus for policymakers in future iterations of subsidization—especially
since these diesel trucks are disproportionate sources of air pollution in
cities. As the range and chassis design of light-duty trucks progresses,
this market segment will become capable of greater utilization. As that
happens, improvements to the operational subsidy framework, paired
with a regional, rather than municipal, approach to access rights will
become key elements of a strategy to drive light e-truck utilization.
ELV UTILIZATION IN SHENZHEN
Page 31
28 | ROCKY MOUNTAIN INSTITUTE BACKGROUND VOLUME: SETTING THE STAGE FOR FULL UTILIZATION OF EVS IN SHENZHEN | 29
Enabling enhanced ELV utilization, and the full replacement of the
ICE fleet with ELVs, are top priorities for policymakers in Shenzhen.
As logistics electrification becomes a focus in cities globally, this will
become an issue that other cities will need to tackle. RMI is supporting
efforts in Shenzhen with analysis of four factors identified as crucial to
driving future improvement in ELV utilization.
Further Development of the Operational Subsidy: The EV purchase
subsidy has been phased out nationally, but ELVs have not yet achieved
unsubsidized TCO parity for the majority of urban duty cycles. Given the
need for continued subsidization but also a desire to rapidly drive the
market to full TCO parity, the operational subsidy has emerged as an
area of intense focus for cities and provinces in China.
RMI’s research will ensure that other cities have a clear view of how
Shenzhen implemented the operational subsidy, support Shenzhen
in evaluating the market’s reaction to the policy, and suggest further
improvements that could enhance its effectiveness.
ELV Charging Network Development: Although charging infrastructure
in Shenzhen has grown by leaps and bounds, the journey was not
painless and is not yet complete. RMI’s research will support Shenzhen
with analysis of ELV charging demand to understand more fully how
both public and private sector players can effectively meet ELV charging
demand—both for the existing fleet and for vehicles expected to come
online in the coming years.
Furthermore, by providing an in-depth analysis of ELV charging patterns,
RMI will provide a roadmap to enable other cities to follow Shenzhen’s
path and avoid the trial and error that Shenzhen experienced as a global
first mover.
Technology and Capability of vehicles: RMI’s surveys of ELV owners
and users show that current ELV models, while much improved over
past years’ models, still have some problems that limit their ability to
fully replace ICE vehicles. These problems include an inability to handle
CONCLUSIONS AND FURTHER RMI ANALYSIS
Page 32
30 | ROCKY MOUNTAIN INSTITUTE BACKGROUND VOLUME: SETTING THE STAGE FOR FULL UTILIZATION OF EVS IN SHENZHEN | 31
CONCLUSIONS AND FURTHER RMI ANALYSIS
heavy loads at speed, excessive downtime for maintenance, and faster
than expected battery degradation.
RMI’s research will analyze the importance of vehicle failures as a factor
driving reduced utilization and lowered confidence in vehicle capabilities.
Our ultimate goal is to present both public and private sector decision
makers with data and insight that will catalyze action to make targeted
improvements to vehicle quality and overcome the existing confidence
gap between ELVs and their ICE counterparts.
Vehicle Ownership Models: As the up-front cost of ELVs remains high at
present, and the complexities of maintaining and charging are beyond
the capabilities of small operators, rental has emerged as the main model
for procuring ELVs in Shenzhen. However, the effect of this new business
model on the incentives for operators to achieve maximum vehicle
utilization are still unknown.
For example, vehicle leasing may incentivize operators to heavily use
fast charging, which leads to more flexibility and short-term revenue
generation but accelerates battery degradation. Or again, the operational
subsidy is paid to vehicle owners, not operators, and therefore the
incentive to drive leased ELVs rather than ICE vehicles may not be fully
transmitted to the market. On the other hand, aggregated ownership may
enable a smaller, better utilized fleet, as random fluctuations in demand
and differing patterns of seasonality are more easily managed.
Therefore, better understanding how to choose and balance rental and
self-ownership models in order to maximize ELV attractiveness and
cost-effectiveness will play an important role in the future promotion and
adoption of ELVs in Shenzhen and other cities in the future.
In the following four reports, RMI will explore each of those topics in
depth in the hope that our analysis can support improved ELV utilization
in Shenzhen and ultimately lay the foundation for an improved policy and
commercial framework for effective ELV use in China and beyond. Our
final report in this series will provide a summary of best practices from
Shenzhen to support other cities in charting a path to fully electrifying
goods and logistics delivery.
Page 33
30 | ROCKY MOUNTAIN INSTITUTE BACKGROUND VOLUME: SETTING THE STAGE FOR FULL UTILIZATION OF EVS IN SHENZHEN | 31
1. Energy Data by Category, Indicator, Country, or Region, International
Energy Agency, 2017.
2. Wenjing Yi, Energy Research Institute of National Development and
Reform Commission, Analysis on Energy Consumption and Current
Situation of Transportation in China, 2017.
3. Energy Saving and Emission Reduction Research Group of Chinese
Academy of Engineering, Strategy and Policy Research on Energy
Saving and Emission Reduction of Freight Transportation in China, May
31, 2016.
4. Ibid.
5. Interviews with Bitauto, Autohome, and local freight transportation
companies in Shenzhen.
6. Shenzhen National Development and Reform Commission, 2018
Shenzhen Blue Action Plan for Sustainability, 2018.
7. China Electric Power Enterprises Federation, China Power Industry
Annual Development Report, 2019; China Carbon Trade Net, Don’t use
EFOM/BM/CM/Emission factors to calculate carbon emission, 2019.
8. Shenzhen Statistics Department, Shenzhen Statistical Yearbook
2019, 2019.
9. Registration data of renewable-energy trucks in Shenzhen in
2019, 2020.
10. Shenzhen Electric Vehicle Operation Association, Charging Operation
and Relevant Suggestions in the First Quarter of 2019 and 2020, 2020
11. Allison Crow et al., A New EV Horizon: Insights From Shenzhen’s Path
to Global Leadership in Electric Logistics Vehicles, Rocky Mountain
Institute, 2019.
12. Shenzhen National Development and Reform Commission,
Implementation Rules of Financial Subsidy for Promotion and
Application of New Energy Vehicles in Shenzhen from 2019 to
2020, 2020.
ENDNOTES
Page 34
32 | ROCKY MOUNTAIN INSTITUTE
ENDNOTES
13. Government of Shenzhen, A notification to publish the “Shenzhen
Blue” action plan for sustainability, 2018.
14. Shenzhen National Development and Reform Commission,
Implementation Rules of Financial Subsidy for Promotion and
Application of New Energy Vehicles in Shenzhen from 2019 to
2020, 2020.
15. Guang Dong National Development and Reform Commission, A
notification about the electricity price for renewable energy vehicles in
our province, 2018.
16. Shenzhen Government, Notice on the implementation of free first-
hour temporary parking policy of new energy vehicles on the road
side, 2018.
17. Interviews with electric vehicle rental companies and freight vehicle
fleets in Shenzhen.
18. Data analysis based on the Beijing Institute of Technology‘s renewable
energy vehicle data platform.
19. Ibid.
20. Research Institute of Road Transportation, Panda Zhilian, Application
Analysis Report of Renewable Energy Logistics Vehicles 2019, 2019
21. Interviews with electric vehicle rental companies and freight vehicle
fleets in Shenzhen
22. Research Institute of Road Transportation, Panda Zhilian, Application
Analysis Report of Renewable Energy Logistics Vehicles 2019, 2019
23. Data analysis based on the Beijing Institute of Technology‘s renewable
energy vehicle data platform.
24. Research Institute of Road Transportation, Panda Zhilian, Application
Analysis Report of Renewable Energy Logistics Vehicles 2019, 2019
Page 35
32 | ROCKY MOUNTAIN INSTITUTE
16 F, Tower C, Ocean Office Park, No.10 West Jintong Road,
Chaoyang District, Beijing 10020, P.R.China
http://www.rmi.org
September 2020 RMI. Rocky Mountain Institute and RMI are registered trademarks.