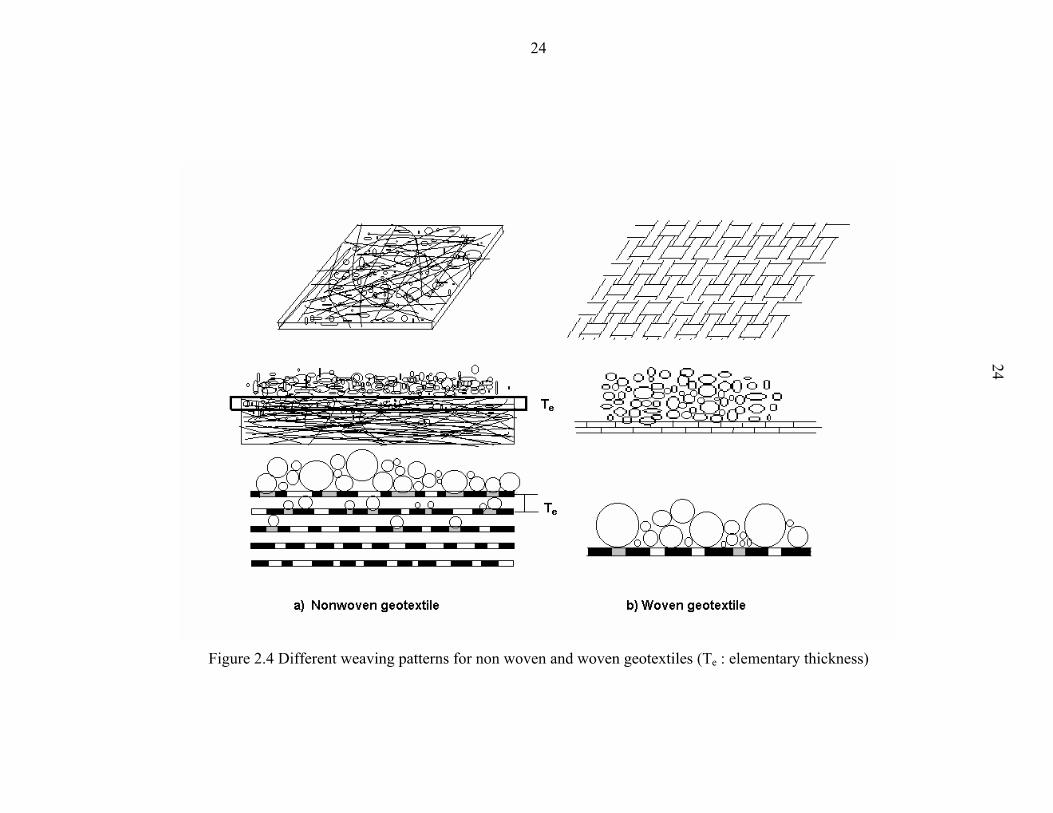
Final Report FHWA/IN/JTRP-2005/1 FILTER PERFORMANCE AND DESIGN FOR HIGHWAY DRAINS By Sangho Lee Graduate Research Assistant School of Civil Engineering Purdue University And Philippe L. Bourdeau Principal Investigator Associate Professor of Civil Engineering Purdue University Joint Transportation Research Program Project No. C-36-15O File No. 6-9-15 SPR-2635 Conducted in Cooperation with the Indiana Department of Transportation and the U.S. Department of Transportation Federal Highway Administration The contents of this report reflect the views of the authors who are responsible for the fats and accuracy of the data presented herein. The contents do not necessarily reflect the official views of policies of the Indiana Department of Transportation and Federal Highway Administration. This report does not constitute a standard, specification, or regulation. Purdue University West Lafayette, Indiana May 2006
Transcript
Final Report
FHWA/IN/JTRP-2005/1
FILTER PERFORMANCE AND DESIGN FOR HIGHWAY DRAINS
By
Sangho Lee
Graduate Research Assistant School of Civil Engineering
Purdue University
And
Philippe L. Bourdeau Principal Investigator
Associate Professor of Civil Engineering Purdue University
Joint Transportation Research Program
Project No. C-36-15O File No. 6-9-15
SPR-2635
Conducted in Cooperation with the Indiana Department of Transportation and the U.S. Department of Transportation
Federal Highway Administration
The contents of this report reflect the views of the authors who are responsible for the fats and accuracy of the data presented herein. The contents do not necessarily reflect the official views of policies of the Indiana Department of Transportation and Federal Highway Administration.
This report does not constitute a standard, specification, or regulation.
Purdue University West Lafayette, Indiana
May 2006
63-6 5/06 JTRP-2005/1 INDOT Division of Research West Lafayette, IN 47906
INDOT Research
TECHNICAL Summary Technology Transfer and Project Implementation Information
TRB Subject Code: 63-6 Subsurface Drainage May 2006 Publication No.: FHWA/IN/JTRP-2005/1, SPR-2635 Final Report
Filter Performance and Design for Highway Drains
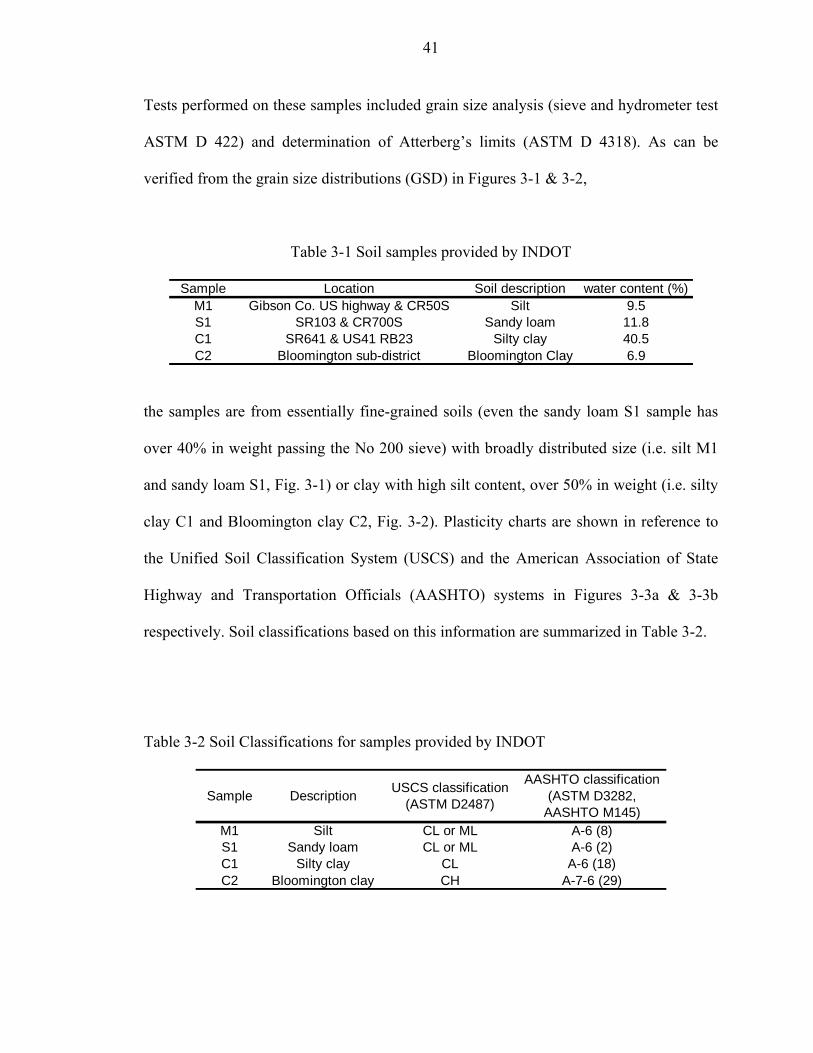
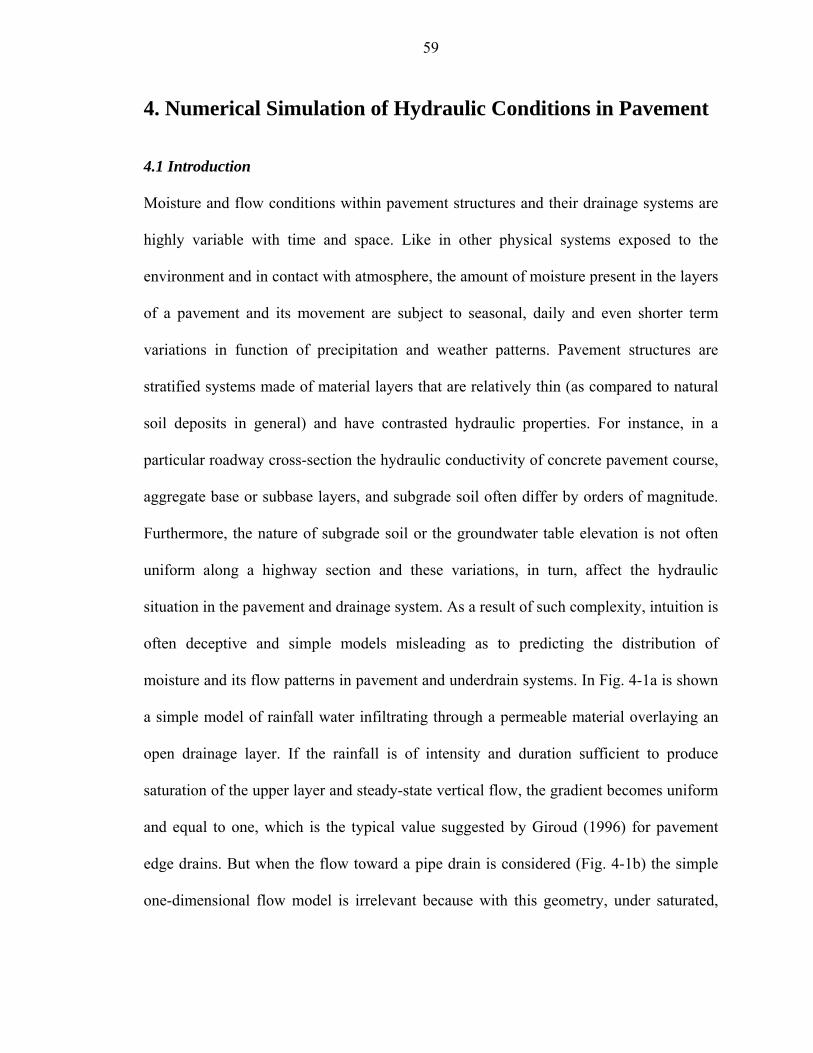
Introduction The effectiveness of underdrain filters was
investigated in order to make recommendations on selection criteria, design and installation guidelines that would improve the long-term performance of drainage systems in Indiana highways. Since significant savings in construction and maintenance cost can be achieved if geosynthetic filters are employed successfully, the study was focused on these types
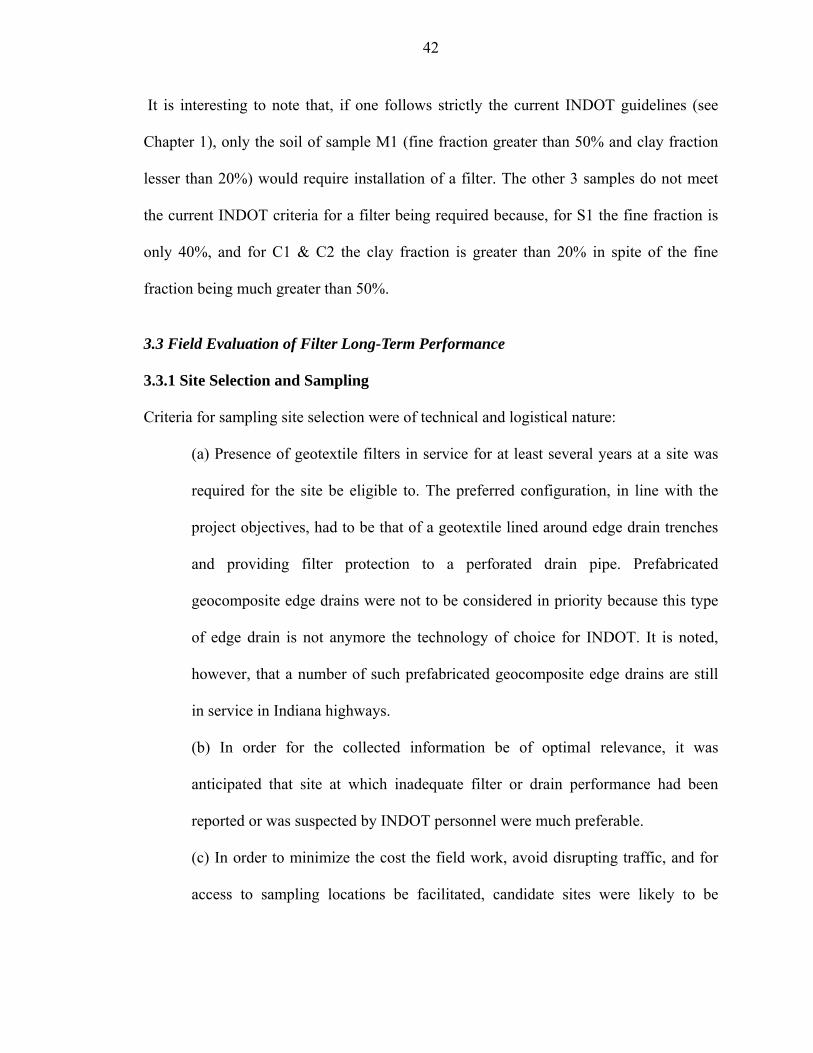
of filters, rather than on traditional mineral filters.The scope of the study was limited to hydro-mechanical filtration mechanisms of solid particles that is, biological and chemical aspects were not addressed to the exception of a test using recycled concrete aggregate. The investigating approach includes field data collection, laboratory experiments and analysis.
Findings Soil filtration by geotextiles is a
complex, multifaceted, process. Its successful application depends on physical compatibility between the geotextile filter and the soil to be retained. Therefore, no successful design can be achieved without considering, first the nature and characteristics of the soil present at the site, and then the range of geotextile products eligible. There is no universal solution where a unique geotextile filter would be compatible with all types of soils or even a broad range of soils. But design solutions can be devised where geotextiles would be compatible with soil types defined by simple parameters such as their particle size and state of compaction.
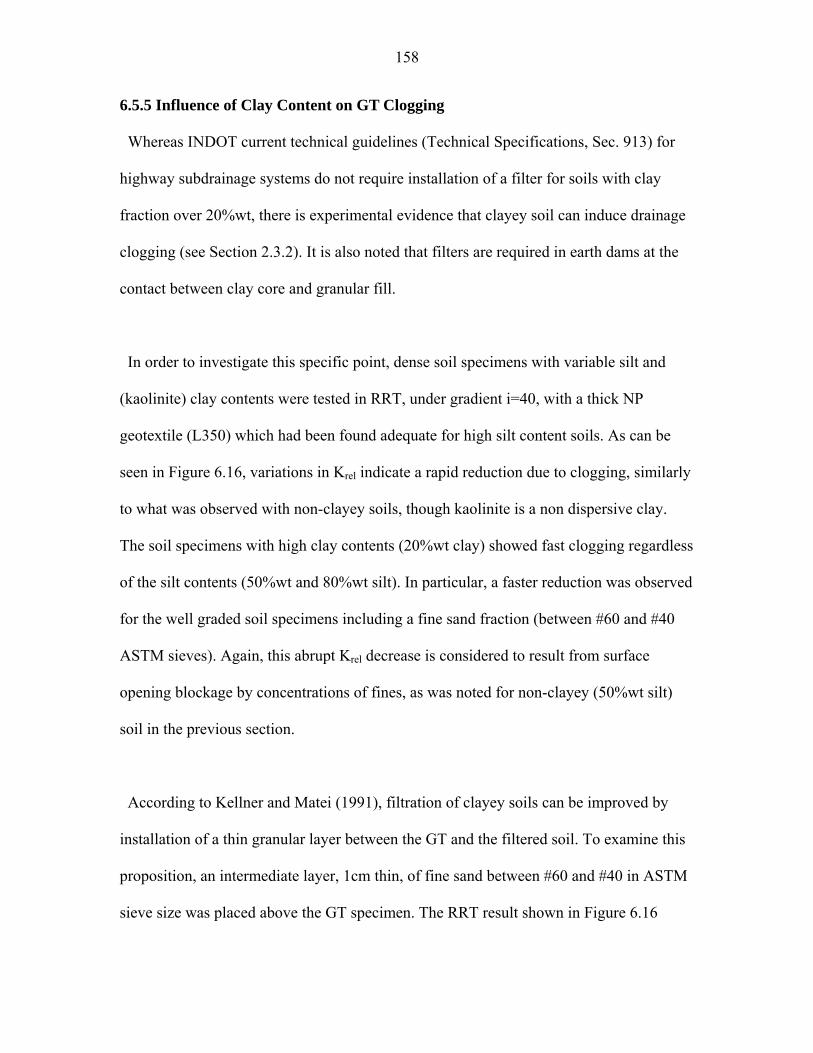
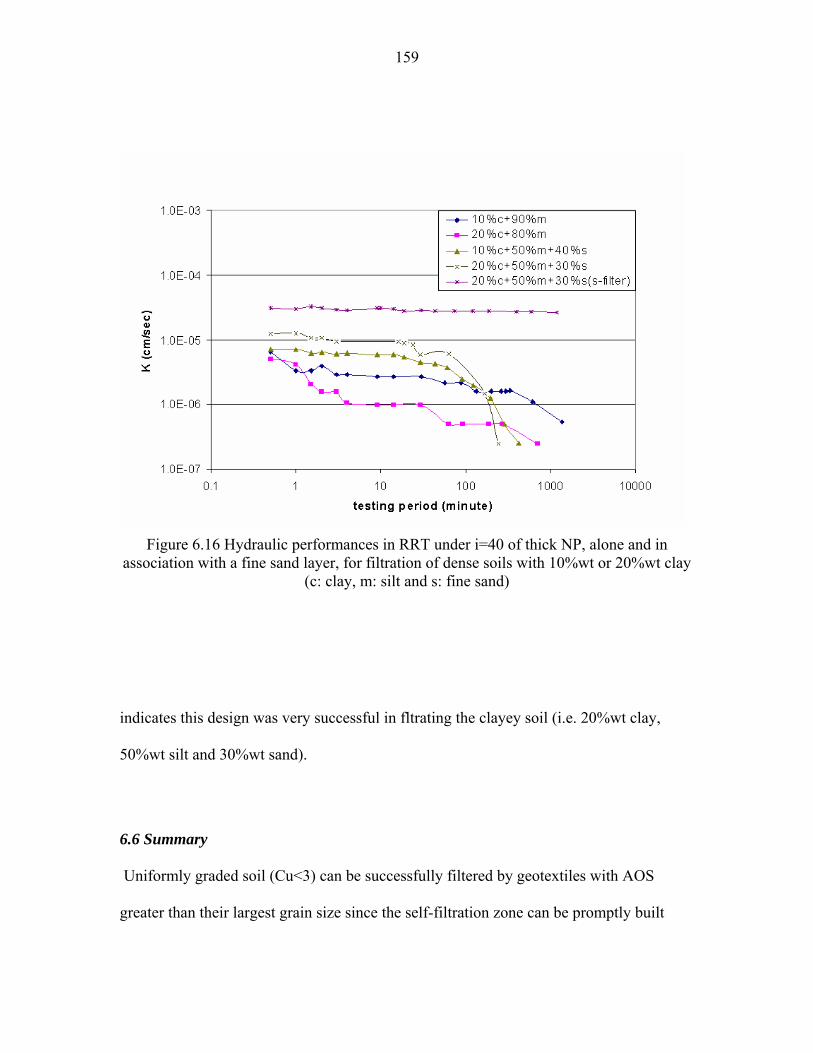
Geotechnical situations that are considered prone to filtration problems with highway underdrains and from which soil samples were analyzed are characterized by high silt content, but the presence of clay together with silt, plays also a role in filter clogging.
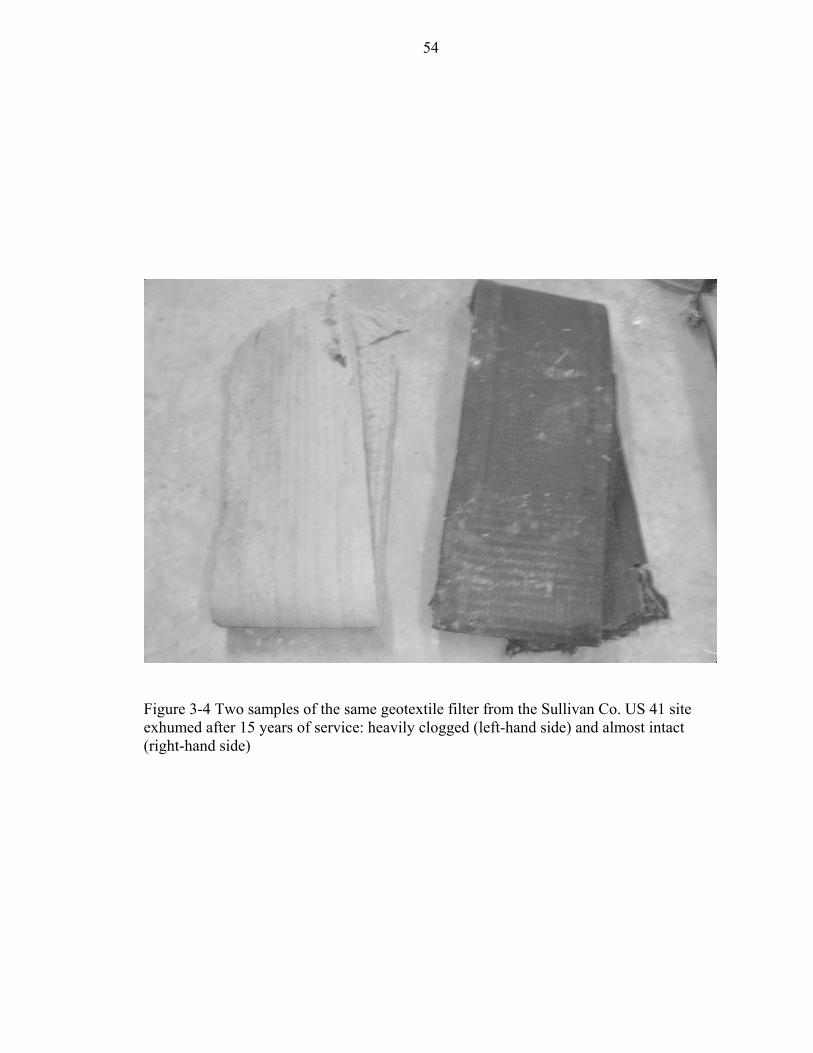
At a project site from which samples of exhumed filters were obtained, the soil was, typically, silty clay. The filter samples from this site exhibited variable degree of clogging after 15 years of service and, when quasi-intact specimens were tested in the laboratory, they were found incompatible with the soil.
Video recording of underdrain pipe non-destructive inspections from different INDOT projects show moderate to heavy sedimentation within pipes after one year of service, suggesting adequate filtration was lacking at this sites.
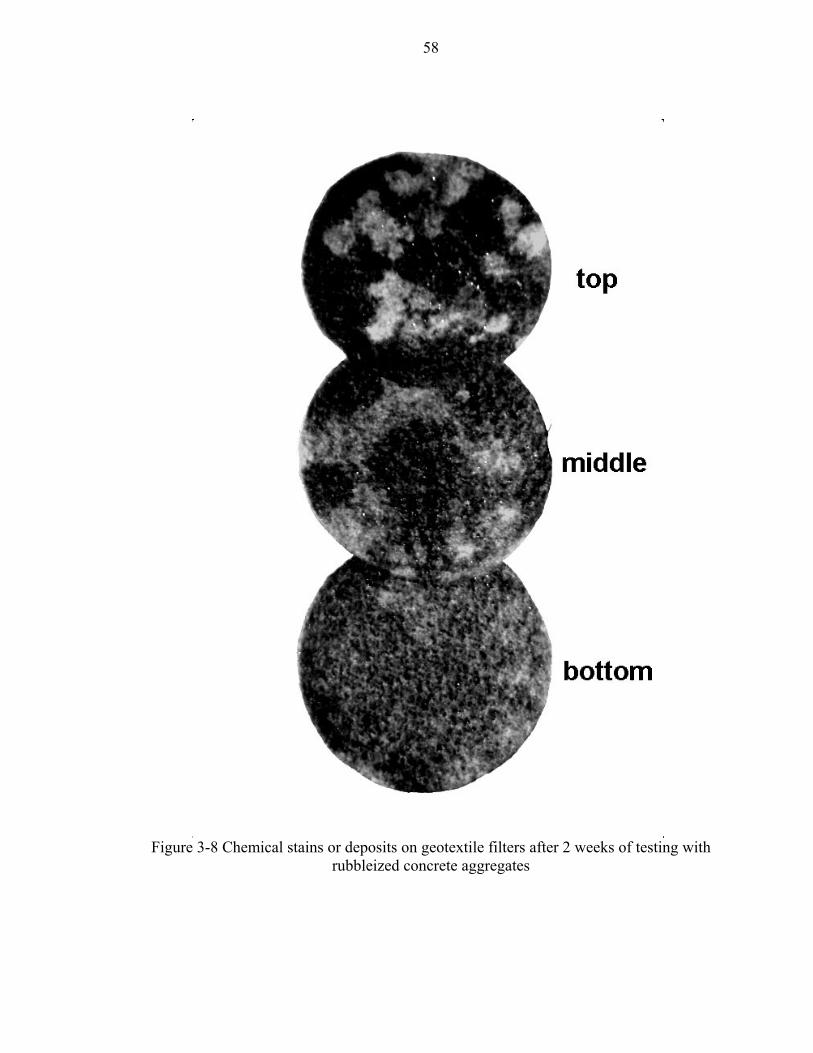
Testing in the laboratory suggests cement chemicals from recycled (rubbleized) concrete aggregates might also affect the integrity of geotextile filters, a conclusion already reached by Wukash and Siddiqui (1996) in an earlier JTRP study.
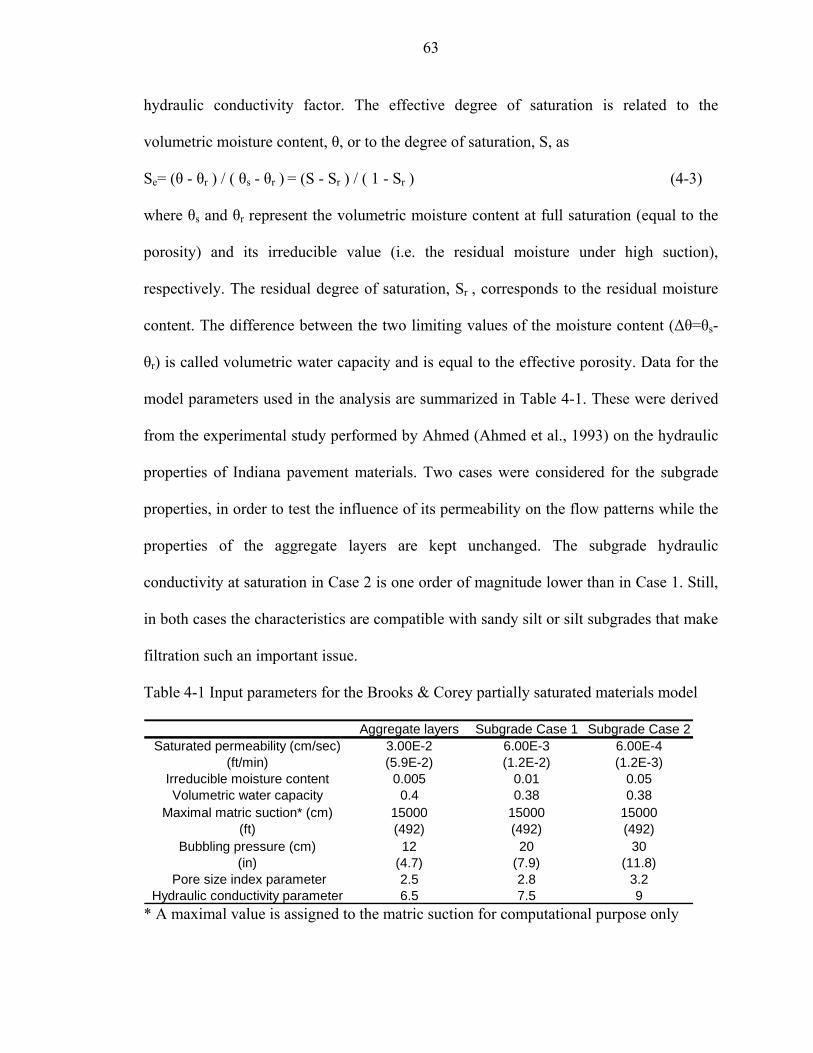
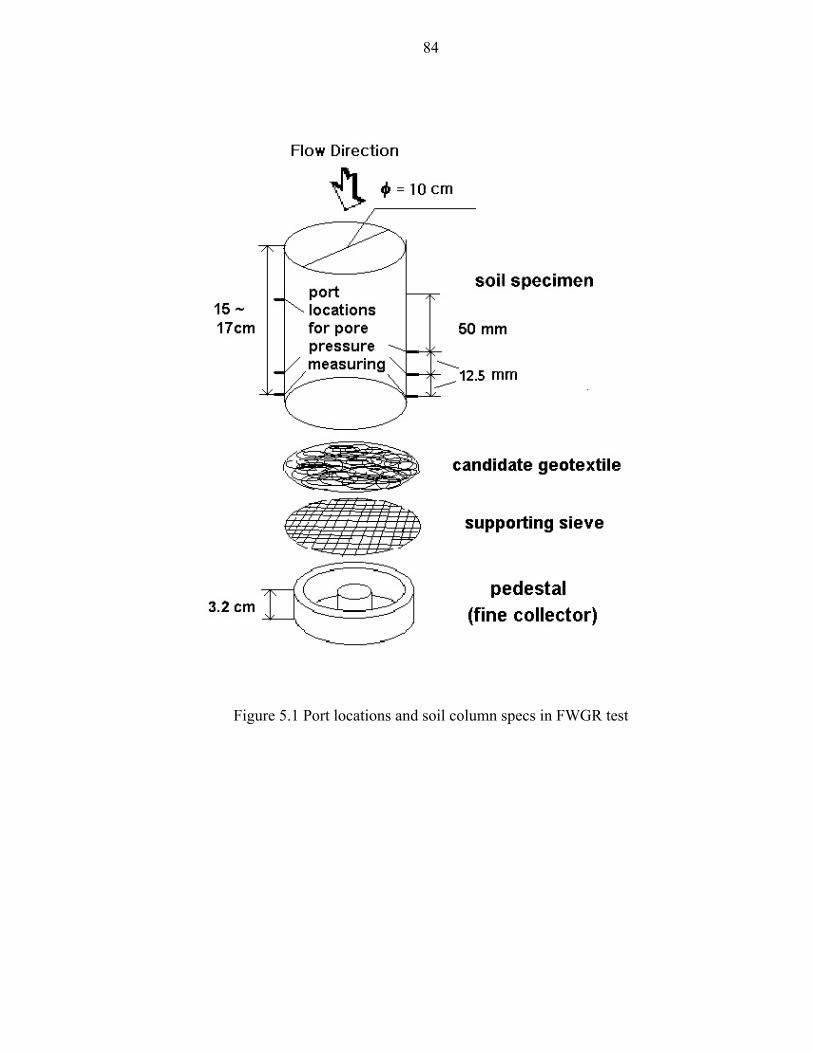
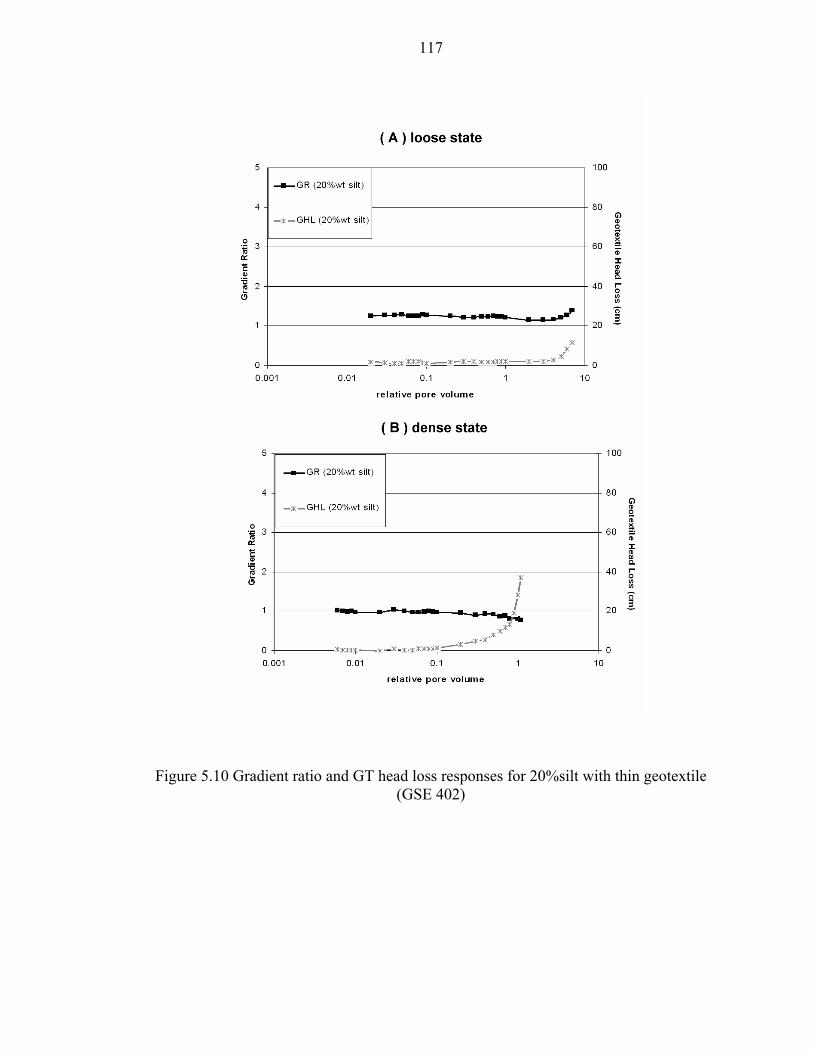
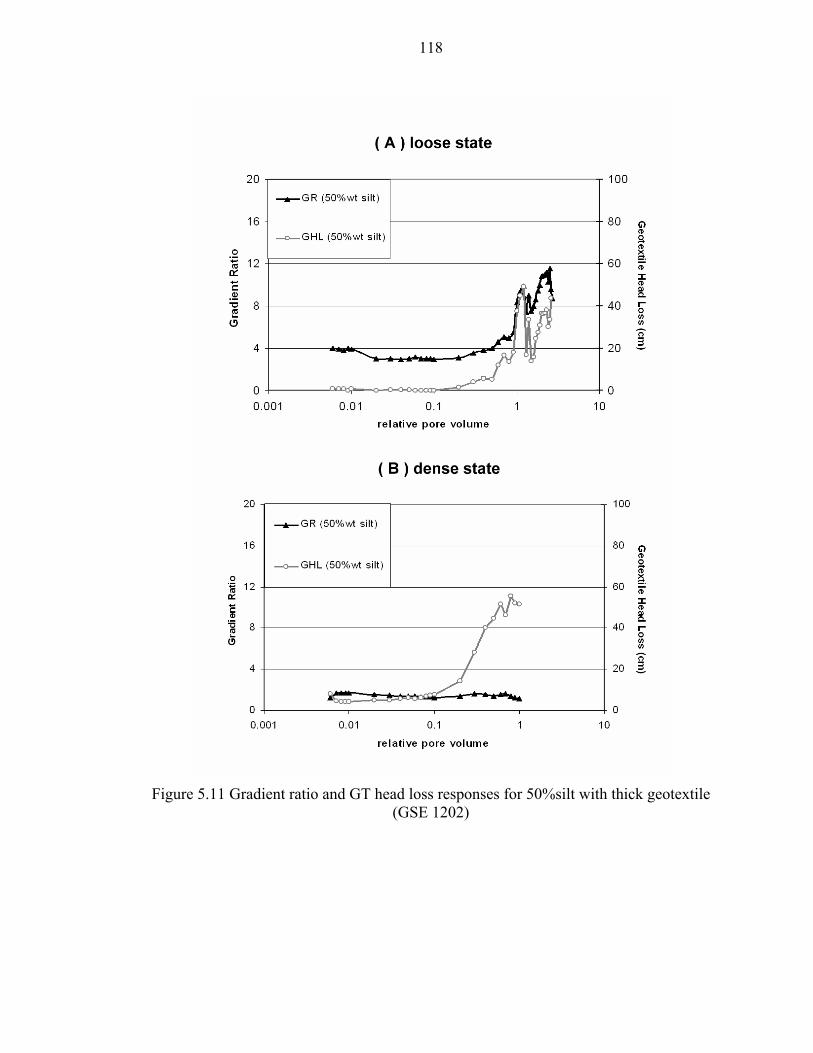
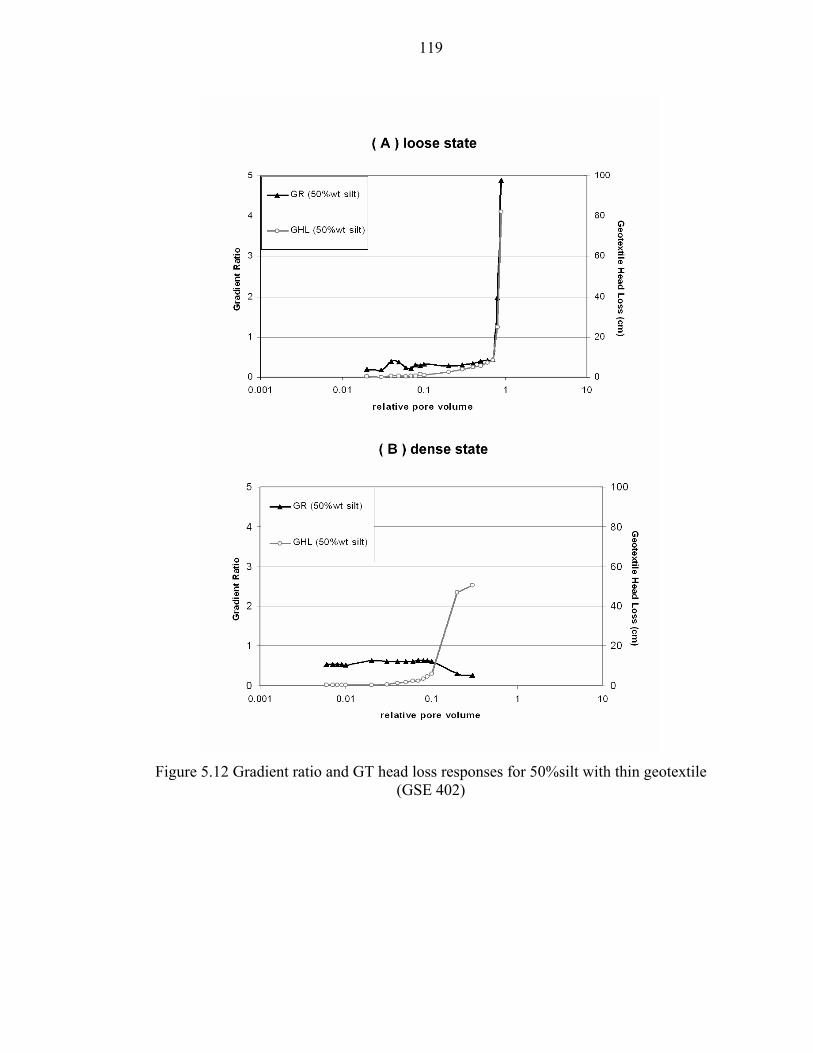
Laboratory testing results were obtained using the best available experimentation methods, the FWGR and the RRT, for a number of material combinations and testing parameters. During flexible wall gradient ratio tests, fine migration within the filter system could be traced indirectly by monitoring the precise pore pressure variation at different elevations along the soil column. Resulting data, gradient ratios and hydraulic head losses through the geotextiles, were consistent altogether to identify the different clogging mechanisms. In particular, they allowed differentiation between surface blocking by coarse particles and internal clogging by fines.
Among the most interesting findings from the testing program is the influence of the soil state of compaction on the filter response. In general, compaction increases interlocking
63-6 5/06 JTRP-2005/1 INDOT Division of Research West Lafayette, IN 47906
between soil particles, reduces the pore space and, consequently, the internal stability of the soil is improved. This is contributing to good filter performance for soils made of a small to medium amount of silt mixed with coarser particles. But a positive effect was not observed with soils made essentially of silt. However, the effect of compaction is more complex if the soil surrounding the filter is compacted after the getextile has been installed. In this case compaction-induced pressure is applied to geotextile and can modify the fabric pore structure or force soil particles into its openings.
Another important factor is the geotextile thickness in connection with its opening size. The thicker is the geotextile, the more likely is a particle to encounter a constriction smaller than its size. High silt content soils can be effectively filtered by thick geotextiles with small FOS rather than by thin ones with large FOS. As described before, most commercially available non woven geotextiles have a FOS larger than silt particle size. Therefore, the fines need be filtered within the geotextile fabric instead of be retained outside To achieve this, a longer infiltration path, characteristic of a thick non-woven geotextile, will offer to a traveling particle more opportunities for small constriction encounter than a thin fabric would. If the soil is to be compacted, a thick geotextile is also less likely to have its porosity decreased and fabric structure disturbed by the compaction process than a thin geotextile.
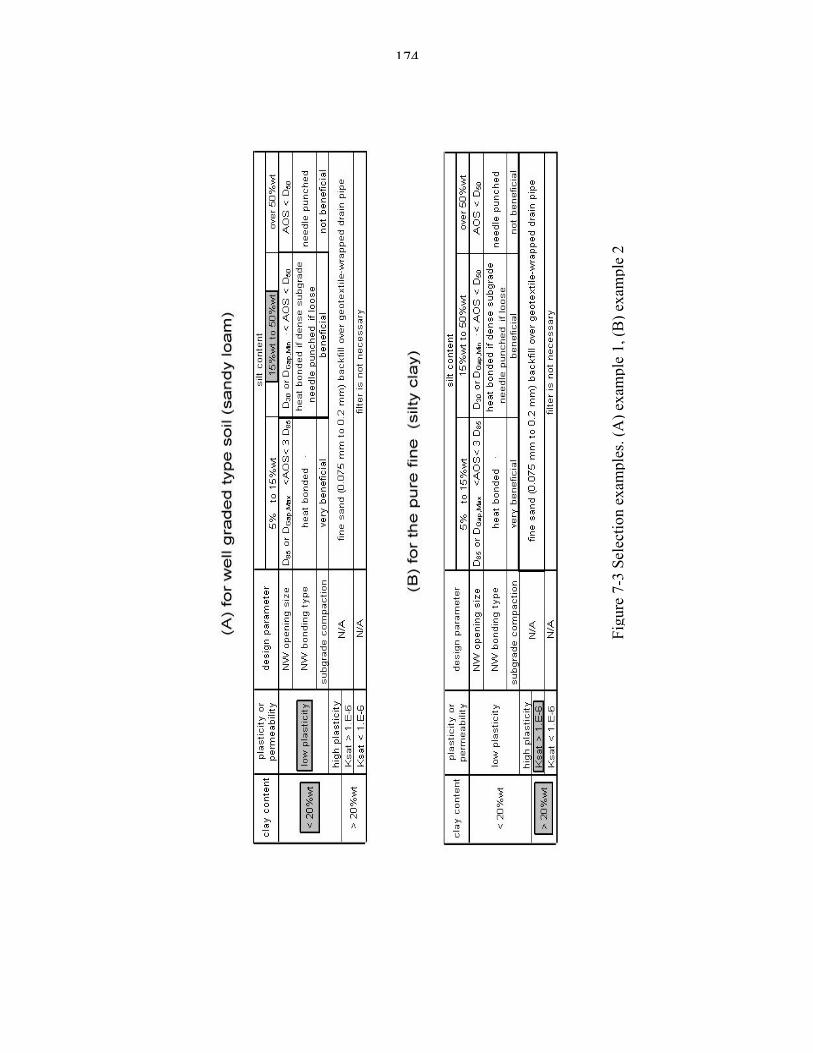
Filtration tests were performed with different types of soils, including low silt content soil, gap-graded soil and high silt content soil. With low silt content soil (10%wt silt) it is generally agreed that the filter should be a geotextile with large AOS (> 1 mm), but it was observed in this study that, if the soil has been compacted, a thick geotextile with much smaller AOS (0.15 mm) can also be adequate. Gap-graded soil with 20%wt silt was successfully filtered using a geotextile with large opening size (0.21 mm) without need for compaction.
Of paramount importance is the relationship between filter opening size and soil grain size distribution. Uniformly graded soils
(Cu<3) can be filtered by the geotextiles with large FOS because a self-filtration zone of soil builds itself at the filter interface and forms bridges over filter openings that may be larger than individual particles. On the other hand, well graded or gap-graded soils need to be filtered by geotextiles with FOS smaller than the representative particle size, D50 or the lower limit of the GSD gap DG, respectively.
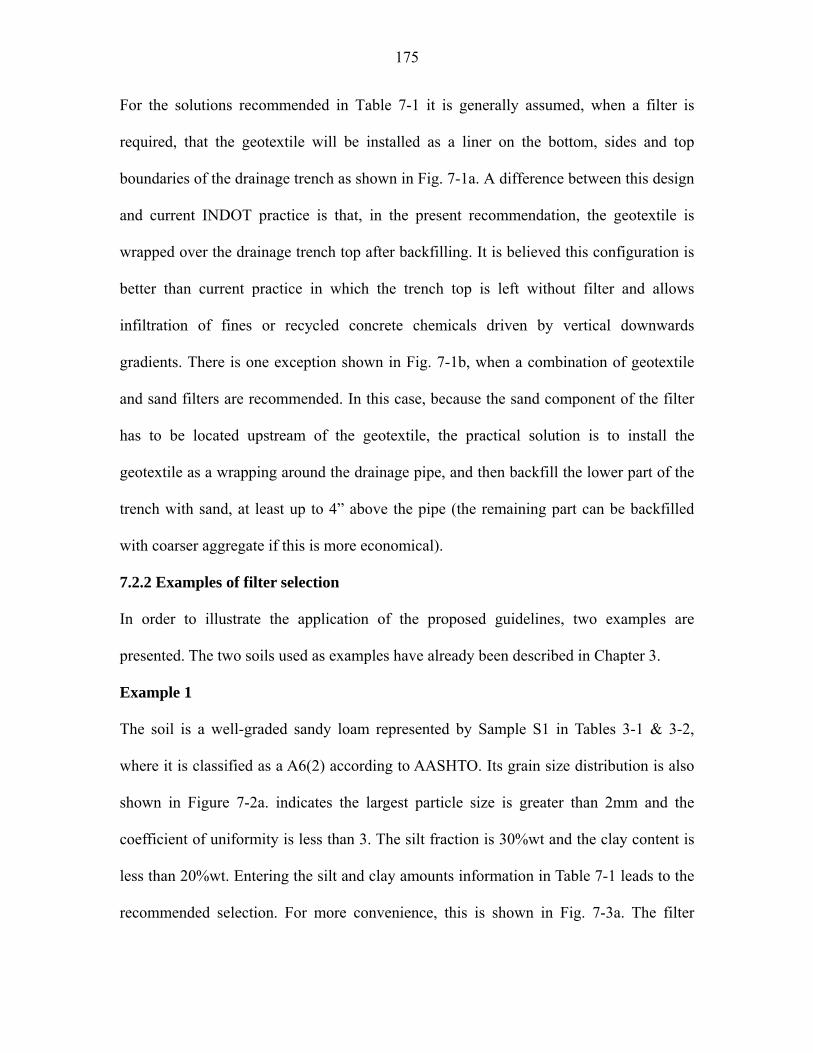
Another important relationship is between the geotextile manufacturing style (producing different modes of fiber bonding and fabric porosities) and the soil type of GSD (e.g. gap graded, well graded or pure fine). If the soil is internally unstable and has small silt content (< 20%wt silt), an even pattern at the surface of the filter facilitates penetration of the loose fines through the openings that still left free from coarse particle blockage. In case of high silt content soil (> 50%wt silt) where particles assemblies are more likely to be in a in loose state, the geotextile porosity should be large in order to limit the risk of plugging by localized fine intrusion. For soils that are the most problematic with respect to geotextile filter design (20% < silt wt < 50%), selection of a geotextile style will depend on both grain size distribution and state of compaction since these factors control the soil internal stability. Presence of small amounts of clay in silty soils contributes to filter clogging. It was observed from the experiments that the cohesiveness of clay mineral plays a role in accelerating the filter internal clogging especially at low flow rate (below 1.0E-6 cm/sec). A solution for filtering silty soils with small clay content (< 20%wt) is to associate a thick geotextile and a layer of sand placed upstream of the filter.
The magnitude of the hydraulic gradient across the filter zone influences the time rate of the clogging process but not its result. Application of high gradients in filtration tests had the effect of accelerating the process, as compared to tests performed under smaller gradients, but the ultimate state of the system, in terms of gradient ratios and hydraulic conductivity at steady state, was not significantly different.
Implementation Detailed recommendations are presented in Sections 7.2 and 7.3 of the report.
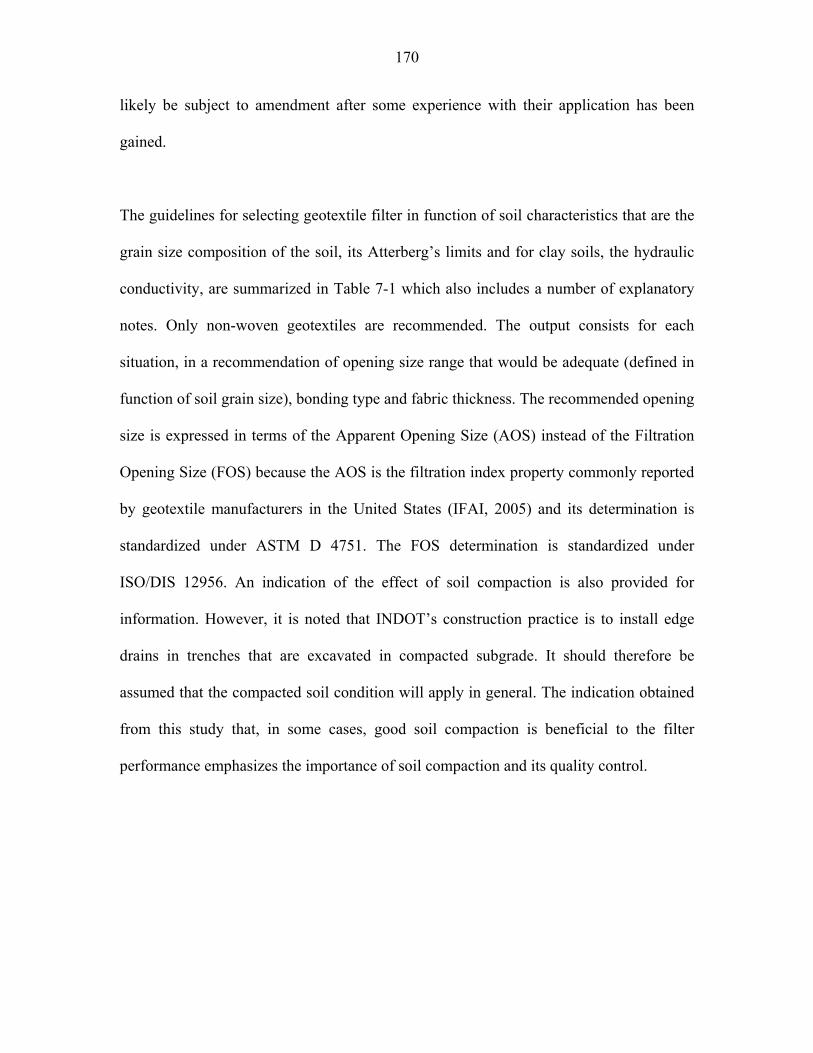
Geotextile filter selection guidelines The guidelines for selecting geotextile
filter in function of soil characteristics that are the grain size composition of the soil, its Atterberg’s
limits and for clay soils, the hydraulic conductivity, are summarized in Table 7-1 of the report which also includes a number of explanatory notes. Only non-woven geotextiles are recommended. The output consists for each situation, in a recommendation of opening size
63-6 5/06 JTRP-2005/1 INDOT Division of Research West Lafayette, IN 47906
range that would be adequate (defined in function of soil grain size), bonding type and fabric thickness. An indication of the effect of soil compaction is also provided.
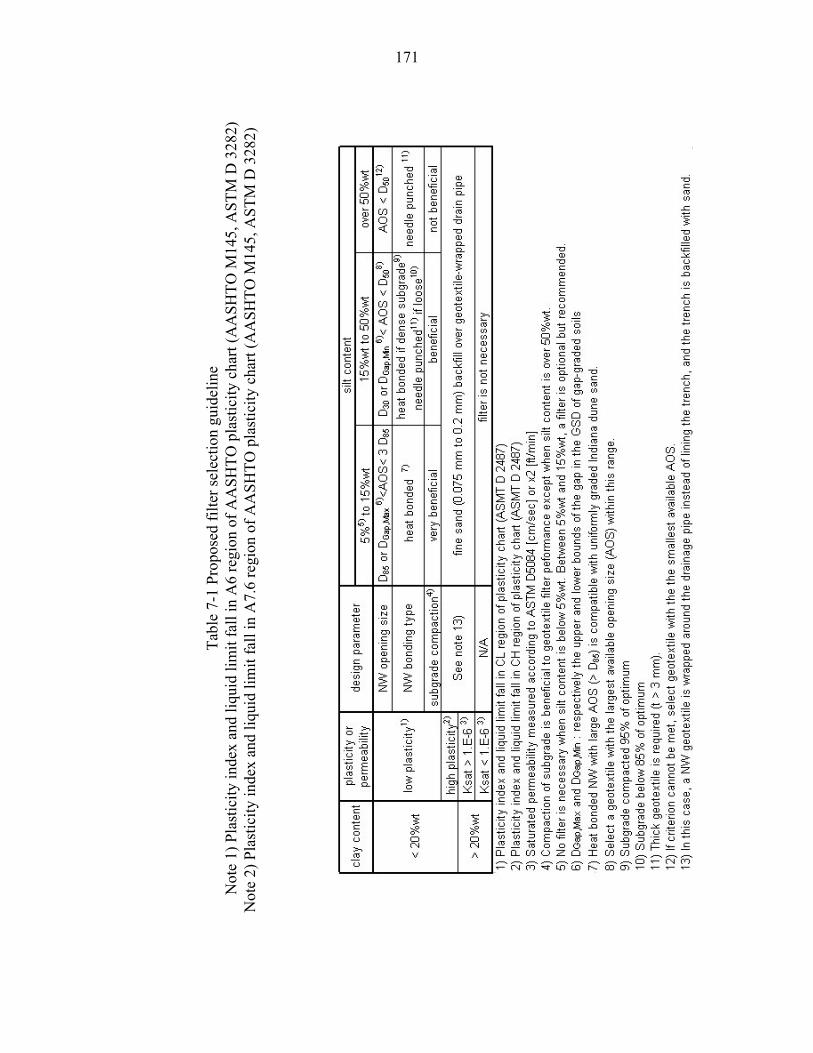
For the solutions recommended, it is generally assumed, when a filter is required, that the geotextile will be installed as a liner on the bottom, sides and top boundaries of the drainage trench. A difference between this design and current INDOT practice is that, in the present recommendation, the geotextile is wrapped over the drainage trench top after backfilling. It is believed this configuration is better than current practice in which the trench top is left without filter and allows infiltration of fines or recycled concrete chemicals driven by vertical downwards gradients. There is one exception, when a combination of geotextile and sand filters are recommended. In this case, because the sand component of the filter has to be located upstream of the geotextile, the practical solution is to install the geotextile as a wrapping around the drainage pipe, and then backfill the lower part of the trench with sand, at least up to 4” above the pipe (the remaining part can be backfilled with coarser aggregate if this is more economical).
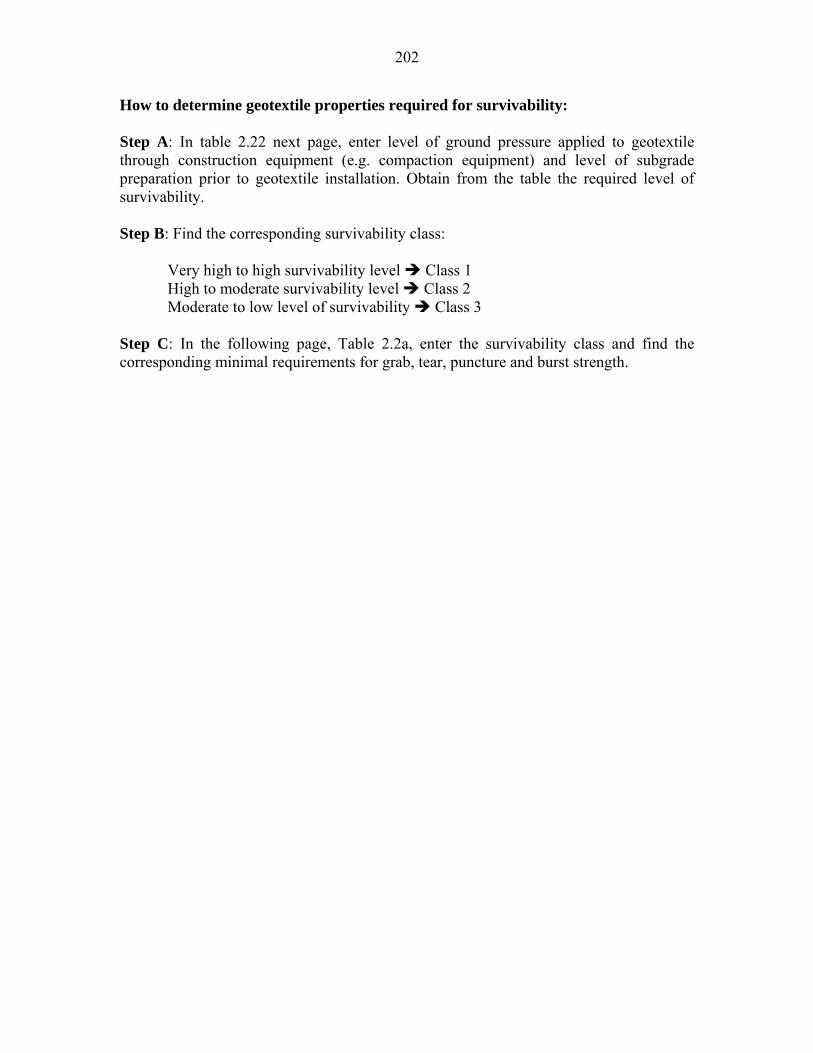
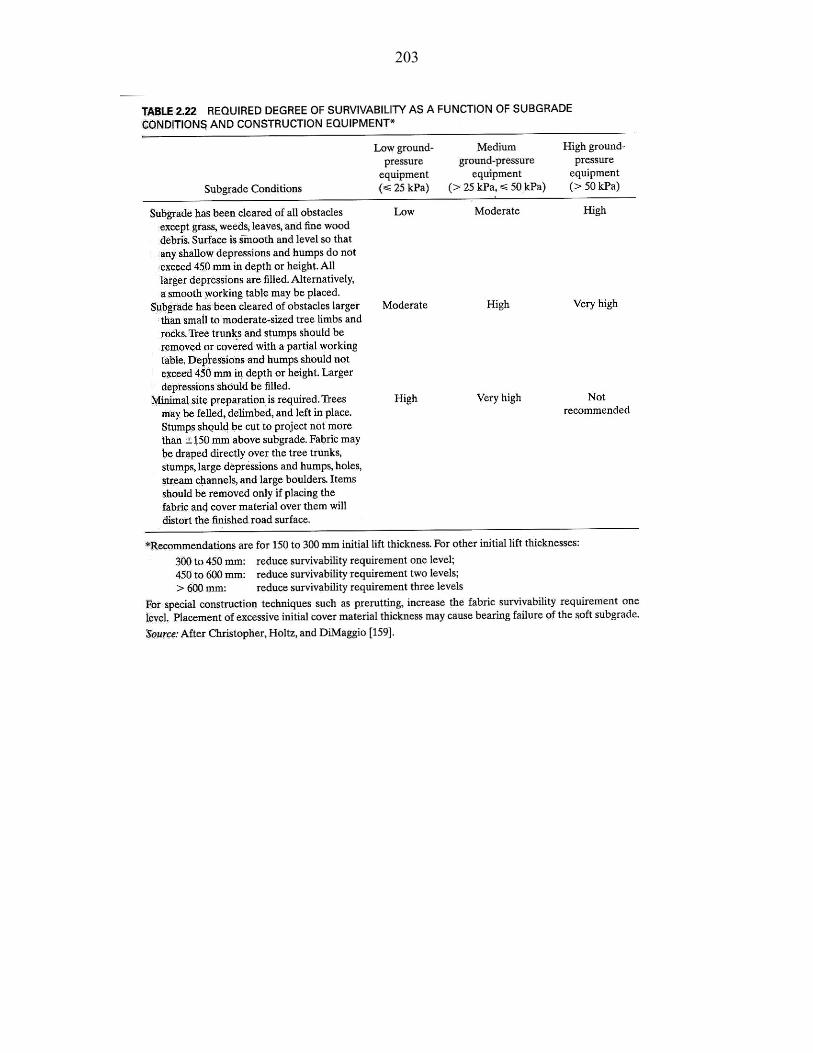
Survivability criteria Selection of geotextile filter based on
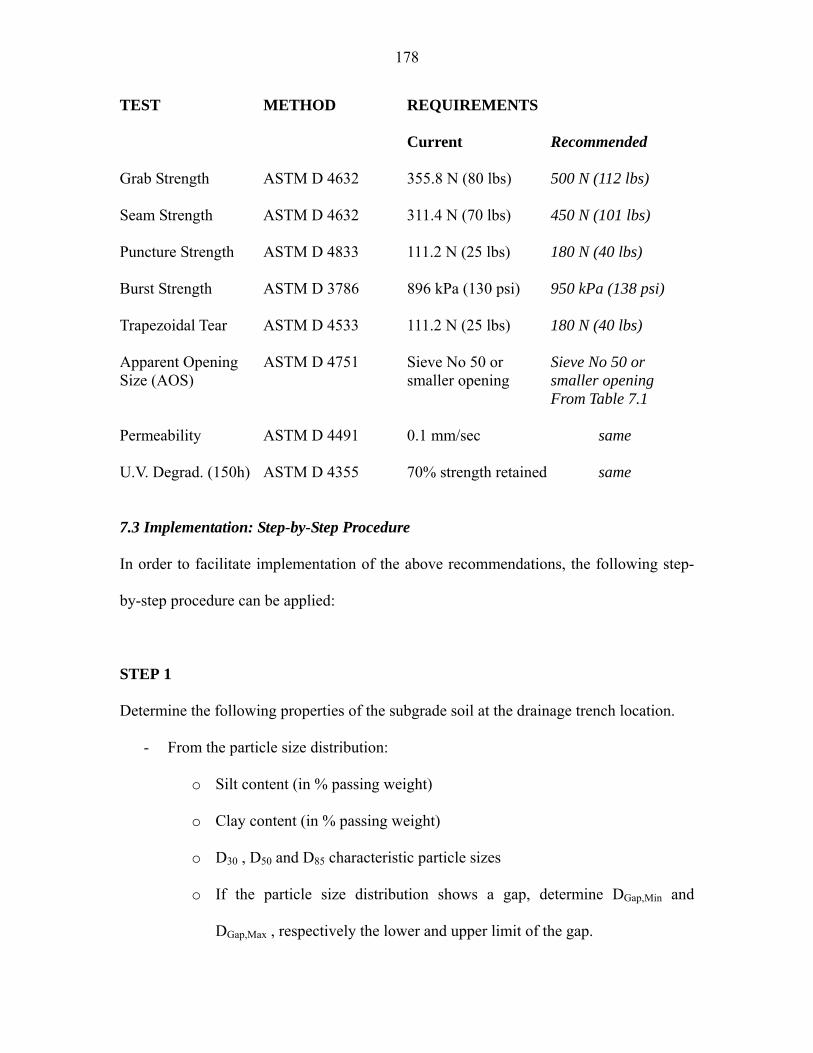
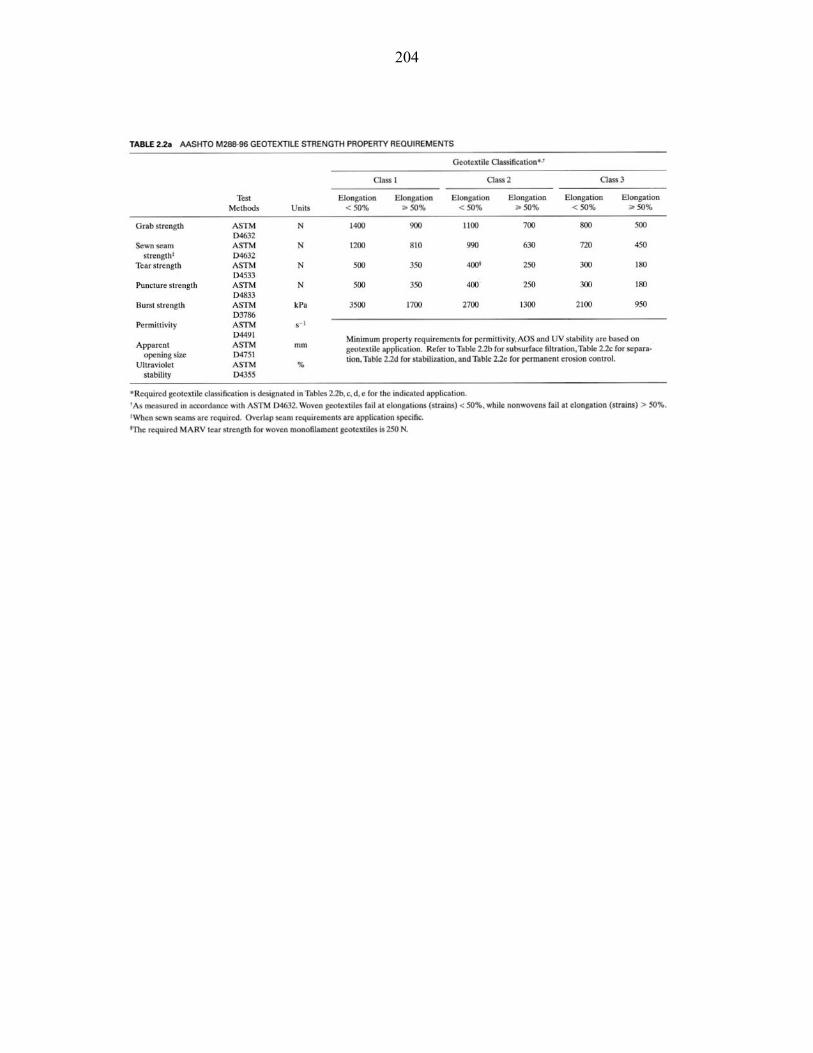
filter criteria addresses the primary function of the geotextile where retention and permeability requirements are met. Another important criterion for the selection of a particular geotextile is based on its ability to survive the mechanical constraints imposed during installation, construction of the roadway and later in service. It has been observed that a number of failures of geotextiles occur during installation and construction rather than in service. This problem was addressed by AASTO and FHWA through a Task Force Committee mission. The resulting criteria and methodology are empirical and are explained in Appendix B of the report. Current INDOT Specifications Sect. 913.19 should be updated accordingly. The recommended revisions are listed in Page 178 of the report.
Step-by-step procedure Section 7.3 of the report describes a step-by-step procedure to help with implementation of the recommended guidelines.
Contacts For more information: Prof. Philippe Bourdeau Principal Investigator School of Civil Engineering Purdue University West Lafayette IN 47907 Phone: (765) 494-5031 Fax: (765) 496-1364 E-mail: [email protected]
Indiana Department of Transportation Division of Research 1205 Montgomery Street P.O. Box 2279 West Lafayette, IN 47906 Phone: (765) 463-1521 Fax: (765) 497-1665 Purdue University Joint Transportation Research Program School of Civil Engineering West Lafayette, IN 47907-1284 Phone: (765) 494-9310 Fax: (765) 496-7996 E-mail: [email protected] http://www.purdue.edu/jtrp
TECHNICAL REPORT STANDARD TITLE PAGE 1. Report No.
2. Government Accession No.
3. Recipient's Catalog No.
FHWA/IN/JTRP-2005/1
4. Title and Subtitle
FILTER PERFORMANCE AND DESIGN FOR HIGHWAY DRAINS
5. Report Date May 2006
6. Performing Organization Code 7. Author(s) Sangho Lee and Philippe L. Bourdeau
9. Performing Organization Name and Address Joint Transportation Research Program 1284 Civil Engineering Building, 550 Stadium Mall Dr., Purdue University, West Lafayette, IN 47907-1284
10. Work Unit No.
11. Contract or Grant No.
SPR-2635 12. Sponsoring Agency Name and Address Indiana Department of Transportation, State Office Bldg, 100 N Senate Ave., Indianapolis, IN 46204
13. Type of Report and Period Covered
Final Report
14. Sponsoring Agency Code
15. Supplementary Notes Prepared in cooperation with the Indiana Department of Transportation and Federal Highway Administration. 16. Abstract The research is an investigation of soil filtration by geotextile fabrics, with the ultimate objective of improving design and long-term performance of underdrain systems in Indiana highways. Experiments were conducted in the laboratory using the best available techniques, Flexible Wall Gradient Ratio Test and Rapid Retention Test, in order to assess soil-filter compatibility and monitor geotextile clogging, for a range of materials and testing conditions. Field information was also collected and samples from highway reconstruction project were examined for their long-term performance. The main findings relate to the influence of the amounts of silt and clay and the state of compaction of the subgrade. Controlling parameters of the geotextile effectiveness are its opening size, thickness and manufacturing style. Based on these findings and information already available from the literature, new design and installation guidelines including filter selection criteria are proposed for non-woven geotextile filters in Indiana highway edge underdrain systems
17. Key Words Underdrain, edge drain, filter, clogging, non-woven, geotextiles, filter criterion, flexible wall gradient ratio, rapid retention test
18. Distribution Statement No restrictions. This document is available to the public through the National Technical Information Service, Springfield, VA 22161
19. Security Classif. (of this report)
Unclassified
20. Security Classif. (of this page)
Unclassified
21. No. of Pages
204
22. Price
Form DOT F 1700.7 (8-69)
iii
Table of Contents
List of Tables ..................................................................................................................... vi List of Figures ................................................................................................................... vii Notation of abbreviation and symbol................................................................................ xii 1. Introduction.................................................................................................................... 1 1.1 Background.............................................................................................................. 1 1.2 Statement of Problem............................................................................................... 2 1.3 Scope of the Present Study ...................................................................................... 5 1.4 Organization of this Report...................................................................................... 7 2. Literature Review and Syntheses................................................................................... 9 2.1 General Characteristics of Soil Filtration Using Geotextiles................................... 9 2.2 Mechanism of Geotextile Filtration and Physical Clogging.................................. 10 2.3 Clogging Factors Related with Soil Properties...................................................... 14 2.3.1 Non-cohesive Soil......................................................................................... 14 2.3.2 Cohesive Soils............................................................................................... 18 2.4 Clogging Factors Related to Geotextile Properties................................................ 20 2.4.1 Filter Opening Size and Constriction Size Distribution ............................... 21 2.4.2 Weaving Pattern............................................................................................ 22 2.4.3 Porosity ......................................................................................................... 25 2.4.4 Thickness ...................................................................................................... 25 2.4.5 Fiber Material................................................................................................ 27 2.5 Hydraulic Conditions and External Loading ......................................................... 27 2.6 Test Methods for Geotextile Clogging Assessments ............................................. 29 2.7 Filter Design Criteria ............................................................................................. 31 2.7.1 FHWA Criteria (Christopher and Holtz, 1985 and Christopher et al, 1995) 33 2.7.2 Geosyntec Group Criteria (Luettich et al, 1992) .......................................... 33 2.7.3 Lafleur’s Criteria (Lafleur, 1999) ................................................................. 34 2.8 Earlier Experimental Results ................................................................................. 34 2.9 Earlier Field Performance Study............................................................................ 38 3. Investigation of Field Conditions and Long-Term Performance................................. 40 3.1 Purpose of the investigation................................................................................... 40 3.2 Study of Soil Samples Provided by INDOT.......................................................... 40 3.3 Field Evaluation of Filter Long-Term Performance .............................................. 42 3.3.1 Site Selection and Sampling ......................................................................... 42 3.3.2 Analysis of Soil samples from the Sullivan Co. US 41 Site......................... 44 3.3.3 Analysis of Geotextile Samples from the Sullivan Co. US 41 Site .............. 44 3.3.4 Analysis of Bloomington Clay Filtration with Geotextile Samples from the Sullivan Co. US 41 Site ................................................................................ 45 3.3.5 Filtration Test of Recycled Concrete Aggregate from the Sullivan Co. US
iv
41 Project ...................................................................................................... 46 3.3.6 Video Inspection of Subdrainage Pipes ........................................................ 47 3.4 Summary of Field Studies Findings....................................................................... 50 4. Numerical Simulation of Hydraulic Conditions in Pavement ..................................... 59 4.1 Introduction............................................................................................................ 59 4.2 Analysis of Subsurface Flow Patterns Using PURDRAIN ................................... 61 4.2.1 Geometry....................................................................................................... 61 4.2.2 Boundary conditions ..................................................................................... 61 4.2.3 Material hydraulic properties........................................................................ 62 4.2.4 Simulated scenarios ...................................................................................... 64 4.3 Simulation results................................................................................................... 64 4.4 Summary ................................................................................................................ 66 5. Laboratory Investigation of Geotextile Filtration by Flexible Gradient Ratio Test – Effect of Soil Property ................................................................................................. 79 5.1 Introduction............................................................................................................ 79 5.2 Description of FWGR Test .................................................................................... 79 5.3 Material Properties and Testing Conditions .......................................................... 85 5.3.1 Overview....................................................................................................... 85 5.3.2 Soil Specimen Preparation............................................................................ 85 5.3.3 Silt Content and Compaction States ............................................................. 89 5.3.4 Geotextile Apparent Opening Size (AOS).................................................... 91 5.3.5 Geotextile Constrained Compressibility and Thickness ............................... 92 5.3.6 Hydraulic Conditions .................................................................................... 95 5.4 Test Results............................................................................................................ 96 5.4.1 Normalized Parameters................................................................................. 96 5.4.2 Filter Hydraulic Performance during Soil Filtration..................................... 98 5.4.3 Gradient Ratio and Geotextile Head Loss .................................................. 107 5.5 Discussion............................................................................................................ 120 5.5.1 Analysis of GR and GHL Profiles .............................................................. 120 5.6 Summary .............................................................................................................. 122 6. Laboratory Investigation of Geotextile Filtration by Rapid Retention Test – Effect of Geotextile Property .................................................................................................... 125 6.1 Introduction.......................................................................................................... 125 6.2 Description of RRT.............................................................................................. 126 6.3 Soil Specimen Preparation................................................................................... 129 6.4 Geotextiles Selected for Testing .......................................................................... 132 6.5 Testing Results..................................................................................................... 138 6.5.1 Compatibility of Tested Geotextiles and Soils ........................................... 138 6.5.2 Effect of Hydraulic Gradient Magnitude on RRT Outcomes ..................... 140 6.5.3 Influence of Soil Compaction on RRT Outcomes ...................................... 148 6.5.4 Effect of GT Thickness on the Clogging Process in RRT.......................... 152 6.5.5 Influence of Clay Content on GT Clogging................................................ 158 6.6 Summary .............................................................................................................. 159
v
7. Conclusions and Recommendations of Geotextile Filter Selection Guidelines ........ 162 7.1 Summary of Findings from this Study................................................................. 162 7.2 Recommendations for Filter Selection and Design ............................................. 169 7.2.1 Geotextile filter selection guidelines .......................................................... 169 7.2.2 Examples of filter selection ........................................................................ 175 7.2.3 Additional physical requirements for geotextiles: Survivability criteria... 176 7.3 Implementation: Step-by-Step Procedure ........................................................... 178 7.4 Recommendations for Future Study .................................................................... 183 References....................................................................................................................... 184 Appendix A Geotextile Retention Criteria in Published Literature .................................................... 198 Appendix B Geotextile Survivability Specifications. AASHTO-AGC-ARTBA, Task Force 25 and AASHTO M288.............................................................................................................. 201
vi
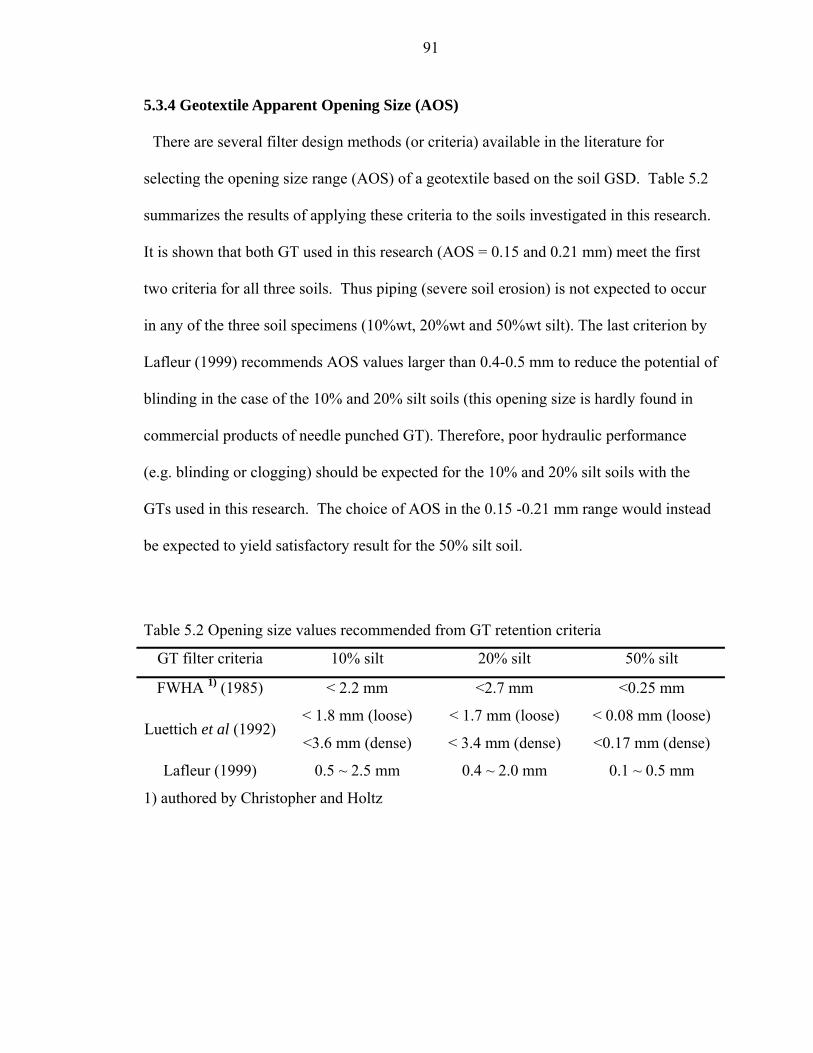
List of Tables
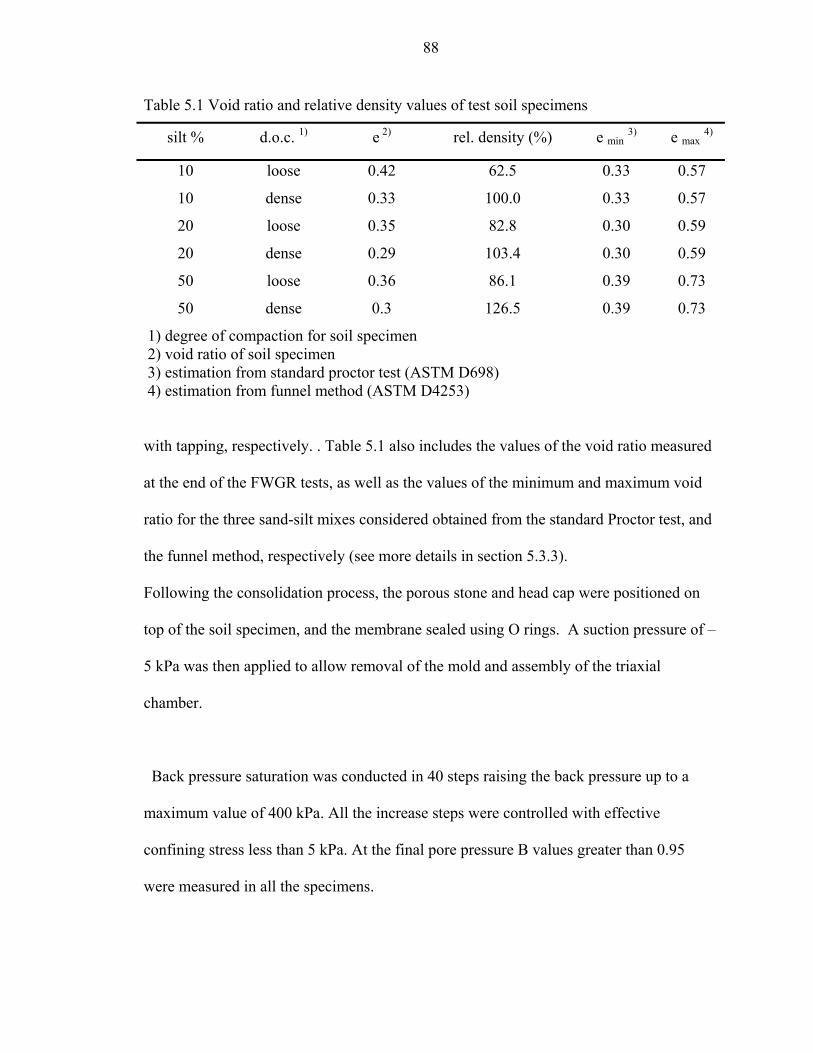
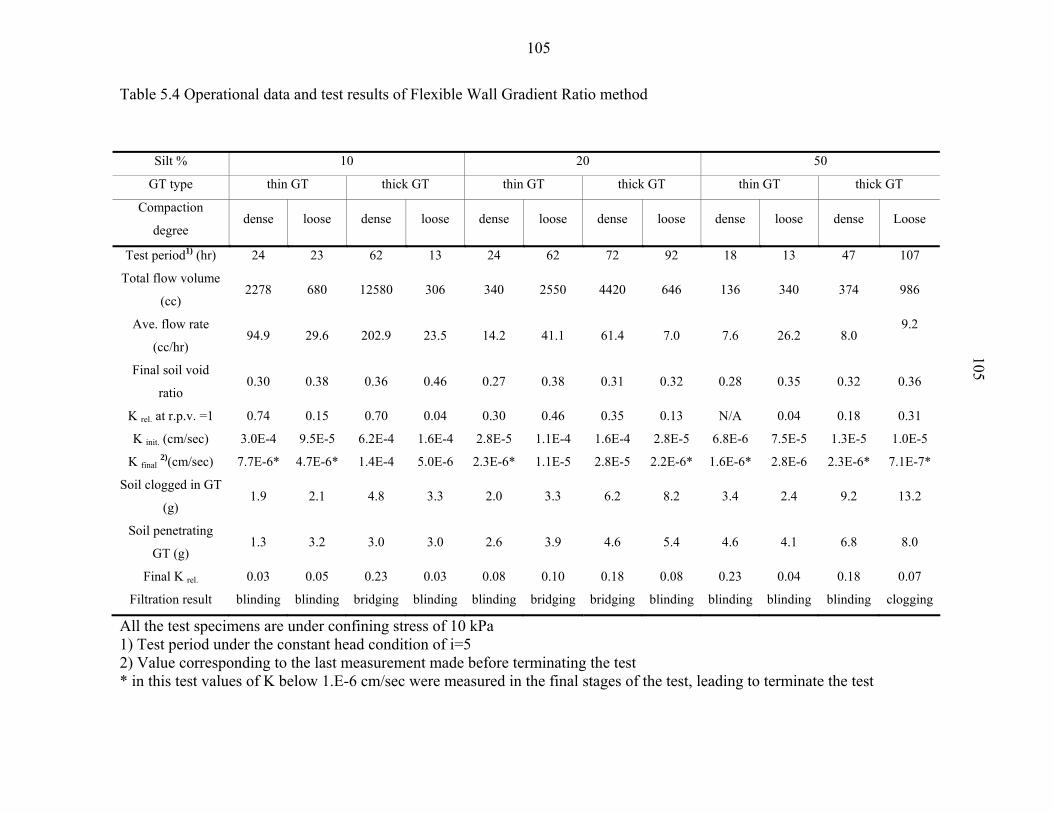
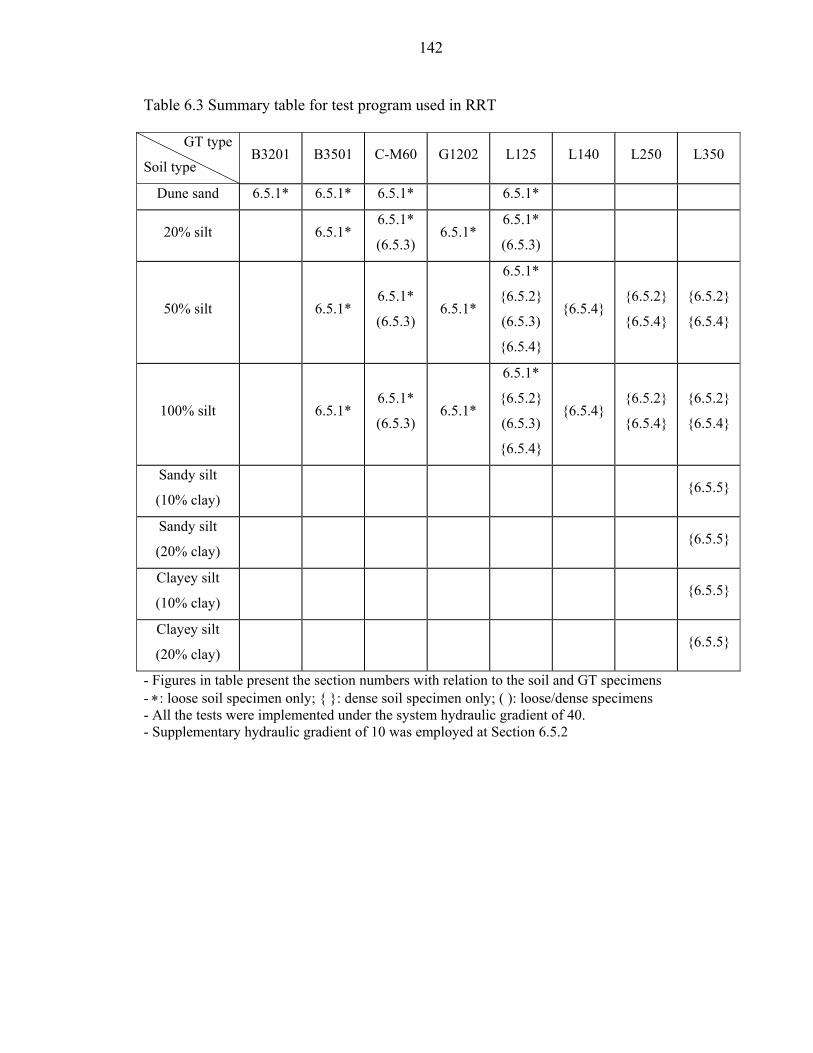
Table 2-1 Capability of selected geosynthetic filter design criteria to predict filter field performance, based on observation of exhumed samples at sites investigated by Koerner et al (1996) (after Wilson-Fahmy et al, 1996) .............................................................. 39 Table 3-1 Soil samples provided by INDOT ............................................................ 41 Table 3-2 Soil classifications for samples provided by INDOT............................... 41 Table 3-3 General information on video inspections of drainage pipes ................... 48 Table 4-1 Input parameters for the Brooks & Corey partially saturated materials model................................................................................................................................... 63 Table 4-2 Maximal gradient values from numerical simulations ............................. 67 Table 5-1 Void ratio and relative density values of test soil specimens................... 88 Table 5-2 Opening size values recommended from GT retention criteria................ 91 Table 5-3 Specs of non woven geotextiles in the constraint compression test (GSE, 2003)................................................................................................................................... 95 Table 5-4 Operational data and test results of flexible wall gradient ratio method 105 Table 6-1 Compositions of soil specimens used in RRT........................................ 130
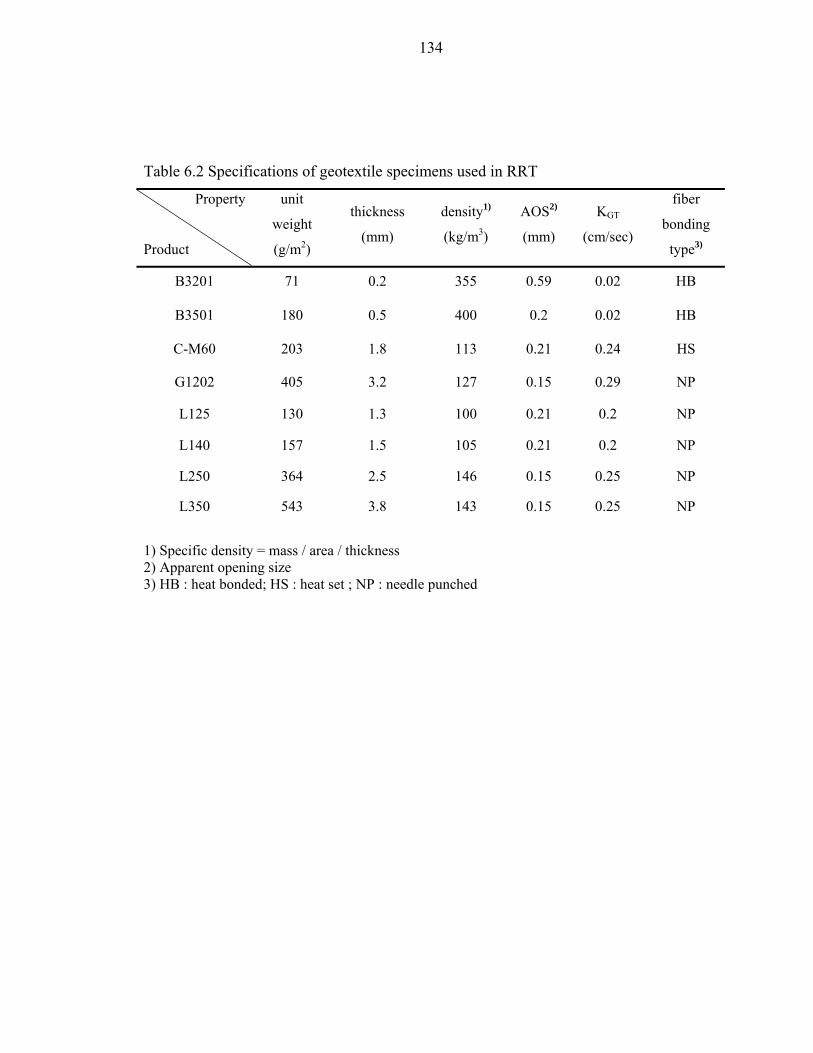
Table 6-2 Specifications of geotextile specimens used in RRT ................................ 134 Table 6-3 Summary table for test program used in RRT........................................... 142
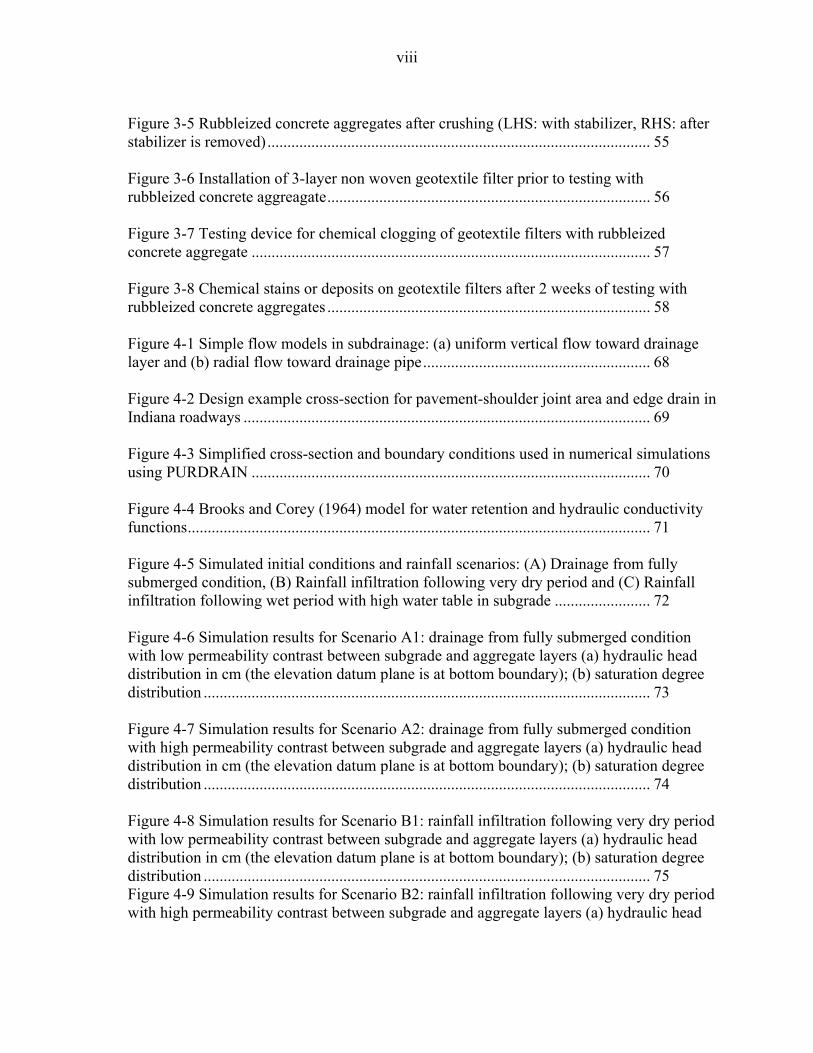
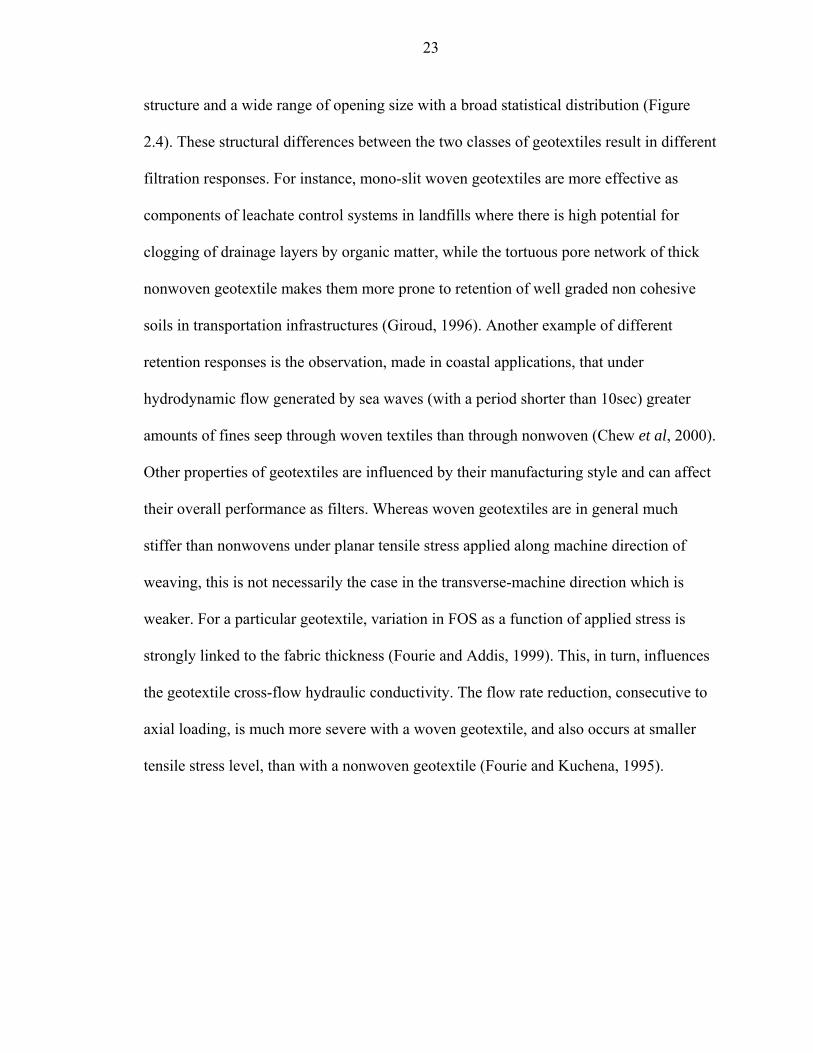
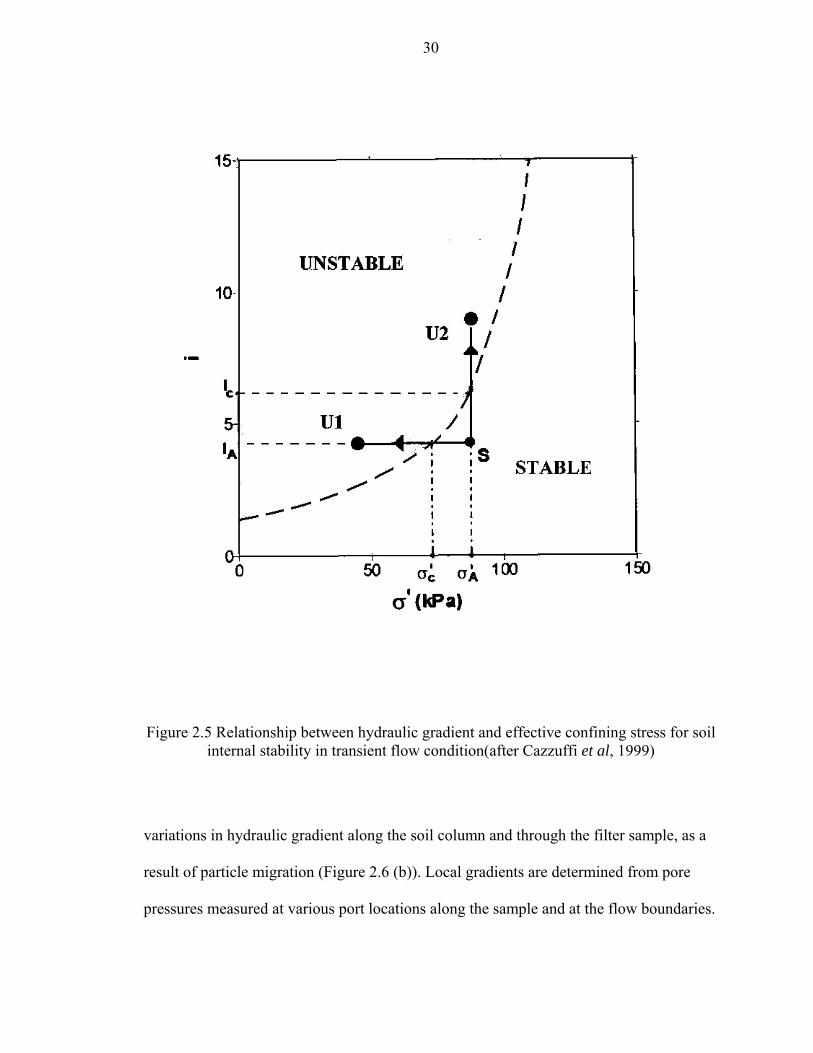
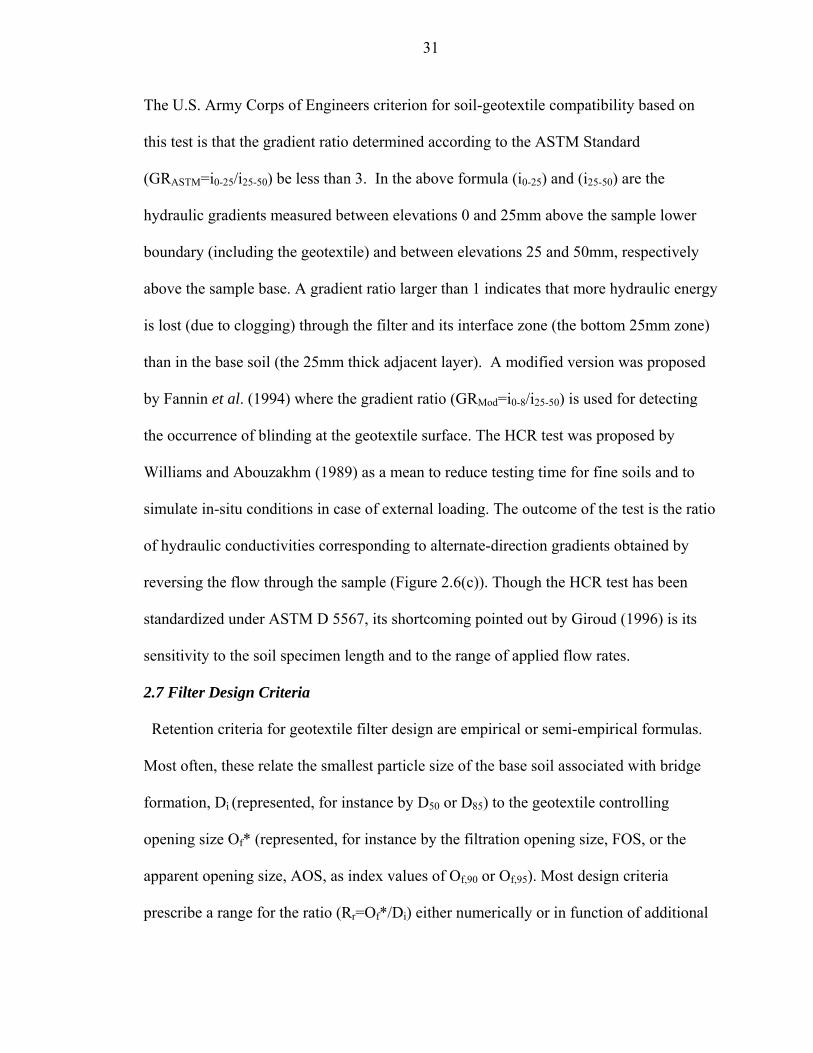
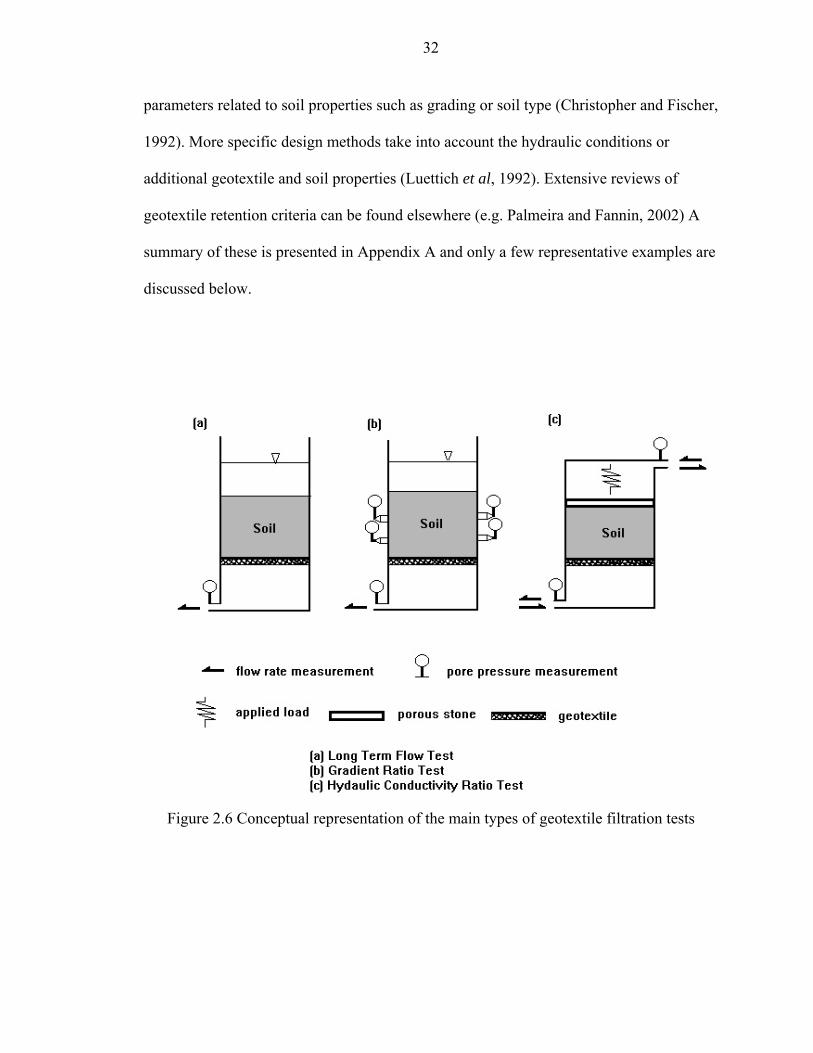
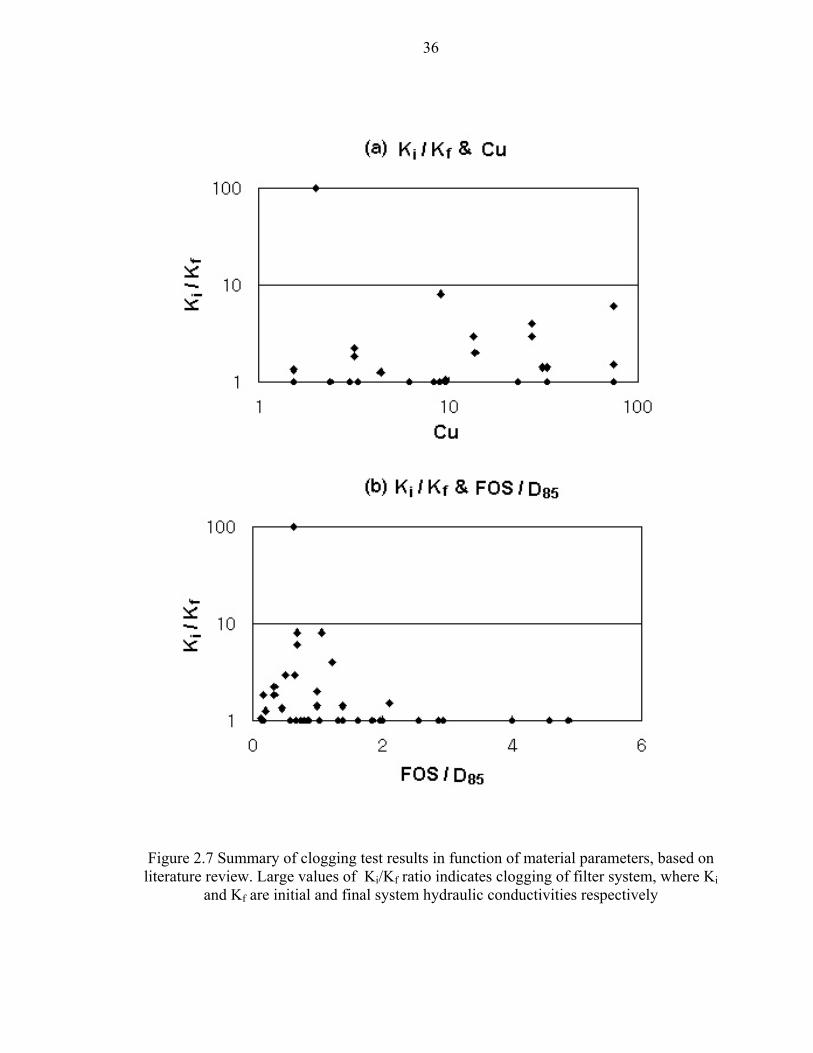
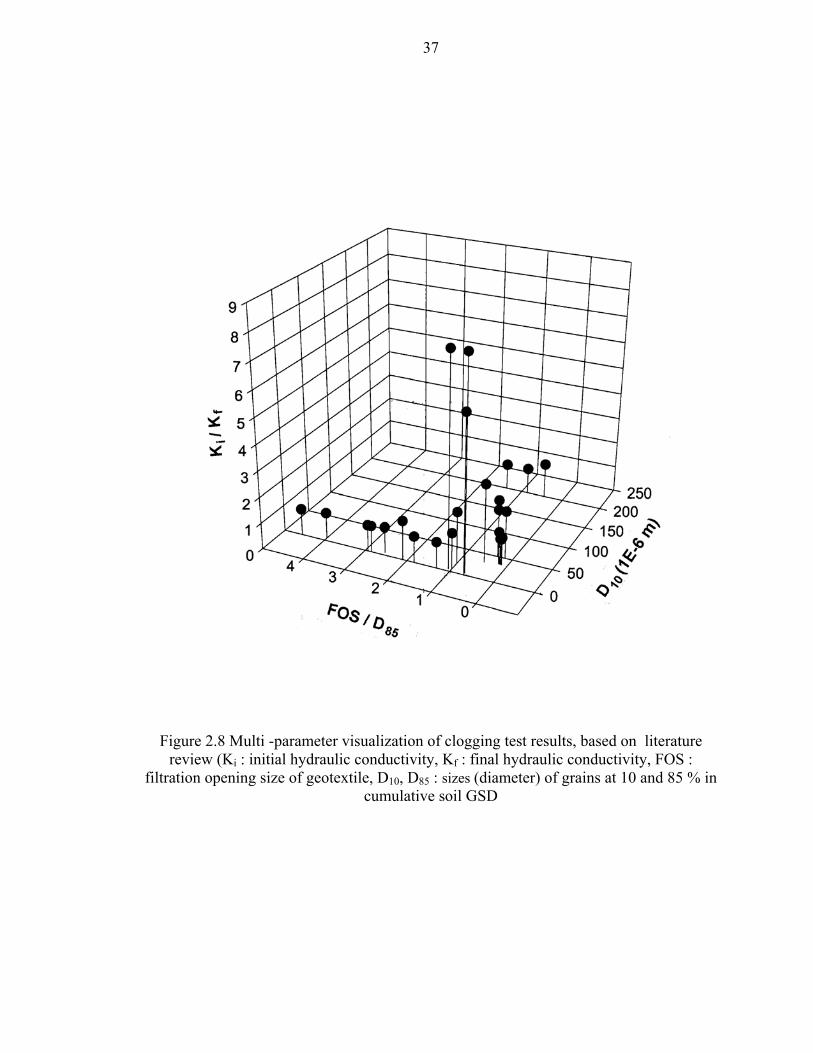
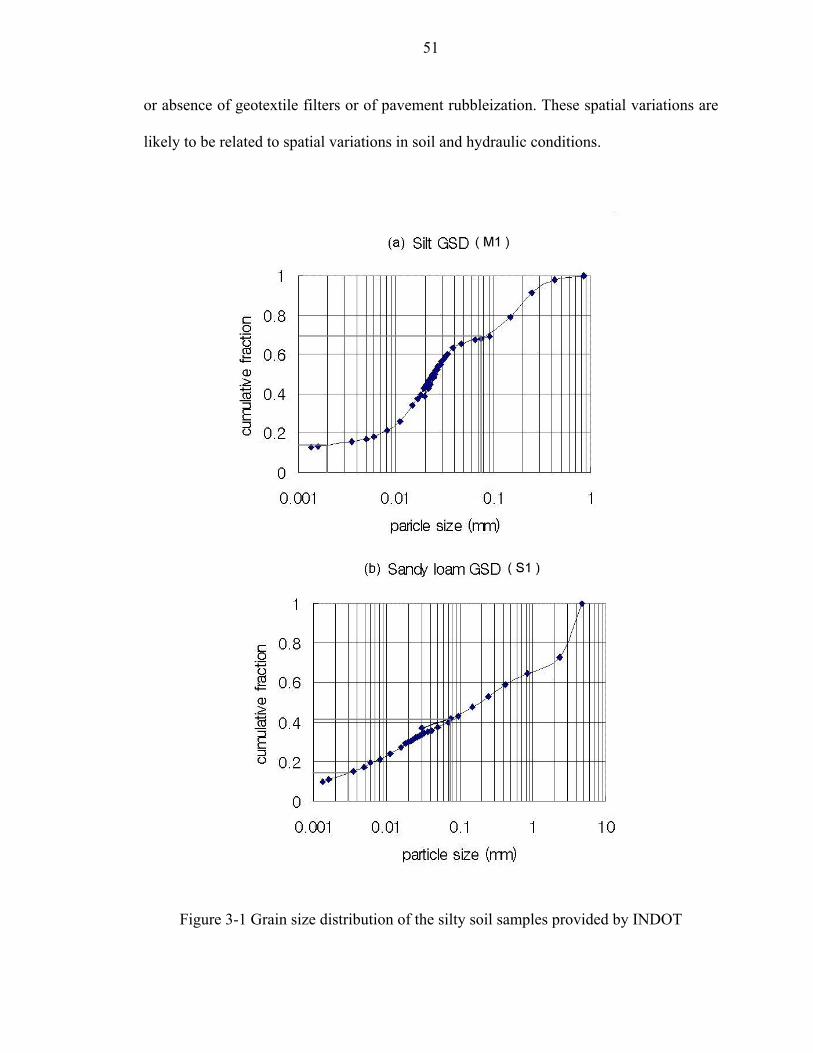
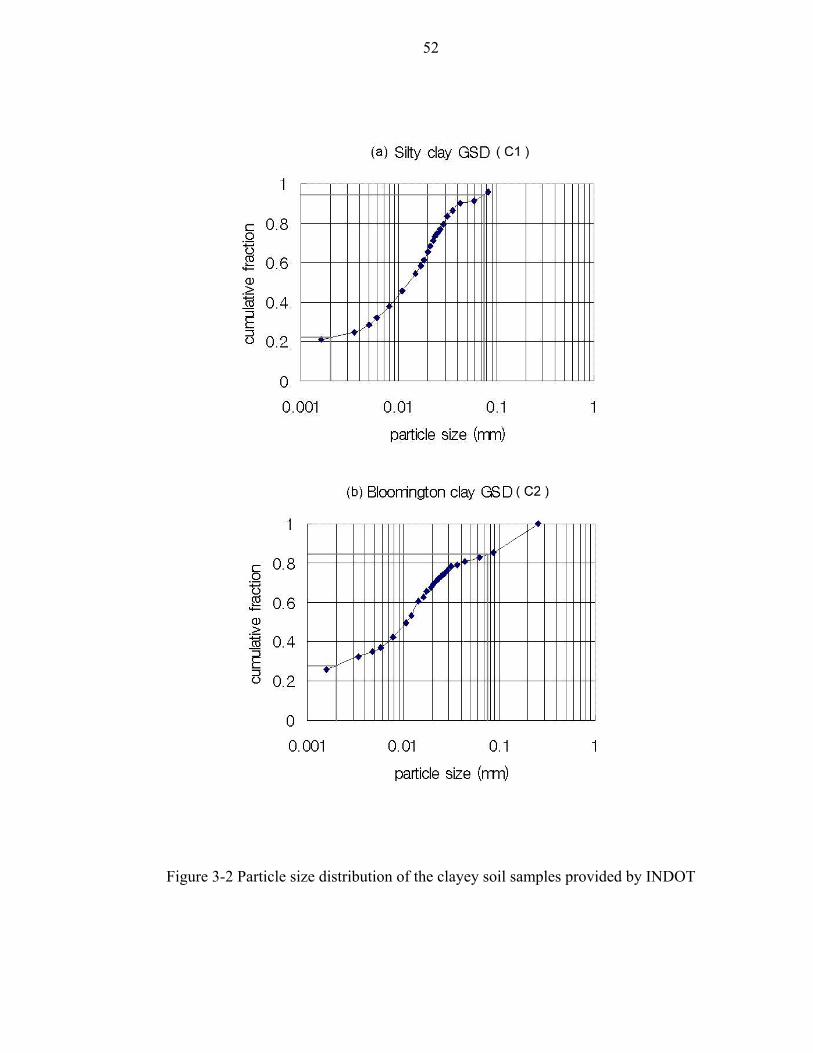
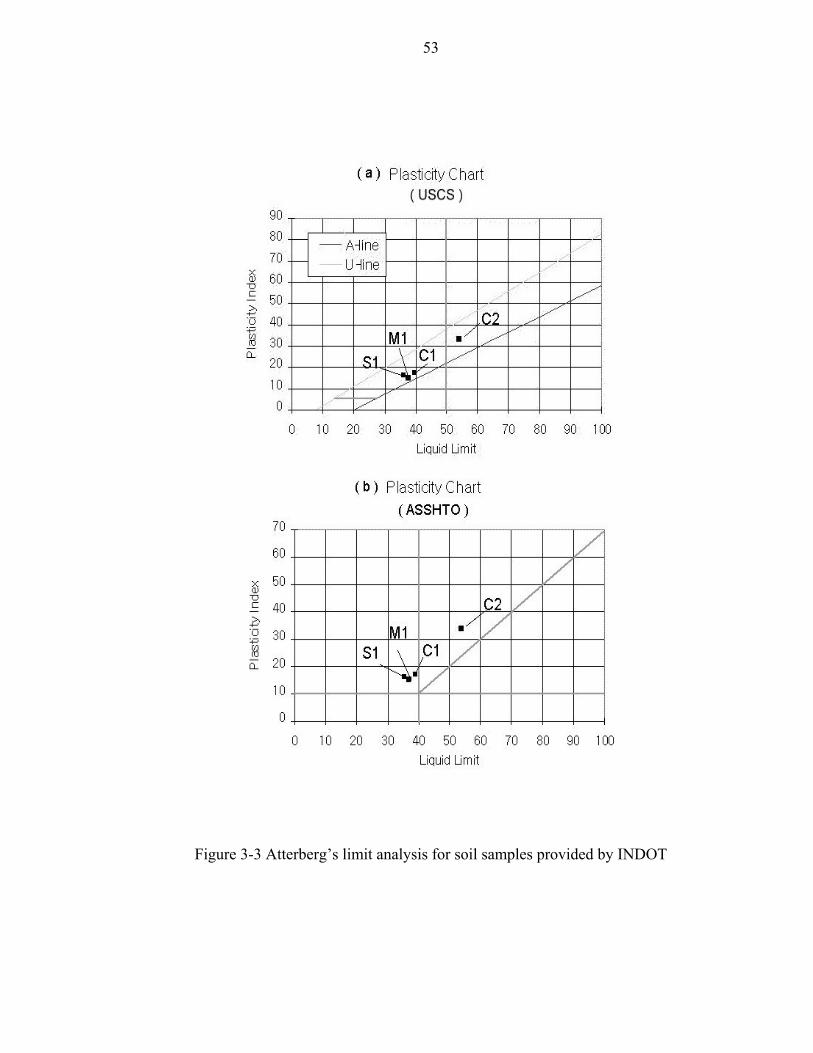
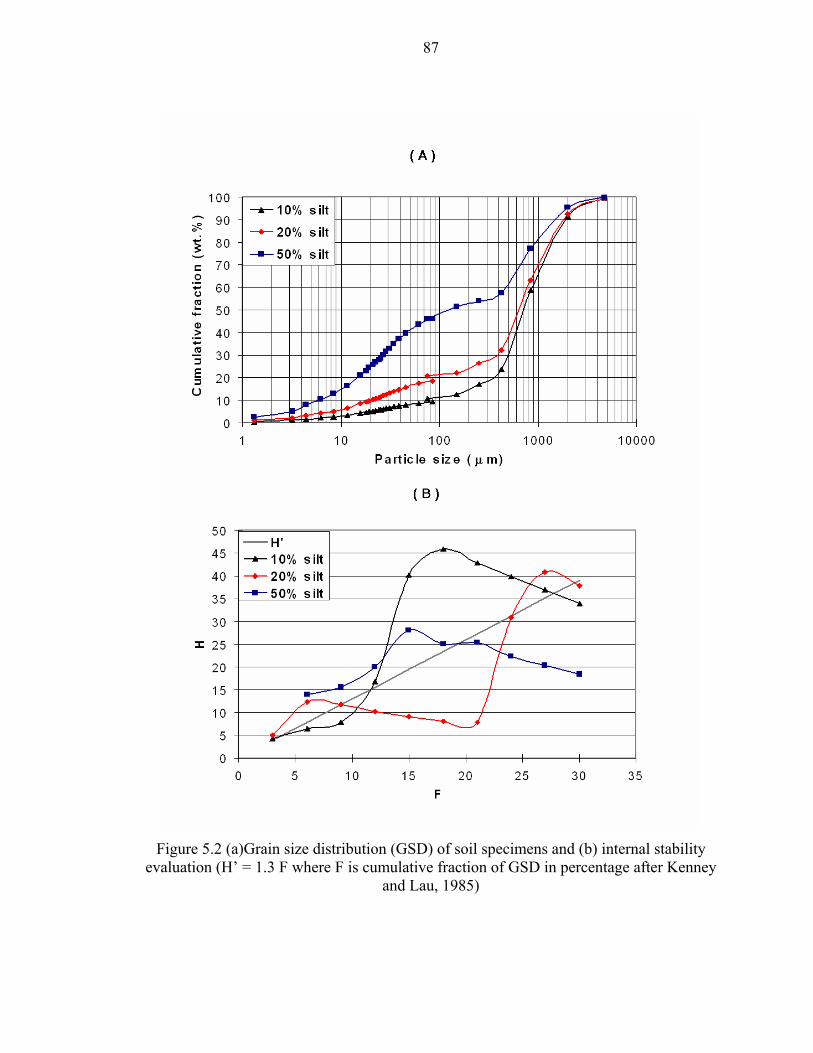
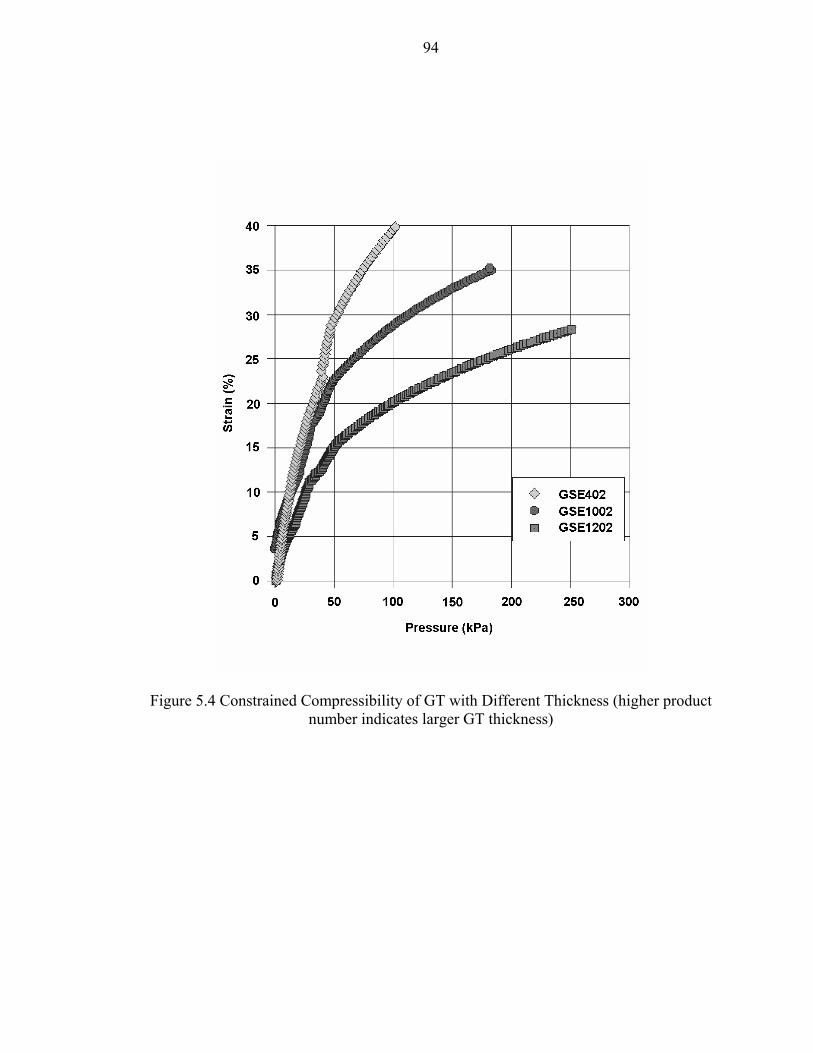
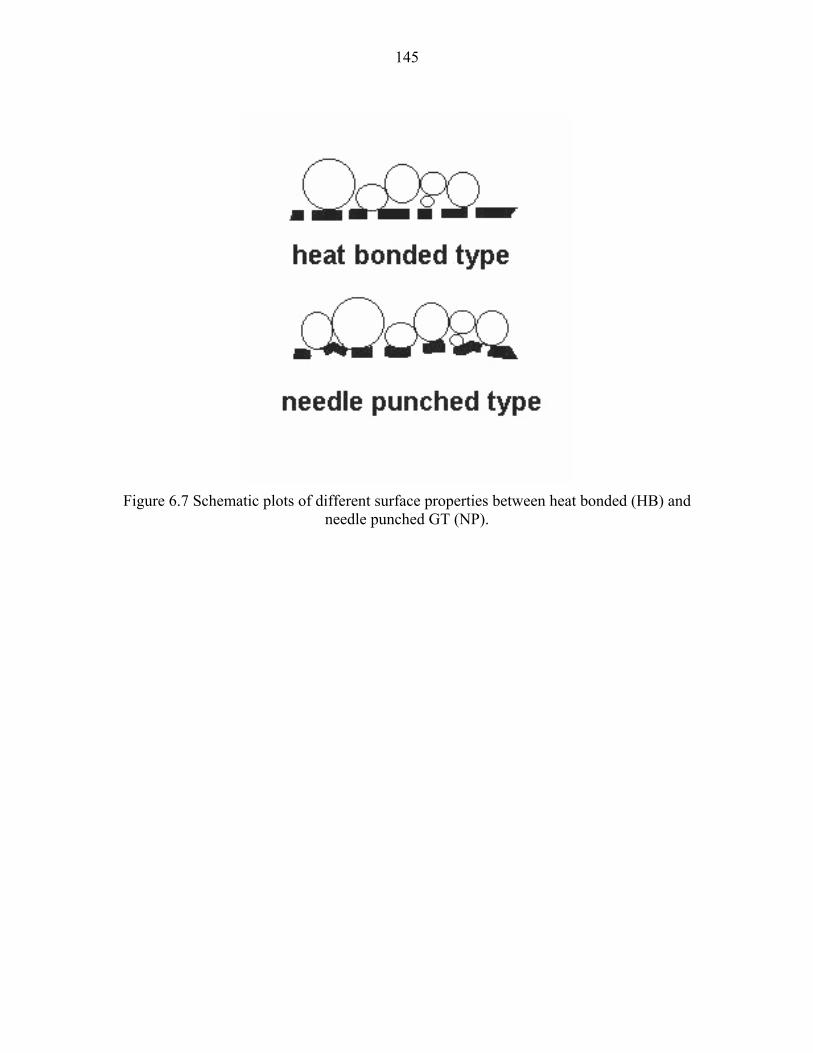
Figure 2-1 Piping(a), bridging(b) and blinding (c) mechanisms associated with Different geotextile opening size and soil behaviors (after Lafleur, 1999) – Left hand Side: soil grain size distribution (GSD) and its variation in the vicinity of the Geotextile (dotted curve: initial GSD; plain curve: final GSD; RR=Of/di; Of: filter Opening size; di: indicative particle size of protected soil) – Center-left: Schematics of resulting granular structure – Center-right: profile of resulting soil Hydraulic conductivity in function of distance to geotextile ( Bk : initial soil Hydraulic conductivity (dotted line)) – Right-hand side: evolution of system Average hydraulic conductivity in function of time, as compared to kF (virgin Hydraulic conductivity of geotextile ........................................................................ 12 Figure 2-2 Soil grading influence on internal stability (Kenney and Lau, 1985) WG: soils widely graded in range F=0.2-1.0; NG: soils narrowly graded in range F=0.3-1.0................................................................................................................... 15 Figure 2-3 Typical variation of system flow rate during cohesive soil filtration ......... (after Rollin and Lombard, 1988) ............................................................................. 18 Figure 2-4 Different weaving patterns for non woven and woven geotextiles (Te: elementary thickness) .................................................................................................................. 24 Figure 2-5 Relationship between hydraulic gradient and effective confining stress for soil internal stability in dynamic flow condition (after Cazzuffi et al, 1999).................. 30 Figure 2-6 Conceptual representation of the main types of geotextile clogging tests32 Figure 2-7 Summary of clogging test results in function of material parameters, based on literature review. Large values of Ki/Kf ratio indicates clogging of filter system, where Ki and Kf are initial and final system hydraulic conductivities respectively................. 36 Figure 2-8 Multi-parameter visualization of clogging test results, based on literature review (Ki: initial hydraulic conductivity, Kf: final hydraulic conductivity, FOS: filtration opening size of geotextile, D10, D85: sizes (diameter) of grains at 10 and 85% in cumulative soil GSD................................................................................................................................... 37 Figure 3-1 Grain size distribution of the silty soil samples provided by INDOT..... 51 Figure 3-2 Particle size distribution of the clayey soil samples provided by INDOT52 Figure 3-3 Atterberg’s limit analysis for soil samples provided by INDOT ............ 53 Figure 3-4 Two samples of the same geotextile filter from the Sullivan Co. US 41 site exhumed after 15 years of service: heavily clogged (left-hand side) and almost intact (right-hand side) .................................................................................................................. 54
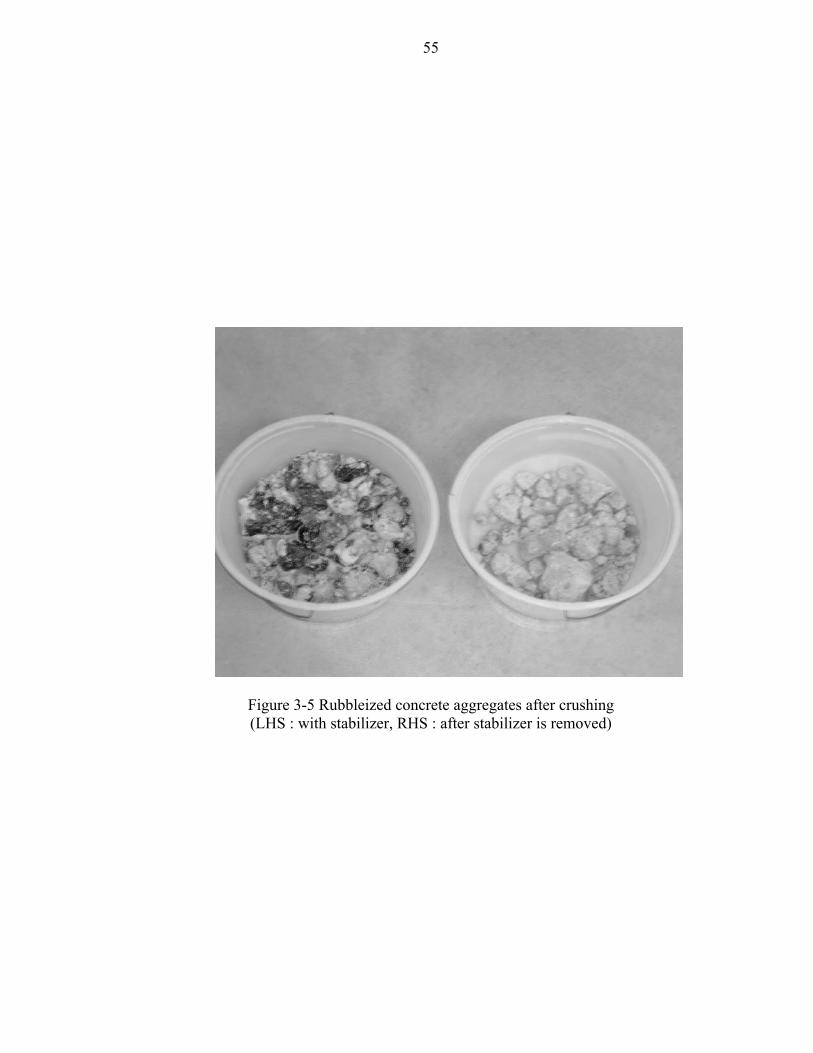
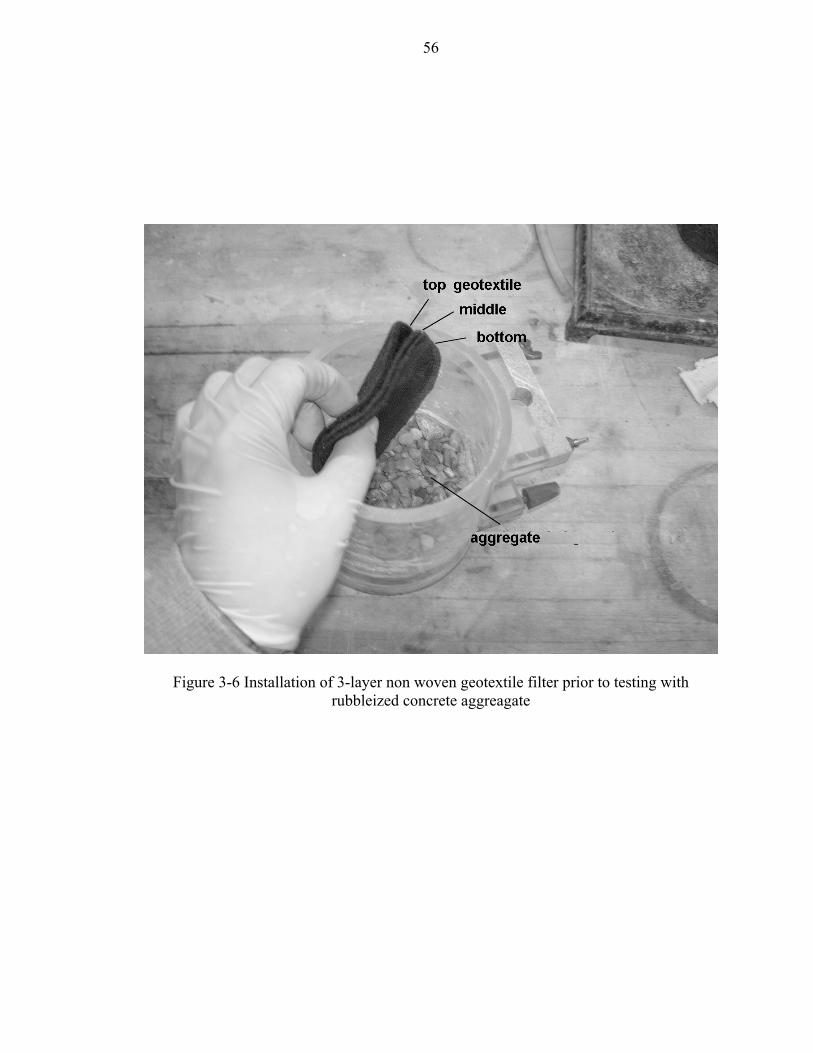
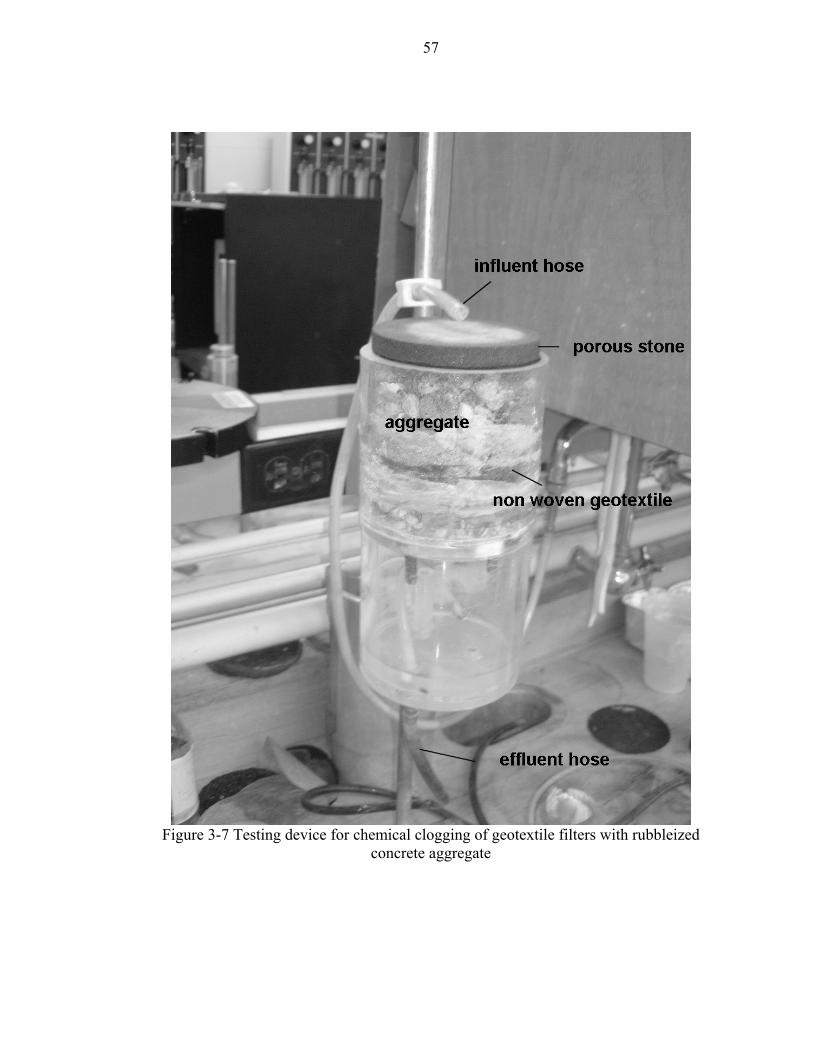
viii
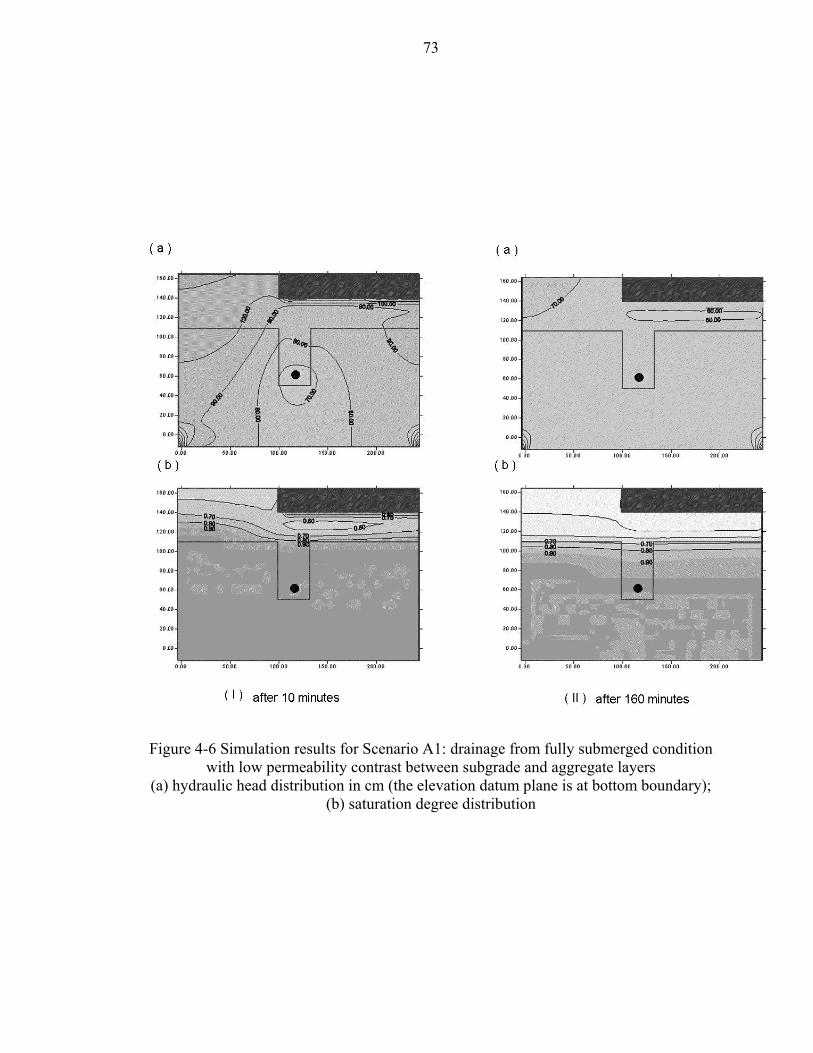
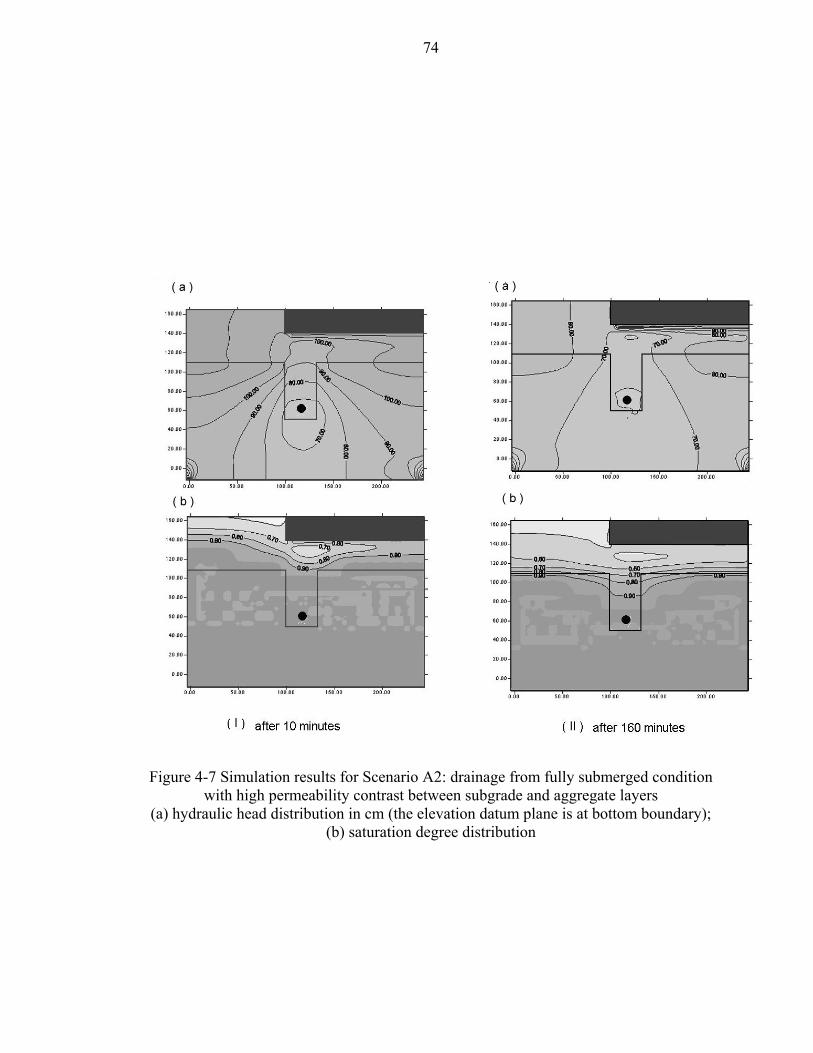
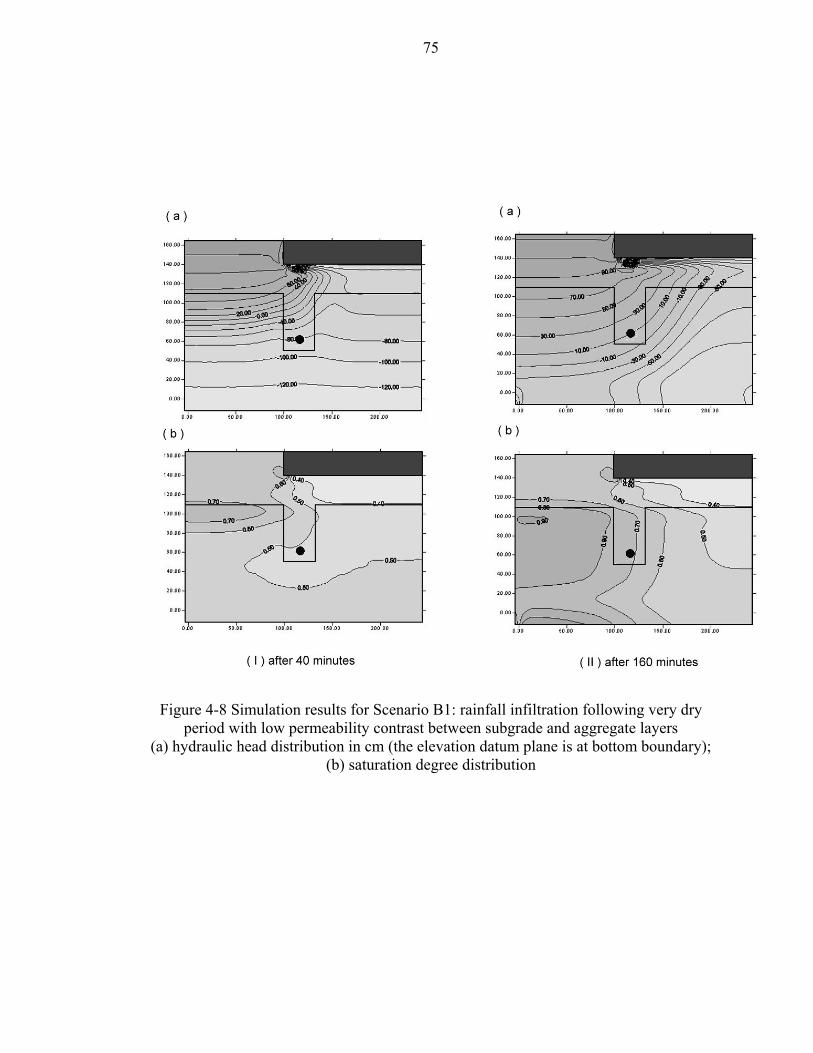
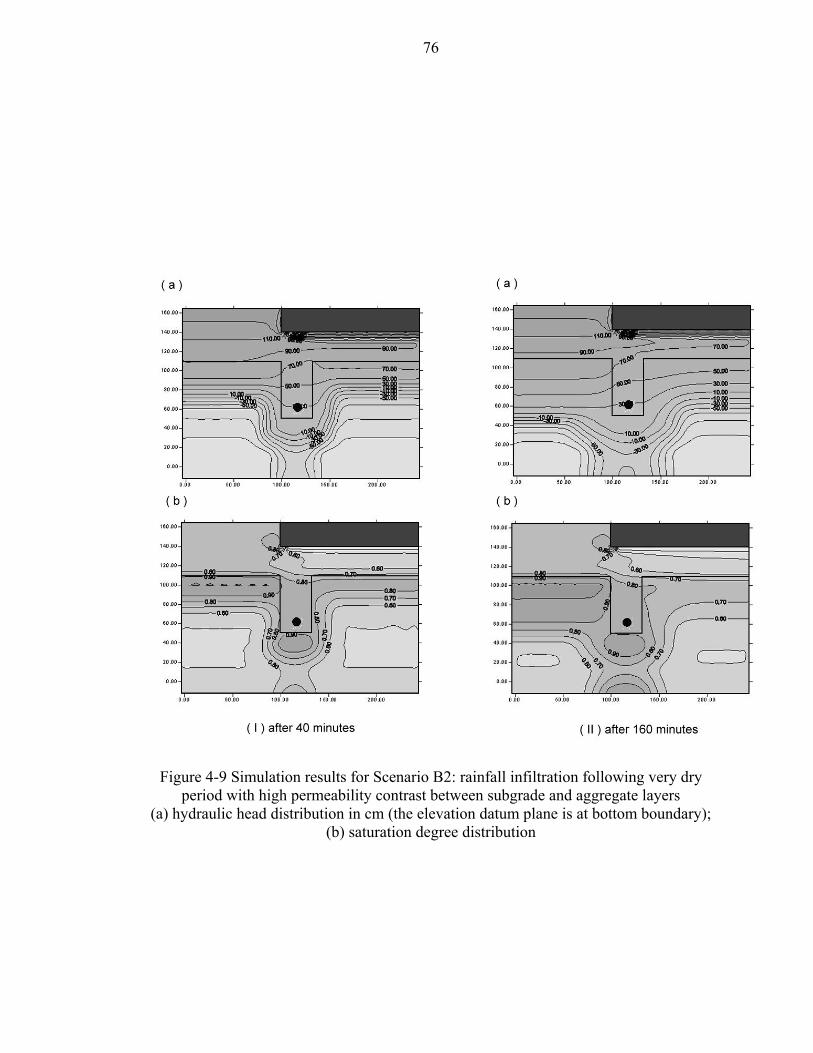
Figure 3-5 Rubbleized concrete aggregates after crushing (LHS: with stabilizer, RHS: after stabilizer is removed)................................................................................................ 55 Figure 3-6 Installation of 3-layer non woven geotextile filter prior to testing with rubbleized concrete aggreagate................................................................................. 56 Figure 3-7 Testing device for chemical clogging of geotextile filters with rubbleized concrete aggregate .................................................................................................... 57 Figure 3-8 Chemical stains or deposits on geotextile filters after 2 weeks of testing with rubbleized concrete aggregates ................................................................................. 58 Figure 4-1 Simple flow models in subdrainage: (a) uniform vertical flow toward drainage layer and (b) radial flow toward drainage pipe......................................................... 68 Figure 4-2 Design example cross-section for pavement-shoulder joint area and edge drain in Indiana roadways ...................................................................................................... 69 Figure 4-3 Simplified cross-section and boundary conditions used in numerical simulations using PURDRAIN .................................................................................................... 70 Figure 4-4 Brooks and Corey (1964) model for water retention and hydraulic conductivity functions.................................................................................................................... 71 Figure 4-5 Simulated initial conditions and rainfall scenarios: (A) Drainage from fully submerged condition, (B) Rainfall infiltration following very dry period and (C) Rainfall infiltration following wet period with high water table in subgrade ........................ 72 Figure 4-6 Simulation results for Scenario A1: drainage from fully submerged condition with low permeability contrast between subgrade and aggregate layers (a) hydraulic head distribution in cm (the elevation datum plane is at bottom boundary); (b) saturation degree distribution ................................................................................................................ 73 Figure 4-7 Simulation results for Scenario A2: drainage from fully submerged condition with high permeability contrast between subgrade and aggregate layers (a) hydraulic head distribution in cm (the elevation datum plane is at bottom boundary); (b) saturation degree distribution ................................................................................................................ 74 Figure 4-8 Simulation results for Scenario B1: rainfall infiltration following very dry period with low permeability contrast between subgrade and aggregate layers (a) hydraulic head distribution in cm (the elevation datum plane is at bottom boundary); (b) saturation degree distribution ................................................................................................................ 75 Figure 4-9 Simulation results for Scenario B2: rainfall infiltration following very dry period with high permeability contrast between subgrade and aggregate layers (a) hydraulic head
ix
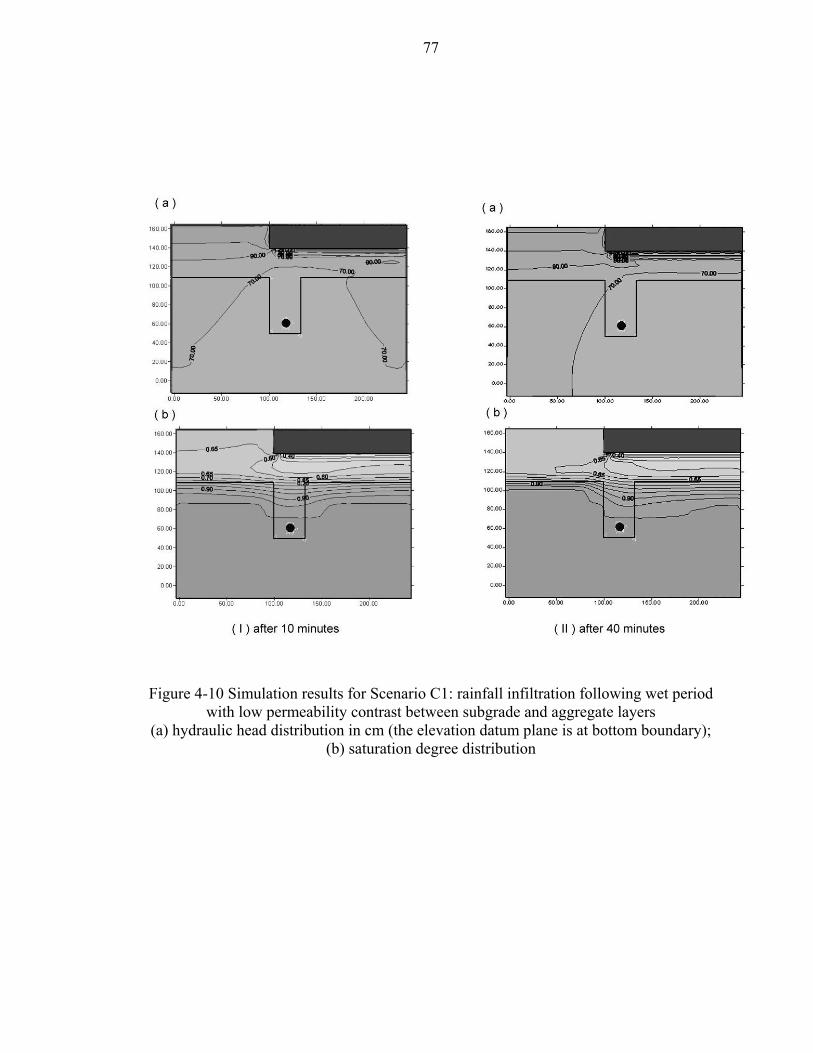
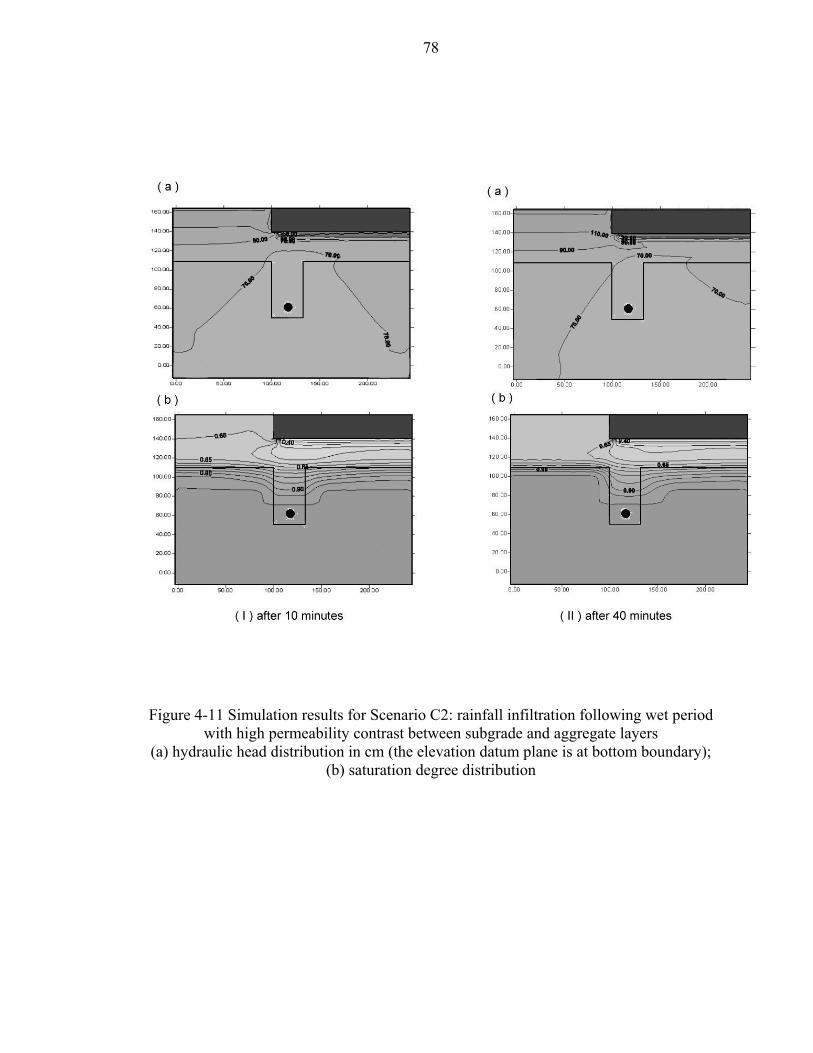
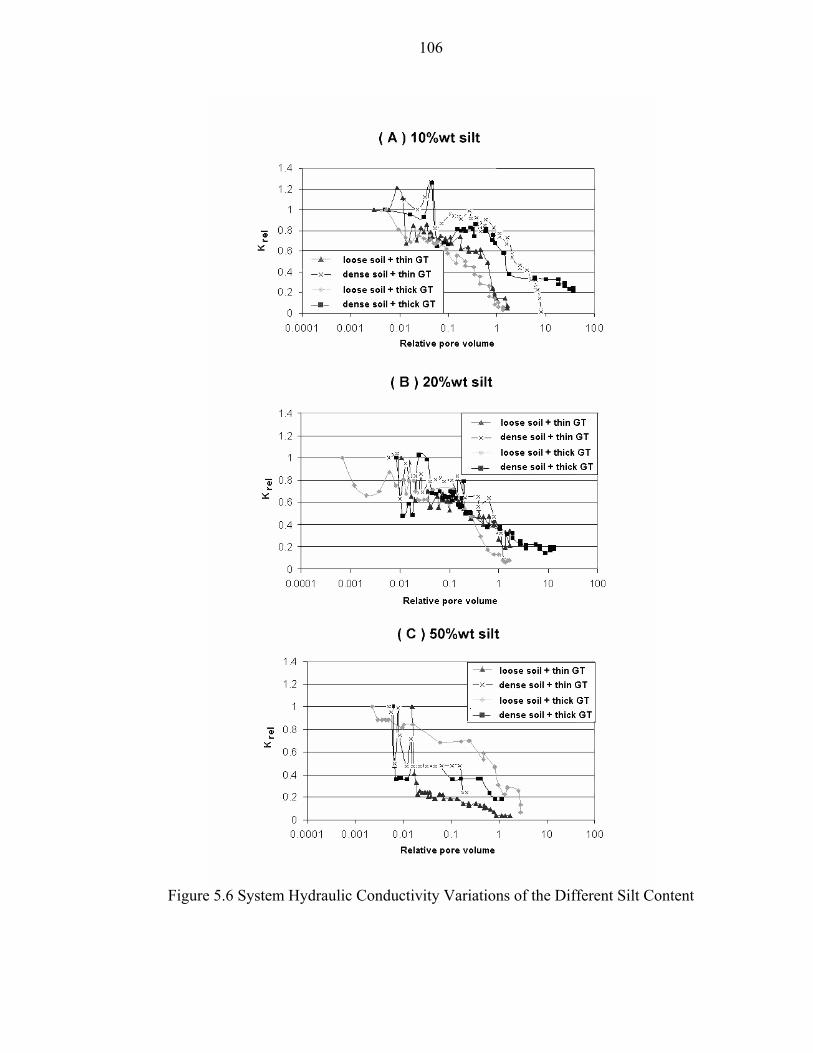
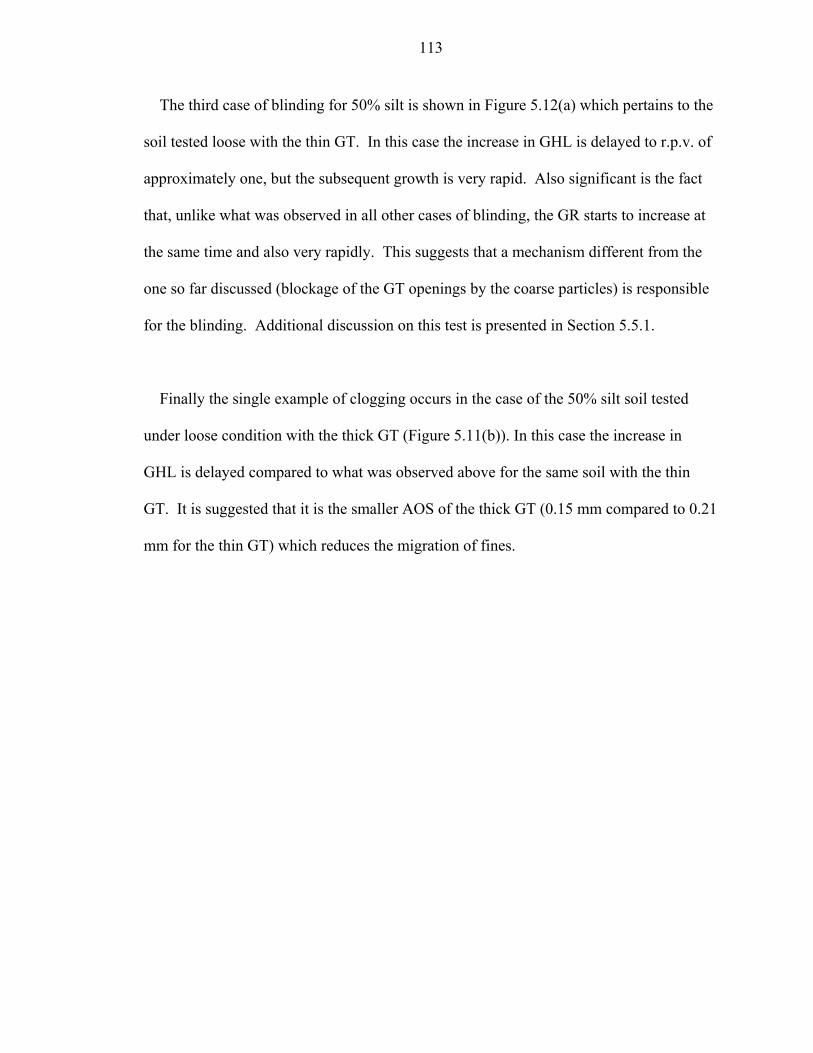
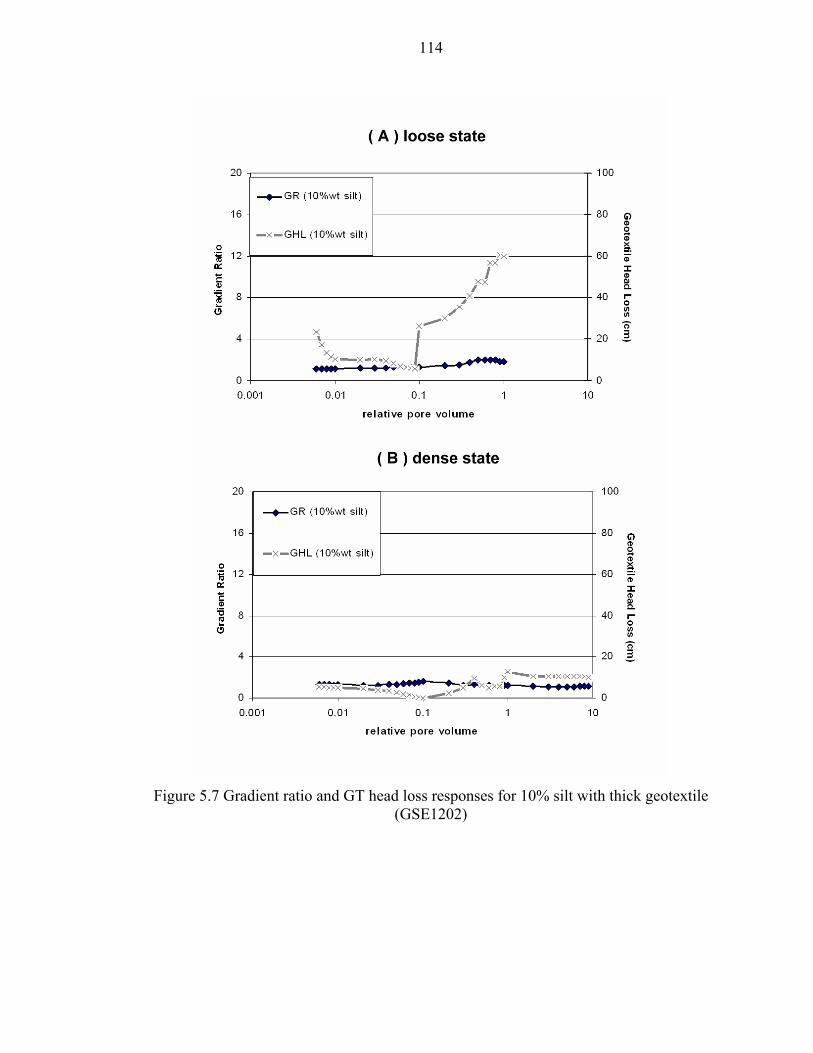
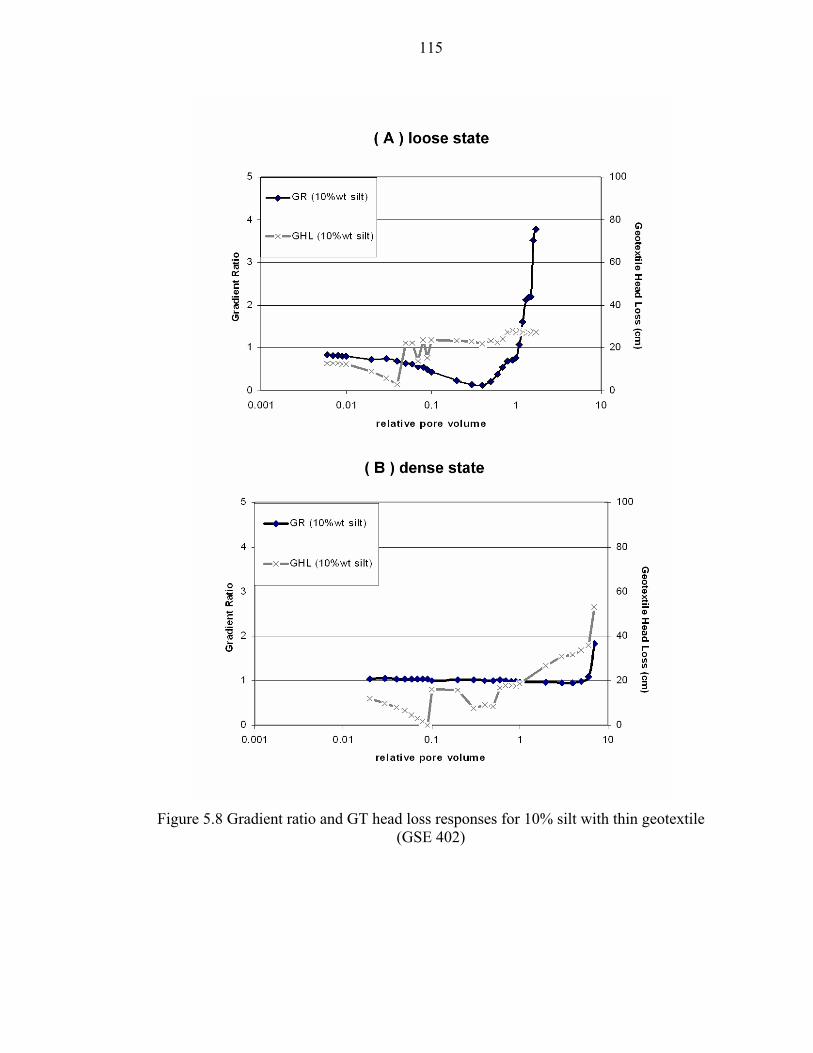
distribution in cm (the elevation datum plane is at bottom boundary); (b) saturation degree distribution ................................................................................................................ 76 Figure 4-10 Simulation results for Scenario C1: rainfall infiltration following wet period with low permeability contrast between subgrade and aggregate layers (a) hydraulic head distribution in cm (the elevation datum plane is at bottom boundary); (b) saturation degree distribution ................................................................................................................ 77 Figure 4-11 Simulation results for Scenario C2: rainfall infiltration following wet period with high permeability contrast between subgrade and aggregate layers (a) hydraulic head distribution in cm (the elevation datum plane is at bottom boundary); (b) saturation degree distribution ................................................................................................................ 78 Figure 5-1 Port locations and soil column specs in FWGR test ............................... 84 Figure 5-2 (a) Grain size distribution (GSD) of soil specimens and (b) internal stability evaluation (H’ = 1.3 F where F is cumulative fraction of GSD in percentage (after Kenney and Lau, 1985))......................................................................................................... 87 Figure 5-3 (a) Compaction test results for different fine contents by various method types and (b) the comparable reference data (Thevanayagam et al, 2002)........................ 93 Figure 5-4 Constrained Compressibility of GT with Different Thickness (higher product number indicates larger GT thickness) ..................................................................... 94 Figure 5-5 Conversion of real test data into relative parameters (for the loosely deposited soils filtered by a thick GT (GSE1202)) ................................................................. 104 Figure 5-6 System hydraulic conductivity variations of the different silt content . 106 Figure 5-7 Gradient ratio and GT head loss responses for 10% silt with thick geotextile (GSE1202) .............................................................................................................. 114 Figure 5-8 Gradient ratio and GT head loss responses for 10% silt with thin geotextile (GSE 402) ......................................................................................................................... 115 Figure 5-9 Gradient ratio and GT head loss responses for 20% silt with thick geotextile (GSE 1202) ............................................................................................................. 116 Figure 5-10 Gradient ratio and GT head loss responses for 20% silt with thin geotextile (GSE 402) ............................................................................................................... 117
Figure 5-11 Gradient ratio and GT head loss responses for 50% silt with thick geotextile (GSE 1202)............................................................................................. 118 Figure 5-12 Gradient ratio and GT head loss responses for 50% silt with thin geotextile (GSE 402)............................................................................................... 119
x
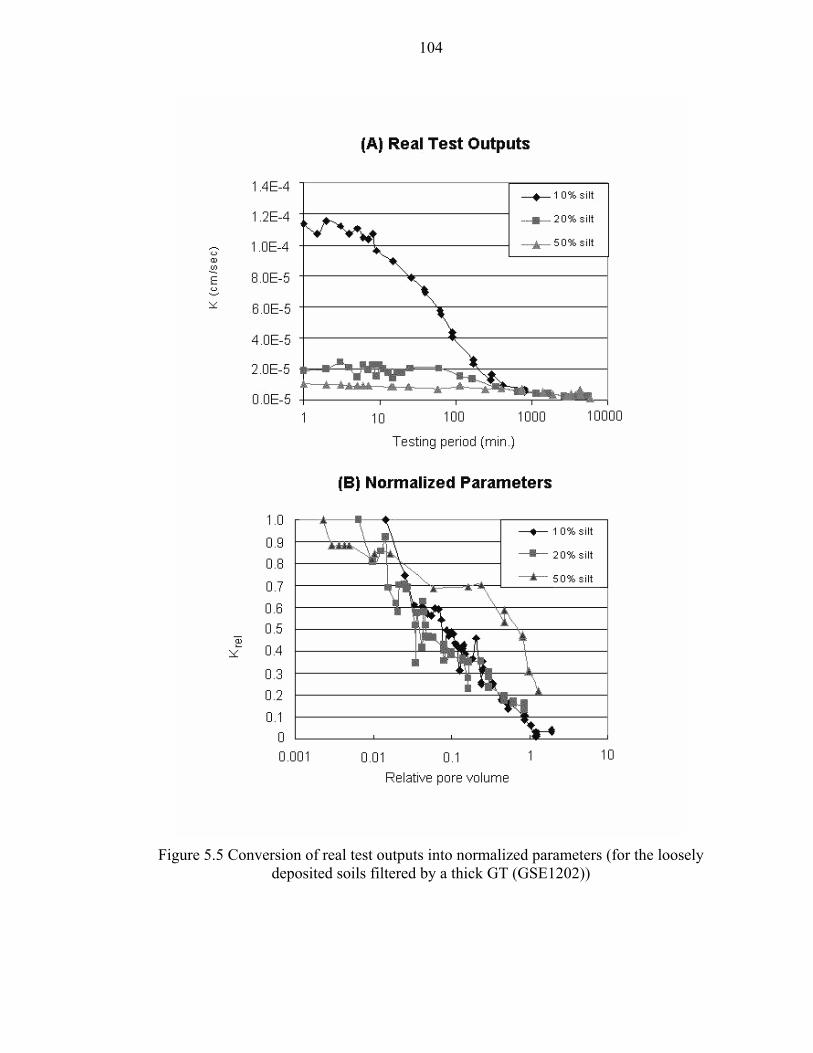
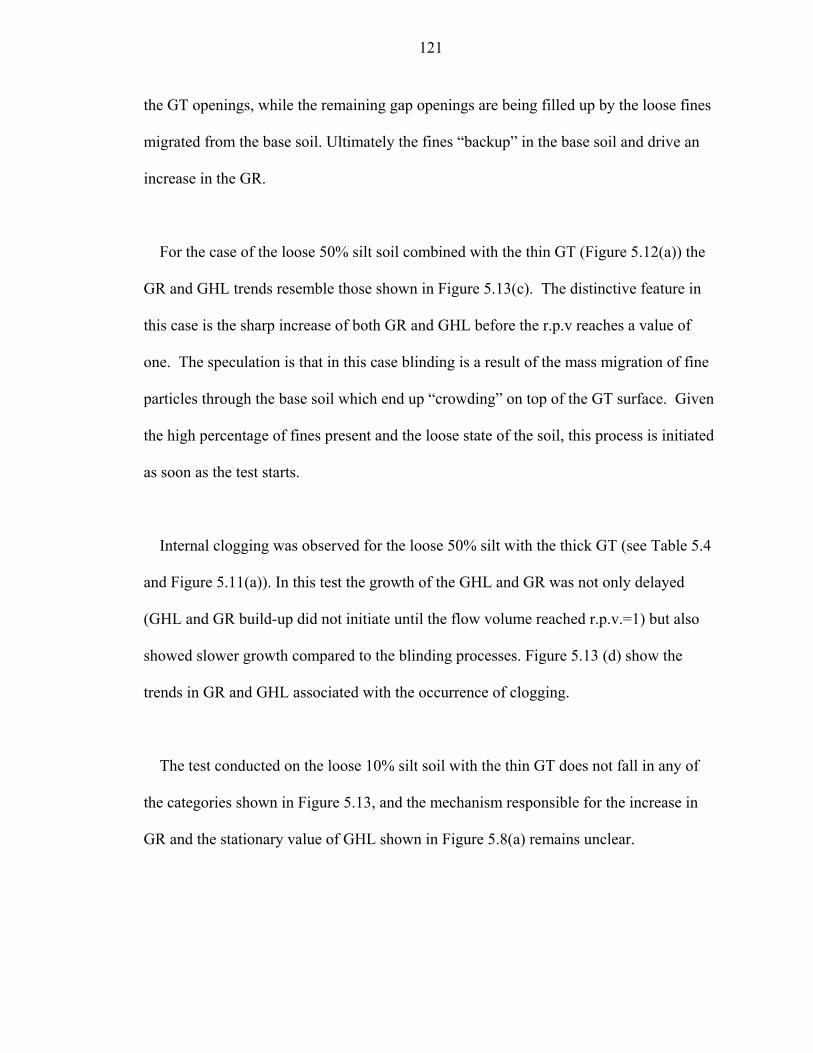
Figure 5-13 Summary of GR and GHL variations for each different clogging mechanism the filtration results are classified in Table 5.4) .................................. 122
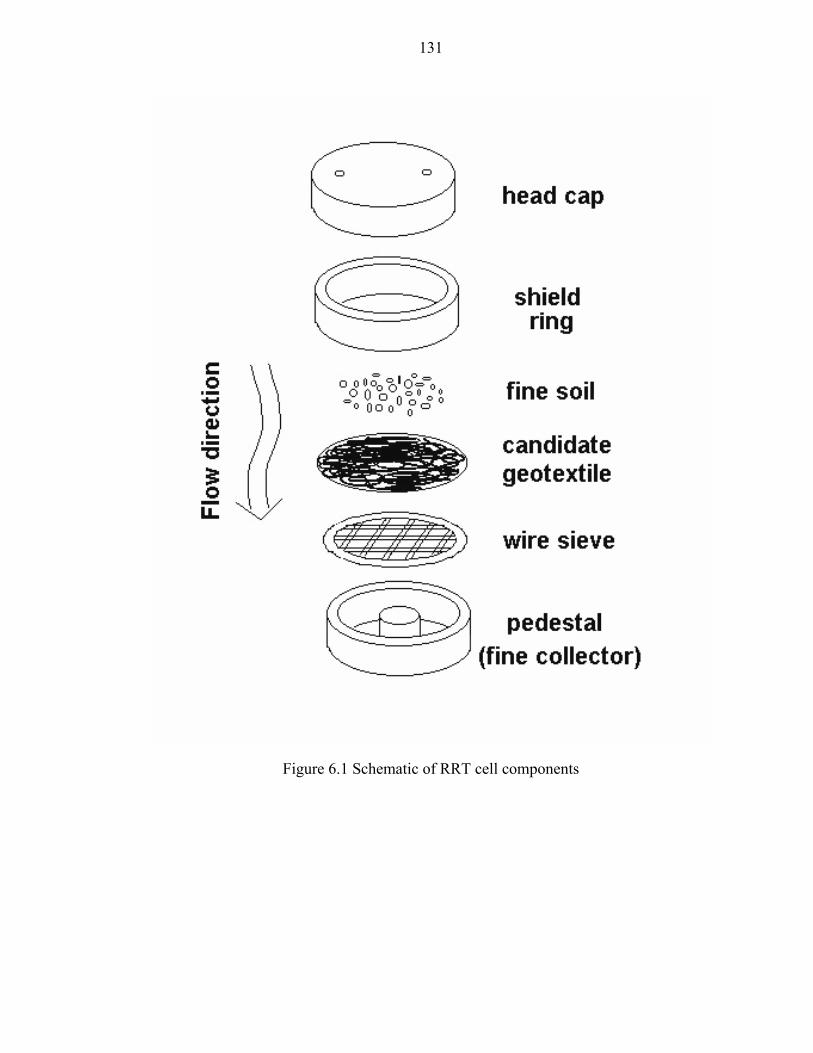
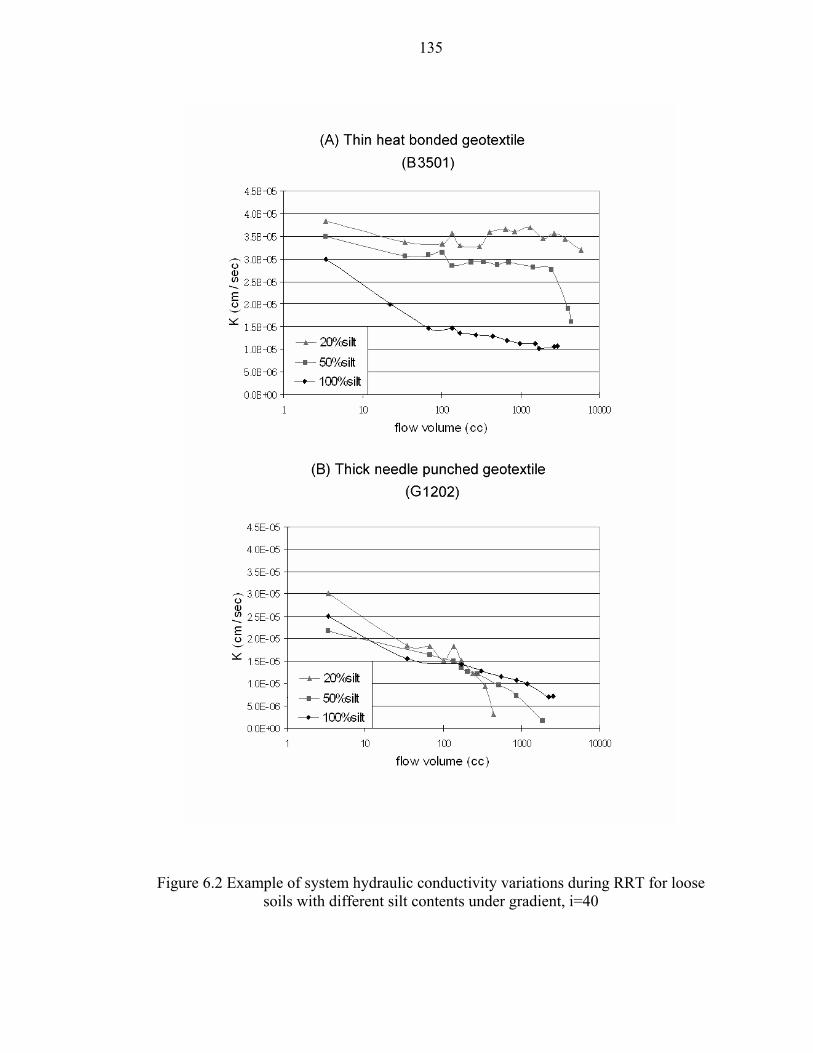
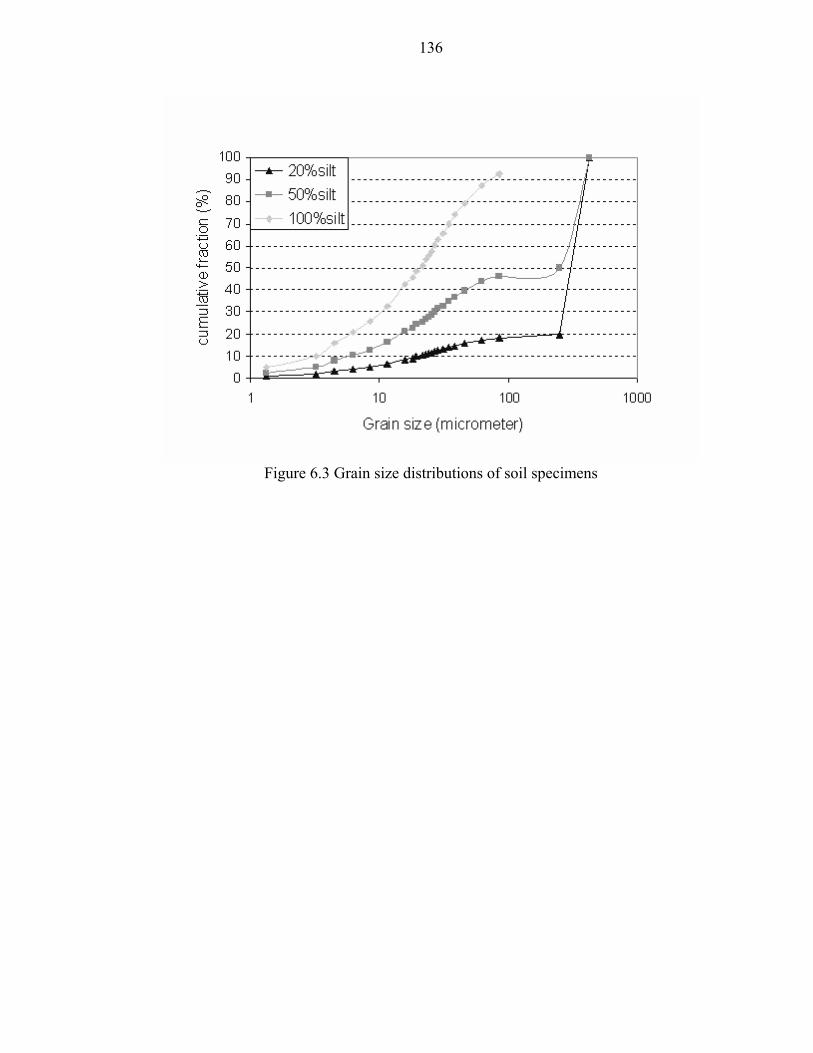
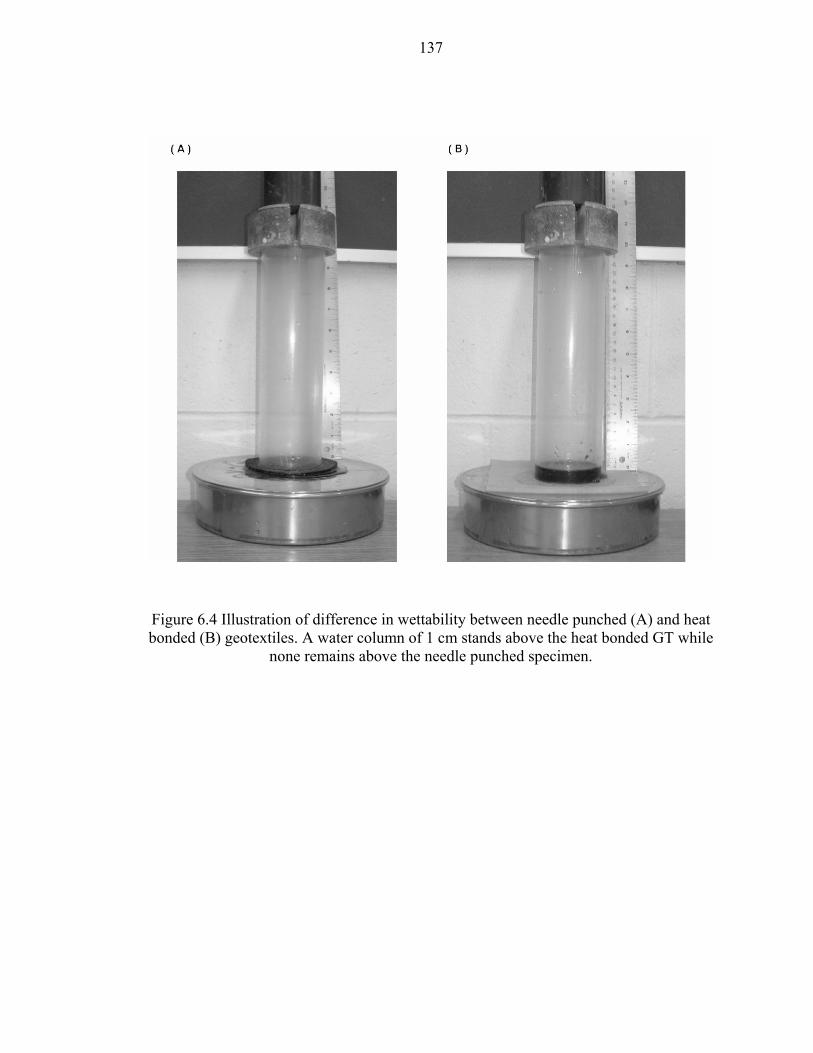
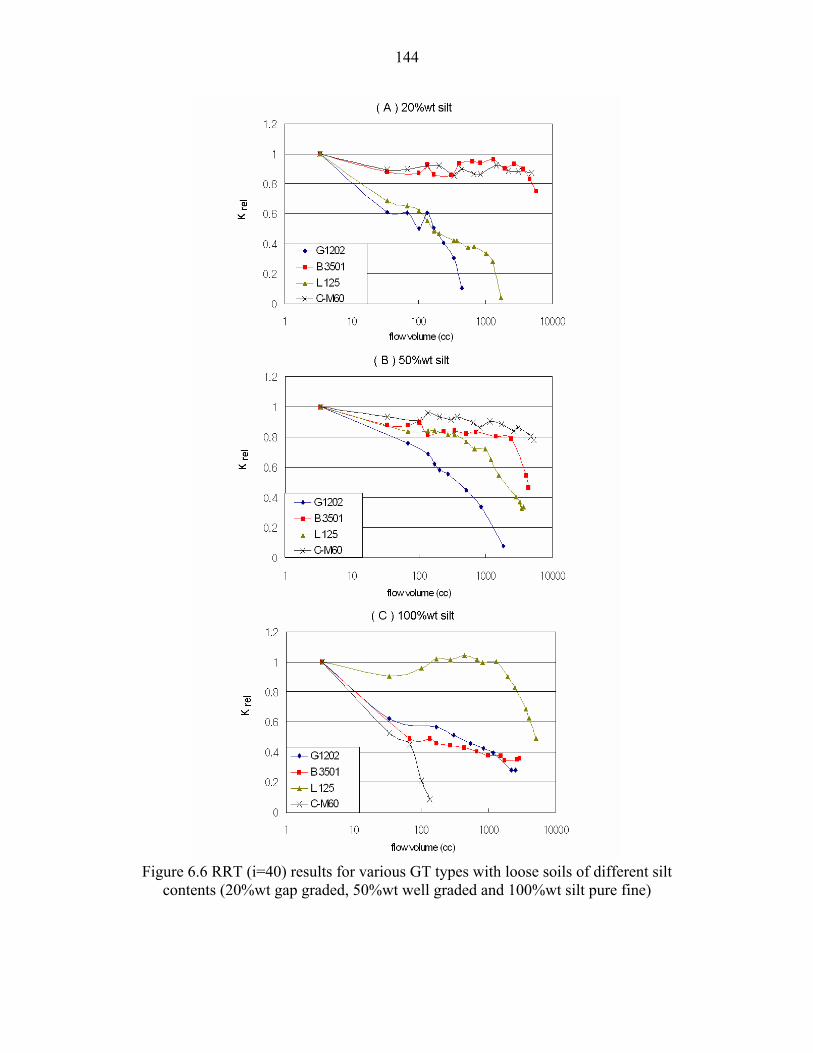
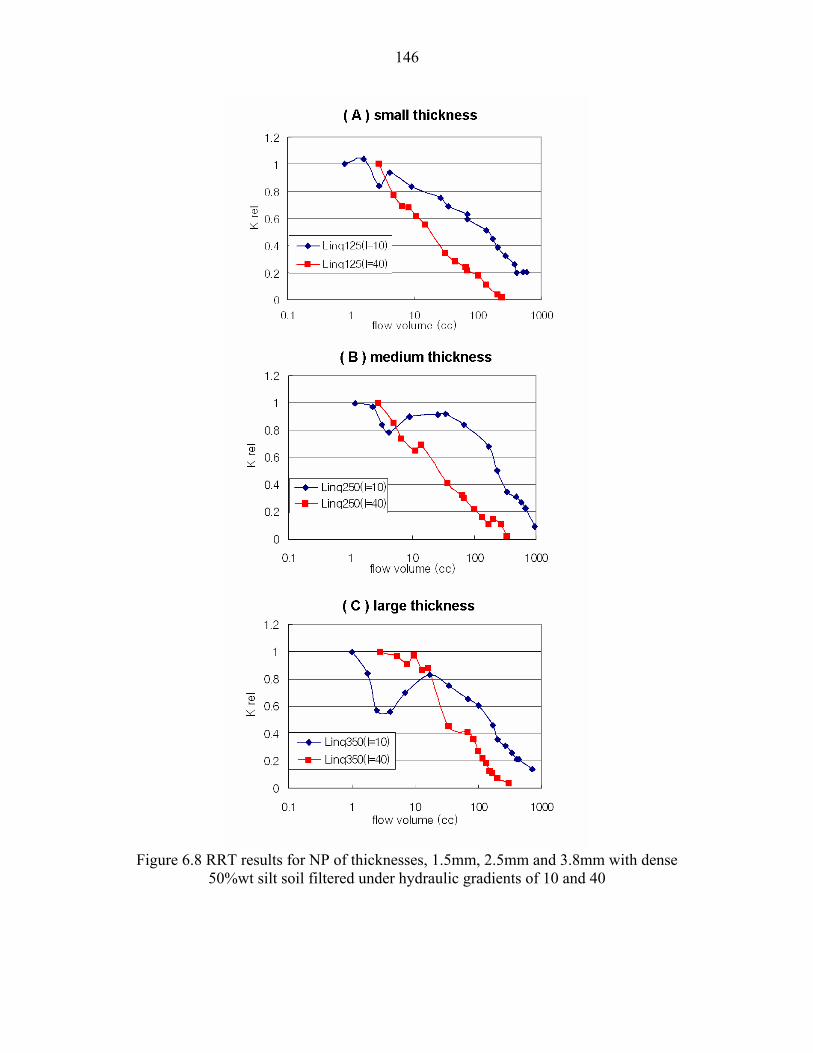
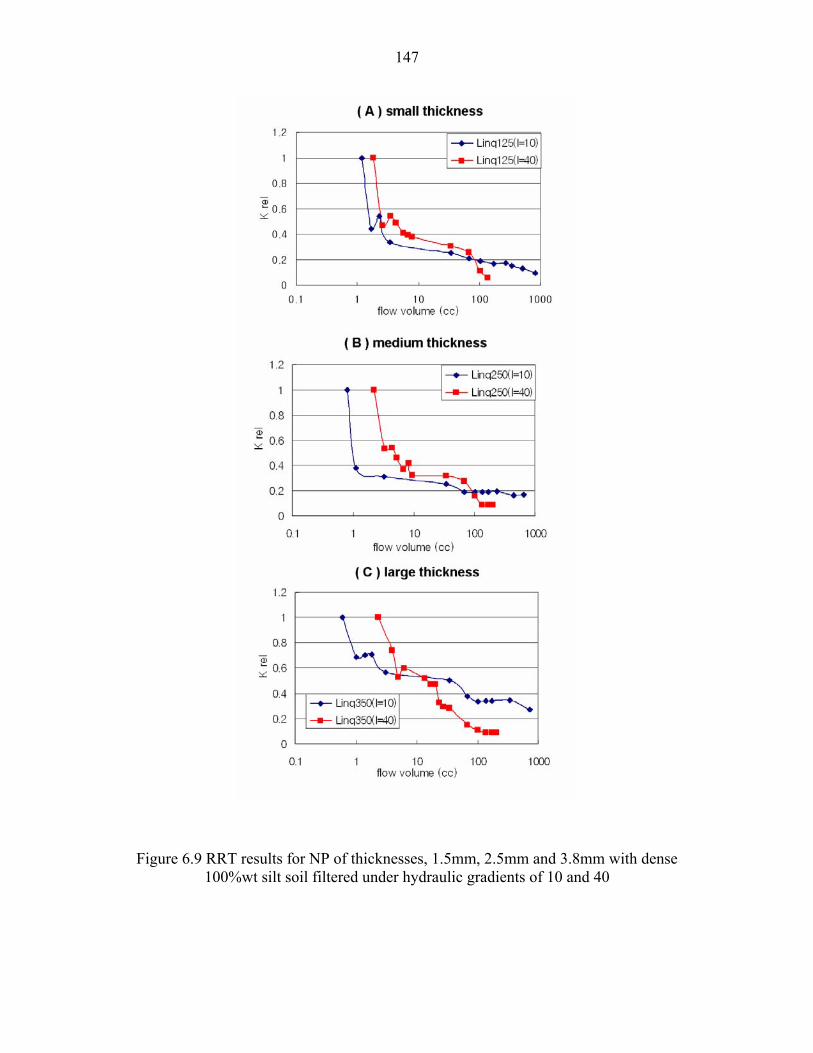
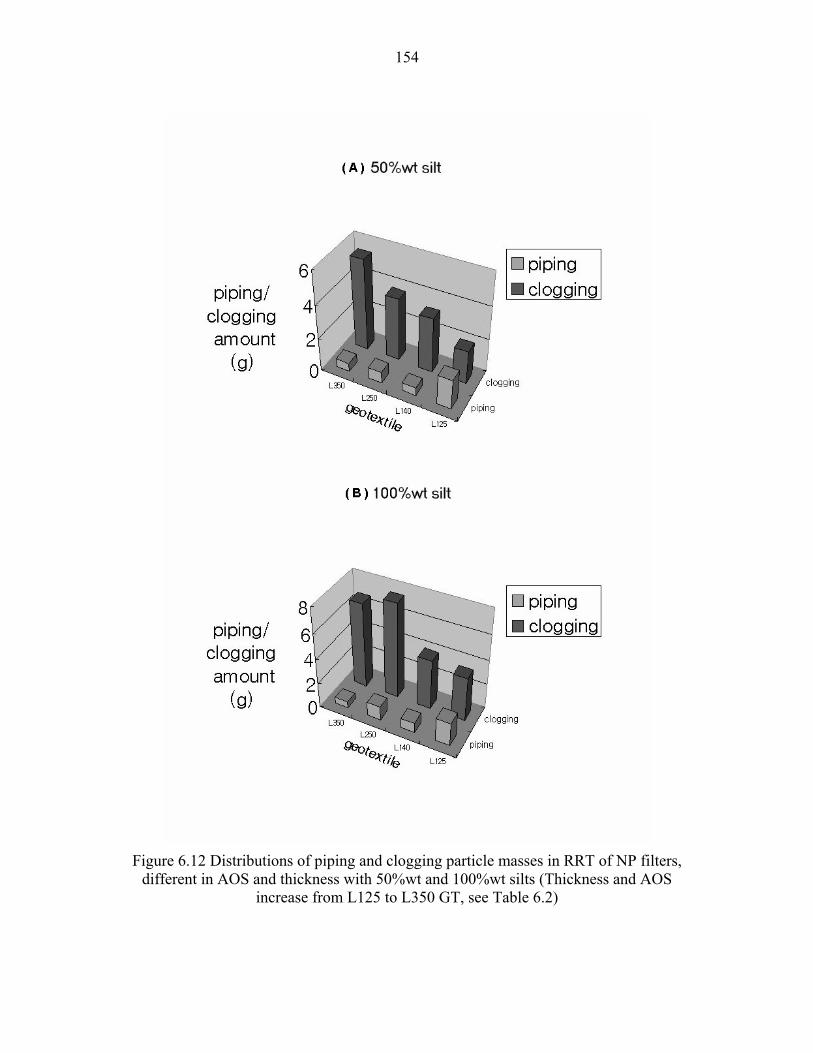
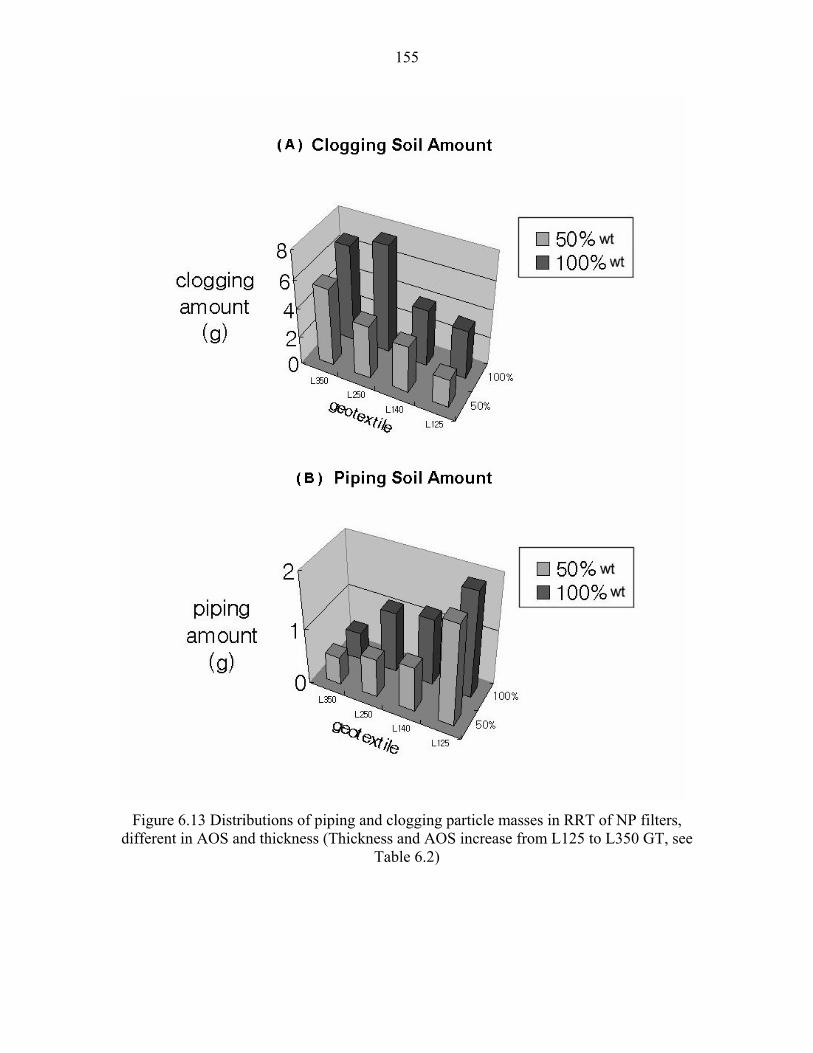
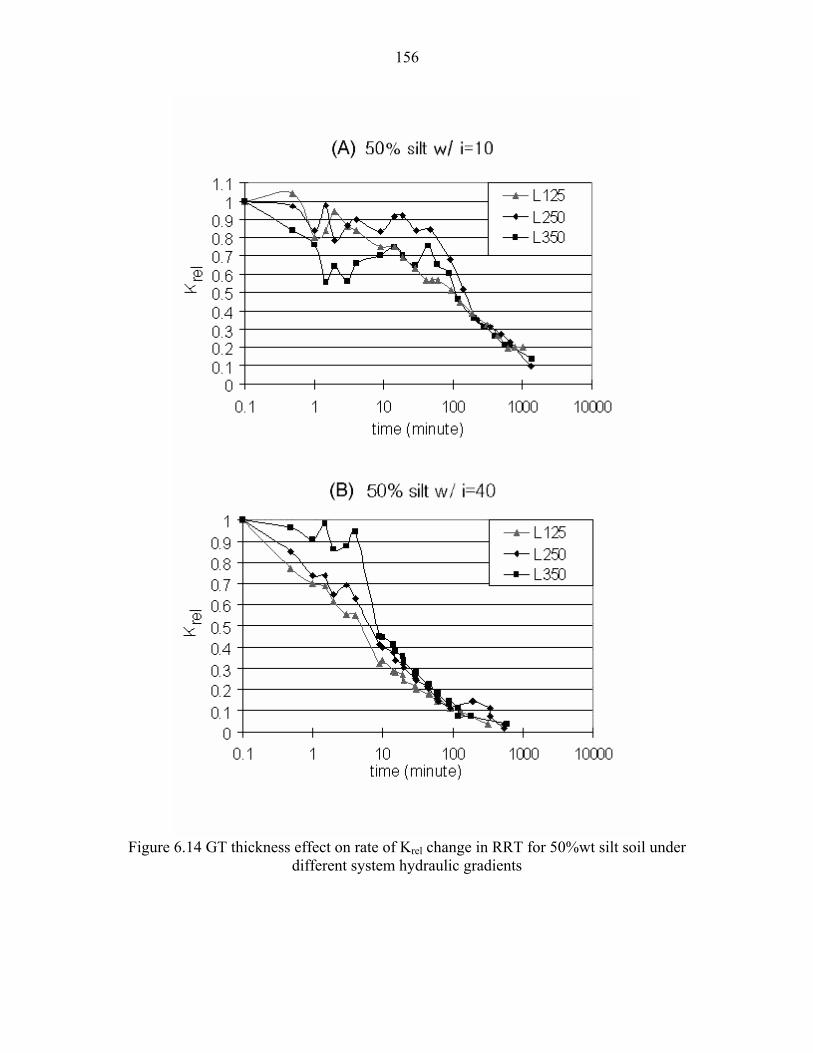
Figure 6-1 Schematic of RRT cell components...................................................... 131 Figure 6-2 Example of system hydraulic conductivity variations during RRT for Loose soils with different silt contents under gradient, i=40.................................. 135 Figure 6-3 Grain size distributions of soil specimens............................................. 136 Figure 6-4 Illustration of different in wettability between needle punched (A) and heat bonded (B) geotextiles. A water column of 1 cm stands above the heat bonded GT while none remains above the needle punched specimen................................................. 137 Figure 6-5 RRT results obtained in filtration (i=40) of uniformly graded dune sand in loose state with GT of different types .............................................................................. 143 Figure 6-6 RRT (i=40) results for various GT types with loose soils of different silt contents (20% wt gap graded, 50% wt well graded and 100% wt silt pure fine) ................. 144 Figure 6-7 Schematic plots of different surface properties between heat bonded (HB) and needle punched GT (NP) ........................................................................................ 145 Figure 6-8 RRT results for NP of thicknesses, 1.5mm, 2.5mm and 3.8mm with dense 50% wt silt soil filtered under hydraulic gradients of 10 and 40 .................................... 146 Figure 6-9 RRT results for NP of thicknesses, 1.5mm, 2.5mm and 3.8mm with dense 100% wt silt soil filtered under hydraulic gradients of 10 and 40 .................................... 147 Figure 6-10 Compaction influence on RRT performance of a thin HS filter (C-M60) with soils of different silt contents.................................................................................. 150 Figure 6-11 Compaction influence on RRT performances of a thin NP filter (Linq125) with soils of different silt content ................................................................................... 151 Figure 6-12 Distributions of piping and clogging particle masses in RRT of NP filters, different in AOS and thickness with 50% wt and 100% wt soils (Thickness and AOS increase from L125 to L350 GT, see Table 6.2)..................................................... 154 Figure 6-13 Distributions of piping and clogging particle masses in RRT of NP filters, different in AOS and thickness (Thickness and AOS increase from L125 to L350 GT, see Table 6.2) ................................................................................................................ 155 Figure 6-14 GT thickness effect on rate of Krel change in RRT for 50% wt silt soil under different system hydraulic gradients....................................................................... 156
xi
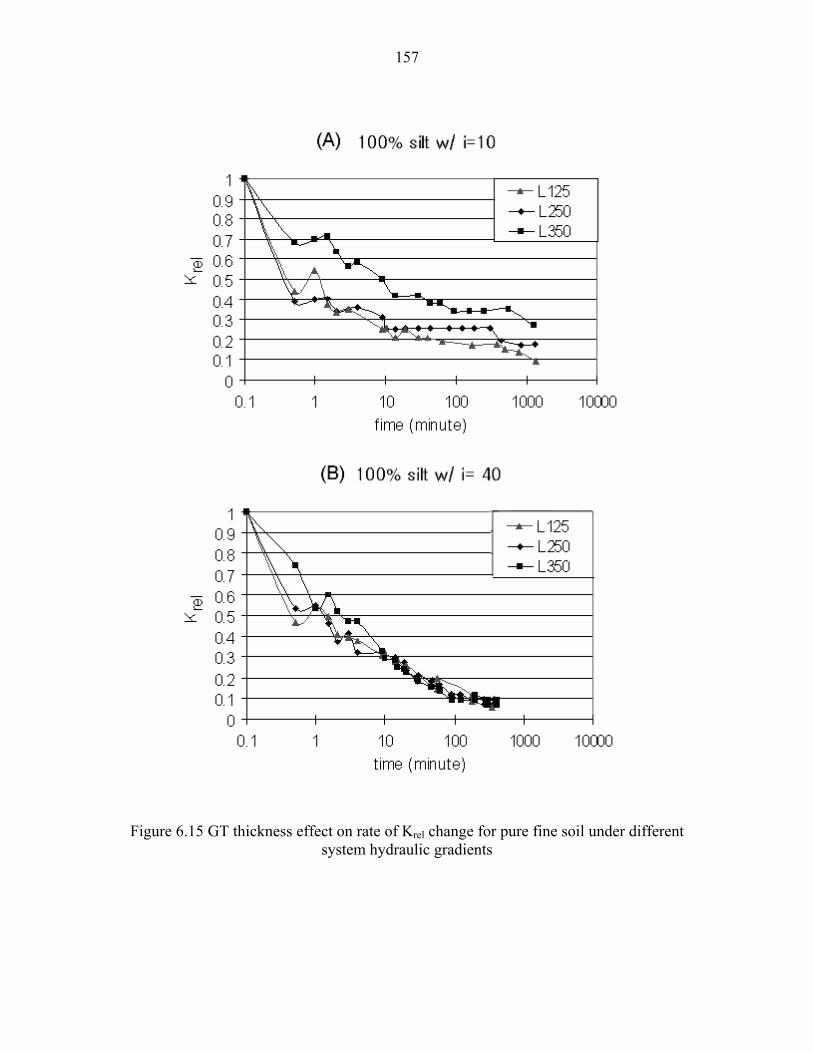
Figure 6-15 GT thickness effect on rate of Krel change for pure fine soil under different system hydraulic gradients....................................................................... 157 Figure 6-16 Hydraulic performances in RRT under i=40 of thick NP, alone and in association with a fine sand layer, for filtration of dense soils with 10% wt or 20% wt clay (c: clay, m: silt and s: fine sand)................................................................. 159
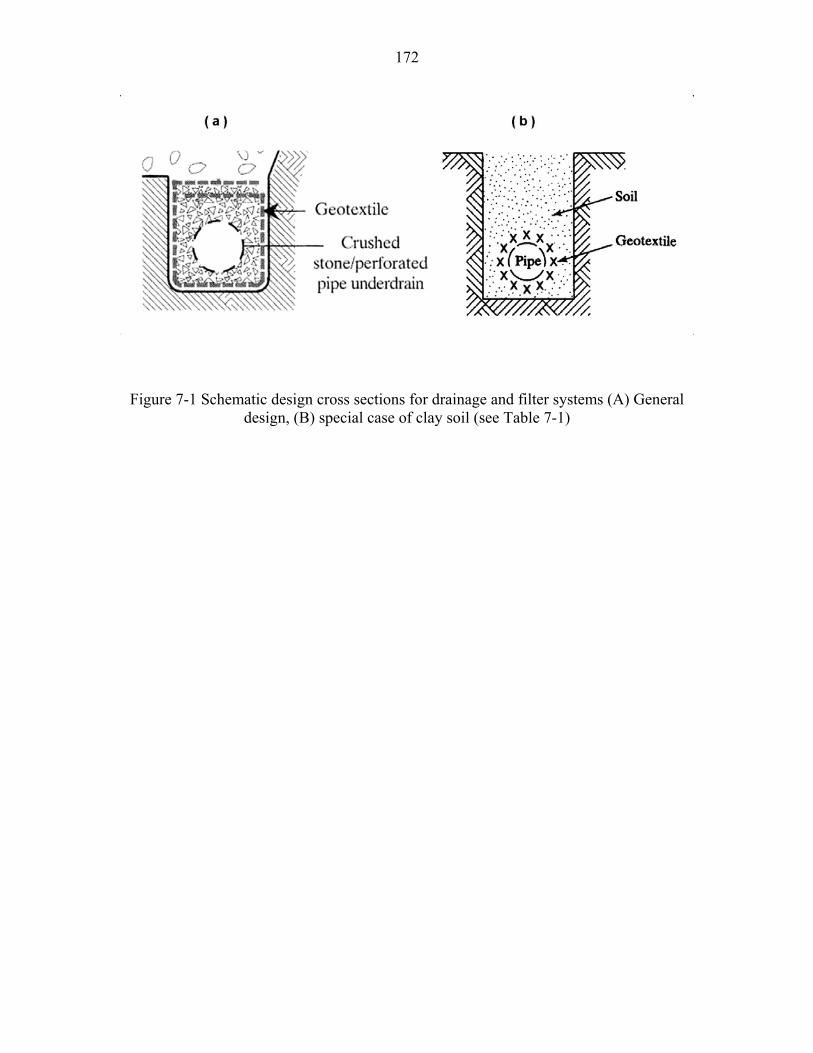
Figure 7-1 Schematic design cross sections for drainage and filter systems (A) General design, (B) special case of clay soil (see Table 7-1)............................................... 172 Figure 7-2 Example particle size distributions. (A) example 1, (B) example 2 ..... 173
Figure 7-3 Selection examples. (A) example 1, (B) example 2 …………………..174
xii
Notation of Abbreviation and Symbol
Δh : system hydraulic head difference [kPa],[psig]
AOS : apparent opening size of non woven geotextile specified in ASTM D 4751 [mm]
Cu*: uniformity coefficient criteria varied by compaction degree in the filter design by Giroud
(1982)
DC: constriction size of granular filter [mm]
DG: the lower limit of gap range [mm]
DHR : double hydrometer ratio (weight fraction of dispersed clay below 5 μm in size)
Di : grain size of corresponding to i % in cumulative soil GSD [mm]
F, FD : cumulative mass fraction for a particle size, D
FOS: filtration opening size of non woven geotextile measured by hydrodynamic sieving method [mm]
FWGR : flexible wall gradient ratio method suggested by Honey and Holtz (2001)
GHL : geotextile head loss [kPa],[psig]
GR : gradient ratio
GRASTM : gradient ratio defined in ASTM D5101
GRMod : gradient ratio modified by Fannin et al (1994)
GSD : soil grain size distribution
GT : nonwoven geotextile
H : mass fraction of GSD defined by F4D-FD
HCR : hydraulic conductivity ratio
HS : heat set type
i : hydraulic gradient
i x-y : hydraulic gradient estimated between x and y elevation levels from filter interface
K : absolute hydraulic conductivity [cm/sec],[ft/min]
Kinit, Kfinal : initial/final system hydraulic conductivity values measured in FWGR test and RRT
[cm/sec],[ft/min]
Krel : relative system hydraulic conductivity defined by K/Kinit
n : porosity
NP : needle punched type
Oχ : opening size of χ % in cumulative geotextile OSD [mm]
xiii
Of* : the optimum geotextile opening size applied to filter design method [mm]
OSD : opening size distribution for geotextile
P.I. : plasticity index specified in ASTM D 4318
POA : percentage opening area for woven geotextile [%]
PPT : pore pressure transducer
r.p.v. : relative pore volume
RRT : rapid retention test
Sa : specific surface area [m/m]
SB : spun bonded type
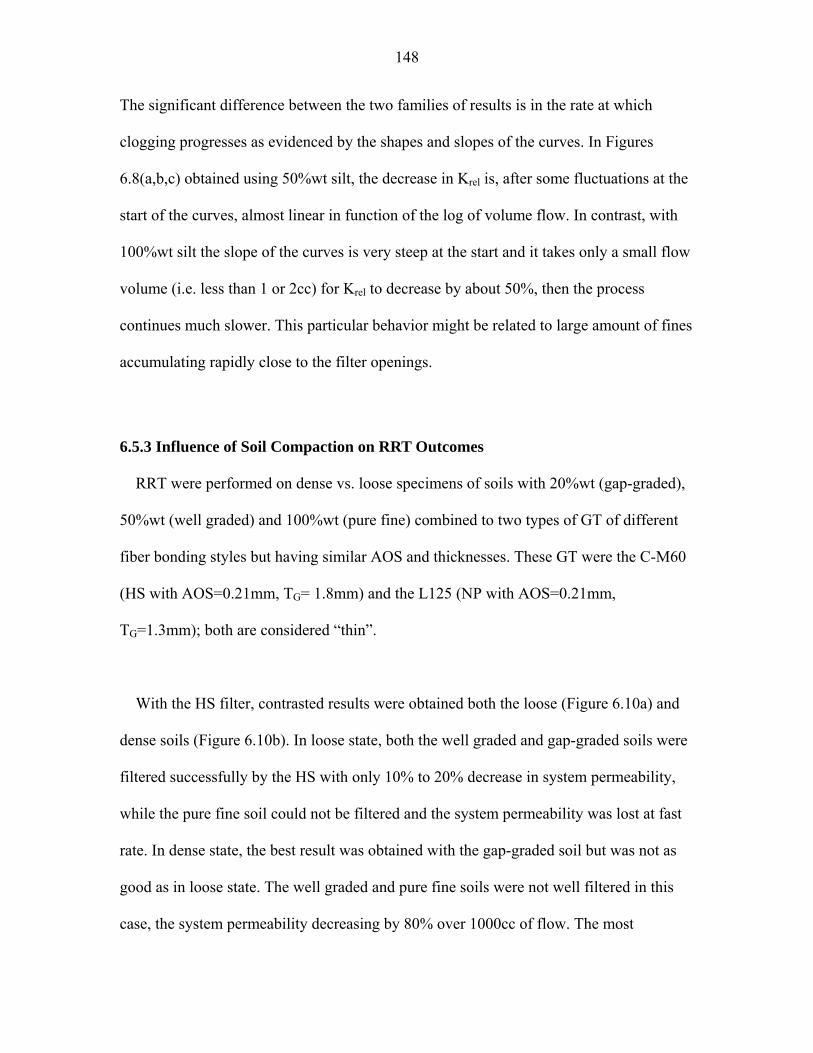
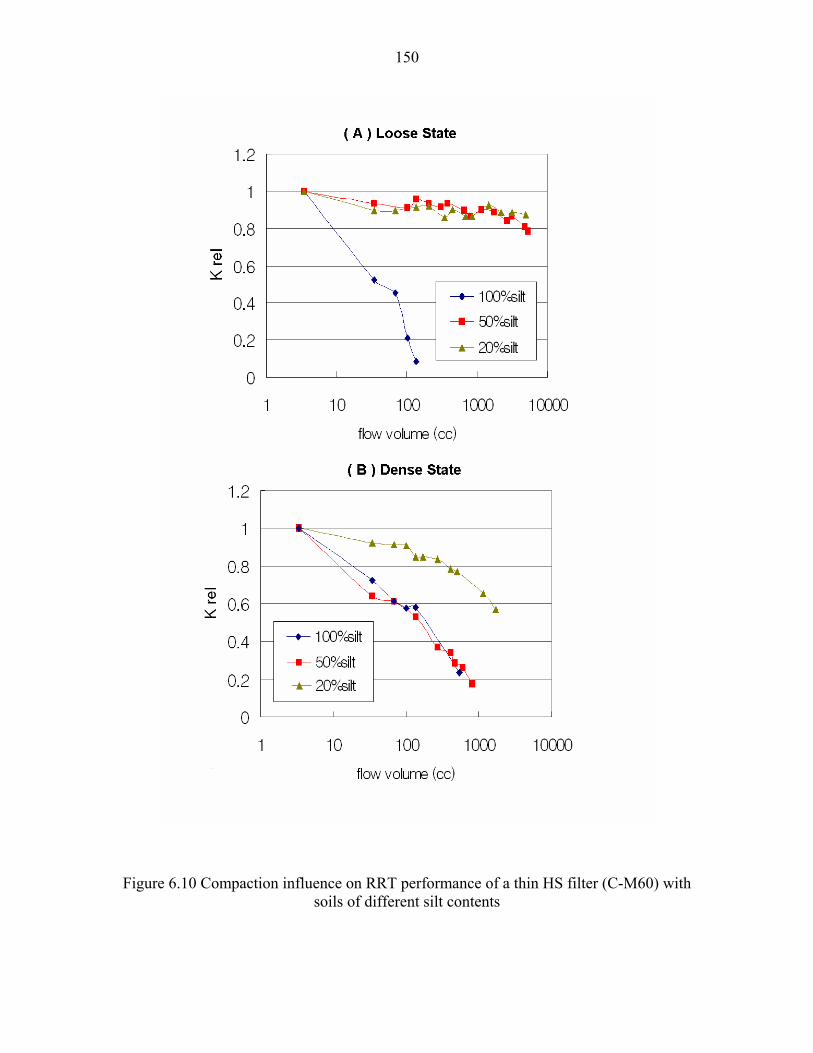
tG : nonwoven geotextile thickness [cm],[in]
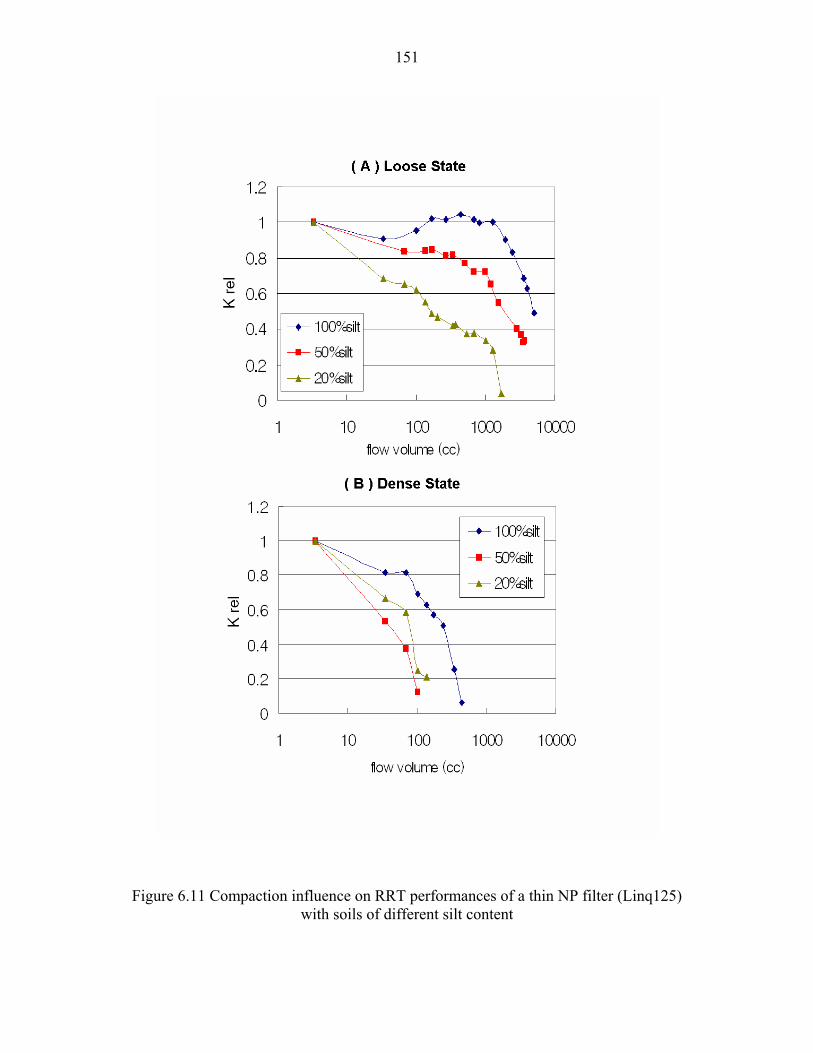
w : water content [%]
1
1. Introduction 1.1 Background
Adequate filters are critical to the long-term performance of highway drains. The role of
a filter is to prevent soil and adjacent material particles from entering the drain, while still
allowing water to flow freely. When the filter does not retain the particles, the drain is at
high risk of becoming clogged with transported sediments. On the other hand, when the
filter openings themselves become obstructed, water is unable to reach the drain.
A traditional technique in civil engineering infrastructures projects such as earth dams,
retaining walls or roadways has been to use mineral filters made of selected granular
material such as gravel and sand. A number of filter selection criteria were formulated,
often in connection with earth dam construction problems, and are currently being used
for a broad range of applications including roadways. These design criteria are empirical
formulas relating the required filter grain size to that of the surrounding material (e.g.
U.S.B.R., 1974, 1994). More recently, the technology of geosynthetic fabrics (i.e.
geotextiles) has provided a cost-effective alternative to mineral filters. Geotextiles are
made of plastic polymer fibers or threads and are highly permeable. They can be used to
wrap drainage pipes or to line drainage trenches and function as filters (e.g. Koerner,
1998). Geotextiles are available in two broad categories according to their weaving
process, woven fabrics and non-woven. A woven geotextile has a uniform microstructure
made of parallel, regularly spaced fibers or threads in two perpendicular directions. Its
porosity is characterized by openings that are uniform in size and spacing. In contrast, a
non-woven geotextile has a spatially random microstructure made of a disorderly pattern
2
of non-parallel and tortuous fibers. As a result, its porosity features a broad distribution in
size and spacing as well as high degree of tortuosity. In a number of cases, geotextiles
have performed successfully as filters while being easier to install, much thinner and
more permeable than conventional granular filters (Giroud, 1996). Present practice for
Indiana highways is to use geotextiles when filters are required.
1.2 Statement of Problem Current design methods for selecting geotextile filters consider their capacity to (a)
transmit fluid across the fabric plane, (b) retain solid particles and (c) survive to potential
damage during and after installation. The first requirement relates to the permeability of
the fabric, given the quantity of flow expected toward the drain (e.g. Koerner, 1998).
Design with respect to the retention requirement is typically performed using empirical
formulas in which index values of the surrounding material particle size and the fabric
pore size (i.e. the apparent opening size, AOS1, according to ASTM-D4751) are being
compared (e.g. Carroll, 1983, Giroud, 1988, Luettich et al., 1992). To satisfy the last
requirement, survivability, the selected geotextile must have adequate mechanical and
chemical characteristics, given the anticipated construction and site conditions
(AASHTO, 1991).
1 The Apparent Opening Size (AOS) or Equivalent Opening Size (EOS) of a geotextile are defined as the U.S. standard sieve number that has openings closest in size to the openings in the geotextile. The ASTM D4751 test uses known-diameter glass beads to determine the AOS by standard dry sieving. Sieving is done using beads of successively larger diameters until the weight fraction of beads passing through the test specimen is 5%. The corresponding opening size (in mm) is O95. Note that this procedure defines only one particular void size of the geotextile and not the total void-size distribution (Koerner, 1998).
3
According to current guidelines and specifications for Indiana highway projects, a filter is
needed when the soil adjacent to the drain consists mainly of silt. This means, a soil with
more than 50% passing by weight the #200 sieve (i.e. particle size lesser than 0.075mm),
classified as fine-grained soil, but with less than 20% clay particles (i.e. smaller than
0.002mm). In such situations, a geotextile filter must be installed with the following main
Texture: Non-woven fabric (needle punched or heat bonded)
Apparent Opening Size (AOS): Sieve #50 (300 microns) or smaller
Coefficient of permeability: 0.01 cm/s or greater
Additional characteristics in chemical composition and mechanical index
properties are specified in order to ensure survivability of the fabric.
INDOT’s guidelines for typical pavement cross-sections include plans and filter
installation procedures. A construction detail of interest is that, when the geotextile filter
is installed as a liner inside the drainage trench, it is not wrapped over the granular
backfill at the top of the trench, contrary to frequent practice and textbook
recommendation (e.g. Koerner, 1998).
Over the past 20 years, design and performance of filters for subsurface drainage of
highway pavements have been a constant concern to INDOT and have been the subject of
substantial research effort through JHRP and JTRP. In 1988, a review of geotextile
functions and selection criteria addressed filtration applications (Karcz and Holtz, 1988).
The study resulted in selection guidelines adapted from the French Committee of
4
Geotextiles and Geomembranes (1981) recommendations. Another study devoted
exclusively to prefabricated geocomposite edge drains (Elsharief, 1992) addressed
installation, structural integrity and filtration aspects of this type of drains that are made
of a plastic drainage core wrapped in a geotextile filter. A filtration selection criterion
was proposed as a result. It is noted that the technology of prefabricated geocomposite
edge drains has since been discarded by INDOT because of problems with the structural
reliability of these products but information accrued on their filter performance may still
be relevant. In 1993, a broader-scope research project was completed on pavement
drainage in Indiana highways (Ahmed et al., 1993, Espinoza et al., 1993). In conclusion,
it was pointed out that infiltration of fines from base and subgrade soils surrounding edge
drain trenches often resulted in clogged pipes, and further investigation was needed on
designing filters to optimize pavement subdrainage performance. Chemical clogging of
filters related to using recycled concrete aggregate in INDOT’s pavement reconstruction
projects was also investigated (Wukash and Siddiqui, 1996). Evidence was found that
effluent from recycled concrete contains calcium hydroxide that can lead to the formation
of calcium carbonate and its deposition in filters. Still today, a significant part of
difficulties encountered by INDOT with insufficient drainage performance of highways is
likely to be related to inadequate filters. The performance of filters installed in Indiana
highways is often unsatisfactory and fails to meet long-term expectations.
A review of published literature using TRIS and other specialized bibliographic resources
(see appended list of references) shows that, in spite of research efforts and accumulated
experience with these techniques, the filtration process using geotextiles is complex and
5
still not fully understood. For instance, there are experimental evidences that, when
various types of soil are involved, geotextiles filters may become clogged much faster
than granular filters (Koerner et al., 1996) and that non-woven fabrics are likely to
perform better than woven- (Hoffman and Turgeon, 1983), but there is no clearly
established theory to explain these differences. Such factors as, arching of solid particles
across the fabric openings, magnitude of the hydraulic gradient (or flow rate) toward the
drain and pore water pressure, fabric pattern of the geotextile and its thickness,
magnitude of the confining pressure, have probably a noticeable influence on the filter
performance, in addition to the soil grain and filter opening sizes. In this list of influence
factors, the hydraulic and mechanical parameters are related to variations in the pavement
environment (precipitations and fluctuations of groundwater) and traffic loads.
In summary, there is strong need for improved guidelines, based on better understanding
of the filtration process and supported by testing and performance data, in order to select,
design and construct drainage filters for Indiana highways. This is a necessary condition
to avoid premature clogging and the resulting failure of highway drains.
1.3 Scope of the Present Study The effectiveness of underdrain filters was investigated in order to make
recommendations on selection criteria, design and installation guidelines that would
improve the long-term performance of drainage systems in Indiana highways. Since
significant savings in construction and maintenance cost can be achieved if geosynthetic
filters are employed successfully, the study was focused on these types of filters, rather
6
than on traditional mineral filters. Because of time frame and budget constraints, the
scope of the study was limited to hydro-mechanical filtration mechanisms of solid
particles that is, biological and chemical aspects were not addressed to the exception of a
test using recycled concrete aggregate. The investigating approach includes field data
collection, laboratory experiments and analysis.
Long-term performance and its relationship to design expectation are of particular
importance. Attempt was made to assess the evolution in time and potential deterioration
of the filter fabric properties. Several types of experiments (e.g. permeability test,
filtration test) exist that allow determining in the laboratory the filtration capability of
geotextiles and the compatibility of a particular combination of filter and interfacing
material. Through these experimental procedures, it is possible to investigate
systematically the influence of important soil, geotextile and hydraulic parameters, but
the duration of one test is limited to a few days. This particular difficulty can be
overcome by complementing laboratory testing with field information. In collaboration
with the Study Advisory Committee and INDOT’s district engineers, samples and other
field information were obtained from sites where inadequate filter performance may have
been the cause of insufficient drainage.
In order to relate the long-term performance to short-term design parameters, series of
tests in the laboratory were performed on new, intact, samples of geotextile filters. The
clogging potential of intact geotextile filters were investigated using the best currently
available methods, the Flexible Wall Gradient Ratio Test (FWGRT) and the Rapid
7
Retention Test (RRT). Characteristics and relative merits of these techniques are
discussed in detail in subsequent sections of this report. In order to perform these tests,
new equipment was developed or existing equipment was modified in the Bechtel
Geotechnical Laboratories of Purdue University.
Soils that are the most prone to internal erosion and cause filtration problems often
include significant amount of silt. In Indiana, such subgrade materials would likely be
sandy silts or silty clays. Because of the preeminent role played by silt particles in filter
clogging, a systematic study was performed by varying the amount of silt in reconstituted
samples that were then tested with geotextile filters. This constituted the bulk of the
experimental study in addition to tests conducted with samples from natural deposits.
Other parameters whose influence was investigated included geotextile thickness and
manufacturing style.
1.4 Organization of this Report The following sections are found in this report:
- Chapter 1 presents the introduction, background and scope of the research study.
- Chapter 2 is a synthesis of literature review on geotextile filtration and clogging
mechanisms, and the physical parameters involved. Current filter design methods
are reviewed, as well as earlier experimental and field studies.
- Chapter 3 reports an investigation of field materials and filter performance. It also
includes the analysis of video inspections of underdrains performed at INDOT
project sites.
8
- Chapter 4 is an assessment, by means of numerical simulation, of subsurface flow
and hydraulic gradients filters are subjected to.
- Chapter 5 reports experiments using the Flexible Wall Gradient Ratio Test, with
emphasis on the influence of soil properties.
- Chapter 6 reports experiments using the Rapid Retention Test, with emphasis on
the influence of geotextile properties.
- In chapter 7, a synthesis of the results is used to develop tentative guidelines for
filter selection and installation. Design examples are provided.
9
2. Literature review and synthesis 2.1 General Characteristics of Soil Filtration Using Geotextiles
Geotextiles have been increasingly used as soil reinforcements, separators, drains or
filters in various civil and environmental engineering application areas such as, earth
retaining structures, shallow foundation bases, tunnel liners, embankments, breakwater
systems, and landfill leachate collection systems and covers. Even when their primary
usage is not drainage, geotextiles must be very permeable throughout their service life, so
that they do not prevent free drainage nor contribute to excess pore pressure build-up in
the adjacent soil. The open porous structure of geotextiles and its permanence is an
essential property of this type of geosynthetics. It enables geotextiles to filter soil
particles while allowing free flow of pore fluid. Geotextiles can perform better as filters
than granular materials, and there is definite advantage provided by their easy installation
and resulting low cost of construction (Giroud, 1996). Under unfavorable conditions
encountered on landfill slopes or in breakwater systems, geotextile solutions can be more
reliable than granular filters because the fiber fabric of geotextiles is less likely to be
disturbed or destroyed by tensile drag or wave forces than the granular arrangement of
mineral filters. However there is ample physical evidence that geotextile fabrics can be
clogged by non cohesive particles from silty soils (e.g. Bhatia et al, 1998) and, to a lesser
extent, by clay particles (Gardoni and Palmeira, 1998, Almeida et al, 1995). Clogging
mechanisms belong to two broad types, related to either physical or bio-chemical
processes. Often, physical clogging occurs first and then is followed by slower bio-
chemical processes such as iron ochre deposition, carbonate/sulfate precipitation and
bacterial growth (Rollin and Lombard, 1988). Furthermore, time rates of bio-chemical
10
clogging depend on the pore size and, therefore, are affected by previous occurrence of
physical clogging (Reddi and Bonala, 1997).
According to Giroud (1996) and Rollin and Lombard (1988) factors influencing the
filtration performance of geotextiles can be classified into four main categories that are
(1) properties of the adjacent subgrade soil or base material such as, coefficient of
uniformity (Cu), coefficient of gradation (Cc), plasticity index (PI), clay dispersivity (e.g.
determined using the double hydrometer ratio, DHR, test), particle shape and grain
hardness for granular soil, state of compaction and degree of saturation, (2) properties of
the geotextile such as, filtration opening size (FOS2) or apparent opening size (AOS),
textile bulk density (mass/area), porosity, textile thickness, fiber density and diameter,
and constitutive polymer(s), (3) hydro-mechanical conditions such as, hydraulic gradient,
pore pressure and state of stress and (4) bio-chemical properties of the permeating fluid
such as its pH, hardness (e.g. [Fe], [Mn], [Mg], [Ca]), redox potential (Eh) in case of iron
ochre, water BOD and COD (substrate type and concentration), osmotic pressure and
dissolved oxygen.
In this chapter, background knowledge on the mechanism of physical filtration and
clogging, and the roles played by the most influential factors are reviewed.
2.2 Mechanism of Geotextile Filtration and Physical Clogging
Soil filtration by geotextiles involves complex interaction between the filter and the
contiguous soil. Under the action of seepage forces induced by groundwater flow toward 2 The filtration opening size (FOS) of a geotextile is similar in concept to the apparent opening size (AOS) but is determined by wet hydrodynamic sieving (see the ISO/DIS 12956 test standard) which is a method more representative of field conditions than the dry sieving method used for the AOS.
11
the filter (and the drain), soil particle movement and relocation lead to changes in grain
size distribution, porosity and permeability within both the soil and the filter. Several
mechanisms have been identified as piping, bridging, blinding, blocking (or plugging)
and clogging (Rollin and Lombard, 1988, Lafleur, 1999). The first three are conceptually
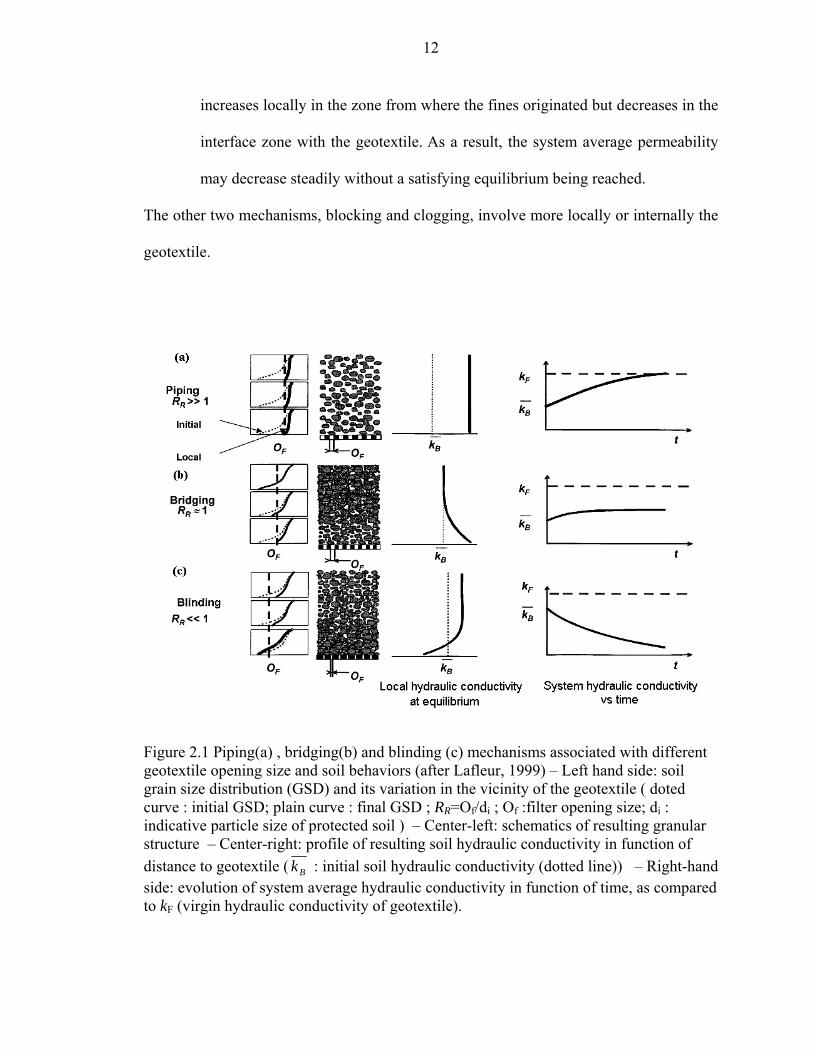
represented in Figure 2.1.
Piping is a typical case of soil internal erosion. Because a large fraction of soil
particles is much smaller than the filter openings, they cannot be retained. As a
result, the fine fraction disappears from the grain size distribution. In the
affected zone, the soil porosity as well as its hydraulic conductivity increase
dramatically and quasi-uniformly.
Bridging is a mechanism by which the soil forms a self-filtration structure at the
interface with the geotextile. In this case, fine particles smaller than the
geotextile openings are lost only within a thin layer in contact with the filter.
Then, coarser particles arching over the geotextile openings prevent the process
to extend beyond the interface zone. Eventually particle migration is contained
and a state of equilibrium is reached where only the porosity and hydraulic
conductivity of the interface zone have been locally increased as compared to
the initial state. In consequence, the system average hydraulic conductivity
increases slightly and stabilizes at a value, intermediate between the soil initial
permeability and that of the geotextile.
Blinding occurs when fine particles migrating from a distance are retained and
accumulate in the interface zone close to the geotextile. As porosity in the
interface zone decreases and flow conduits are filled, hydraulic conductivity
12
increases locally in the zone from where the fines originated but decreases in the
interface zone with the geotextile. As a result, the system average permeability
may decrease steadily without a satisfying equilibrium being reached.
The other two mechanisms, blocking and clogging, involve more locally or internally the
geotextile.
Figure 2.1 Piping(a) , bridging(b) and blinding (c) mechanisms associated with different geotextile opening size and soil behaviors (after Lafleur, 1999) – Left hand side: soil grain size distribution (GSD) and its variation in the vicinity of the geotextile ( doted curve : initial GSD; plain curve : final GSD ; RR=Of/di ; Of :filter opening size; di : indicative particle size of protected soil ) – Center-left: schematics of resulting granular structure – Center-right: profile of resulting soil hydraulic conductivity in function of distance to geotextile ( Bk : initial soil hydraulic conductivity (dotted line)) – Right-hand side: evolution of system average hydraulic conductivity in function of time, as compared to kF (virgin hydraulic conductivity of geotextile).
13
In the case of blocking, coarse particles directly in contact with the
geotextile surface obstruct the filter openings, preventing fine particles as well as
fluid to penetrate.
Internal clogging, instead, occurs when migrating fine particles penetrate the
filter fabric and encounter fiber constrictions too narrow for traveling farther.
Fines can then accumulate within the geotextile and obstruct its drainage
channels.
In practice, the terminology of clogging is often extended to designate not only internal
clogging of the geotextile but blocking and blinding as well (Rollin and Lombard, 1988).
Another form of geotextile blocking, by fine particles instead of coarse ones, can also be
observed in situations where fine pumping due to pulsing of excess pore pressure takes
place. This could be the case in roadway or railway construction, for instance, when a
geotextile is used as separator between aggregate base course or ballast and soft saturated
silt subgrade (Alobaidi and Hoare, 1999). In the present study, this particular mechanism
will be referred to as plugging in order to avoid confusion with the classical case where
blocking is caused by coarse particles larger than the filter opening size.
It is noted that, of the five mechanisms described above, only bridging can be considered
a highly desirable condition, all the other leading to either sediment being transported to
the drains (piping) or the system hydraulic conductivity being possibly decreased down to
a level insufficient for adequate drainage (blinding, blocking and clogging). For well
graded soils, geotextile blocking or internal clogging are usually considered the most
sever problems and more investigation of these types of filter failure is needed for various
14
of soil and geotextile conditions.
The time required for physical clogging to stabilize in a particular situation varies with
the hydraulic gradient magnitude: the greater the gradient, the faster the process. In the
laboratory this often takes up to 1,000 hours when the gradient ratio test is used (Rollin
and Lombard, 1988; Bhatia et al, 1995, Bhatia et al, 1998). As will be seen later, reliance
on such long duration laboratory tests is due, to some extend, to the current lack of a
general theory to integrating the various filtration mechanisms altogether.
2.3 Clogging Factors Related with Soil Properties 2.3.1 Non-cohesive Soil
Causes for physical clogging during filtration are not only related to geotextile
properties but also to the soil (Bhatia and Huang, 1995). With non cohesive soils in
particular, internal instability of their granular structure can make it very difficult to
prescribe an optimal design opening size, Of*, for the geotextile and to formulate filter
criteria that would help prevent piping, blinding or internal clogging. The internal
stability of granular soil structure has been investigated in depth by Kenney and Lau
(1985) and Lafleur et al (1990). Their research focused on developing criteria for the
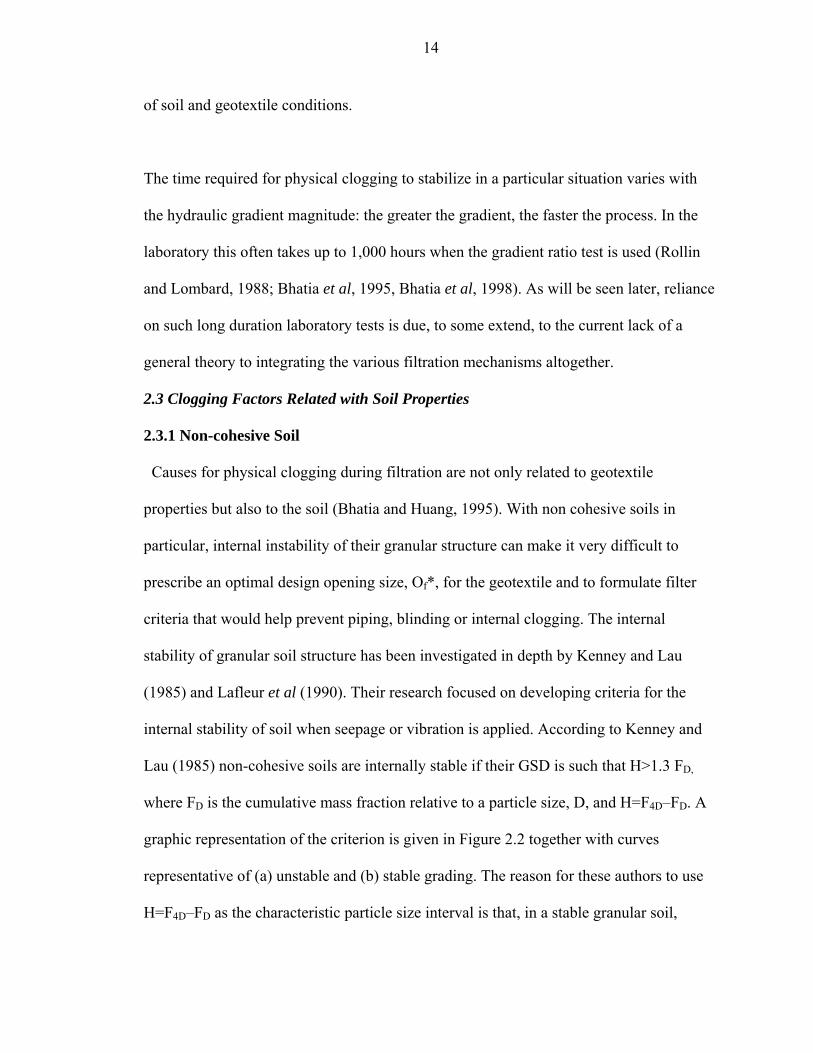
internal stability of soil when seepage or vibration is applied. According to Kenney and
Lau (1985) non-cohesive soils are internally stable if their GSD is such that H>1.3 FD,
where FD is the cumulative mass fraction relative to a particle size, D, and H=F4D–FD. A
graphic representation of the criterion is given in Figure 2.2 together with curves
representative of (a) unstable and (b) stable grading. The reason for these authors to use
H=F4D–FD as the characteristic particle size interval is that, in a stable granular soil,
15
Figure 2.2 Soil grading influence on internal stability (Kenney and Lau, 1985) WG: soils widely graded in range F=0.2-1.0; NG:
soils narrowly graded in range F=0.3-1.0
15
16
predominant constrictions of the void network are approximately four times smaller than
the small particles (Kenney et al, 1985). The resulting granular filter design criterion, D5
< 4 D50 or D15 < 5 D50 for soils with Cu < 6 is more conservative than Terzaghi’s (1922)
classical formula.
In connection with granular filter design for broadly graded soils Lafleur et al (1989)
took into account the bridging effect (i.e. self-filtration) which may exist also in this case.
The behavior of linearly graded soils was compared with a model they proposed, but the
model underestimated both the amount of fines lost and the bridging zone thickness
observed in experiments. However, their screen test results indicated that the thickness of
the self-filtration zone is proportional to the constriction size (Dc) of the granular filter.
Additionally, these authors suggested the granular filter opening size should be between
D50 and D80 for linearly graded soil, and within the gap range in the case of gap-graded
soil. It was also noted that, in absence of vibration, particle interlocking might contribute
to limiting the loss of fines.
Particle size uniformity (as represented, for instance, by the coefficient of uniformity
Cu=D60/D10) can affect soil retention. This property plays a role in filter design through
the ratio Of/Dl where Of is the largest opening size of the filter and Dl is the largest size of
particle retained. Watson and John (1999) studied the effect of Cu on particle bridging.
They investigated which were the largest opening sizes compatible with stable granular
bridging structures, for different cases of particle size gradation. They assumed a
spherical particle shape and tested their model on the basis of the ratio, O90/D90. They
found that the uniformity coefficient (Cu) influences the smallest size of the particles that
17
can form the granular bridging structure, and that particles smaller than 0.228 Of are not
associated with bridging formations regardless of the soil grain size uniformity. In
general, as Cu increases, the ratio O90/D90 decreases. In practice, this means for piping be
prevented the filter largest opening size, Of, should be reduced when the soil is better
graded. Giroud (1996) considered the selection of Of*/D85 should take into account the
soil uniformity coefficient (Cu) and state of compaction. Three different density states of
bridging granular structure were considered: hyperstable (Cu*=3), mesostable (Cu*=6.5)
and hypostable (Cu*=13), where Cu* are the coefficients of uniformity, characteristic
values related to soil internal stability. The relationship between Of and the finest size of
bridging particles was derived for the two case, Cu > Cu* and Cu ≤ Cu*. Both approaches
outlined above show similar trends such as relatively high values of Of*/D85 obtained in
dense conditions and relatively low values in loose condition. However, neither model
was based on consideration of actual particle size distributions. Instead, idealized linearly
graded soils were assumed.
The effect of particle shape on soil retention performance has been investigated, but
without clear, quantitative conclusions being reached. Aberg (1992b) accounted for the
particle shape in his investigation of void ratio for the various GSD types of soils. His
experiments led to a linear relationship between the void ratio and the particle angularity.
He also observed in compacted samples that the small grains were more angular than the
large ones because, during sample preparation, compaction work had produced particle
breakage. Lafleur et al (1989) suggested that in soil the angularity of fines particles
contributes to making thicker the granular bridge formed in successful filtration cases. In
18
connection with this idea, when actual soil was tested in comparison with glass beads, the
later yielded lower critical ratio, O95/D85, and amount of piping which was more sensitive
to the opening size when the ratio is close to its critical value (Bhatia and Huang, 1995).
2.3.2 Cohesive Soils
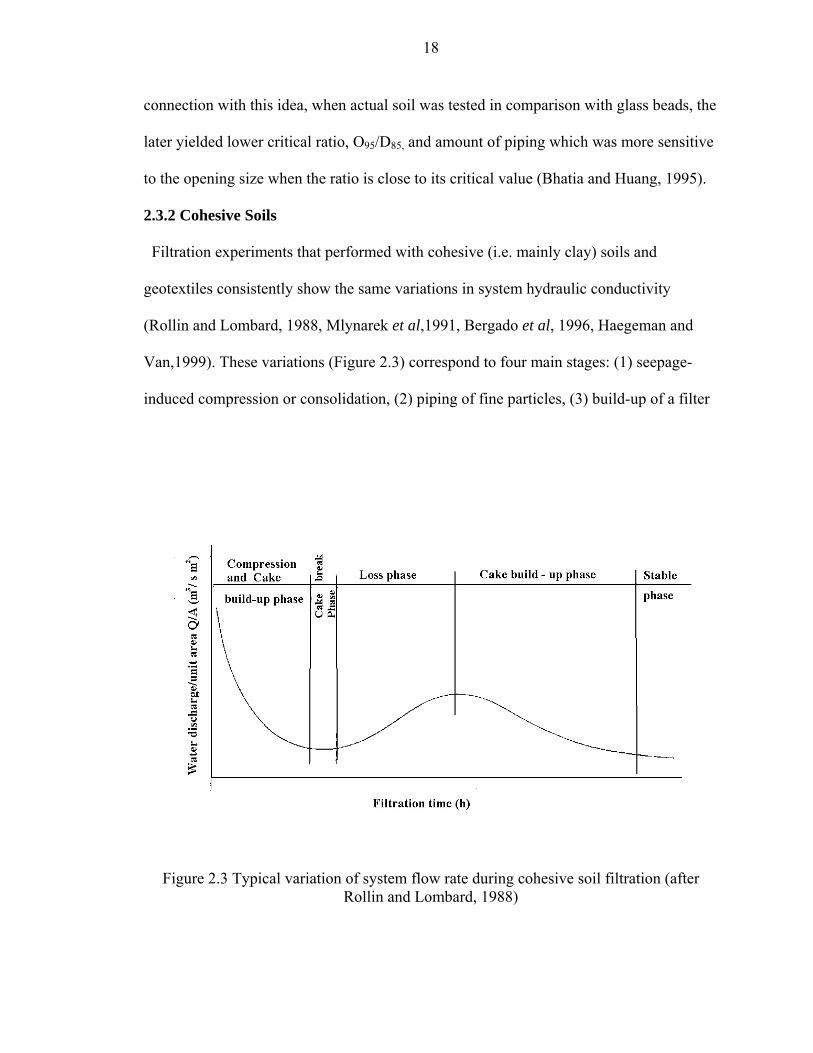
Filtration experiments that performed with cohesive (i.e. mainly clay) soils and
geotextiles consistently show the same variations in system hydraulic conductivity
(Rollin and Lombard, 1988, Mlynarek et al,1991, Bergado et al, 1996, Haegeman and
Van,1999). These variations (Figure 2.3) correspond to four main stages: (1) seepage-
induced compression or consolidation, (2) piping of fine particles, (3) build-up of a filter
Figure 2.3 Typical variation of system flow rate during cohesive soil filtration (after
Rollin and Lombard, 1988)
19
cake within the soil layer and (4) steady state. Haegeman and Van (1999) also reported
that the dry unit weight of soil increases steadily during this sequence and the final steady
state hydraulic conductivity is intermediate between the values of the soil slurry and the
geotextile.
When a clayey soil initially saturated is being partially dried, thin discontinuities or
cracks are likely to develop. In cohesive soils, particle piping through the pore structure is
more difficult than in non cohesive soils because of capillary forces, but clay internal
erosion through discontinuities or desiccation cracks is more likely to occur. This has not
received much attention as a factor influencing filter designs. Attention should be paid to
situations where the clay deflocculates easily and/or the fluid velocity within cracks is
high enough for particle transport to occur. This would require appropriate testing
methods be developed. From this standpoint, plastic soils are problematic in the case of
dispersive clay which can be identified by the conditions, DHR > 0.5 and PI > 5 (Luettich
et al, 1992) where DHR is the double hydrometer ratio. Clay deflocculating is influenced
by several factors such as, electrolyte concentration, ion valence, temperature, dielectric
constant, size of hydrate ion, pH and anion adsorption of clay and water system (Lambe
and Whitman, 1979). More detail on these particular factors can be found elsewhere
(Almeida et al, 1995, Gardoni and Palmeira, 1998).
In general, geotextiles intended to filter clay are too permeable for decelerating the
velocity of flow leaking flow through dessication cracks. In such cases, the use of a
granular layer between the clay and the geotextile was proposed by Kellner and Matei
20
(1991). This would enable the clay to generate its own natural filter zone within granular
layer. It was also pointed out by Bourdeaux and Imaizumi (1977) that, at flow velocity
below 10 cm/sec (20 ft/min), dispersive clay can be adsorbed by granular soil particles
and form a coating on the grain surface. In sand layers used for filtering clay, the amount
of clogging depends more on the concentration of fine particles in suspension than on the
particle size or the flow rate (Reddi et al., 2000). After stabilization has been reached, the
final flow rate through the soil-filter system is controlled by the self-filtration process
rather than by fine particle deposition in soil capillary conduits, especially under high
flow rate. However, the critical velocity below which fine particles start to deposit in
filter material is much higher in sand (10-1 cm/sec) than in geotextile (10-3 cm/sec). This
is an indication that clay particles have the more affinity for granular filter particles than
for geotextile fiber and seems to validate the concept of sand-geotextile composite filter
for clay soils. For analysis purpose, it should be noted that in case of a geotextile filter,
the number-based particle size distribution of fine particles suspended in water is a more
relevant factor than the mass concentration of fines, while in the case of a granular filter,
the opposite is true (Xiao and Reddi, 2000).
2.4 Clogging Factors Related to Geotextile Properties
According to Rigo et al (1990) geotextile properties playing an important role in
filtration are: fiber diameter, fabric thickness, fabric density (mass per area), fabric
porosity and filtration opening size. Among these properties, the opening size has been
found in various types of laboratory tests a key parameter in control of geotextile filter
performance. However, the size of constrictions between fibers, which is mainly the
21
result of the weaving method (sometimes referred to as the manufacturing style) seems to
play a more fundamental role than the opening size.
2.4.1 Filter Opening Size and Constriction Size Distribution
In a granular filter, a constriction is a narrowed pore space area between particles that
allows the smaller particle transference between two pores. Given the random nature of
granular media, the constriction size can only be described statistically. Constrictions can
control the travel of migrating solid particles within the pore space of a filter. Thus, the
constriction size distribution (CSD) is often considered to play a more important role in
the filtration process than the pore size distribution (PSD) itself (Kenney and Lau, 1985).
A similar concept has been used for describing the porous structure of geotextiles. Here, a
constriction is a narrowed pore space area between polymer fibers that control passage
from one pore to another. In nonwoven geotextiles in particular, the CSD influences
filtration even more importantly than in granular filters (Bhatia and Smith, 1996a). This
make difficult the formulation of simple retention criteria, alike those formulated for
granular filters, which would be based on a single representative opening size of the
geotextile fabric.
Several experimental methods are available for determining opening size distribution of
geotextiles (OSD), directly or indirectly, but no method has been yet universally accepted
for determining the CSD of nonwoven geotextiles. Sieving techniques (dry or wet) are
indirect methods that are commonly used in engineering practice whereas mercury
intrusion porometry, bubble point testing and image analysis are direct methods that
require more sophisticated equipment (Bhatia and Smith, 1996b). The dry sieving method
22
(ASTM D 4751) used for the determination of the apparent opening size (AOS) has been
the standardized method of choice in United States engineering practice (a description of
the test and definition of AOS are provided in Chapter 1). However, the dry sieving
method has several shortcomings. The test results are affected by electrostatic attraction
between the test beads and geotextile fibers, which is not considered representative of
subsurface conditions (Sharma and Lewis, 1995, Giroud, 1996), and during dry sieving
the geotextile fabric yarns can move away from each other, thereby allowing the test
beads to pass through an enlarged constriction (Koerner, 1998). Because of cyclic
conditions applied during dry sieving, the AOS (or Of,95) value obtained from the test is
overestimated as compared to the operating value for the geotextile subjected in the field
to quasi- steady state flow conditions. For these reasons, the dry sieving method has been
gradually substituted with a (wet) hydrodynamic test method standardized under ISO/DIS
12956. The resulting index value representative of opening size is filtration opening size
(FOS). Among direct methods, the bubble point test (ASTM D 6767) is considered to
provide reliable information on the number and size of the smallest effective opening
channels (i.e. the constriction size) in a geotextile sample (Bhatia et al, 1996). However,
the complexity of the test is a hurdle for its practical implementation.
2.4.2 Weaving Pattern
Geotextiles are classified into two broad categories according to their fiber patterns that
are the woven and nonwoven types. Sub-categories exist, each one corresponding to a
particular manufacturing process. Typically, a woven fabric has a regular structure
defined by two orthogonal orientations of fibers and a narrow (in a statistical sense)
opening size distribution. In contrast, a nonwoven geotextile is characterized by a random
23
structure and a wide range of opening size with a broad statistical distribution (Figure
2.4). These structural differences between the two classes of geotextiles result in different
filtration responses. For instance, mono-slit woven geotextiles are more effective as
components of leachate control systems in landfills where there is high potential for
clogging of drainage layers by organic matter, while the tortuous pore network of thick
nonwoven geotextile makes them more prone to retention of well graded non cohesive
soils in transportation infrastructures (Giroud, 1996). Another example of different
retention responses is the observation, made in coastal applications, that under
hydrodynamic flow generated by sea waves (with a period shorter than 10sec) greater
amounts of fines seep through woven textiles than through nonwoven (Chew et al, 2000).
Other properties of geotextiles are influenced by their manufacturing style and can affect
their overall performance as filters. Whereas woven geotextiles are in general much
stiffer than nonwovens under planar tensile stress applied along machine direction of
weaving, this is not necessarily the case in the transverse-machine direction which is
weaker. For a particular geotextile, variation in FOS as a function of applied stress is
strongly linked to the fabric thickness (Fourie and Addis, 1999). This, in turn, influences
the geotextile cross-flow hydraulic conductivity. The flow rate reduction, consecutive to
axial loading, is much more severe with a woven geotextile, and also occurs at smaller
tensile stress level, than with a nonwoven geotextile (Fourie and Kuchena, 1995).
24
Figure 2.4 Different weaving patterns for non woven and woven geotextiles (Te : elementary thickness)
24
25
2.4.3 Porosity
In general, nonwoven geotextiles have very high porosity (85 to 95%) at atmospheric
pressure whereas for woven fabrics it is often lesser than 40% (for the area porosity
POA) according to Giroud (1996). Therefore, the two classes of geotextile differ also by
their specific surface of fiber per unit area of geotextile ( Sa ). For instance a woven
textile with POA=10% may have a specific area, Sa=4.3 m2/m2 while a nonwoven with
porosity, n=0.9, thickness of 2.8 mm the specific area would be Sa=38m2/m2. Porosity is
closely related to geotextile density (mass per total volume), and to specific density
(volume of fiber per total volume). These parameters altogether are indicative of how
tight is the fabric micro-structure. These have been found to be related to the time-rate of
the clogging process and its acceleration observed with high specific density geotextiles
(Faure and Kehila, 1998). The porosity seems to play an important role in controlling the
geotextile ultimate degree clogging by fine particles. If the pore space is large and the
specific area small, which is the case of geotextiles, the probability of fine deposition or
adsorption on the fibers will be very low because in such a filter the flow velocity is
relatively high and thus contact between a fine particle and a fiber is of very short
duration. As compared with granular filters which have lower porosity and larger specific
area (e.g. n=0.3, Sa=463m2/m2 for a 74mm thick layer), the deposition rate of fine
particles on geotextile fibers can be considered negligible (Reddi et al, 2000, Xiao and
Reddi, 2000)
2.4.4 Thickness
The role played fabric thickness in filtration is still a subject of debate, but some trends
have been identified through experiments and theoretical analysis. Because for a given
26
fabric the FOS decreases linearly with increasing thickness, likelihood for migrating
particles being retained inside the fabric, and therefore the fabric being clogged, should
theoretically increase linearly with thickness. This, in principle, applies to both woven
and nonwoven geotextiles, but in fact, fabric thickness (as well as porosity) has more
influence on filtration performance of nonwoven than woven geotextiles (Giroud et al,
1998). For internally unstable soil, filter design is focused on preventing blinding of the
small openings at the interface between soil and geotextile, independently of fabric
thickness. But thick geotextiles with large apertures have also the advantage of allowing
unstable fines to pipe through the filter until bridging can take place. It was found by
Qureshi et al. (1990) that the clogging by fine particles is less severe for thicker
geotextiles while the opposite was reported by Mannsbart and Christopher (1997). On a
theoretical basis, Giroud et al (1998) proposed using two-layer stratified geotextile filters
for well graded soils. In this type of design, the up-gradient fabric in contact with the base
soil would have large openings and the down-gradient fabric would have smaller
openings. This combination would prevent both blinding at the soil-filter interface and
internal clogging of the filter. Thickness contributes also to the geotextile tensile
stiffness3 and therefore makes the pore structure less prone to being altered while it is
subjected to tension (Fourie and Kuchena,1995). Under out-of plane compression, the
thickness of a woven geotextile remains almost unchanged even in the case of relatively
large overburden pressure. On the contrary, nonwoven geotextiles, especially needle-
punched fabrics, are compressible and in some cases their thickness can be decreased by
as much as 50% under high confining pressure of the order of 200kPa (Koerner, 1998). 3 It is noted that nonwoven geotextiles are more ductile than woven geotextiles. Under uniaxial tension, nonwoven fabrics have a tensile strain at failure greater than 50%. For woven fabrics, the failure strain is typically smaller than 30%.
27
This, of course, can considerably affect their pore space geometry, including the opening
size, and reduce their hydraulic conductivity (Giroud, 1996).
2.4.5 Fiber Material
Fibers used in manufacturing of geotextiles are made of plastic polymers. Polypropylene
and polyester are the most frequently used polymers. In the past decade, these two
materials accounted respectively for 85% and 12% of the production (Koerner, 1998).
The role played by geotextile fiber material in filtration relates mainly to the interaction
between fiber and pore fluid. The effect of fiber wettability on geotextile filter
performance was well documented by Giroud (1996). This property can contribute to
discrepancy between filter performance observed in wet versus dry conditions.
Polypropylene and polyester are slightly hydrophilic. In unsaturated conditions, strong
surface tension restricts water movement and slows the flow inside the geotextile. Then,
when full saturation is reached there is a very steep rise in flow velocity and flow rates
can increase by an order of magnitude. If a clay cake is formed at the interface with the
geotextile, the jump in flow rate may be even greater though it takes more time for
saturation being achieved. If oil is used as permeate instead of water, the wettability of
the polymers is somewhat different. Polyester fabrics are more permeable to oil than to
water while polypropylene fabrics are more permeable to water than oil (Scott et al,
1991). Another characteristic of polypropylene fibers is that they swell when in contact
with oil. This can result in significant reduction of permeability of highway drainage
filters in the eventuality of an oil spill.
2.5 Hydraulic Conditions and External Loading
28
Field hydraulic conditions around drains vary from site to site and upon time. The
conditions relevant to filter performance can be divided into steady-state flow and
transient flow. Laboratory column filtration tests are most often performed in steady-
state, constant head, or transient, falling head, conditions. Other hydrodynamic situations
of interest include, for instance, cyclic alternate-direction flow experienced by coastal
protection revetment systems (Cazzuffi et al, 1999, Chew et al, 2000) and pulsed
unidirectional flow due to traffic-induced excess pore pressure at the vicinity of pavement
edge drains (Bhatia and Huang, 1995). Depending on particular site conditions to be
simulated, testing protocols could involve cyclic transient flow modeled as pulse or
sinusoidal input.
Field hydraulic gradients relevant to geotextile filter applications are considered to be of
the order of 1 to 10 (Luettich, 1993). However, the hydraulic gradients applied in
laboratory filtration tests are usually higher than these values in order to shorten the
duration of tests. For internally stable soils, applying hydraulic gradients that are higher
than typical field values does not affect significantly the final hydraulic conductivity of
the samples in long term flow tests (Kossendey, 1999). On the contrary, with internally
unstable soils, the hydraulic gradient magnitude influences the final hydraulic
conductivity because the amount of migrated fine particles depends on flow velocity
(Wayne and Koerner, 1993, Bhatia and Huang, 1995). In cyclic transient flow condition,
the rate of change in hydraulic gradient, Ri=2i/ΔT, where, i, is the maximum gradient
and, ΔT, the period of sinusoidal variation, is a convenient index parameter. Usually, at
high value of Ri (i.e. rapid gradient variation), the amount of soil internal erosion is high,
29
and woven geotextiles allow for a larger mass of piping soil to cross the filter than
nonwoven geotextiles (Chew et al, 2000). Experimental evidence suggests that, when
gradient variation period is long (e.g. 10sec), the condition can be approximated as
steady-state flow.
Compression stress in the base soil induced by externally applied load is not a critical
factor in the case of steady-state flow if the soil skeleton is likely to have already reached
a stable state prior to the application of the load. However, the mass of piping soil is
influenced by load-induced effective stress and hydraulic gradient in the case of transient
flow. According to Cazzuffi et al. (1999), if the geotextile surface is not in tight contact
with the trench backfill, the interface zone between base soil and geotextile filter can
easily become internally unstable under the effect of effective stress decreasing or
hydraulic gradient increasing. This notion is represented graphically in Figure 2.5 where
U1 represents a negative increment of effective stress and U2 a positive increment of
hydraulic gradient.
2.6 Test Methods for Geotextile Clogging Assessments
Commonly used laboratory testing methods of geotextile clogging potential are
classified into three types - long term flow (LTF) test, gradient ratio (GR) test and
hydraulic conductivity ratio (HCR) test (Koerner, 1998). The LTF is a simple test
designed for detecting the change in flow rate through a soil sample and geotextile filter
over time, under constant head condition. This type of test requires a long duration of
sustained flow (sometimes over 200hrs) and, during this time, biological clogging can
also occur (Figure 2.6 (a)). The GR test (ASTM D5101) was designed to detect local
30
Figure 2.5 Relationship between hydraulic gradient and effective confining stress for soil internal stability in transient flow condition(after Cazzuffi et al, 1999)
variations in hydraulic gradient along the soil column and through the filter sample, as a
result of particle migration (Figure 2.6 (b)). Local gradients are determined from pore
pressures measured at various port locations along the sample and at the flow boundaries.
31
The U.S. Army Corps of Engineers criterion for soil-geotextile compatibility based on
this test is that the gradient ratio determined according to the ASTM Standard
(GRASTM=i0-25/i25-50) be less than 3. In the above formula (i0-25) and (i25-50) are the
hydraulic gradients measured between elevations 0 and 25mm above the sample lower
boundary (including the geotextile) and between elevations 25 and 50mm, respectively
above the sample base. A gradient ratio larger than 1 indicates that more hydraulic energy
is lost (due to clogging) through the filter and its interface zone (the bottom 25mm zone)
than in the base soil (the 25mm thick adjacent layer). A modified version was proposed
by Fannin et al. (1994) where the gradient ratio (GRMod=i0-8/i25-50) is used for detecting
the occurrence of blinding at the geotextile surface. The HCR test was proposed by
Williams and Abouzakhm (1989) as a mean to reduce testing time for fine soils and to
simulate in-situ conditions in case of external loading. The outcome of the test is the ratio
of hydraulic conductivities corresponding to alternate-direction gradients obtained by
reversing the flow through the sample (Figure 2.6(c)). Though the HCR test has been
standardized under ASTM D 5567, its shortcoming pointed out by Giroud (1996) is its
sensitivity to the soil specimen length and to the range of applied flow rates.
2.7 Filter Design Criteria
Retention criteria for geotextile filter design are empirical or semi-empirical formulas.
Most often, these relate the smallest particle size of the base soil associated with bridge
formation, Di (represented, for instance by D50 or D85) to the geotextile controlling
opening size Of* (represented, for instance by the filtration opening size, FOS, or the
apparent opening size, AOS, as index values of Of,90 or Of,95). Most design criteria
prescribe a range for the ratio (Rr=Of*/Di) either numerically or in function of additional
32
parameters related to soil properties such as grading or soil type (Christopher and Fischer,
1992). More specific design methods take into account the hydraulic conditions or
additional geotextile and soil properties (Luettich et al, 1992). Extensive reviews of
geotextile retention criteria can be found elsewhere (e.g. Palmeira and Fannin, 2002) A
summary of these is presented in Appendix A and only a few representative examples are
discussed below.
Figure 2.6 Conceptual representation of the main types of geotextile filtration tests
33
2.7.1 FHWA Criteria (Christopher and Holtz, 1985 and Christopher et al, 1995)
This retention criterion was presented in the 1995 FHWA geosynthetics design and
construction guidelines. For internally stable soils with less than 50% fines (<0.075mm),
it is expressed as AOS/D85<B where B is function of the soil uniformity coefficient, Cu.
For Cu lesser than 2 or greater than 8, coefficient B is equal to 1. Within the interval
2<Cu<8, coefficient B varies between 1 and 2, with the maximum for Cu=4. This, in
concept, is similar to the criterion derived by Giroud (1982) for idealized soil made of
perfectly packed spherical particles and linearly graded. For soil with more than 50%
fines, Christopher and Holtz recommend AOS<0.3D85 when the soil is internally unstable
and the flow condition is steady state. When the flow is transient, with alternated
directions or pulsing, they recommend AOS<D15 irrespectively of internal stability. A
shortcoming of the method may be the adoption of the dry sieving AOS as the opening
size index instead of a wet sieving FOS, which is more representative of field conditions.
2.7.2 Geosyntec Group Criteria (Luettich et al, 1992)
Luettich et al (1992) presented their retention criterion as part of a design flow chart
applicable to cohesive or non cohesive soils and steady-state or transient flow conditions.
In the chart soils are categorized according to their amount of fines and cohesiveness.
Unless a soil is non dispersive (DHR < 0.5) and plastic (PI > 5), it is categorized as non
cohesive. In the case of dispersive (DHR > 0.5) and plastic (PI > 5) soil, the authors
recommend installation of an additional fine sand layer up-gradient, in contact with the
geotextile filter. In the non cohesive case, they characterize the soil as stable or unstable
and determine a pseudo-coefficient of uniformity Cu’ in the linear section of the GSD,
34
tangent to the D50 point. Prescribed values of Of,95/D50 values are function of soil relative
density. It is noted that, in this method, a soil can be characterized as cohesive or non
cohesive depending on the clay content (30% being the threshold amount) but also the
flow regime. A shortcoming is in the determination of the soil internal stability which is
based on a linearized GSD.
2.7.3 Lafleur’s Criteria (Lafleur, 1999)
Lafleur (1999) focused on retention of non cohesive soils. For internally stable soils, the
ratio (Rr=FOS/Di) is recommended to be smaller than 1, with Di=D85 when Cu<6, Di=D50
when Cu>6 and the GSD has a linear shape, Di=Dgap,min when Cu>6 and the GSD is
gapped, Di=D30 when Cu>6 and the GSD is concave upwards. For internally unstable
soils, the ratio (Rr=FOS/Di) is to be kept between 1 and 5, with Di=D30 for GSD either
gapped of concave upwards. However, Lafleur pointed out that, in order to reflect the
broad range of experimental data available, more information related for instance to the
opening size distribution or fiber properties would have to be included in filter design.
2.8 Earlier Experimental Results
Significant data from filtration tests has been generated by earlier researchers and
documented in published literature. As part of the present study, this database was
analyzed. The most important aspects of filtration and influence of major factors were
identified and discussed in the previous sections of this text.
In addition, synthesis of these data from Williams and Abouzakhm (1989), Siva and
Bhatia (1993), Murty et al. (1994), Almeida et al. (1995), Bhatia and Huang (1995) and
Nishigata et al. (2000) was performed in order to summarize the test results in function of
35
soil GSD and filter opening index parameters. The geotextile filtration opening size
(FOS), two specific particle sizes of the soil (D10 and D85), its uniformity coefficient
(Cu), and the initial and final system hydraulic conductivities (Ki and Kf) were extracted
from the database and used for the synthesis. The ratio of Ki over Kf indicates change in
system (i.e. soil and geotextile) hydraulic conductivity between the start and the end of a
test. Ratios significantly larger than 1 indicate a serious reduction of hydraulic
conductivity, consecutive to clogging. These data are shown in Figure 2.7 in function of
Cu (Figure 2.7(a)) and FOS/D85 (Figure 2.7(b)). From these plots, there is no clear
evidence of role played by Cu, but there is clear indication of correlation with FOS/D85.
According to Figure 2.7(b), clogging tends to occur for samples tested with ratios,
FOS/D85, in the vicinity of 1 or smaller. This observation seems to be in contradiction
with a number of retention criteria where recommended design values of the ratio are
close to this region. Further information is presented in Figure 2.8 where the ratio Ki/Kf is
plotted in function of both FOS/D85 and D10. Here it appears that cases with strong
reduction in hydraulic conductivity, in the range of FOS/D85 close to 1 are samples with
small values of the smaller particles diameter, D10. This confirms the presence of small
particles, not only the larger ones, controls the filter performance in the tests. A possible
explanation is that blinding of the filter fabric by fine particles is what occurred in these
cases.
This would suggest a most critical circumstance is in the combination of a significant
amount of very fine particles with a small filter opening size prone to blinding.
36
Figure 2.7 Summary of clogging test results in function of material parameters, based on literature review. Large values of Ki/Kf ratio indicates clogging of filter system, where Ki
and Kf are initial and final system hydraulic conductivities respectively
37
Figure 2.8 Multi -parameter visualization of clogging test results, based on literature
review (Ki : initial hydraulic conductivity, Kf : final hydraulic conductivity, FOS : filtration opening size of geotextile, D10, D85 : sizes (diameter) of grains at 10 and 85 % in
cumulative soil GSD
38
2.9 Earlier Field Performance Study
An extensive field investigation was performed in the 1990s under the auspices of
FHWA and almost all state DOTs (Indiana did not participate) in order to assess the field
long-term performance of highway drain geosynthetic filters (Koerner et al,1996,
Wilson-Fahmy et al, 1996). The study included exhuming geosynthetic filters from at a
number of sites where these had been in service over a period of time and, through
examination and testing, find how much clogging and deterioration of their properties
had occurred. Filters at 41 edge drain locations were examined for soil retention,
permeability and geotextile clogging assessment. Then, these observations were
confronted to several current design methods including those proposed by Giroud (1982),
the French Committee of Geotextiles and Geomembranes (1986), Fischer et al (1990),
Luettich et al (1992) and Christopher and Holtz (1985) for the FWHA. Results of this
comparative study are presented in Table 2.1. For each performance criterion and design
method, the total numbers of cases where the design method would have been able to
predict the observed performance or would have failed to predict it are indicated with
symbols S and F, respectively. It is noted that categories defined by symbols S or F do
not relate to successful or failing performance of the filters themselves, but to success or
failure of the design methods in predicting performance. Inspection of these statistics in
Table 2.1 suggests better graded, mixed particle size types of soils (i.e. between 12% and
50% in fine content) are the most difficult filter design cases while design methods are
more successful in cases of either mainly fine grained (i.e. more than 50% fines) or
coarse grained (i.e. less than 12% fines) soils.
39
Table 2.1 Capability of selected geosynthetic filter design criteria to predict filter field performance, based on observation of exhumed samples at sites investigated by Koerner
et al (1996) (after Wilson-Fahmy et al, 1996)
Criteria Source Coarse Soil ≤12% fine
Mixed Soil 13-49% fine
Fine Soil ≥ 50 % fine
Permeability Giroud (1982) French (1986) FHWA (1985)
S* – 15 ; F* – 1 S – 0 ; F – 7 S – 7 ; F – 9
S – 44 ; F – 2 S – 25 ; F – 21 S – 43 ; F – 3
S – 10 ; F –1 S – 15 ; F – 5 S – 19 ; F –1
Retention French(1986) Fisher (1990)
Luettich(1992)
S – 16 ; F – 0 S – 16 ; F – 0 S – 16 ; F – 0
S – 38 ; F – 2 S – 30 ; F – 10 S – 35 ; F – 5
S – 19 ; F – 0 S – 1 ; F – 8 S – 16 ; F – 3
GT clogging French (1986) FHWA (1985) Fisher (1990)
N/A N/A N/A
S – 24 ; F – 22 S – 33 ; F – 13 S – 28 ; F – 18
S – 19 ; F –1 S – 19 ; F –1 S – 19 ; F – 1
* S : success in predicting filter field performance; F : failure to predict filter field
performance; numbers indicate corresponding frequencies of cases.
40
3. Investigation of Field Conditions and Long-Term Performance
3.1 Purpose of the investigation
The purpose of this particular part of the project was two-fold:
(a) Identify and characterize, using samples provided by INDOT, several types of
subgrade soils encountered in Indiana highway construction for which geotextile
filters would likely be required. These soil types would be later used for filter
selection and design examples.
(b) In order to assess long-term field performance of geosynthetic filters already
utilized by INDOT, it was necessary to sample material (filter and adjacent soil)
from selected site(s) of Indiana highways where geotextile filters had been in
service for a significant amount of time. Then, the state of clogging of these
samples was to be assessed in the laboratory by performing detailed visual
examination for evidence of fine particles blinding or penetrating the fabric, and
by performing hydraulic conductivity tests. It was also expected that results of
underdrain pipes video inspections would be available in order to detect intrusion
of sediment into the pipes.
3.2 Study of Soil Samples Provided by INDOT
Four disturbed samples from 4 different locations were delivered to the Purdue
geotechnical laboratories. These are listed in Table 3-1 together with their origin and
preliminary description. Sample water contents are also indicated but it should be noted
that, because of sample disturbance, these are inaccurate representations of field values.
41
Tests performed on these samples included grain size analysis (sieve and hydrometer test
ASTM D 422) and determination of Atterberg’s limits (ASTM D 4318). As can be
verified from the grain size distributions (GSD) in Figures 3-1 & 3-2,
AASHTO M145)M1 Silt CL or ML A-6 (8)S1 Sandy loam CL or ML A-6 (2)C1 Silty clay CL A-6 (18)C2 Bloomington clay CH A-7-6 (29)
42
It is interesting to note that, if one follows strictly the current INDOT guidelines (see
Chapter 1), only the soil of sample M1 (fine fraction greater than 50% and clay fraction
lesser than 20%) would require installation of a filter. The other 3 samples do not meet
the current INDOT criteria for a filter being required because, for S1 the fine fraction is
only 40%, and for C1 & C2 the clay fraction is greater than 20% in spite of the fine
fraction being much greater than 50%.
3.3 Field Evaluation of Filter Long-Term Performance
3.3.1 Site Selection and Sampling
Criteria for sampling site selection were of technical and logistical nature:
(a) Presence of geotextile filters in service for at least several years at a site was
required for the site be eligible to. The preferred configuration, in line with the
project objectives, had to be that of a geotextile lined around edge drain trenches
and providing filter protection to a perforated drain pipe. Prefabricated
geocomposite edge drains were not to be considered in priority because this type
of edge drain is not anymore the technology of choice for INDOT. It is noted,
however, that a number of such prefabricated geocomposite edge drains are still
in service in Indiana highways.
(b) In order for the collected information be of optimal relevance, it was
anticipated that site at which inadequate filter or drain performance had been
reported or was suspected by INDOT personnel were much preferable.
(c) In order to minimize the cost the field work, avoid disrupting traffic, and for
access to sampling locations be facilitated, candidate sites were likely to be
43
highway reconstruction or rehabilitation project sites. At such sites where old
underdrains were being removed and replaced by new ones, sampling of the old
filters and of the soil would be possible in the best conditions.
Requests were sent to all INDOT Districts in order to identify sites that would meet the
above criteria. As a result of this survey only one site, located in the Vincennes District
on Sullivan County, along US 41 at its intersection with SR 154, seemed to be a good
candidate and was selected. This location is the site of a US 41 widening and
reconstruction project. During the Summer of 2004 old underdrains were removed and
new ones installed. However the old underdrains installed c. 1990 appeared to be of the
prefabricated geocomposite edge drains type (i.e. Monsanto Hydraway) made of a
corrugated plastic drainage core encapsulated with needle-punched nonwoven geotextile
filter. In spite of this shortcoming and because it was apparent that clogging had occurred
to the filters, it was decided to take samples of these edge drains and further examine
their geotextile components in the laboratory. During collection and transport of the
samples, precautions were taken for preventing disturbance and loss of the fines that were
present on the surface or within the geotextile fabric. Soil representative of the subgrade
in contact with the edge drains was also taken from a shallow excavation at the site. Two
soil samples were collected: one disturbed sample and one low-disturbance sample, the
latter being obtained using a Shelby tube. In addition to the geosynthetic and soil
samples, recycled concrete aggregates utilized for the reconstruction project were also
collected.
44
3.3.2 Analysis of Soil Samples from the Sullivan Co. US 41 Site
On the basis of its grain size distribution (i.e. 13% sand, 55% silt and 27% clay fractions
in weight), its classification and its appearance, the soil sampled at the site is very similar
to Sample C2 , Bloomington clay, already provided by INDOT (see Fig. 3-2, Fig. 3-3,
and Table 3-2). The saturated hydraulic conductivity was determined, in the laboratory,
using a falling head permeability test performed with a flexible wall permeameter. For
this test the sample, 37 mm in diameter and 62 mm thick, was reconsolidated at an
effective confining pressure of 10 kPa, full saturation being achieved by application of
back pressure. The corresponding void ratio was 0.52. Permeation was performed under
an average gradient of 30, and the resulting coefficient of permeability was 3.8x10⁻⁶ cm/s.
3.3.3 Analysis of Geotextile Samples from the Sullivan Co. US 41 Site
Once the geocomposite edge drains samples were in the laboratory, their geotextile filter
layers were carefully separated from the drainage cores for further inspection and testing.
According to manufacturer’s documentation, this geotextile is a needle-punched
nonwoven fabric made of polyethylene fibers. It is 2.5mm thick, has a mass per unit area
of 253 g/m2 and filter opening size, FOS=0.06mm. Visual inspection revealed that most
fine soil particles had remained within the filter fabric and no sediment was found in the
drain core. The geotextile degree of blinding or clogging after 15 years of service varied
from sample to sample, depending probably on local variations in soil and hydraulic
conditions at the site. Some samples were practically intact while others were covered
with soil lining their surface and significant clogging was suspected. In Fig. 3-4 are
shown two pictures of non-clogged (right-hand side) and heavily clogged (left-hand side)
specimens. In order to quantify the effect of clogging on the capacity of the filters to
45
allow free flow of water to the drainage, the hydraulic conductivity perpendicular to the
geotextile plane of clogged samples was compared to that of non-clogged samples. The
hydraulic conductivity was determined on disk-shaped specimens placed in a
permeameter with no soil sample present. Gradients across the geotextile were kept equal
to 20. The non-clogged samples still had a high hydraulic conductivity close to that of an
intact sample of K= 0.15 cm/sec, but the hydraulic conductivity of the clogged samples
was only 1.89x10⁻⁵ cm/sec that is about 10,000 times smaller than the intact value.
3.3.4 Analysis of Bloomington Clay Filtration with Geotextile Samples from the Sullivan Co. US 41 Site
In order to verify the ability of the exhumed geotextile to still work as a filter for the soil
conditions encountered on the site, a filtration test was performed in the laboratory using
a non-clogged geotextile sample and Bloomington clay. The type of test performed is
known as the Rapid Retention Test (RRT). It is simple but accurate enough for being
routinely performed on geotextile filters and has been used extensively in this study.
Greater detail on the RRT development, technique and equipment is provided in a
subsequent chapter (Chapter 6) of this report. For the sake of the present discussion, only
the principle is described briefly and results are presented. The test consisted in placing
the soil specimen, 25 mm (1 in) thick and 100 mm (4 in) in diameter on top of a
geotextile disk in a flexible wall permeameter. After specimen saturation and
consolidation had been achieved in the cell, downward flow was induced under a fairly
high gradient, i=10, with the direction of seepage going from the soil to the geotextile,
and the overall hydraulic conductivity of the composite system (soil and geotextile) was
determined. The test was kept running for 8 hours in order to monitor changes in
46
hydraulic conductivity due to soil particle migration. At the start of the test the system
hydraulic conductivity was 1.2x10⁻⁴ cm/s (2.3x10⁻⁴ ft/min) and, after 8 hours, had
decreased to 2.6x10⁻⁶ cm/s (5.1x10⁻⁶ ft/min) cm/sec. Such a decrease of the soil/geotextile
interface zone permeability (by a factor 100) is significant enough as the indication that
clogging occurred during the test. However, it is noted that the gradient applied during
the test was likely to be higher than typical values occurring in the field. Thus, in the test,
seepage forces induced to soil particles and their resulting mobility were probably more
severe than in the field.
3.3.5 Filtration Test of Recycled Concrete Aggregate from the Sullivan Co US 41 Project
Filtration testing was also attempted on the aggregates used on the site for reconstructing
the pavement. These aggregates, produced by rubbleization of the old concrete pavement,
have been suspected of being a source of contamination for the underdrains at various
INDOT projects. The rubbleized aggregate is occasionally mixed with chemicals -
asphalt emulsion (AE) or polymer modified prime (PMP) for purpose of base course
stabilization. The aggregate sample taken from the site was agglomerated with AE and
PMP chemicals. It was necessary to break it down to gravel-size grains in order to
perform tests in standard laboratory equipment. Fractioning also had the effect of
increasing the specific surface area and enhancing chemical reactions with water.
Crushed aggregates encrusted with stabilizer were separated from the clean ones (Fig.3-
5) and placed in a transparent plastic cylinder to form a 5 cm (2 in) thick layer resting on
three geotextile filter disks (Fig.3-6). With this setup shown in Fig. 3-7, a long term
filtration test was kept running for 2 weeks. A longer duration would have allowed
47
bacteria to grow inside the system and to interfere with the chemical or mechanical
clogging processes. Untreated tap water was used as permeating fluid. The test was
conducted in unsaturated condition at constant influent flow rate (100 cc/min) and the
effluent rate was monitored once a day. In case of clogging, the effluent rate would be
observed to decrease with time. But no significant change in effluent rate was observed
during the test and, therefore, no hydraulic evidence of clogging was obtained. However,
after the sample was dismantled mottled stains were found on the geotextile layers, with
their extent decreasing from the top layer to the bottom one (Fig.3-8). Though no
chemical analysis was performed, their color and odor seem to exclude that these stains
were made of stabilizer chemicals. More likely suspects are the hardness of tap water and
cement chemicals present in recycled concrete aggregates. The latter is consistent with
earlier findings by Wukash and Siddiqui (1996).
3.3.6 Video Inspection of Subdrainage Pipes
Several VHS tapes of underdrain pipe non-destructive inspections performed using a
system similar to the borescope (an optical device that can be inserted in the drain and is
connected to a video recorder) at different sites were made available to the investigators
by INDOT Vincennes District’s engineers. Although these inspections do not relate to the
same US 41 project but were performed at other sites, the video tapes contain information
of interest in the present study. All the underdrains were installed in Fall of 2000 and
were inspected in 2001 after 8 to 12 months of service. More information on the sections
inspected is presented in Table 3-3.
48
The tapes were reviewed in detail and important features were noted. However analysis
of this information and lessons that can be learnt from it are limited because clear,
unambiguous correspondence between the project sections described in Table 3-3 and the
video recording sections shown on the tapes is not provided. Also, in a number of
instances the inspection instrument is used under water or is moved too fast within the
pipes and, as a result, the recorded pictures are blurred.
Table 3-3 General information on video inspections of drainage pipes
Following is a summary of observations (dates and times indicated are inspection dates
and times that are marked on the tapes):
Sections 1a & 1b (inspected July 27-31, 2001) - Water is present in pipe with level varying along section. Light sediment deposit
Section Project/Location Type of Drain Geotextile Filter Rubbleization
1a R-24635 / SR 37 Oolitic-50 West
100mm perforated pipe No No
1b same as above 150mm perforated pipe Yes No
2a R-24844 / SR 37 Laurence Co.
100mm peforated pipe No Yes
2b same as above 150mm perforated pipe Yes No
3 R-24881 / US 41 Sullivan & Knox
100mm perforated pipe Yes No
49
is present in most of the section of pipes recorded. This sediment has the appearance of light silty powder lining about 10% to 20% of the pipe interior perimeter but it doest form a cake nor create obstruction or significant reduction in cross-section. Structural damage of pipe is observed at several locations.
Sections 2a & 2b (inspected June 18- July 9, 2001)
- Water is present in pipes with level varying along section. - June 18 footage: Along most of the segment, beige sediment forming cake lines
50% to 70% of pipe perimeter, reducing inflow of water to the pipe. Cross-section of pipe is reduced by about 10%. At several locations, pipe has collapsed and inspection instrument is blocked. At clock mark, 14:24, heavy accumulation of white shining deposit, possibly of chemical origin rather than soil particles. Cross-section of pipe is reduced by approximately 40%.
- June 19 footage: Same as previous segment. At clock mark, 10:56, pipe is completely obstructed by sediment, blocking inspection instrument.
- June 20 footage: Sediment cake present, similar to previous section, but no obstruction of pipe. Several instances of pipe collapse.
- June 27 footage: Sediment forming cake lining 30% to 50% of pipe perimeter. Cross-section reduced by approximately 10% but no obstruction. From clock mark, 17:30 to end of segment, pipe is clean.
- June 28 footage: Along the first 440’ of this segment, significant sediment accumulation forming cake over 30% of perimeter and reducing the cross-section by 10% to 20%, then clean pipe. At clock mark, 9:17, intrusion of vegetal material and obstruction of pipe combined with structural damage. Starting at clock mark, 9:55, presence of light sediment lining 20% of perimeter, with no cake formation or obstruction. At clock mark, 11:00, pipe has collapsed. Starting at clock mark, 13:04, light sediment lining approximately 60% of perimeter.
- June 29 footage: Light sediment lining about 30% of perimeter. Between clock marks 8:49 and 9:30, pipe is clean, then sediment lining 20% to 50% of perimeter.
- July 5 footage: Starting at clock mark, 7:46, heavy sedimentation lining 100% of perimeter and forming cake. Pipe cross-section is deformed and reduced by 60%. At clock mark , 7:47, pipe is obstructed by sediment and instrument blocked. Next segment, starting at clock mark, 8:05, is 20% lined by light sediment. At clock mark, 8:08, pipe is obstructed by sediment and instrument is blocked. From clock mark, 8:22, to the end of the segment, sediment deposits covering between 10% and 60% of pipe perimeter, with minor cake formation.
- July 9 footage: no data because of bad operation of instrument. Section 3 (inspected August 8, 2001)
- This section was completely dry on day of inspection. Starting at clock mark, 11:16, until 14:30 the pipe is clean or lined with light sediment lining up to 30% of its perimeter. No cake formation or obstruction. Next, vegetal material is present in pipe with, at 14:34, heavy accumulation of sediment obstructing 50% of cross-section. Rats are present in pipe. From clock mark, 14:44, to end of segment, pipe is clean or lined with light sediment deposit (up to 30% of
50
perimeter) with no cake formation or obstruction except at 17:07 where vegetal material has accumulated.
3.4 Summary of Field Studies Findings
Geotechnical situations that are considered prone to filtration problems with highway
underdrains and from which soil samples were analyzed are characterized by high silt
content. At the Sullivan Co. US 41 project site where samples of exhumed filters were
obtained, the soil is similar to Bloomington clay with its grain size distribution dominated
by the silt fraction. The filter samples from this site exhibited variable degree of clogging
after 15 years of service. When quasi-intact specimens were tested in the laboratory
together with Blooomington clay, their tendency to clogging with this soil was
confirmed. Additional, but very limited, testing in the laboratory suggests chemicals from
recycled (rubbleized) concrete aggregates might also affect the integrity of geotextile
filters.
Video recording of underdrain pipe non-destructive inspections from different INDOT
projects show moderate to heavy sedimentation within pipes after one year of service,
suggesting adequate filtration was lacking. Heavy sedimentation is characterized by
formation of a cake around the pipe interior perimeter. This cake is likely to clog the pipe
perforations and prevent drainage water to enter. It also decreases the pipe cross-section
and affects its discharge capacity. In several instances, complete obstruction of pipes by
sediment is observed as well as structural damage or failure. Sediment accumulation was
found to vary significantly along all the sections inspected irrespectively of the presence
51
or absence of geotextile filters or of pavement rubbleization. These spatial variations are
likely to be related to spatial variations in soil and hydraulic conditions.
Figure 3-1 Grain size distribution of the silty soil samples provided by INDOT
52
Figure 3-2 Particle size distribution of the clayey soil samples provided by INDOT
53
Figure 3-3 Atterberg’s limit analysis for soil samples provided by INDOT
54
Figure 3-4 Two samples of the same geotextile filter from the Sullivan Co. US 41 site exhumed after 15 years of service: heavily clogged (left-hand side) and almost intact (right-hand side)
55
Figure 3-5 Rubbleized concrete aggregates after crushing (LHS : with stabilizer, RHS : after stabilizer is removed)
56
Figure 3-6 Installation of 3-layer non woven geotextile filter prior to testing with rubbleized concrete aggreagate
57
Figure 3-7 Testing device for chemical clogging of geotextile filters with rubbleized
concrete aggregate
58
Figure 3-8 Chemical stains or deposits on geotextile filters after 2 weeks of testing with rubbleized concrete aggregates
59
4. Numerical Simulation of Hydraulic Conditions in Pavement
4.1 Introduction
Moisture and flow conditions within pavement structures and their drainage systems are
highly variable with time and space. Like in other physical systems exposed to the
environment and in contact with atmosphere, the amount of moisture present in the layers
of a pavement and its movement are subject to seasonal, daily and even shorter term
variations in function of precipitation and weather patterns. Pavement structures are
stratified systems made of material layers that are relatively thin (as compared to natural
soil deposits in general) and have contrasted hydraulic properties. For instance, in a
particular roadway cross-section the hydraulic conductivity of concrete pavement course,
aggregate base or subbase layers, and subgrade soil often differ by orders of magnitude.
Furthermore, the nature of subgrade soil or the groundwater table elevation is not often
uniform along a highway section and these variations, in turn, affect the hydraulic
situation in the pavement and drainage system. As a result of such complexity, intuition is
often deceptive and simple models misleading as to predicting the distribution of
moisture and its flow patterns in pavement and underdrain systems. In Fig. 4-1a is shown
a simple model of rainfall water infiltrating through a permeable material overlaying an
open drainage layer. If the rainfall is of intensity and duration sufficient to produce
saturation of the upper layer and steady-state vertical flow, the gradient becomes uniform
and equal to one, which is the typical value suggested by Giroud (1996) for pavement
edge drains. But when the flow toward a pipe drain is considered (Fig. 4-1b) the simple
one-dimensional flow model is irrelevant because with this geometry, under saturated,
60
steady-state flow regime, the velocity must increase with decreasing distance to the pipe
and therefore the gradient is neither uniform nor equal to one.
In the present study, one is particularly interested in the magnitude of hydraulic gradients
in the vicinity of and across geosynthetic filters. The gradient magnitude is an important
parameter in the filtration process because it controls flow velocity and seepage forces
that cause fine solid particles to migrate. When planning for the performance of filtration
tests in the laboratory, which will be presented in the subsequent chapters of this report, it
is desirable that the gradient applied in the test be at least as strong (or even stronger)
than the operating field gradient, so that conclusions drawn from test results be on the
safe side for engineering purpose. Thus a quantitative assessment, or at least a reasonable
approximation, of flow patterns and resulting gradient distributions are required. The
practical mean of obtaining this information is through numerical modeling and
simulation of hydraulic events in a pavement system. The software, PURDRAIN,
originally developed as part of a JTRP Research Study (Espinoza et al., 1993) was
utilized for performing this task. Using PURDRAIN it is possible to model the two-
dimensional geometry of a pavement cross-section and its materials hydraulic properties.
Rainfall events can be simulated and resulting subsurface moisture and flow patterns in
the system analyzed. The program takes into account changes in degree of saturation, as a
function of time, and corresponding changes in hydraulic conductivity. The numerical
solution technique used in PURDRAIN is the finite difference method. It is computer-
intensive but provides reasonably accurate solutions for the governing system of non-
61
linear differential equations. Details on the related theory, material constitutive models
and solution algorithms can be found elsewhere (Espinoza et al., 1993, Espinoza, 1993).
4.2 Analysis of Subsurface Flow Patterns Using PURDRAIN
A two-dimensional example case was devised, defined by its geometry, cross-section and
material hydraulic properties. Then, three hydraulic scenarios were simulated and the
resulting subsurface flow analyzed. The example characteristics that were considered are
believed to be, in simplified form, representative of a range of possible situations in
Indiana highways. Some of the characteristics, such as the boundary conditions or the
rainfall intensity, may seem restrictive or extreme, but these were selected for the purpose
of maximizing flow toward the edge drain and generating severe gradients across the
filter.
4.2.1 Geometry
A cross-section drawing, obtained from INDOT, of pavement-shoulder joint and edge
drain area configuration is shown in Fig. 4-2. The cross-section used for numerical
simulations (Fig. 4-3) is a simplified version of this original.
4.2.2 Boundary conditions
Also indicated in Fig. 4-3 are impervious boundary conditions at the bottom and sides of
the model. In fact, the lateral conditions are not physically true impervious boundaries
but are assumed to be symmetry axis and, because of symmetry, behave hydraulically as
if they were impervious. At the surface, the concrete pavement layer is assumed
impervious while the shoulder is assumed open to infiltration from rainfall. In the edge
drain, the boundary condition for the perforated of slotted pipe is that of a “sink”
(Espinoza et al. 1993).
62
4.2.3 Material hydraulic properties
When they are partially saturated porous materials exhibit complex behavior with respect
to their interactions with pore water. Of particular interest for the present analysis are the
relationship between matric suction (i.e. the capillary pressure head) and degree of
saturation, and the relationship between hydraulic conductivity and degree of saturation.
When the degree of saturation increases the matric suction decreases while the hydraulic
conductivity increases. These two relationships control the material constitutive response
to boundary-induced moisture movement. A number of constitutive models have been
proposed to mathematically represent this behavior and several of these are available to
PURDRAIN users. Detailed discussions on the relative merits of these constitutive
models can be found elsewhere (e.g. El-Kadi, 1985, Espinoza, 1993a). In the present
study, the Brooks and Corey (1964) model was selected for its accuracy and still relative
simplicity. Analytical expressions of the suction-vs-saturation and the permeability-vs-
saturation functions in the Brooks and Corey model are given in Eq. 4-1 and 4-2,
respectively, and example plots are shown in Fig. 4-4.
1
e
e
S = for PBPB
S 1 for < PB
υψ ψ
ψ
−⎛ ⎞ ≥⎜ ⎟⎝ ⎠
= (4-1)
ηS eK = K S⋅ (4-2)
In this formulation, Se is the effective degree of saturation, Ψ, the matric suction, PB, the
bubbling pressure and, ν, the pore size distribution index parameter. K is the hydraulic
conductivity at partial saturation, Ks the hydraulic conductivity at full saturation and η the
63
hydraulic conductivity factor. The effective degree of saturation is related to the
volumetric moisture content, θ, or to the degree of saturation, S, as
Se= (θ - θr ) / ( θs - θr ) = (S - Sr ) / ( 1 - Sr ) (4-3)
where θs and θr represent the volumetric moisture content at full saturation (equal to the
porosity) and its irreducible value (i.e. the residual moisture under high suction),
respectively. The residual degree of saturation, Sr , corresponds to the residual moisture
content. The difference between the two limiting values of the moisture content (Δθ=θs-
θr) is called volumetric water capacity and is equal to the effective porosity. Data for the
model parameters used in the analysis are summarized in Table 4-1. These were derived
from the experimental study performed by Ahmed (Ahmed et al., 1993) on the hydraulic
properties of Indiana pavement materials. Two cases were considered for the subgrade
properties, in order to test the influence of its permeability on the flow patterns while the
properties of the aggregate layers are kept unchanged. The subgrade hydraulic
conductivity at saturation in Case 2 is one order of magnitude lower than in Case 1. Still,
in both cases the characteristics are compatible with sandy silt or silt subgrades that make
filtration such an important issue.
Table 4-1 Input parameters for the Brooks & Corey partially saturated materials model
Aggregate layers Subgrade Case 1 Subgrade Case 2Saturated permeability (cm/sec)
Figure 4-2 Design example cross-section for pavement-shoulder joint area and edge drain in Indiana roadways
70
Figure 4-3 Simplified cross-section and boundary conditions used in numerical
simulations using PURDRAIN
71
Figure 4-4 Brooks and Corey (1964) model for water retention and hydraulic conductivity functions
72
Figure 4-5 Simulated initial conditions and rainfall scenarios: (A) Drainage from fully
submerged condition, (B) Rainfall infiltration following very dry period and (C) Rainfall infiltration following wet period with high water table in subgrade
73
Figure 4-6 Simulation results for Scenario A1: drainage from fully submerged condition
with low permeability contrast between subgrade and aggregate layers (a) hydraulic head distribution in cm (the elevation datum plane is at bottom boundary);
(b) saturation degree distribution
74
Figure 4-7 Simulation results for Scenario A2: drainage from fully submerged condition
with high permeability contrast between subgrade and aggregate layers (a) hydraulic head distribution in cm (the elevation datum plane is at bottom boundary);
(b) saturation degree distribution
75
Figure 4-8 Simulation results for Scenario B1: rainfall infiltration following very dry
period with low permeability contrast between subgrade and aggregate layers (a) hydraulic head distribution in cm (the elevation datum plane is at bottom boundary);
(b) saturation degree distribution
76
Figure 4-9 Simulation results for Scenario B2: rainfall infiltration following very dry
period with high permeability contrast between subgrade and aggregate layers (a) hydraulic head distribution in cm (the elevation datum plane is at bottom boundary);
(b) saturation degree distribution
77
Figure 4-10 Simulation results for Scenario C1: rainfall infiltration following wet period
with low permeability contrast between subgrade and aggregate layers (a) hydraulic head distribution in cm (the elevation datum plane is at bottom boundary);
(b) saturation degree distribution
78
Figure 4-11 Simulation results for Scenario C2: rainfall infiltration following wet period with high permeability contrast between subgrade and aggregate layers
(a) hydraulic head distribution in cm (the elevation datum plane is at bottom boundary); (b) saturation degree distribution
79
5. Laboratory Investigation of Geotextile Filtration by Flexible Gradient Ratio Test – Effect of Soil Property
5.1 Introduction
The objective of this chapter is to present the results of the flexible wall gradient ratio
(FWGR) tests performed to investigate the effects of soil properties (fines content and
degree of compaction) on the internal stability of a soil medium. Section 5.2 presents a
description of the FWGR test. Then, the material properties of soil and geotextile and test
hydraulic conditions are described in Section 5.3. Test results are presented and discussed
in Sections 5.4 and 5.5. Section 5.6 summarizes the key findings presented in the chapter
5.2 Description of FWGR Test
The flexible wall gradient ratio (FWGR) test was proposed by Harney and Holtz
(2001) in order to combine the advantages of the gradient ratio test (GR [ASTM D5101])
and the hydraulic conductivity ratio test (HCR [ASTM D5567]). The advantages of the
GR and HCR tests are described in Section 2.6.
The FWGR test device allows application of an effective overburden stress thus more
closely simulating actual field conditions. Fully saturated soil conditions can be achieved
with the application of a back-pressure. Side leaking in a conventional GR test is fully
prevented by using a flexible membrane and a confining cell pressure. Pore pressure
80
changes in the vicinity of the geotextile (GT) filter are monitored so that the fine particle
migration at the soil-GT interface can be traced in real time.
The FWGR testing apparatus used in this research is comprised of the following major
components: the cell; the pressure panel for application and control of the cell and pore
pressures; the sensors for measuring cell and pore pressures as well as axial and
volumetric changes; the data acquisition system interfaced with a PC.
The cell, shown in Figure B.2 in appendix, is similar to that employed for triaxial
testing. It houses a specimen that is 10.2 cm in diameter and 15 to 17 cm in height
(Figure 5.1). The test soil is seated on top of a geotextile specimen. Wire mesh
underlying the geotextile supports the weight of the test specimen. A bowl type container
is installed below the wire mesh to collect the fine particles that migrate through the
geotextile. The capture capacity of this hollow container is 86 cc.
A pressure panel manufactured by GEOTEST (1994) is used for application of the cell
pressure and of the back pressure. The panel is equipped with three air pressure
regulators which control the cell pressure and the pressure heads at the top and bottom of
the test specimen. Actual back pressure is evaluated from averaging the two pressure
heads applied to the test column. Four scaled burettes, each with 60 cc capacity,
connected to each other in parallel, continuously measure the flow rate through system
Therefore, large flow rates, which are anticipated at the beginning of a test, can be
81
promptly monitored even for soil specimens having high hydraulic conductivity. A
reservoir tank with a capacity of 20 L provides deionized water.
While the panel is instrumented with a gage for monitoring the pressures applied,
sensors are mounted on the cell for direct measurement of the pressures. Specifically, the
cell is instrumented with a 100 psi (689 kPa) capacity diaphragm pressure gauge for
measuring the cell pressure. Six similar additional transducers are used for monitoring
the pore pressure at different heights within the soil specimen. As shown in Figure B.2 in
appendix, all sensors are mounted on the base of the cell. The pore pressure transducers
are connected to the specimen through internal ports specially fabricated on the latex
membrane.
Figure 5.1 shows the locations in the specimen where the pore pressure is measured.
Pore pressure measurements are made at the bottom of the soil specimen and 12.5 mm
above the specimen base (Figure 5.1). Two independent measurements are performed at
each of these two elevations to verify repeatability in the data. They provide the means to
measure the hydraulic head difference across the filtration zone. The data presented in the
following are obtained by averaging these two independent measurements. Additional
ports are located at 25 mm (1 in) and 75 mm (3 in) from the bottom. From these the head
difference in the portion of the soil that is considered to be free of fine particle migration
can be determined. The specimen height varies during the various stages of the test
because of the change in effective stresses and the fine particle migration through the
82
filter material. This change is monitored by an external LVDT mounted on the cell
piston.
Acquisition of the signals from the pressure transducers and the LVDT is achieved
through a 8 channel data acquisition system manufactured by Geotac of Houston, TX.
The system relies on a 22 bit A/D converter and is interfaced with a PC. A general
purpose data acquisition program provided by the manufacturer is used to record the
voltage signals from all the transducers. These are then converted to engineering units
based on calibration curves determined for each of the sensors.
The FWGR tests conducted in this research involved the application of a constant head
difference across the test specimen (soil + GT), while measuring the resulting flow rate,
and the pore pressures generated in time throughout the soil specimen. In the setup used
for this research a pressure panel equipped with precision regulators was employed to
apply constant values of the back pressure at the bottom and top of the soil specimen to
create downward flow through the specimen. The values of the pressure were selected to
yield an initial gradient of 5 (see Section 5.2.5 for details). The resulting flow rate was
measured through the burettes mounted on the pressure panel. As the water flowed
through the specimen, readings of the pore pressure were taken at the various pore
pressure transducers. Based on these readings the gradients existing across different
portions of the specimen were determined. From these values the gradient ratio (GR),
one of the key parameters used to interpret the test data, was calculated. Note that in this
research the GR is defined as GR = i0-12/i25-75, where i0-12 is the value of the hydraulic
83
gradient across the bottom 12.7 mm of the soil specimen, and i25-75 is the gradient in the
portion of the specimen between 25 and 75 mm elevation. Note that this definition of the
GR differs from those previously employed by other researchers (e.g. GRASTM = i0-25/i25-75
[ASTM D 5101] or GRMOD i0-8/i25-75 [modified by Fannin et al, 1994]). Note also that the
i0-12gradient is restricted to the bottom portion of the soil specimen and excludes the head
loss across the GT filter. Differences in hydraulic head between the lowest port and the
base container can be used to determine the head loss across the geotextile (GHL), which
is expected to be close to zero at the beginning of any test and may increase as a result of
internal clogging.
At the end of the test the base hollow container, in which all the fine particles that
penetrated the GT filter were captured, was inspected and the amount of passing soil was
weighed and compared with the soil mass retained inside the geotextile. At the same time
the GT specimens were oven-dried and their mass compared to the initial one to
determine the amount of soil clogged in the GT.
84
Figure 5.1 Port locations and soil column specs in FWGR test
85
5.3 Material Properties and Testing Conditions
5.3.1 Overview
FWGR tests were conducted employing three different soils and two different
geotextiles. The soil specimens were prepared with different silt contents (10%, 20% and
50% by weight) at two compaction states. Two geotextile specimens different in
thickness (3.2 mm and 1.1 mm) and opening size (0.15 and 0.21 mm) were selected for
testing the filter performance. The following sections cover in detail the preparation of
the soil specimens (5.3.2), the relationship between limiting void ratios (emax and emin)
and silt content (5.3.3), the properties of the geotextiles (opening size in 5.3.4 and
thickness in 5.3.5) and the selection criteria for the hydraulic conditions (5.3.6).
5.3.2 Soil Specimen Preparation
The basic material used for all the tests was concrete sand. Silt was added to the sand
at percentages by dry mass of 10, 20 and 50%. Figure 5.2(a) shows the grain size
distribution (GSD) curves of the resulting soil mixtures. Note that as a result of the
different percentage of silt used the curves display very distinct shapes: upward concave
(10%), gap graded (20%) and upward convex (50%). As shown by Kenney and Lau
(1985), the shape of the GSD determines the soil’s internal stability which controls the
fine particle migration during the filtration process. In Figure 5.2(a) the GSD curves are
plotted in terms of F and H where F and H are defined in Section 2.3.1. It is shown that
only the 50 silt GSD satisfies the criterion for soil internal stability (Kenney and Lau,
86
1985) of H >1.3 F up to F=0.2 (Figure 5.2(b)). Note that internal stability analysis charts
are based on densely compacted soil states. Therefore even a soil that met this criterion
could be internally unstable under loose conditions.
Soil specimens were prepared using the slurry deposition method (Siva and Bhatia,
1994) to guarantee uniform particle distribution. The water content of the slurry varied
between 13 and 15% to limit fine particle segregation. A mold with dimensions of 10.2
cm (inner diameter) × 18 cm (height) was specially designed to protect the extruding
ports of the membrane during specimen preparation.
Once poured into the mold the slurry was left to consolidate for a period that varied
between 12 and 24 hours, depending on the percentage of fines. During this stage dead
weights (from 0.5 kg to 4.5 kg) were placed on the slurry to reach the target void ratio.
The following loading increment schedule was applied to the 10% silt specimens: no load
- 2hr, 0.5 kg – 2hr, 1kg – 1hr, 2kg – 1hr, and 4.5kg – 30 min.. Identical loading schedules
were employed to the 20% silt and 50% silt specimens but with double and quadruple
durations, respectively. This type of schedule was selected to limit seepage forces
associated with excess pore pressure generation. If a denser soil specimen was desired,
after this phase the mold was tapped following a standard procedure (75 taps evenly
around the mold side), and an additional mass (15 kg) was placed on top of the specimen.
Table 5.1 summarizes the test conditions (silt percentage and degree of compaction)
examined in the investigation program. In this table and thereafter in this chapter, the
terms “loose” and “dense” are used to refer to compaction states achieved without and
87
Figure 5.2 (a)Grain size distribution (GSD) of soil specimens and (b) internal stability
evaluation (H’ = 1.3 F where F is cumulative fraction of GSD in percentage after Kenney and Lau, 1985)
88
Table 5.1 Void ratio and relative density values of test soil specimens
silt % d.o.c. 1) e 2) rel. density (%) e min 3) e max 4)
10 loose 0.42 62.5 0.33 0.57
10 dense 0.33 100.0 0.33 0.57
20 loose 0.35 82.8 0.30 0.59
20 dense 0.29 103.4 0.30 0.59
50 loose 0.36 86.1 0.39 0.73
50 dense 0.3 126.5 0.39 0.73
1) degree of compaction for soil specimen 2) void ratio of soil specimen 3) estimation from standard proctor test (ASTM D698) 4) estimation from funnel method (ASTM D4253) with tapping, respectively. . Table 5.1 also includes the values of the void ratio measured
at the end of the FWGR tests, as well as the values of the minimum and maximum void
ratio for the three sand-silt mixes considered obtained from the standard Proctor test, and
the funnel method, respectively (see more details in section 5.3.3).
Following the consolidation process, the porous stone and head cap were positioned on
top of the soil specimen, and the membrane sealed using O rings. A suction pressure of –
5 kPa was then applied to allow removal of the mold and assembly of the triaxial
chamber.
Back pressure saturation was conducted in 40 steps raising the back pressure up to a
maximum value of 400 kPa. All the increase steps were controlled with effective
confining stress less than 5 kPa. At the final pore pressure B values greater than 0.95
were measured in all the specimens.
89
Air bubbles can be trapped inside the tube connecting the membrane port to the external
pressure transducer during the specimen preparation stage. The air bubbles need to be
removed at the beginning of the back pressuring stage since the high compressibility of
the air interferes with the accurate assessment of pore pressure changes inside the soil
sample. The trapped air bubbles could be successfully removed during the initial back
pressure stage (when the cell pressure had been increased to 10 kPa) by temporarily
releasing the pore pressure built within the soil specimen through the external ports.
Following back pressure saturation the soil specimens were consolidated in hydrostatic
conditions to an effective confining stress of 10 kPa. This value was selected to reflect
the typical effective stress level at the depth of a sub surface drainage system (e.g. @
1.2m). The volume change associated with reaching this effective stress was generally
very small and was the greatest (0.14%) in the case of the 50% silt soil.
5.3.3 Silt Content and Compaction States
The funnel method and the tapping method were used to evaluate the limiting void
ratios of the soil specimens in the fully dried state (ASTM D 4253). Both the vibration
method and the standard proctor test (ASTM D 4254 and 698) were employed to assess
the minimum reference values in the wet state for 10%, 20%, 35% and 50% silt. Figure
5.3 summarizes the data obtained. It is shown that there is a significant difference
between the values of emin obtained for each silt content with the three methods: both the
tapping method and the vibration method yield values of emin that are consistently higher
than the value obtained from the proctor test. The difference appears to increase with silt
90
content (above 30-35% silt the figure reports data for only the proctor test). Comparison
with the void ratio data in Table 5.1 shows that the tapping procedure employed to
densify the specimens (in wet conditions) in the FWGR test as well as the seepage force
associated with permeation of the specimen during the test itself, yielded final values of
the void ratio equal or lower than the emin values from the proctor test. The difference is
especially significant for the 50% silt soil. It appears that for such a high fines percentage
the concept of limiting densities loses significance.
Despite this, the curves of void ratio versus silt percentage are consistent with those
reported in the literature for other silt sand mixtures (e.g. Thevanayagam et al, 2002 –
Figure 5.3 (b)). The maximum void ratio shows a small decrease with silt percentage up
to 10% silt, and then increases steadily. In the case of the minimum void ratio the
decrease is very significant up to a silt content between 20 and 35% (e.g. for 20% silt emin
is approximately 60% of the value measured on the pure sand). Again after reaching this
minimum, emin goes back to increase with further silt addition. These trends in emin and
emax have been extensively discussed in the literature (e.g., Lade et al, 1998 and
Thevanayagam, 2002). These researchers concluded that the content of fines is important
in determining the sand structure and the consequent limiting void ratios. Test results
also support the hypothesis that as the (relative) density of the soil increases, an
increasing number of fine particles participate in playing the role of the soil skeleton. In
other words, with increased degree of compaction, the fraction of the fine particles that
remains free to migrate across the soil pores decreases while the particle structure
resisting wash-out increases.
91
5.3.4 Geotextile Apparent Opening Size (AOS)
There are several filter design methods (or criteria) available in the literature for
selecting the opening size range (AOS) of a geotextile based on the soil GSD. Table 5.2
summarizes the results of applying these criteria to the soils investigated in this research.
It is shown that both GT used in this research (AOS = 0.15 and 0.21 mm) meet the first
two criteria for all three soils. Thus piping (severe soil erosion) is not expected to occur
in any of the three soil specimens (10%wt, 20%wt and 50%wt silt). The last criterion by
Lafleur (1999) recommends AOS values larger than 0.4-0.5 mm to reduce the potential of
blinding in the case of the 10% and 20% silt soils (this opening size is hardly found in
commercial products of needle punched GT). Therefore, poor hydraulic performance
(e.g. blinding or clogging) should be expected for the 10% and 20% silt soils with the
GTs used in this research. The choice of AOS in the 0.15 -0.21 mm range would instead
be expected to yield satisfactory result for the 50% silt soil.
Table 5.2 Opening size values recommended from GT retention criteria
GT filter criteria 10% silt 20% silt 50% silt
FWHA 1) (1985) < 2.2 mm <2.7 mm <0.25 mm
< 1.8 mm (loose) < 1.7 mm (loose) < 0.08 mm (loose) Luettich et al (1992)
<3.6 mm (dense) < 3.4 mm (dense) <0.17 mm (dense)
Lafleur (1999) 0.5 ~ 2.5 mm 0.4 ~ 2.0 mm 0.1 ~ 0.5 mm
1) authored by Christopher and Holtz
92
5.3.5 Geotextile Constrained Compressibility and Thickness
If geotextiles are stretched by tensile forces along a planar direction, the FOS (see
Chapter 2 for definition of FOS) is generally reduced by the opening elongation along the
direction of force (Fourie and Kuchena, 1995). Besides the FOS reduction due to lateral
load, another type of reduction in opening size can be expected from the vertical
compression of the thickness due to the overburden pressure. The compressibility of GT
is also of significant concern in that it will affect the area of contact between the fiber and
coarse soil particles. In light of the above, the constrained compressibility of the two GT
specimens employed for the FWGR test as well as of an additional GT with an
intermediate thickness was measured. This measurement was performed uni-axially
loading the GT specimens in a displacement controlled load frame using a strain rate of
0.85%/sec. A stainless steel ring was used to prevent lateral extension of the GT during
the loading. The axial load and displacement of the loading cap, designed to fit inside the
remaining ring, were continuously monitored.
Table 5.3 summarizes the specifications under atmospheric pressure of the three GT used
while Figure 5.4 presents the results of the uni-axial loading test. It is observed that at the
stress level employed in this testing program (10kPa) for the FWGR tests, the strain of
the GT ranges between 4% and 15%, for the thick GT (G1202) and thin GT (G402)
respectively. The results presented in Figure 5.4 also indicate a lower compressibility of
the thick GT compared to the thin one. Furthermore, there appears to be no relationship
93
Figure 5.3 (a) Compaction test results for different fine contents by various method types and (b) the comparable reference data (Thevanayagam et al, 2002)
94
Figure 5.4 Constrained Compressibility of GT with Different Thickness (higher product number indicates larger GT thickness)
95
Table 5.3 Specs of non woven geotextiles in the constraint compression test (GSE, 2003)
Brand/Product Mass/area
(g/m2)
Initial
thickness
(mm)
Specific
density1)
(kg/m3)
Permeability
(cm/sec)
A.O.S.2)
(mm)
GSE 402 135 1.1 123 0.17 0.21
GSE 1002 333 2.5 134 0.21 0.15
GSE 1202 405 3.2 127 0.25 0.15
1) Specific density = mass / area / initial thickness
2) A.O.S is apparent opening size (estimated by ASTM D4751)
3) Fiber bonding type is needle punched
between GT specific density (i.e. mass per area divided by thickness) and GT
compressibility.
5.3.6 Hydraulic Conditions
Field hydraulic conditions can not be exactly simulated in a laboratory environment, and
thus the concomitant simplifications must be accepted. While most column tests used to
examine GT clogging have adopted a constant head condition, the values of the system
hydraulic gradient employed vary over a wide range. For example for the GR test
(ASTM D5101) it is recommended that the gradient be between 0.5 and 10. In the HCR
test (ASTM D5567) the maximum system gradient is set at 5 for soil specimens with K
between 1.E-3 and 1.E-5 cm/sec. Giroud (1996) suggested that the appropriate hydraulic
gradient value for the underdrain near the surface is one.
96
The highest gradient value expected at a site can be applied as the system hydraulic
gradient in a test to simulate the worst case scenario. Whereas site hydraulic gradient
values are dependent on initial degree of soil saturation, the ambient hydraulic gradient
value of a road drainage layer can increase to 17.5 because of the flow convergence
pattern onto a sink point or a drainage pipe (Mlynarek et al, 1993). From the analysis of
the hydraulic head distribution around an underdrain pipe presented in Chapter 4, the
hydraulic gradient levels at the geotextile filter were expected to be 0.25 to 0.5 for
subgrade soils with K between 6E-4 cm/sec and 6E-3 cm/sec under fully saturated
conditions (Table 4.2). These hydraulic gradient values would be expected to increase
under more realistic site conditions, for example if partial leakage through the pavement
boundary was allowed. The presence of less pervious subgrade soil (e.g. silty soil with K
ranging from 1.E-6 cm/sec to 1.E-4 cm/sec) would also lead to higher gradients. These
considerations justify the selection of a system hydraulic gradient of 5 for all the tests
presented in this chapter.
5.4 Test Results
5.4.1 Normalized Parameters
The soils tested in this research exhibit a significant range in hydraulic conductivity
(6.8E-6 cm/sec to 1.1E-4 cm/sec - see Table 5.4). As a result of this range in K, it is
97
expected that under the same hydraulic gradient, the process of fine particle migration
will occur over different time scales depending on the fine contents in soil.
To effectively compare the data from experiments conducted on different soils
characterized by different initial compaction state and often markedly different in initial
hydraulic conductivity, the following normalized parameters are introduced: relative pore
volume (r.p.v.) and relative hydraulic conductivity (Krel).
The relative pore volume (r.p.v.) is defined as the flow volume divided by the initial soil
pore volume, i.e.
Vndtqvpr ⋅= ∫... Eq.5.1
where q is the system flow rate (cc/sec), n the initial soil porosity and V is the initial soil
volume (cc).
The relative hydraulic conductivity, Krel is defined as K/Kini where K is the absolute
system (i.e., soil + GT) hydraulic conductivity at any given time during the test and Kini is
the initial system hydraulic conductivity.
The results from any of the FWGR tests can then be presented either in terms of K
versus testing time or using the normalized parameters. An example of how the data
from a single experiment appear in these two representations is presented in Figures 5.5
(a) and 5.5 (b). Plotting the data in absolute terms has some advantages. For example,
Figure 5.5 (a) highlights the difference in the initial values of K and the marked decrease
98
in K over time of the 10% silt system. It is also shown that at the end of the test the
measured hydraulic conductivity falls within a very narrow range regardless of silt
content. The evaluation and comparison of the hydraulic performance of a GT filter used
in combination with different soils is, however more effectively performed using the
normalized scales of Figure 5.5 (b). This is the representation selected in section 5.4.2 to
present and discuss the experimental data.
5.4.2 Filter Hydraulic Performance during Soil Filtration
FWGR tests were performed on three soils (with 10%, 20% and 50% silt), at two
different compaction states (“loosely” deposited and “densely” compacted), using two
types of needle punched GT with different AOS and thickness (i.e. G402 [termed ‘thin”]
and G1202 [termed “thick”], see Table 5.3). Tests proceeded either until the system flow
reached a steady state (i.e. the measured flow rates remained constant with time), or when
the system K fell below 1.0E-6 cm/sec (below this value of k physicochemical clogging
by fine particles impedes accurate measurement of the system flow rate).
Figure 5.6 presents the data, in terms of Krel versus relative pore volume (r.p.v.), for all
the FWGR tests conducted, while Table 5.4 summarizes key results obtained from each
test. Specifically, for each test the table includes: the test duration; the total flow volume
permeated through the soil column; the average flow rate (i.e. flow volume divided by
test duration); the initial and final values of the hydraulic conductivity; the void ratio of
the soil measured at the end of the test; the relative hydraulic conductivities at r.p.v. =1
99
and at the end of test; the amount of soil trapped inside the geotextile; the amount of soil
that piped through the geotextile (given by the soil present in the base hollow container).
The last row of the table summarizes the “filtration result” for each of the tests. In this
research the distinction between bridging, blinding, clogging is based on the following
criteria (for descriptions of these phenomena see Chapter 2):
- bridging is said to occur when a relatively high system K is measured throughout the
test period (i.e., Krel ≥ 0.1 at r.p.v.=10);
- blinding is said to occur when the test results show a sharp reduction of the system K
early in the test (Krel < 0.1 or K < 1.E-6 cm/sec at r.p.v.=1);
- clogging is said to occur when the test results show a retarded blinding process (Krel ≥
0.1 at r.p.v.=1 but Krel < 0.1 at r.p.v.=10).
The discussion that follows relies on the data shown in Table 5.4 and Figure 5.6 to
present the observations drawn from the tests conducted. First, the test parameters shown
in Table 5.4 are discussed. Then, the filtration results (i.e. bridging, blinding, clogging)
are discussed and their occurrence related to the conditions of the test specimens.
As shown in Table 5.4, test periods ranged from 13 hours to 107 hours. For blinding
and clogging the test duration cited in Table 5.4 refers to the time required for this
process to occur. In the case of bridging the test period refers to the time required to
reach the steady value of the hydraulic conductivity (or of Krel) (see Figures 5.6(a) and
(b)). For the three cases in which bridging occurred (Table 5.4) the test duration varied in
100
a fairly narrow range, between 62 and 72 hours. The time associated with blinding
showed, instead, greater variability. While in six out of the eight tests it occurred under
24 hours, in the other tests, the test duration was extended to 47 and 92 hours,
respectively. As discussed in more detail in the following, clogging was found to occur
only in one test (loose 50% silt soil with thick GT), which, not surprisingly, given that
clogging is essentially a form of delayed blinding, presented the longest test duration of
107 hours.
The values of the total flow volume and, more importantly, of the average flow rate,
are useful indicators of the hydraulic performance of filter system. The greater these
values, the more effective the filter system. As indicated in Table 5.4 the measured
values of the total flow volume and of the average flow rate varied greatly from test to
test. The dense 10% silt with thick GT exhibited the best drainage performance (12580
cc in flow volume), while the dense 50%silt with thin GT exhibited the worst drainage
performance (136 cc in flow volume) (Table 5.4). Accordingly, the same two test
specimens showed the best and worst hydraulic performances respectively (i.e. 203 cc/hr
and 7.6 cc/hr in average flow rate).
Another significant observation that can be made from the data shown in Table 5.4 is
that the final Krel value correlates well with the value of Krel at r.p.v. =1 (c.f. a correlation
coefficient equal to 0.87 excluding the case of 10% silt with thin GT). This indicates that
under constant head conditions the degree of K reduction at the beginning of the test can
be used to predict the ultimate clogging state.
101
The data on the amount of soil clogged in the GT and collected below it can also
provide insight into the mechanisms responsible for the observed filtration outcomes. It
is worthwhile pointing out that in comparing these data, one must consider the amount of
flow that occurred during the test, i.e. it is necessary to consider the soil clogged (or soil
penetrated) per cc of water flowed through the specimen. For example, in the cases
where bridging is observed to happen it is expected that the amount of soil collected in
the GT as well as the amount flushed through it would be small. Comparison of the data
shown in the third to last and second to last rows of Table 5.4 does not necessarily reflect
this observation. However, the amount of soil normalized by the total flow volume is
found, in fact, to be the smallest in the case of bridging.
Concluding the remarks on the data reported in Table 5.4, it must be noted that the
initial hydraulic conductivity data present a discrepancy, which cannot at this time be
explained. Table 5.4 shows in fact that in four out of the six cases examined (and always
in presence of a thin GT) the Kinit for the dense specimen exceeds the value measured on
the loose specimen.
Moving on to discuss the occurrence of the different filtration outcomes in the tests
performed, Table 5.4 shows that successful filtration, i.e. bridging occurred in only three
out of the twelve cases considered: when the dense 10% silt and 20% silt soils were
filtered by the thick GT (G1202), and when the loose 20% silt soil was combined with
the thin GT (G402). Successful filtration, i.e. bridging is associated with both a good
hydraulic performance of the filter system as well as with success in retaining the fine
102
particles present in the soil (retention criterion). In fact, all three cases listed above were
characterized by large values of the final Krel (the three largest measured in all the tests)
and by average flow rates over 40 cc/hr (Table 5.4). Additionally, after normalization by
the total flow volume the amounts of soil clogged in the GT or penetrated through it GT
were the three lowest recorded.
Blinding was the most common filtration result observed in the tests conducted,
occurring irrespective of the fines content, the degree of compaction and the GT
thickness (Table 5.4). As shown in Figure 5.6, for low fine content (10% and 20% silt)
the curve of Krel versus r.p.v. is characterized by an upward convex shape, which
indicates that the rate of reduction of K steadily increases with time. This would arise if
blinding occurred as a result of blockage of the GT openings by the coarse particles. Any
further migration of the fines on the GT surface would, in fact, be expected to cause the
K to rapidly decrease.
This trend is not apparent in the case of high fines content (50% silt), suggesting that in
addition to coarse particle blockage some other mechanism may also be responsible for
the accumulation of particles on top of the GT surface .The analysis of the test results in
terms of gradient ratio (GR) and geotextile head loss (GHL) presented in Section 5.4.3
provides additional insight into the mechanisms responsible for the occurrence of
blinding.
103
Clogging was observed only in the case of the loose 50% silt specimen filtered by the
thick GT. Compared to all other tests conducted on the 50% silt soils, this test showed
distinctive features: a long test duration (107 hr), a large amount of clogged soil in the
GT (13.2 g), and a relatively high value of K rel at r.p.v.=1 (0.3) (Table 5.4). Additional
discussion of this test and hypotheses for the occurrence of clogging under these test
conditions are presented in Section 5.4.3.
The next section further expands on the discussion of the different clogging processes
and their relationship with the testing parameters considered. This is done employing the
concepts of gradient ratio (GR) and gradient head loss (GHL) which permit to distinguish
between what is happening in the base soil and what is happening in the immediate
proximity of the geotextile.
104
Figure 5.5 Conversion of real test outputs into normalized parameters (for the loosely
deposited soils filtered by a thick GT (GSE1202))
105
Table 5.4 Operational data and test results of Flexible Wall Gradient Ratio method
All the test specimens are under confining stress of 10 kPa 1) Test period under the constant head condition of i=5 2) Value corresponding to the last measurement made before terminating the test * in this test values of K below 1.E-6 cm/sec were measured in the final stages of the test, leading to terminate the test
105
106
Figure 5.6 System Hydraulic Conductivity Variations of the Different Silt Content
107
5.4.3 Gradient Ratio and Geotextile Head Loss
The filtration processes described in the previous section can be reexamined making
use of the concepts of gradient ratio (GR) and geotextile head loss (GHL), the definitions
of which are presented in Section 5.1. Figures 5.7 through 5.12 plot the data of GR and
GHL versus relative pore volume obtained from the same tests described in the previous
section.
The GR represents an indicator of the erodibility of the fines in the soil matrix: the
higher the GR, the more significant the migration of the fine particles. The GHL is,
instead, a measure of the clogging state of the GT openings: the greater the GHL, the
greater the amount of fines that have been transported from the soil into the GT.
Ideally, if the preparation of the soil specimen did not cause any particle segregation,
the GR and the GHL should have initial values of one and zero, respectively. As shown
in Figure 5.7 through 5.10, the initial value of GR was generally found to be close to one
for most specimens prepared with 10% and 20% silt. This was not the case for the 50%
silt soil (Figures 5.11 and 5.12): for this soil the initial GR was found to be greater than
one when a thick GT was employed, and smaller than one when a thin GT was used.
These results suggest that during the specimen preparation stage fine particles at the soil
base penetrated through the thin GT or accumulated on the surface of the thick GT (in
this case the smaller opening size would have limited penetration of the fines). In the
first case the initial GR would be expected to fall below one, while in the second case it
would be greater than one.
108
Figures 5.7 through 5.12 also show that for most of the systems examined the initial
values of the GHL were close to zero. The exception is represented by the tests
conducted on specimens with 10% silt (Figures 5.7 and 5.8). In these tests, while the
initial GHL was observed to be consistently greater than zero, it quickly decreased during
the early stage of the test to a value close to zero before increasing once again with
continued permeation. It can be hypothesized that the initial GHL values greater than
zero are caused by the formation of a thin layer of fines on the GT surface. As soon as
flow is initiated, the layer breaks apart leaving the openings of the GT unblocked. The
fact that this phenomenon is limited to the 10% silt specimens is most likely a result of
the weak internal stability of this soil which promotes particle segregation near the GT.
As shown in Figure 5.7 through 5.12, for all tests conducted on the dense specimens the
GR was found to remain basically constant during most part of the test, indicating that
migration of the fines was suppressed. Fine particle migration appears instead to have
occurred in the loosely deposited specimens, in particular those with 20% and 50% silt.
For both these soil types, in particular when used in combination with the thick GT, a
significant increase in GR, evidence of fine particle migration, is observed over the
duration of the test.
The following paragraphs discuss the filter clogging behavior observed in each of the
soil-GT specimens tested based on the GR and GHL profiles.
109
Figure 5.7 compares the GR and GHL profiles for the 10% silt, used in combination
with the thick GT, both in the loose and dense states. The data indicate that the improved
internal stability of the soil following densification leads to a significant improvement in
the GT filter performance. For the loose specimen (Figure 5.7 (a)) a significant increase
in GHL is observed throughout the test as a result of the accumulation of fines on the GT
surface (the small opening size of the thick GT is expected to limit the penetration of
fines). As a result, as summarized in Table 5.4, blinding occurs. For the dense specimen,
instead, the GHL is observed to remain constant during the test (Figure 5.7 (b)). This is
indeed one of the successful occurrences of bridging observed in the tests conducted
(Table 5.4). What seems to be the controlling factor here is the increased stability of the
soil fines as a result of densification.
Figure 5.8 reports a similar comparison to that shown in Figure 5.7, this time pertaining
to the 10% silt specimens filtered by the thin GT. As summarized in Table 5.4, both the
loose and dense specimens showed blinding results. The differences in the GR and GHL
profiles presented in Figures 5.8(a) and 5.8(b) suggest, however, that blinding resulted
from different causes.
In the case of the dense 10% silt specimen, no change in GR is observed until the very
end of the test. This is evidence that densification produced a more stable soil structure,
limiting the migration of fines. The GHL is instead found to increase. It is hypothesized
that the increase in GHL is a result of blockage by the coarse particles (which due to the
low fines content play a dominating role in this soil) of the GT openings (this effect is
110
enhanced by the densification operation and is likely to be more significant in the case of
the more deformable thin GT, which will tend to conform around the particles). Given the
small amount of migrating fines, the growth of the GHL is observed to be slow. Note
that ultimately, at the end of the test, the increase in GHL drives an increase also of the
GR, i.e. as no penetration of fines is allowed through the GT, the fines start to “backup”
in the base soil
In the case of the loose 10% silt soil specimen, there is a sharp increase in GR around 1
r.p.v., without any significant change in GHL (Figure 5.8 (a)). While the increase in GR
is the reflection of the migration of fines through the base soil, it remains unclear why
this does not translate also in an increase in the GHL. Differences in the filter
performance depending on the soil density and the GT employed are observed also in the
case of the 20% silt specimens.
As seen in the case of the 10% silt soil, the filter performs effectively (i.e. bridging
occurs) when the 20% silt is compacted to a dense state and associated with the thick GT.
As shown in Figure 5.9 (b), under these conditions both the GR and GHL remain fairly
stable throughout the test. Also consistent with the observations reported for the 10% silt
soil specimen (Figure 5.8(b)) are the GR and GHL trends for the dense 20% silt soil
filtered by the thin GT (Figure 5.10(b)): while the GR remains constant and essentially
equal to one throughout the test, the GHL shows a clear growth. This is again thought to
result from the fact that the large coarse particles block the access to the GT openings.
111
While, as discussed above, the thick GT proved to perform effectively under the dense
20% silt soil (leading to bridging), the same is not true if the soil is in a looser state. This
is shown by the results presented in Figure 5.9(a). In this case, as already seen for 10%
silt, a sharp increase in the GHL is observed from very early in the test (r.p.v. ~ 0.1). As
discussed above for Figure 5.7(a), this increase in GHL is attributed to the small opening
size of the GT, and blinding can be considered driven by limited available openings.
Note that, as already described above for another test, ultimately the increase in GHL
drives an increase in the GR and results in blinding.
As shown in Figure 5.10(a), the loose 20% silt exhibited instead a very different
behavior when combined with a thin GT as no change in GR or GHL was measured until
the very end of the test (and even then quite small). This is the last of three cases of
bridging observed in this testing program.
Finally Figures 5.12 and 5.13 compare the results for the 50% silt specimens. The
presence of such a high percentage of fines has a significant impact on the filter
performance and leads to some differences with respect to the observations made for the
10% and 20% silt soils. As summarized in Table 5.4 with this soil neither of the GT
performed effectively, independently of the compaction state (three cases of blinding and
one of clogging). Note that bridging formation was not expected from the 50% silt soil
since the tested GT products have larger openings (i.e. AOS > 0.15 mm) compared to the
fine size (0.075 mm). Under these conditions, internal GT clogging is considered to be
112
the best filtration performance that can be expected, as the clogging process takes place
throughout the base soil rather than being limited to the surface openings.
For 10% and 20% silt it was shown that bridging occurred when the soil was placed
dense on top of the thick GT, i.e. the hydraulic performance of this GT was improved
through densification of the soil above it. As shown in Figure 5.11(b) this is not the case
for 50% silt (for high silt contents there is little difference in internal stability between
loose and dense state). In this test, the GHL (which, as discussed above shows an initial
value greater than zero due to accumulation of fines on the GT during the specimen setup
phase) shows a very rapid growth which leads to blinding. This is likely a result of the
greater percentage of fines available in the soil specimen.
Blinding was also observed in the other test conducted on the dense 50% silt specimen
but with the thin GT (Figure 5.12(b)). While in this case the initial GHL value is equal to
zero, there is a early (at 0.1 r.p.v.) and rapid increase in GHL, which also in this case
leads to blinding. This result is consistent with the data obtained under similar conditions
for 10% (Figure 5.8(b)) and 20% silt (Figure 5.10(b)). In both these cases it was
hypothesized that the coarse particles blocked the surface openings leading to fine
particle accumulation on the thin GT. Given the similarities in the GR and GHL trends,
the same is expected to be true here, with the greater availability of fines being
responsible for the more rapid GHL growth.
113
The third case of blinding for 50% silt is shown in Figure 5.12(a) which pertains to the
soil tested loose with the thin GT. In this case the increase in GHL is delayed to r.p.v. of
approximately one, but the subsequent growth is very rapid. Also significant is the fact
that, unlike what was observed in all other cases of blinding, the GR starts to increase at
the same time and also very rapidly. This suggests that a mechanism different from the
one so far discussed (blockage of the GT openings by the coarse particles) is responsible
for the blinding. Additional discussion on this test is presented in Section 5.5.1.
Finally the single example of clogging occurs in the case of the 50% silt soil tested
under loose condition with the thick GT (Figure 5.11(b)). In this case the increase in
GHL is delayed compared to what was observed above for the same soil with the thin
GT. It is suggested that it is the smaller AOS of the thick GT (0.15 mm compared to 0.21
mm for the thin GT) which reduces the migration of fines.
114
Figure 5.7 Gradient ratio and GT head loss responses for 10% silt with thick geotextile
(GSE1202)
115
Figure 5.8 Gradient ratio and GT head loss responses for 10% silt with thin geotextile
(GSE 402)
116
Figure 5.9 Gradient ratio and GT head loss responses for 20% silt with thick geotextile (GSE 1202)
117
Figure 5.10 Gradient ratio and GT head loss responses for 20%silt with thin geotextile (GSE 402)
118
Figure 5.11 Gradient ratio and GT head loss responses for 50%silt with thick geotextile
(GSE 1202)
119
Figure 5.12 Gradient ratio and GT head loss responses for 50%silt with thin geotextile
(GSE 402)
120
5.5 Discussion
5.5.1 Analysis of GR and GHL Profiles
The objective of this section is to relate the GR and GHL profiles shown in Figures 5.7
through 5.12, to the filtration results presented in Table 5.4.
Successful filtration results (i.e. bridging) were observed for the dense 10% and 20% silt
soils with the thick GT and for the loose 20% silt soil with the thin GT (see Table 5.4).
For these tests (Figures 5.7 (b), 5.9 (b) and 5.10 (a)) the GR values remained clearly
below 5, corresponding to values less than 3 using the GR definition contained in ASTM
D 5101, and thus satisfying the clogging criterion specified in the standard. For these
same tests the GHL showed only a marginal increase in the GHL, slightly more
significant in the case of the dense 10% and 20% silt soils (Figure 5.7 (b) and 5.9 (b)).
The curves shown in Figure 5.13 (a) summarize the GR and GHL trends associated with
the occurrence of bridging.
Two different patterns in the GHL and GR variation were observed to ultimately lead to
the occurrence of blinding.
In most of the cases (dense 10% and 20% silt soils with thin GT, loose 10% and 20% silt
soils with thick GT., dense 50% silts with thin and thick GT) a sharp initial growth of the
GHL was observed ahead of a relatively retarded GR growth (Figure 5.13(b)). As
discussed earlier, it is hypothesized that in these cases the coarse particles are blocking
121
the GT openings, while the remaining gap openings are being filled up by the loose fines
migrated from the base soil. Ultimately the fines “backup” in the base soil and drive an
increase in the GR.
For the case of the loose 50% silt soil combined with the thin GT (Figure 5.12(a)) the
GR and GHL trends resemble those shown in Figure 5.13(c). The distinctive feature in
this case is the sharp increase of both GR and GHL before the r.p.v reaches a value of
one. The speculation is that in this case blinding is a result of the mass migration of fine
particles through the base soil which end up “crowding” on top of the GT surface. Given
the high percentage of fines present and the loose state of the soil, this process is initiated
as soon as the test starts.
Internal clogging was observed for the loose 50% silt with the thick GT (see Table 5.4
and Figure 5.11(a)). In this test the growth of the GHL and GR was not only delayed
(GHL and GR build-up did not initiate until the flow volume reached r.p.v.=1) but also
showed slower growth compared to the blinding processes. Figure 5.13 (d) show the
trends in GR and GHL associated with the occurrence of clogging.
The test conducted on the loose 10% silt soil with the thin GT does not fall in any of
the categories shown in Figure 5.13, and the mechanism responsible for the increase in
GR and the stationary value of GHL shown in Figure 5.8(a) remains unclear.
122
Figure 5.13 Summary of GR and GHL variations for each different clogging mechanism
the filtration results are classified in Table 5.4)
5.6 Summary
Nonwoven geotextiles (GT) have been installed in underdrain systems at many
construction sites as the filter material. During densification of the drainage layer,
compaction energy applied to the drainage material (e.g. aggregate) can be delivered to
123
the GT filter. Where geotextiles are employed as a separation layer under railroad ballast
or a pavement base, the bad hydraulic performance of geotextiles causes subgrade
deformations because the moisture desiccation of the subgrade soil occurs mainly
through the upper pervious aggregate. More severe subgrade deformation is expected in
high fine content soils, the hydraulic conductivity of which is relatively small. Therefore,
hydraulic performance of the separation layer is important with regards to long term
maintenance.
GT have been used as filtration and separation materials for several decades, but there
has been no specific research to investigate the impact of compaction work on the
hydraulic performance of the GT. Compaction usually improves the internal stability of
soil, but can also generate some initial soil accumulation inside the GT openings, which
promotes clogging of the GT. This adverse effect can be alleviated through proper
selection of the GT properties (opening size and thickness) for the specific soil type.
The Flexible Wall Gradient Ratio (FWGR) test (Harney and Holtz, 2001) was
employed to investigate the migration features of fines at the interface of soil and
geotextile, associated with soil compaction and geotextile properties (AOS and
thickness). Soil specimens (10%, 20%, and 50% silt) were used to represent the different
levels of internal stability (i.e. piping resistance) expected from site soils.
In the FWGR test, the profiles of gradient ratio (GR) and geotextile head loss (GHL)
can be used to establish the effectiveness of the soil-GT systems employed as well as to
124
explain the different clogging mechanisms, and in particular distinguish between surface
opening blockage by coarse particles and internal GT clogging by fine particles.
The main conclusions drawn from the tests performed can be summarized as follows:
- The internally unstable soil (10% silt), vulnerable to opening blockage by coarse
particles, was filtered successfully by using a thick GT (AOS=0.15 mm) after the soil was
properly compacted.
- The gap graded soil (20% silt) was successfully filtered by using a thin GT with large
opening size (AOS=0.21 mm) in non-compacted state, and by using a thick GT,
characterized by a stiffer surface, in the compacted state.
- The high fine content soils (50% silt), vulnerable to internal clogging, was
successfully filtered using a thick GT provided that it was in a loosely deposited state.
- There are potential issues in the use of a thin, compressible GT such as the one
employed in this study as a filter or separator material at construction sites where
compaction is employed to improve the internal stability of subgrades.
- The process of internal GT clogging by fine particles is associated with a much longer
filtration process compared to opening blockage by coarse particles.
125
6. Laboratory Investigation of Geotextile Filtration by Rapid Retention Test – Effect of Geotextile Property
6.1 Introduction
The objective of this chapter is to present the results of rapid retention test (RRT)
performed to investigate the effects of geotextile properties (opening size, fiber bonding
type and thickness) on filtration of the soils with different silt and clay contents. Non-
cohesive and cohesive soils are separately prepared for soil specimens. Geotextile
specimens are selected by fiber boding type and thickness which are related to the filter
performance. In this part of the study, the rapid retention test (RRT) was employed as an
efficient method to promptly estimate the compatibility of geotextile with a given soil.
The forthcoming sections describe the principle of RRT (Section 6.2), preparation of soil
specimens (Section 6.3), geotextile properties (Section 6.4), and the filtration experiment
results (Section 6.5). In Section 6.5, analysis of the test results is organized according to
the following observations: compatibility of the different types of geotextiles with non-
cohesive soils (6.5.1), effectiveness of geotextiles over a range of applied hydraulic
gradients (6.5.2), sensitivity of the tested geotextiles to soil compaction (6.5.3), influence
of geotextile thickness on the filtration of soils with high content in fine particles (6.5.4),
and the performance of double layer filters with cohesive soils (6.5.5).
126
6.2 Description of RRT
Common fitration testing methods such as the Gradient Ratio (GR) test (ASTM
D5101) and Hydraulic Conductivity Ratio (HCR) test (ASTM D 5567) require the soil
specimen height to be greater than its diameter in order to prevent preferential flow paths.
This typically results in tests of long duration (e.g. 100-1000 hours) because, with such
volume of soil specimen, observed variables (i.e. gradient ratio in GR test and hydraulic
conductivity ratio in HCR test) are slow to reach stable values. In order to accelerate the
tests, the flow rate needs to be increased by raising the hydraulic gradient through the
soil/geotextile system or by using a shorter specimen. Observations during FWGR tests
suggest most of the particle migration and clogging mechanisms involve only a thin
interface zone of thickness lesser than 1cm, especially when non-woven geotextile (GT)
filters are used. This means filtration tests could be performed much faster by using short
soil specimens if these can be prepared with high degree of homogeneity so that
preferential flow paths do not occur.
The Rapid Retention Test (RRT) was proposed by Siva and Bhatia (1994) as a time-
effective method of testing GT filter compatibility with soil. It relies on the application of
high hydraulic gradients through short specimens of soil. The test consists in placing the
soil specimen, 10mm in thickness and 100 mm in diameter on top of a geotextile disk in a
rigid wall or a flexible wall permeameter. After specimen saturation and consolidation
had been achieved in the cell, downward flow is induced under a fairly high gradient
(e.g., i=10 to i=40) with the direction of seepage going from the soil to the geotextile, and
the overall hydraulic conductivity of the composite system (soil and geotextile) is
127
determined. The test is kept running in order to monitor changes in hydraulic
conductivity due to soil particle migration. Significant decrease of soil/geotextile system
permeability during the test is indication that filter clogging has occurred. A schematic of
the rigid wall permeameter used in the present study for performing RRT is shown in
Figure 6.1.
The earlier utilizations of the RRT by Siva and Bhatia (1994) was with soil slurries, in
connection with hydraulic fill problems, cracks in earth dam clay cores, and edge drain
systems that are in poor contact with surrounding soils. In order to meet slurry condition
for the tested specimens, these earlier investigators had to maintain the soil particles
continuously suspended in a turbulent flow. However, in the present study laminar flow
is considered better representative of hydraulic conditions prevailing in highway
subdrainage systems. Thus we need at first to examine flow rate applied in the present
testing program in order to verify the high gradients are compatible with laminar flow
and Darcy’s law is still applicable. Using the equation from Rose (1945), Reynold’s
number expressed in Equation 6.1 must be smaller than 1 in order for the flow to remain
laminar.
5vRe 1Dn ν⋅
= <⋅
Eq.6.1
v : discharge velocity D5 : diameter of 5% particle size n : porosity ν : fluid kinematic viscosity
Application of the above criterion to the present study RRT and material conditions
(v=1.E-5 m/sec for silty sand, D5 = 1.E-5 to 1.E-4 m for silty sand, n = 0.2 to 0.5, ν =
128
1.12E-6 m2/sec) indicates the gradient of 40 used in the present study is acceptable. This
value of i=40 was used in all the RRT presented in this chapter, except those discussed in
Section 6.5.2 where results obtained using i=40 and i=10 are compared.
Another preliminary consideration is on the selection of soil specimen thickness and how
it affects contrasts between systems with different soil initial properties. In the FWGR
tests presented in Chapter 5, the system hydraulic conductivity (Ksys) is mainly governed
by the soil specimen hydraulic conductivity because the soil thickness is over 100 times
greater than that of the GT and the soil is less permeable than the GT. For instance, in the
FWGR test results shown in Figure 5.5 (a), the initial system Ksys with 10%wt silt is 10
times greater than with 50%wt silt. With the most permeable specimen, decrease in
system conductivity is clearly observed during the test, but with the less permeable soil
the trend is not so clear in comparison (unless parameters are normalized, Figure 5.5 (b))
because when the initial K is already small and the clogging process is slow, Ksys
decreases slowly too. In contrast, when the soil specimen thickness is reduced to 1cm for
the series of RRT performed herein, the influence of GT clogging on the variation of Ksys
is emphasized. In Figure 6.2, such an example is shown. Here, the Ksys profiles are
clearly differentiated for the soils with different silt contents (i.e. 20%wt silt, 50%wt silt
and 100%wt silt). With the RRT, quick comparison can be made even without parameter
normalization.
129
6.3 Soil Specimen Preparation
Soils used to performed the Rapid Retention Tests (RRT) in this part of the study
include dune sand, silt (at different content mixed with sand), sandy silt, and clayey silt.
The main particle size fractions are summarized in Table 6.1 and the particle size
distributions of the silt specimens are shown in Figure 6.3. For these silt specimens, silt
contents of 20%wt, 50%wt and 100%wt were chosen to generate gap graded soil, well
graded soil and pure fine soil, respectively. The test specimens were reconstituted using
the same silt and fine sand than those previously used for the FWGR test series described
in Chapter 5. The largest of the silt particles (D90=0.08 mm) were smaller than the AOS
of the GT specimens (Of = 0.15~0.21 mm) whereas the fine sand particles (0.25 to 0.43
mm in diameter) mixed with would be retained above the GT during filtration. The
retained sand particles were also expected to block the GT openings to a degree varying
with GT surface conditions (i.e. hard or flexible, depending on the GT type).
Experience shows that laboratory soil preparation in wet condition produces better
regularity in sample quality and better reproducibility in test results than other
preparation methods (Bhatia et al, 1990, Siva and Bhatia, 1994). For loose condition, the
specimens were prepared in slurry state with 50% water content. For dense condition, the
20%wt, 50%wt and 100%wt silts specimens were trampled 25 times using a wood pestle
at successively 10%, 15% and 30% water contents. Clayey soil specimens were prepared
in the same way with addition of commercially available kaolinite in proportions as
indicated in Table 6.1
130
For mounting of the specimens, an acrylic ring (10 cm in diameter; 2.5 cm in height)
was pre-installed on of the GT specimen supported by the metal screen above the fine
collector (Figure 6.1). After the soil specimen was successfully seated, the head cap was
placed on the acrylic ring and all the cell components were sealed together within a latex
membrane and installed in a confining chamber. After all the effluent valves were closed,
the test cell was subjected to a back pressure of 140 kPa through the influent ports.
Pressure increment of 35 kPa were applied at intervals of 30 minutes in order to minimize
soil particle migration during back-pressuring. A confining pressure corresponding to 70
kPa in effective stress was found to be adequate for preventing leakage along the vertical
boundary between the acrylic ring and the specimens.
Table 6.1 Compositions of soil specimens used in RRT
Soil type Sand
(0.25-0.43 mm)
Silt
(manufacture)
Clay
(kaolinite) Specimen state
Dune sand 100%
(from dune) Loose
20% silt 80% 20% Loose/Dense
50% silt 50% 50% Loose/Dense
100% silt 100% Loose/Dense
Sandy silt (10% clay) 40% 50% 10% Dense
Sandy silt (20% clay) 30% 50% 20% Dense
Clayey silt (10% clay) 90% 10% Dense
Clayey silt (20% clay) 80% 20% Dense
131
Figure 6.1 Schematic of RRT cell components
132
6.4 Geotextiles Selected for Testing
Eight different geotextiles, all belonging to the non-woven category, were selected for
performing the Rapid Retention Tests (RRT). This selection spans a wide range of
properties such as thickness, density, AOS, hydraulic conductivity and fiber bonding type
that are relevant to filtration behavior. These characteristics are summarized in Table 6.2.
Three different manufacturing processes and resulting fiber bond types are represented in
this selection of GT specimens: the heat bonded non-woven, needle punched non-woven
and heat set non-woven types.
Heat bonding geotextile (HB) produces a firm GT surface, not easily deformed or
indented by coarse soil particle. The typical porosity range of HB is relatively low,
between 0.5 and 0.6, because as part of the manufacturing process the fabric is pre-
compressed normally to its plane during by thermal calendering. Thus the hydraulic
conductivity of HB is about 10 times smaller than that of other non-woven GT due to the
reduced porosity (Table 6.1). In addition, the thermal treatment reduces surface
wettability as illustrated in Figure 6.4. In consequence the minimum hydraulic head
necessary for initiating flow through HB is about 10 times larger than for needle punched
geotextiles.
Needle punched geotextiles (NP) are obtained by mechanically interweaving their
fibers using high frequency alternated needle movement normal to the fabric plane. The
resulting GT surface can be deformed or indented easily by coarse particles.
133
Heat set non-woven geotextiles (HS) have attributes of both HB and NP. The fabric is
initially needle punched and then thermal treatment is applied to only one side of the GT.
This thermal treatment improves the fabric tensile strength without reducing significantly
the hydraulic conductivity.
The thickness of the GT specimens ranges from 0.2 mm (BBA3201) to 4.2 mm (C-
M160). The NP and HS were further separated by thickness (tG) ranges that are, thin GT
(tG < 1mm), medium thickness GT (1< tG <3 mm) and thick GT (tG >3 mm). Note that
both HB specimens in Table 6.2 are thin. In general, the thickness and AOS are inversely
proportional (e.g. AOS=0.21 mm for tG = 1 mm, AOS=0.15mm for tG = 4 mm) for HS
and NP specimens. Thick GT have smaller AOS than thin GT because they have a higher
fiber density per fabric area.
134
Table 6.2 Specifications of geotextile specimens used in RRT
Property
Product
unit
weight
(g/m2)
thickness
(mm)
density1)
(kg/m3)
AOS2)
(mm)
KGT
(cm/sec)
fiber
bonding
type3)
B3201 71 0.2 355 0.59 0.02 HB
B3501 180 0.5 400 0.2 0.02 HB
C-M60 203 1.8 113 0.21 0.24 HS
G1202 405 3.2 127 0.15 0.29 NP
L125 130 1.3 100 0.21 0.2 NP
L140 157 1.5 105 0.21 0.2 NP
L250 364 2.5 146 0.15 0.25 NP
L350 543 3.8 143 0.15 0.25 NP
1) Specific density = mass / area / thickness 2) Apparent opening size 3) HB : heat bonded; HS : heat set ; NP : needle punched
135
Figure 6.2 Example of system hydraulic conductivity variations during RRT for loose soils with different silt contents under gradient, i=40
136
Figure 6.3 Grain size distributions of soil specimens
137
Figure 6.4 Illustration of difference in wettability between needle punched (A) and heat bonded (B) geotextiles. A water column of 1 cm stands above the heat bonded GT while
none remains above the needle punched specimen.
138
6.5 Testing Results
The program performed using the RRT method is summarized in Table 6.3 where
tested combinations of soils and geotextile types are indicated. For each test, Table 6.3
refers to the text section in which it is discussed. All the tests were conducted under a
hydraulic gradient of 40 except for the tests discussed in Section 6.5.2 where gradients of
10 and 40 were used for comparison. Observed trends in these results are presented
herein.
6.5.1 Compatibility of Tested Geotextiles and Soils
It has been shown (Watson and John, 1999) that the uniformly sized beads used as
filter test material have the ability to bridging or arching above a hole of diameter up to
4.21 times their size. If this also true for real soils, uniformly graded soils (Cu<3) can be
successfully filtered by GT with AOS greater than their maximum grain size. This was
verified with RRT on uniformly graded Indiana dune sand (Cu=1.3, D90=0.3mm) used in
the present study in association with GT of different fiber bonding types (BBA3201,
3501, C-M60 and Linq125). Of these geotextiles, one (BBA3201) has a AOS of 0.59mm
which is approximately twice larger than the sand D90 while the other three GT have
AOS smaller than D90. No piping of sand grains through the GT specimens was observed
and, as shown in Figure 6.5, good filter performance (i.e. only a small reduction in
system hydraulic conductivity) was obtained with the HB having the largest AOS
(0.59mm) as well as with two other GT having AOS smaller than the grain size. Among
the GT tested, the largest reduction in hydraulic conductivity is observed for an AOS
139
smaller than the grain size. We see here that a uniformly graded soil can be successfully
filtered by a GT with AOS twice the size of its coarse particles.
The other types of soil (gap graded, well graded and pure fines) were also tested in
association with the GT of different fiber bonding types (B3501 as a HB; L125 and
G1202 as NP; and C-M60 as HS). The results are presented in Figures 6.6(a,b,c). As seen
in Figure 6.6(a), gap graded soils (20%wt silt) exhibited the best filtration performance
with HB (B3501) or HS (C-M60) and the worst performance with thick NP (G1202). But
the thin NP (L125) was also inadequate with this type of soil. The pure fine soil (100%wt
silt) was best filtered by a thin NP (L125) though an abrupt loss of permeability is
observed at the end of the curve following a long period of sustained values, as is shown
in Figure 6.6(c). With this soil, the worst performance is observed when it is associated
with HS (C-M60) while HB (B3501) and thick NP (G1202) show practically the same
loss of more than 60% in system permeability. For the well graded soil in Figure 6.6(b),
(50%wt silt), the best performance was obtained using HS (C-M60) relatively poor
results were obtained using HB and NP.
Different compressive stiffness between HB and NP is perhaps a reason for their
different filtration performances with gap-graded soil (20%wt silt) and pure fines
(100%wt silt). The mechanism is illustrated with the schematic plots in Figure 6.7 where
HB is characterized by the firm GT surface that is not easily deformed by coarse particle
indentation, while having a relatively small porosity (i.e. n = 50 to 60%). In contrast thin
NP is easily indented by coarse particle contacts, while having a relatively large porosity
140
(i.e. n ≥ 80%). A filter for gap-graded soil should allow passing of fines after coarse
particles have partially blocked openings. A rigid surface HB is able to satisfy this need
because it can resist closing of its channels under coarse particle compressive contact
pressure. A thin NP would be considered acceptable for filtering pure fines (100%wt silt)
since its many openings can prevent fines to accumulate when the flow initiates. The
small filter opening size (i.e. AOS= 0.15 mm) of thick NP (G1202) is believed
responsible for the poor filter performance with loose 20%wt silt soil. With this type of
GT, similarly rapid clogging induced by coarse particle blockage was also observed with
gap graded soil (20%wt silt) during FWGR testing.
6.5.2 Effect of Hydraulic Gradient Magnitude on RRT Outcomes
In filtration tests of soils with high silt contents (50%wt to 100%wt silt), if clogging
occurs it typically takes a longer time to develop than with smaller silt fraction soils (e.g.
20%wt silt). During a FWGR test reported in Chapter 5 clogging of the GT by soil with
50%wt silt took over a week whereas the same GT clogging by soil with 10%wt silt,
under the same gradient i=5, was took only a day. In RRT the process is accelerated by
using a gradient as high as 40, still compatible with laminar condition and the application
of Darcy’s law as discussed in Section 6.2. However, the impact of gradients of such
magnitude on the RRT geotextile overall response is unclear. In order to assess this
effect, a limited number of RRT were performed under a gradient of i=10 and changes in
system hydraulic conductivity Ksys were compared to those observed under i=40. It is
noted that a gradient of 10 is still at least twice greater than field gradients predicted by
141
numerical models of seepage toward roadway edge drains (see Chapter 4). For the tests
performed under each gradient level, dense soil specimens prepared with 50%wt silt and
100%wt silt were combined with NP geotextiles of three different in thicknesses,
Linq125 (1.5mm), Linq250 (2.5mm) and Linq350 (3.8mm). Results are presented in
Figures 6.8(a,b,c) for the soil with 50%wt silt and Figures 6.9(a,b,c) for the soil with
100%wt silt.
A first observation is that the general shapes of the curves in Figures 6.8(a,b,c) obtained
with 50%wt silt are different from those in Figures 6.9(a,b,c) obtained with 100%wt silt
though, in each of these two groups, there is no very clear difference between the filter
performances of thin GT (a) , medium thick GT (b) and thick GT (c). Furthermore, for
both families of results, the flow volume required for clogging of the filter (i.e. at the end
of the curve) is always larger under the smaller gradient i=10 than under the large
gradient i=40. For instance the relative hydraulic conductivity is consistently reduced by
90% after a flow volume of approximately 1000cc under i=10 and 100cc under i=40.
142
Table 6.3 Summary table for test program used in RRT
GT type
Soil type B3201 B3501 C-M60 G1202 L125 L140 L250 L350
Dune sand 6.5.1* 6.5.1* 6.5.1* 6.5.1*
20% silt 6.5.1* 6.5.1*
(6.5.3) 6.5.1*
6.5.1*
(6.5.3)
50% silt 6.5.1* 6.5.1*
(6.5.3) 6.5.1*
6.5.1*
{6.5.2}
(6.5.3)
{6.5.4}
{6.5.4} {6.5.2}
{6.5.4}
{6.5.2}
{6.5.4}
100% silt 6.5.1* 6.5.1*
(6.5.3) 6.5.1*
6.5.1*
{6.5.2}
(6.5.3)
{6.5.4}
{6.5.4} {6.5.2}
{6.5.4}
{6.5.2}
{6.5.4}
Sandy silt
(10% clay) {6.5.5}
Sandy silt
(20% clay) {6.5.5}
Clayey silt
(10% clay) {6.5.5}
Clayey silt
(20% clay) {6.5.5}
- Figures in table present the section numbers with relation to the soil and GT specimens - ∗: loose soil specimen only; { }: dense soil specimen only; ( ): loose/dense specimens - All the tests were implemented under the system hydraulic gradient of 40. - Supplementary hydraulic gradient of 10 was employed at Section 6.5.2
143
Figure 6.5 RRT results obtained in filtration (i=40) of uniformly graded dune sand in
loose state with GT of different types
144
Figure 6.6 RRT (i=40) results for various GT types with loose soils of different silt
contents (20%wt gap graded, 50%wt well graded and 100%wt silt pure fine)
145
Figure 6.7 Schematic plots of different surface properties between heat bonded (HB) and
needle punched GT (NP).
146
Figure 6.8 RRT results for NP of thicknesses, 1.5mm, 2.5mm and 3.8mm with dense
50%wt silt soil filtered under hydraulic gradients of 10 and 40
147
Figure 6.9 RRT results for NP of thicknesses, 1.5mm, 2.5mm and 3.8mm with dense 100%wt silt soil filtered under hydraulic gradients of 10 and 40
148
The significant difference between the two families of results is in the rate at which
clogging progresses as evidenced by the shapes and slopes of the curves. In Figures
6.8(a,b,c) obtained using 50%wt silt, the decrease in Krel is, after some fluctuations at the
start of the curves, almost linear in function of the log of volume flow. In contrast, with
100%wt silt the slope of the curves is very steep at the start and it takes only a small flow
volume (i.e. less than 1 or 2cc) for Krel to decrease by about 50%, then the process
continues much slower. This particular behavior might be related to large amount of fines
accumulating rapidly close to the filter openings.
6.5.3 Influence of Soil Compaction on RRT Outcomes
RRT were performed on dense vs. loose specimens of soils with 20%wt (gap-graded),
50%wt (well graded) and 100%wt (pure fine) combined to two types of GT of different
fiber bonding styles but having similar AOS and thicknesses. These GT were the C-M60
(HS with AOS=0.21mm, TG= 1.8mm) and the L125 (NP with AOS=0.21mm,
TG=1.3mm); both are considered “thin”.
With the HS filter, contrasted results were obtained both the loose (Figure 6.10a) and
dense soils (Figure 6.10b). In loose state, both the well graded and gap-graded soils were
filtered successfully by the HS with only 10% to 20% decrease in system permeability,
while the pure fine soil could not be filtered and the system permeability was lost at fast
rate. In dense state, the best result was obtained with the gap-graded soil but was not as
good as in loose state. The well graded and pure fine soils were not well filtered in this
case, the system permeability decreasing by 80% over 1000cc of flow. The most
149
important effect of soil compaction with the thin HS is certainly the dramatic
deterioration of performance with the well graded soil when switching from loose to
dense specimen.
Performance of NP filter (Figure 6.11a,b) shows progressive deterioration in system
permeability in all cases except in the case of loose pure fine soil where Krel is sustained
close to 1 over 1000cc of flow before falling. In dense state, the pure fine soil shows also
the slowest deterioration of performance but still faster than with the HS filter. Here the
most interesting observation is that the thin NP fails consistently to filter the gap-graded
specimen, whether loose or compacted. The more rapid deterioration of the system
permeability in the dense case than in the loose one confirms the susceptibility of thin NP
to blinding by coarse particles of gap-graded soils.
150
Figure 6.10 Compaction influence on RRT performance of a thin HS filter (C-M60) with soils of different silt contents
151
Figure 6.11 Compaction influence on RRT performances of a thin NP filter (Linq125) with soils of different silt content
152
6.5.4 Effect of GT Thickness on the Clogging Process in RRT
As the GT thickness increases, the number of constrictions a particle migrating through
the filter would possibly encounter also increases, and thus the likelihood of this particle
being captured within the GT increases too. This suggests the GT thickness should
influence its filtration function. However, RRT reported in Section 6.5.2 with three
different GT thicknesses did not show clearly a difference in hydraulic behavior related
to this parameter. This somewhat counterintuitive observation motivates further
examination on how the filter thickness influences the filtration process. To this purpose,
dense specimens of soil with 50%wt and 100%wt silt were filtered in RRT, under
gradient i=40, using NP with different thicknesses ranging from 1.3mm (L125) to
3.8mm (L350). At the end of each test, the mass of piping particles and clogging particles
were determined by weighting. Results are summarized in Figures 6.12 and 6.13. Overall,
the mass of clogging particles is greater (i.e. between 2 and 4 times greater) than the mass
of piping particles, but these vary in function of the GT thickness. The clogging mass
increases with increasing GT thickness while the piping mass decreases as the GT
thickness increases. This was anticipated on the basis of the constriction encountering
concept discussed above. Similar trends are observed in Figures 6.12, 6.13 for both silt
contents of well graded or pure fine soils, with respective masses of particles clogging or
piping being practically independent of the silt fraction size. Note that this particular
study was not performed using gap-graded soil.
From the same RRT series, the evolution of system hydraulic conductivity (in relative
values) vs. log of filtration time is shown in Figures 6.14 and 6.15 for the 50%wt and
153
100%wt silt soils, respectively. Note that, because semi-log scales are used to plot these
data, apparent shapes of the curves can be misleading. But even with this in mind, it can
be seen that in the early stages of the tests, the Krel reduction patterns are different,
depending on the silt contents of the tested soils (Figures 6.14 and 6.15). With 50%wt silt
(well graded soil) Krel decreases initially at a slower rate than with 100%wt silt. Then, for
all the cases except the pure fine soil under i=10 (Figure 6.15a) all the curves converge to
similar values independently of the GT thickness. For the 50%wt silt, the Krel profiles are
possibly the result of a transition from internal clogging to surface opening blockage.
This transition would occur faster under higher gradient (Figure 6.14 (a)) than under a
smaller one (Figure 6.14 (b)). blocking was also accelerated by increase of system flow
rate.
For the 100%wt silt soil, the initially rapid reductions in Krel could be due to
concentrations of fines around the GT openings, especially with high gradients used in
RRT. In Figure 6.15a, it appears the clogging process is delayed when thick GT is used
as compared to the faster rate with thinner GT. This effect might be more sensitive here
because with i=10 and 100%wt silt content, the flow rate is smaller than in the other
cases. One might conclude that thick NP filter might last longer before being clogged in
contact with high silt content soils (over 50%wt silt content) especially under lower
hydraulic gradient level expected in field conditions (i ≤ 5). Except for this particular
case, the quasi independence of the results from the GT thickness might be due to the
dominant role of clogging and blocking over piping, as attested by the relatively small
masses of piping particles observed in these tests.
154
Figure 6.12 Distributions of piping and clogging particle masses in RRT of NP filters,
different in AOS and thickness with 50%wt and 100%wt silts (Thickness and AOS increase from L125 to L350 GT, see Table 6.2)
155
Figure 6.13 Distributions of piping and clogging particle masses in RRT of NP filters,
different in AOS and thickness (Thickness and AOS increase from L125 to L350 GT, see Table 6.2)
156
Figure 6.14 GT thickness effect on rate of Krel change in RRT for 50%wt silt soil under
different system hydraulic gradients
157
Figure 6.15 GT thickness effect on rate of Krel change for pure fine soil under different system hydraulic gradients
158
6.5.5 Influence of Clay Content on GT Clogging
Whereas INDOT current technical guidelines (Technical Specifications, Sec. 913) for
highway subdrainage systems do not require installation of a filter for soils with clay
fraction over 20%wt, there is experimental evidence that clayey soil can induce drainage
clogging (see Section 2.3.2). It is also noted that filters are required in earth dams at the
contact between clay core and granular fill.
In order to investigate this specific point, dense soil specimens with variable silt and
(kaolinite) clay contents were tested in RRT, under gradient i=40, with a thick NP
geotextile (L350) which had been found adequate for high silt content soils. As can be
seen in Figure 6.16, variations in Krel indicate a rapid reduction due to clogging, similarly
to what was observed with non-clayey soils, though kaolinite is a non dispersive clay.
The soil specimens with high clay contents (20%wt clay) showed fast clogging regardless
of the silt contents (50%wt and 80%wt silt). In particular, a faster reduction was observed
for the well graded soil specimens including a fine sand fraction (between #60 and #40
ASTM sieves). Again, this abrupt Krel decrease is considered to result from surface
opening blockage by concentrations of fines, as was noted for non-clayey (50%wt silt)
soil in the previous section.
According to Kellner and Matei (1991), filtration of clayey soils can be improved by
installation of a thin granular layer between the GT and the filtered soil. To examine this
proposition, an intermediate layer, 1cm thin, of fine sand between #60 and #40 in ASTM
sieve size was placed above the GT specimen. The RRT result shown in Figure 6.16
159
Figure 6.16 Hydraulic performances in RRT under i=40 of thick NP, alone and in
association with a fine sand layer, for filtration of dense soils with 10%wt or 20%wt clay (c: clay, m: silt and s: fine sand)
indicates this design was very successful in fltrating the clayey soil (i.e. 20%wt clay,
50%wt silt and 30%wt sand).
6.6 Summary
Uniformly graded soil (Cu<3) can be successfully filtered by geotextiles with AOS
greater than their largest grain size since the self-filtration zone can be promptly built
160
upon the GT filter. Well graded and gap graded soils should be filtered by geotextiles
with AOS less than their particle sizes, D50 and Dgap respectively. This should allow for
larger amounts of coarse particles being retained upstream of the geotextile in order to
prevent continuing fine migration in unstable base soil. Since the size of soil fines (0.075
mm) is smaller than the AOS of commercially available geotextiles, most silt particles
will penetrate the GT filter rather than being retained on the surface, thus the formation of
self-filtration zone is unlikely for high fine content soils.
Hydraulic gradient level plays an important role in controlling the rate of the clogging
process. However, the level of system hydraulic gradient does not influence strongly the
filter performances as compared to soil and GT properties. The governing soil and GT
properties are soil gradation type and compaction degree, GT thickness, opening size and
fiber bonding type. Compatibility between site soil and candidate geotextile can be
effectively assessed using the RRT as long as the flow rate satisfies laminar conditions.
The site conditions would likely result in slower clogging than the RRT conditions.
Depending on base soil type (e.g. gap graded, well graded and pure fines), GT fiber
bonding type and porosity need to be considered in selection of a filter. Heat bonded GT
is recommended to filter internally unstable soil (e.g. 20%wt silt) since the GT rigid
surface will help minimizing blockage by coarse particles and allowing passage of fines.
Otherwise, needle punched GT is recommended to filter pure fines (e.g. 100%wt silt)
since the large geotextile porosity can reduce the possibility of opening blockage by fines
under a severe hydraulic condition. For problematic soils (i.e., between 20%wt silt and
161
50%wt silt), the grain size distribution and compaction degree should be considered in
the GT filter design because these parameters control the soil internal stability.
Thick GT is recommended to filter high silt content soils (over 50%wt silt) rather than
thin GT since the fine migration is suppressed by internal geotextile clogging, not by the
soil self-filtration process. Thus, the longer the infiltration path extends, the more fine
particles can be captured by GT constrictions. Therefore, a thick GT is preferable for the
purpose of fine particle retention. At sites where the geotextile is subjected to compaction
pressure, a thick GT must be selected.
Soils with relatively small clay content soils (10 to 20% wt clay) can contribute to GT
filter clogging. The rate of GT clogging is accelerated by the presence of clay as the
system flow rate decreases. In presence of silty soil with small clay contents (below
20%wt clay) it is recommended to use a composite filter consisting of fine sand and thick
GT. The affinity of clay minerals for sand grains will minimize clay accumulation over
the opening channels of the GT.
162
7. Conclusions and Recommendations of Geotextile Filter Selection Guidelines
7.1 Summary of Findings from this Study
Soil filtration by geotextiles is a complex, multifaceted process. Its successful application
depends on physical compatibility between the geotextile filter and the soil to be retained.
Therefore, no successful design can be achieved without considering, first the nature and
characteristics of the soil present at the site, and then the range of geotextile products
eligible. There is no universal solution where a unique geotextile filter would be
compatible with all types of soils or even a broad range of soils. But design solutions can
be devised where geotextiles would be compatible with soil types defined by simple
parameters such as their particle size and state of compaction.
Geotechnical situations that are considered prone to filtration problems with highway
underdrains and from which soil samples were analyzed are characterized by high silt
content, but the presence of clay together with silt, plays also a role in filter clogging. At
a project site from which samples of exhumed filters were obtained, the soil was,
typically, silty clay. The filter samples from this site exhibited variable degree of
clogging after 15 years of service and, when quasi-intact specimens were tested in the
laboratory, they were found incompatible with the soil. Video recording of underdrain
pipe non-destructive inspections from different INDOT projects show moderate to heavy
sedimentation within pipes after one year of service, suggesting adequate filtration was
lacking at this sites, though other factors such as incorrect installation or damage to the
fabrics, may also have played a role.
163
The present study was focused on physical clogging of non-woven geotextile filters by
migrating solid particles from the surrounding soil. Biological or chemical clogging was
not within the scope of this study and could not be investigated in detail. In particular, the
problem of chemical clogging in presence of chemically modified soil would require
special testing equipment being developed for a future study. Although, in present
practice, INDOT does not use filter fabrics for underdrains in rubblized subgrade, a very
limited and simplifeied test performed on only one sample suggests cement chemicals
from recycled (rubbleized) concrete aggregates would likely affect the integrity of
geotextile filters, a conclusion already reached by Wukash and Siddiqui (1996) in an
earlier JTRP study. Because of the similarity in chemistry, this information can be
considered also as an indication of what could occur with cement modified subgrade.
The two basic requirements for a filter that are, retain solid particles while still allowing
water to flow to the drain, depend on the same set of properties for a geotextile. These are
its opening size, porosity and internal fabric structure. For nonwoven geotextiles these, in
turn, result from the manufacturing style, amount of fibers per unit volume and thickness
of the fabric. During filtration, migration and spatial relocation of soil particles take place
in the close vicinity of the geotextile. Some particles penetrate the fabric pores and
constriction network and may remain trapped inside the geotextile while others cross over
and can eventually reach the drain. Even in the case of a successful design and
compatibility of the geotextile with the soil, it should not be expected that all the solid
particles will be retained. What is expected is that particle migration will reach a steady
164
state after a period of time depending on the volume of flow, and internal stability of the
soil microstructure will be achieved in an interface zone at the boundary of the geotextile
and a thin layer of immediately adjacent soil. As a result of particle migration,
permeability in the adjacent soil, and across the filter and interface zone (i.e. the filter
system as it was defined in chapters 5 &6), varies during the early stage of the filtration
process. At steady state, the filter system hydraulic conductivity may have increased as
compared to that of the base soil (in case of bridging) or may have increased (in cases of
partial blinding of partial clogging). Thus it is legitimate to use the system hydraulic
conductivity and its internal variations for monitoring, in laboratory experiments, the
filtration mechanism. But, because geotextiles are always more permeable, by orders of
magnitude, than fine-grained soils in which filters are needed, and if the filter design is
successful, local changes in permeability in the interface zone remain limited,
permeability is not the critical factor for a geotextile filter selection. In other words, if a
geotextile filter has been selected adequately for its retention function being fulfilled,
then automatically its permeability remains sufficient for allowing cross-flow and,
therefore, should not be of concern. This is why, in the geotextile filter selection method
proposed in the next section, there is no need for an explicit permeability criterion.
Laboratory testing results obtained using the best available experimentation methods, the
FWGR and the RRT, for a number of material combinations and testing parameters are
believed to be realistic enough for serving as the basis of practical design guidelines. The
testing conditions can be considered more severe than most field conditions with respect
to particle mobility (because of the high gradients and full saturation imposed in the
165
tests). However, adverse dynamic effects induced by traffic close to the roadway edge
and the resulting excess pore pressure pulsing in the subgrade near the filter could not be
simulated in the laboratory. During flexible wall gradient ratio tests, fine migration within
the filter system could be traced indirectly by monitoring the precise pore pressure
variation at different elevations along the soil column. Resulting data, gradient ratios and
hydraulic head losses through the geotextiles, were consistent altogether to identify the
different clogging mechanisms. In particular, they allowed differentiation between
surface blocking by coarse particles and internal clogging by fines.
Among the most interesting findings from the testing program, in order to better
understand the fundamentals of filtration, is the influence of the soil state of compaction
on the filter response. In general, compaction increases interlocking between soil
particles, reduces the pore space and, consequently, the internal stability of the soil is
improved. This is contributing to good filter performance for soils made of a small to
medium amount of silt mixed with coarser particles. But a positive effect was not
observed with soils made essentially of silt. However, the effect of compaction is more
complex if the soil surrounding the filter is compacted after the getextile has been
installed. In this case compaction-induced pressure is applied to geotextile and can
modify the fabric pore structure or force soil particles into its openings. In the field, this
can be the case during compaction or re-compaction of subgrade but also during
compaction of aggregate in the drainage trench and above. If fine particles are forced into
the filter fabric by this mechanism, this will contribute to clogging. Thus compaction can
affect filtration positively or negatively, depending on the soil composition and
166
construction sequence. This can be mitigated by selecting geotextiles with adequate type,
opening size and thickness.
Another important factor is the geotextile thickness in connection with its opening size.
The thicker is the geotextile, the more likely is a particle to encounter a constriction
smaller than its size. High silt content soils can be effectively filtered by thick geotextiles
with small opening size rather than by thin ones with large opening size. As described
before, most commercially available non woven geotextiles have a opening size larger
than silt particle size. Therefore, the fines need be filtered within the geotextile fabric
instead of be retained outside To achieve this, a longer infiltration path, characteristic of a
thick non-woven geotextile, will offer to a traveling particle more opportunities for small
constriction encounter than a thin fabric would. If the soil is to be compacted, a thick
geotextile is also less likely to have its porosity decreased and fabric structure disturbed
by the compaction process than a thin geotextile.
Filtration tests were performed with different types of soils, including low silt content
soil, gap-graded soil and high silt content soil. With low silt content soil (10%wt silt) it is
generally agreed that the filter should be a geotextile with large AOS (> 1 mm), but it was
observed in this study that, if the soil has been compacted, a thick geotextile with much
smaller AOS (0.15 mm) can also be adequate. Gap-graded soil with 20%wt silt was
successfully filtered using a geotextile with large opening size (0.21 mm) without need
for compaction. However, thin geotextiles should not be used as filters at sites where
compaction work is expected to reduce significantly the porosity of subgrades with silt
167
content between 10%wt and 50%wt. Loose soil with high fine content (50%wt silt) was
filtered successfully by thick geotextile. The internal clogging of a geotextile by fine
particles is a relatively slow process as compared to blockage of openings at the surface
by coarse particles. But when a geotextile with high permittivity is used as filter, a more
rapid penetration of fines can occur at point-wise locations (instead of distributed
clogging) where high concentrations of fines can plug the fabric openings and conduits.
In such cases with high fine contents (>50%wt silt) use of a thick geotextile would reduce
potential for plugging. The role of constraint compressibility, combined with geotextile
thickness, was also observed. Needle punched non woven geotextiles are known to be
more compressible than other manufacturing styles. In the tests, it was observed that
thinner geotextiles underwent more deformation by localized external load from soil
grains than thicker ones.
Of paramount importance is the relationship between filter opening size and soil grain
size distribution. Uniformly graded soils (Cu<3) can be filtered by the geotextiles with
large FOS because a self-filtration zone of soil builds itself at the filter interface and
forms bridges over filter openings that may be larger than individual particles. On the
other hand, well graded or gap-graded soils need to be filtered by geotextiles with
opening size smaller than the representative particle size, D50 or the lower limit of the
GSD gap DG, respectively. The reason for this requirement is that a larger quantity of
coarse particles needs to be retained at the interface in order to form the self-filtration
bridging structure and prevent piping from occurring within the internal unstable soil.
But, with these types of GSD, if most of the particles are smaller than the geotextile
168
opening size, silt can penetrate easily the filter and the self-filtration zone is unlikely to
form.
Another important relationship is between the geotextile manufacturing style (producing
different modes of fiber bonding and fabric porosities) and the soil type of GSD (e.g. gap
graded, well graded or pure fine). If the soil is internally unstable and has small silt
content (< 20%wt silt), an even pattern at the surface of the filter faciltates penetration of
the loose fines through the openings that still left free from coarse particle blockage. In
case of high silt content soil (> 50%wt silt) where particles assemblies are more likely to
be in a in loose state, the geotextile porosity should be large in order to limit the risk of
plugging by localized fine intrusion. For soils that are the most problematic with respect
to geotextile filter design (20% < silt wt < 50%), selection of a geotextile style will
depend on both grain size distribution and state of compaction since these factors control
the soil internal stability.
Presence of small amounts of clay in silty soils contributes to filter clogging. It was
observed from the experiments that the cohesiveness of clay mineral plays a role in
accelerating the filter internal clogging especially at low flow rate (below 1.0E-6 cm/sec).
A solution for filtering silty soils with small clay content (< 20%wt) is to associate a
thick geotextile and a layer of fine sand placed upstream of the filter. Affinity of clay
mineral to sand grains and the increased tortuosity of the pore structure would help
preventing clay accumulation on geotextile openings already partially clogged by silt
particles.
169
The magnitude of the hydraulic gradient across the filter zone influences the time rate of
the clogging process but not its result. Application of high gradients in filtration tests had
the effect of accelerating the process, as compared to tests performed under smaller
gradients, but the ultimate state of the system, in terms of gradient ratios and hydraulic
conductivity at steady state, was not significantly different. In addition to being relevant
to field conditions, this observation is also useful for setting up laboratory experiments by
allowing performance of faster tests at high gradients provided the flow remains laminar.
7.2 Recommendations for Filter Selection and Design
Findings of this study and information found in published literature lead to the conclusion
that current INDOT specifications, sec. 913 (see Chapter 1 of this report) need to be
modified mainly in two areas:
- Filter criteria should account more broadly and accurately for the soil
characteristics than the current criterion specifying only a filter with AOS smaller
than 0.3mm (sieve #50 or smaller) when the soil is mainly composed of silt;
- Current mechanical properties requirements should be revised for the filter fabric
to survive installation and construction operations without being damaged.
Detailed recommendations follow in the next sections .
7.2.1 Geotextile filter selection guidelines
In an attempt to formulate criteria that would be simple enough for practical
implementation, only the most important factors were considered and their possible
ranges of variation were divided in a small number of cases. Unavoidably, these divisions
carry some degree of arbitrariness and engineering judgment should be exercised in
borderline cases. These recommendations should be understood as tentative. They will
170
likely be subject to amendment after some experience with their application has been
gained.
The guidelines for selecting geotextile filter in function of soil characteristics that are the
grain size composition of the soil, its Atterberg’s limits and for clay soils, the hydraulic
conductivity, are summarized in Table 7-1 which also includes a number of explanatory
notes. Only non-woven geotextiles are recommended. The output consists for each
situation, in a recommendation of opening size range that would be adequate (defined in
function of soil grain size), bonding type and fabric thickness. The recommended opening
size is expressed in terms of the Apparent Opening Size (AOS) instead of the Filtration
Opening Size (FOS) because the AOS is the filtration index property commonly reported
by geotextile manufacturers in the United States (IFAI, 2005) and its determination is
standardized under ASTM D 4751. The FOS determination is standardized under
ISO/DIS 12956. An indication of the effect of soil compaction is also provided for
information. However, it is noted that INDOT’s construction practice is to install edge
drains in trenches that are excavated in compacted subgrade. It should therefore be
assumed that the compacted soil condition will apply in general. The indication obtained
from this study that, in some cases, good soil compaction is beneficial to the filter
performance emphasizes the importance of soil compaction and its quality control.
171
Ta
ble
7-1
Prop
osed
filte
r sel
ectio
n gu
idel
ine
Not
e 1)
Pla
stic
ity in
dex
and
liqui
d lim
it fa
ll in
A6
regi
on o
f AA
SHTO
pla
stic
ity c
hart
(AA
SHTO
M14
5, A
STM
D 3
282)
N
ote
2) P
last
icity
inde
x an
d liq
uid
limit
fall
in A
7.6
regi
on o
f AA
SHTO
pla
stic
ity c
hart
(AA
SHTO
M14
5, A
STM
D 3
282)
172
Figure 7-1 Schematic design cross sections for drainage and filter systems (A) General design, (B) special case of clay soil (see Table 7-1)
173
Figure 7-2 Example particle size distributions. (A) example 1, (B) example 2
174
Figu
re 7
-3 S
elec
tion
exam
ples
. (A
) exa
mpl
e 1,
(B) e
xam
ple
2
175
For the solutions recommended in Table 7-1 it is generally assumed, when a filter is
required, that the geotextile will be installed as a liner on the bottom, sides and top
boundaries of the drainage trench as shown in Fig. 7-1a. A difference between this design
and current INDOT practice is that, in the present recommendation, the geotextile is
wrapped over the drainage trench top after backfilling. It is believed this configuration is
better than current practice in which the trench top is left without filter and allows
infiltration of fines or recycled concrete chemicals driven by vertical downwards
gradients. There is one exception shown in Fig. 7-1b, when a combination of geotextile
and sand filters are recommended. In this case, because the sand component of the filter
has to be located upstream of the geotextile, the practical solution is to install the
geotextile as a wrapping around the drainage pipe, and then backfill the lower part of the
trench with sand, at least up to 4” above the pipe (the remaining part can be backfilled
with coarser aggregate if this is more economical).
7.2.2 Examples of filter selection
In order to illustrate the application of the proposed guidelines, two examples are
presented. The two soils used as examples have already been described in Chapter 3.
Example 1
The soil is a well-graded sandy loam represented by Sample S1 in Tables 3-1 & 3-2,
where it is classified as a A6(2) according to AASHTO. Its grain size distribution is also
shown in Figure 7-2a. indicates the largest particle size is greater than 2mm and the
coefficient of uniformity is less than 3. The silt fraction is 30%wt and the clay content is
less than 20%wt. Entering the silt and clay amounts information in Table 7-1 leads to the
recommended selection. For more convenience, this is shown in Fig. 7-3a. The filter
176
opening size (AOS) should be between 0.02mm (i.e. the soil D30) and 0.25mm (i.e. the
soil D50), and either a heat bonded or a needle punched geotextile type would be selected,
depending on subgrade compaction. A number of products are available that would
satisfy these requirements. If one considers, for instance, the samples already used in this
study (Table 5-1), both the BBA3501 (spun bonded type with AOS=0.21 mm) and Linq
350 (needle punched type with AOS=0.15mm) would be adequate.
Example 2
The soil corresponds to Sample C1 in 3-1 & 3-2, where it is classified as a silty clay,
A6(18) according to AASHTO. The clay content is over 20%wt (Fig. 7-2b). Thus the
criterion, according to Table 7-1, to decide whether or not a filter is required, is based on
hydraulic conductivity. The permeability test performed on this sample resulted in
Ksat=2.7x10 -6cm/sec, a value larger than the 10 -6cm/sec limit of the table. If the
guideline is strictly followed, a geotextile filter wrapped around the pipe and combined
with fine sand backfill is required. However, considering typical uncertainty due to
sample disturbance in hydraulic conductivity assessment, this can be considered a
borderline case (a difference of an order of magnitude in Ksat would be considered
meaningfull rather than a factor 2) and engineering judgment suggests the use of a filter
here is only optional.
7.2.3 Additional physical requirements for geotextiles: Survivability criteria
Selection of geotextile filter based on Table 7-1 addresses the primary function of the
geotextile where retention and permeability requirements are met. Another important
criterion for the selection of a particular geotextile is based on its ability to survive the
mechanical constraints imposed during installation, construction of the roadway and later
177
in service. It has been observed that a number of failures of geotextiles occur during
installation and construction rather than in service. This problem was addressed by
AASHTO and FHWA in the 1980s through the Task Force 25 Committee. The empirical
criteria and methodology are at the origin of guidelines found in AASHTO-AGC-
ARTBA, Task Force 25 and AASHTO M288. These are based on the severity of pressure
load expected to be applied over the geotextile during construction and the quality of
preparation of surfaces (i.e. the subgrade) on which the geotextile is installed.
Combination of these two factors leads, for the candidate geotextile, to a required degree
of survivability and corresponding minimal performance in standardized index tests such
as the grab test, puncture test, burst test, puncture test. It is noted that, for meeting the
criterion, a geotextile must pass all the tests, not just one of them.
These guidelines are summarized in Appendix B. For edge drain filter fabrics, it is
expected that installation is done on well prepared subgrade and low to moderate
construction equipment pressure is applied to the fabric. Based on these assumptions, the
Class 3 or Class 2 survivability level is required by AASHTO M288-96 (see also
Koerner, 1998, sec. 2.1.2). Even when considering the least severe condition, that of
Class 3, it is noted that the physical properties required by AASHTO M288 (see Table
2.2a in Appendix B of this report) are higher than the requirements of current INDOT
specifications, Sec. 913.19, applicable to geotextiles used with underdrains. In order to
ensure compliance with the AASHTO M288 minimal requirements, it is recommended to
modify INDOT’s Sec. 913.19 physical requirements as follows:
178
TEST METHOD REQUIREMENTS
Current Recommended Grab Strength ASTM D 4632 355.8 N (80 lbs) 500 N (112 lbs) Seam Strength ASTM D 4632 311.4 N (70 lbs) 450 N (101 lbs) Puncture Strength ASTM D 4833 111.2 N (25 lbs) 180 N (40 lbs) Burst Strength ASTM D 3786 896 kPa (130 psi) 950 kPa (138 psi) Trapezoidal Tear ASTM D 4533 111.2 N (25 lbs) 180 N (40 lbs) Apparent Opening ASTM D 4751 Sieve No 50 or Sieve No 50 or Size (AOS) smaller opening smaller opening From Table 7.1 Permeability ASTM D 4491 0.1 mm/sec same U.V. Degrad. (150h) ASTM D 4355 70% strength retained same
7.3 Implementation: Step-by-Step Procedure
In order to facilitate implementation of the above recommendations, the following step-
by-step procedure can be applied:
STEP 1
Determine the following properties of the subgrade soil at the drainage trench location.
- From the particle size distribution:
o Silt content (in % passing weight)
o Clay content (in % passing weight)
o D30 , D50 and D85 characteristic particle sizes
o If the particle size distribution shows a gap, determine DGap,Min and
DGap,Max , respectively the lower and upper limit of the gap.
179
- IF the clay content is less than 20%, determine Atterberg’s consistency limits and
plasticity index (ASTM D 2487)
- IF the clay content is greater than 20%, determine the hydraulic conductivity (at
saturation).
STEP 2
IF the silt content is
(a) Over 50%, then GO TO STEP 3
(b) Between 15% and 50%, then GO TO STEP 4
(c) Between 5% and 15%, then a filter fabric is optional but
recommended. GO TO STEP 5 for selection criteria.
(d) Less than 5%, then NO FILTER FABRIC IS REQUIRED
STEP 3 (filter selection for case a, silt content > 50%)
(case a.1) IF the clay content is less than 20%, then SELECT a filter fabric with the
following characteristics and design recommendation (WHEN DONE, GO TO STEP 6):
Style: Needle Punched Non-woven
Opening size: AOS < D50
Thickness: 3mm (or greater)
- (a.1.a) If the soil plasticity is low (i.e. the point representative of liquid limit and
plasticity index in the AASHTO soil plasticity chart, ASTM 2487, is in the A.6
region), use standard design with filter fabric lining the trench (see Fig. 7-1a)
- (a.1.b) If the soil plasticity is high (i.e. the point representative of liquid limit and
180
plasticity index in the AASHTO soil plasticity chart, ASTM 2487, is in the A.7.6
region), the filter fabric should be wrapped around the drainage pipe and the
trench backfilled with fine sand (see Fig. 7-1b).
(case a.2) IF the clay content is greater than 20% AND the soil hydraulic conductivity is
greater than 10-6 cm/sec (or 2 10-6 ft/min), THEN SELECT a filter fabric with the
following characteristics and design recommendation (WHEN DONE, GO TO STEP 6):
Type: Needle Punched Non-Woven
Opening size: AOS < D50
Thickness: 3mm (or greater)
The filter fabric should be wrapped around the drainage pipe and the trench
backfilled with fine sand (see Fig. 7-1b).
(case a.3) IF the clay content is greater than 20% AND the soil hydraulic conductivity is
less than 10-6 cm/sec (or 2 10-6 ft/min), THEN NO FILTER FABRIC IS REQUIRED.
STEP 4 (filter selection for case b, 15% < silt content < 50%)
(case b.1) IF the clay content is less than 20% THEN SELECT a filter fabric with the
following characteristics and design recommendation (WHEN DONE, GO TO STEP 6):
Style: Heat Bonded Non-Woven
Opening size: D30 (or DGap,Min ) < AOS < D50
Thickness: Sufficient for meeting mechanical property requirements of INDOT
Specifications, Sec. 913.19.
- (b.1.a) If the soil plasticity is low (i.e. the point representative of liquid limit and
plasticity index in the AASHTO soil plasticity chart, ASTM 2487, is in the A.6
181
region), use standard design with filter fabric lining the trench (see Fig. 7-1a)
- (b.1.b) If the soil plasticity is high (i.e. the point representative of liquid limit and
plasticity index in the AASHTO soil plasticity chart, ASTM 2487, is in the A.7.6
region), the filter fabric should be wrapped around the drainage pipe and the
trench backfilled with fine sand (see Fig. 7-1b).
(case b.2) IF the clay content is greater than 20% AND the soil hydraulic conductivity is
greater than 10-6 cm/sec (or 2 10-6 ft/min), THEN SELECT a filter fabric with the
following characteristics and design recommendation (WHEN DONE, GO TO STEP 6):
Style: Heat Bonded Non-Woven
Opening size: D30 (or DGap,Min ) < AOS < D50
Thickness: Sufficient for meeting mechanical property requirements of INDOT
Specifications, Sec. 913.19.
The filter fabric should be wrapped around the drainage pipe and the trench
backfilled with fine sand (see Fig. 7-1b).
(case b.3) IF the clay content is greater than 20% AND the soil hydraulic conductivity is
less than 10-6 cm/sec (or 2 10-6 ft/min), THEN NO FILTER FABRIC IS REQUIRED.
STEP 5 ( filter selection for case c, 5% < silt content < 50%)
(case c.1) IF the clay content is less than 20% THEN SELECT a filter fabric with the
following characteristics and design recommendation (WHEN DONE, GO TO STEP 6):
Style: Heat Bonded Non-Woven
Opening size: D85 (or DGap,Max ) < AOS < 3D85
Thickness: Sufficient for meeting mechanical property requirements of INDOT
182
Specifications, Sec. 913.19.
- (c.1.a) If the soil plasticity is low (i.e. the point representative of liquid limit and
plasticity index in the AASHTO soil plasticity chart, ASTM 2487, is in the A.6
region), use standard design with filter fabric lining the trench (see Fig. 7-1a)
- (c.1.b) If the soil plasticity is high (i.e. the point representative of liquid limit and
plasticity index in the AASHTO soil plasticity chart, ASTM 2487, is in the A.7.6
region), the filter fabric should be wrapped around the drainage pipe and the
trench backfilled with fine sand (see Fig. 7-1b).
(case c.2) IF the clay content is greater than 20% AND the soil hydraulic conductivity is
greater than 10-6 cm/sec (or 2 10-6 ft/min), THEN SELECT a filter fabric with the
following characteristics and design recommendation (WHEN DONE, GO TO STEP 6):
Style: Heat Bonded Non-Woven
Opening size: D85 (or DGap,Max ) < AOS < 3D85
Thickness: Sufficient for meeting mechanical property requirements of INDOT
Specifications, Sec. 913.19.
The filter fabric should be wrapped around the drainage pipe and the trench
backfilled with fine sand (see Fig. 7-1b).
(case c.3) IF the clay content is greater than 20% AND the soil hydraulic conductivity is
less than 10-6 cm/sec (or 2 10-6 ft/min), THEN NO FILTER FABRIC IS REQUIRED.
STEP 6 (verification of mechanical and other physical properties)
For the geotextile selected on the basis of the above filtration criteria, check that the
mechanical and other physical requirements of INDOT’s Specification, Sec. 913.19
183
Geotextiles for Underdrains (including the modifications recommended in this report),
are met. If these requirements are not met, select a geotextile of similar type and AOS,
but with greater thickness or better mechanical properties so that it will meet the
requirements.
7.4 Recommendations for Future Study
Future studies on the subject of filters for highway drainage systems in Indiana should
address two types of questions:
(1) How effective are the above recommendations in actual field conditions: this can
only be assessed after implementation has been done in actual or pilot projects
and performance is observed, by monitoring/inspecting the drains and exhuming
fabric filter samples, over a period of several years.
(2) Particular aspects of the filtration problem that could not be addressed in the
present study would require further research. Such topics are:
- The effect of chemicals from chemically modified subgrades;
- The effect of dynamic pulsing of pore pressure due to traffic;
- Development of innovative technologies that would facilitate monitoring,
maintenance and retrofitting of filters.
It should be kept in mind also that geosynthetic fabric manufacturing is a very dynamic
and innovative industry. New geosynthetic products will likely be developed in the near
future that will have potential for improved filter performance as compared to currently
available fabrics. Evaluation of these new filter geosynthetics will be necessary as they
become available.
184
References AASHTO (1986) Geotextile specifications prepared by joint committee of AASHTO-ARTBA Task Force 25, Washington, DC, USA AASHTO (1991) Report on Task Force 25, Joint Committee Report of AASHTO-AGC-ARTBA, American Association of State, Highway, and Transportation Officials, Washington, D.C., Dec. Abboud, N. M. and Corapcioglu, M. Y. (1993) Numerical solution and sensitivity analysis of filter cake permeability and resistance, Transport in Porous Media, Kluwer Academic Publishers, Netherlands, 10, 235-255 Aberg, B. (1992) Void ratio of non-cohesive soils and similar materials, Journal of Geotechnical Engineering, ASCE, Vol. 11, No. 9, 1315-1334 Ahmed, Z., White, T.D. and Bourdeau, P.L. (1993) “ Pavement Drainage and Pavement-shoulder Joint Evaluation & Rehabilitation”, Draft Final Report, FHWA/IN/JTRP-93/2, Purdue University Akram, M.H. (1995) Long-term filtration behavior of non-woven geotextiles with fly ash, Proceedings, Geosynthetics’ 95 Conference, NAGS, Nashville, TN, Vol.3, 1195-1206 Almeida, M.S.S., Spada, J. and Ehrlich, M. (1995) Geotextile filtration tests on two brazilian soils and current filter criteria, Geosynthetics International, Vol.2, No.1, 357-377 Alobaidi, I. and Hoare, D.J. (1996) The development of pore water pressure at the subgrade-subbase interface of a highway pavement and its effects on pumping of fines, Geotextiles and Geomembranes, Vol.14, 111-135 Alobaidi, I. and Hoare, D.J. (1999) Mechanisms of pumping at the subgrade-subbase interface of highway pavements, Geosynthetics International, Vol.6, No.4, 241 – 259 Arulanandan, K. and Pery, E. B. (1983) Erosion in relation to filter design criteria in earth dams, Journal of Geotechnical Engineering, Vol. 109, No. 5, May, ASCE, 682-697 ASTM (2000). ASTM Standards on Geosynthetics, 5th Edition, Committee D-35, American Society for Testing and Materials, Philiadelphia Babic, M., Bjedov, G. and Shen, H. T. (1992) Sediment-laden oscillatory flow in an idealized porous media, Transport in Porous Media, Kluwer Academic Publishers, Netherlands, 7, 187-204
185
Barrington, S. F., Moueddeb, K. E., Jazestani, J. and Dussault, M. (1998) The clogging of nonwoven geotextiles with cattle manure slurries, Geosynthetics International, Vol. 5, No.3, 309 - 325 Barroso, M. C., Lopes, P. and Maria, D. A. (1998) Geotextile characteristic opening size: the Influence of some test parameters, 6th International Conference on Geosynthetics, 1005-1008 Beikae, M. (1999) Monte carlo simulation for filter design, Filtration and Drainage in Geotechnical/Geoenvironmental Engineering, ASCE, 107-122 Bergado, D.T. and Manivannan, R. and Balasubramaniam, A.S. (1996) Filtration criteria for prefabricated vertical drain geotextile filter jacket In soft Bankok clay, Geosynthetics International, Vol.3, No.1, 63 – 83 Bhatia, S. K. and Huang, Q. (1995) Geotextile filters for internally stable/ unstable soils, Geosynthetics International, Vol. 2, No.3, 537-565 Bhatia, S. K., Moraille, J. and Smith, J. L. (1998) Performance of granular vs. geotextile filters in protecting cohesionless soils, Filtration and Drainage in Geotechnical/Geoenvironmental Engineering, STP 78, ASCE, 1-29 Bhatia, S.K., Qureshi, S. and Kogler, R.M. (1990) Long-Term Clogging Behavior of Non-woven Geotextiles with Silty and Gap-graded Sands, Geosynthetic Testing for Waste Containment Application, ASTM STP 1081, Edited by Koerner, R.M. , ASTM, Philadelphia, 285-298 Bhatia S. K. and Smith, J. L. (1994) Comparative study of bubble point method and mercury intrusion porometry techniques for characterizing the pore-size distribution of geotextile, Geotextile and Geomembranes, Elsevier, 13, 679-702 Bhatia S. K. and Smith, J. L. (1995) Application of the bubble point method to the characterization of the pore-size distribution of geotextiles, Geotechnical Testing Journal, Vol. 18, No. 1, Mar., 94-105 Bhatia S. K. and Smith, J. L. (1996a) Geotexitle characterization and pore size distribution: part I, A review of manufacture processes, Geosynthetics International, Vol. 3, No. 1, 85 - 105 Bhatia, S. K. and Smith J. L. (1996b) Geotexitle characterization and pore size distribution: part II. A review of test methods and results, Geosynthetics International , Vol. 3, No. 2, 155-180 Bhatia, S. K., Smith J. L. and Christopher, B. R. (1996) Geotexitle characterization and pore size distribution: part III. comparison of methods and application to design, Geosynthetics International, Vol. 3, No. 3, 301-328
186
Black, P. J. and Holtz, R. D. (1999) Performance of geotextile separators five years after installation, Journal of Geotechnical and Geoenvironmental Engineering, May, 404-412 Boller, M. A. and Kavanaugh, M. C. (1995) Particle characteristics and head loss increase in granular media filtration, Water Resource, Elsevier Science Ltd., Vol. 29, No. 4, 1139-1149 Bonala, M.V.S. and Reddi, L.N. (1998) Physiochemical and biological mechanisms of soil clogging – an overview, Filtration and Drainage in Geotechnical/Geoenvironmental Engineering, STP 78, ASCE, 43-67 Bourdeaux, G. and Imaizumi, H.(1977) Dispersive clay at Sobradinho dam, Dispersive clays, Related Piping, and Erosion in Geotechnical Projects, STP 623, J.L. Sherard and R.S. Decker, Eds.,ASTM,13-24 Calhoun, C.C. Jr. (1972) Development of design criteria and acceptance specifications for plastic filter cloths, Technical Report, S-72-7, US Army Engineer Waterways Experiment Station, Vicksburg, MS, 83 Carroll, R.G. (1983). Geotextile filter criteria, Transportation Research Record, No. 916, 46-53 Cazzuffi, D. A., Mazzucato, A., Moraci, N. and Tondello, M. (1999) A new test apparatus for the study of geotextiles behavior as filters in unsteady flow conditions: relevance and use, Geotextiles and Geomembranes, Elsevier, 17, 313-329 CGS (1992) Canadian Foundation Engineering Manual, Canadian Geotechnical Society, Canada Chang H., Juang, A. M. and Holtz, R.D. (1986) Fabric, pore size distribution, and permeability of sandy soils, Journal of Geotechnical Engineering, ASCE, Vol. 112, No. 9, 855-868 Chapuis, R. P. (1992) Similarity of internal stability criteria for granular soils, Technical report, Candidian Geotechnical Journal, 29, 711-713 Chew, S. H., Zhao, Z. K., Karunaratne, G. P., Tan, S. A., Delmas, Ph. and Loke, K.H. (2000) Revetment geotextile filter subjected to cyclic wave loading, geotechnical STP.103, Advanced in Transformation and Geoenvironmental Systems Using Geosynthetics, Proceedings of the Geo Denver Conference, Denver, Aug., ASCE, 162-175 Christopher, B. R. and Fischer, G. R. (1992) Geotextile filtration principles, practices and problems, Geotextiles and Geomembranes, Special Issue on Geosynthetics in Filtration, Drainage and Erosion control, Elsevier, Vol. 11, Nos. 4-6, 337-353
187
Christopher, B.R. and Holtz, R.D (1985) Geotextile Engineering Manual, United States Department of Transportation, Federal Highway Administration, Washington DC, Report No. FHWA-TS-86/203 Christopher, B.R., Holtz, R.D and Berg, R.R. (1995) Geosynthetic Design and Construction Guidelines, U.S. Department of Transportation, Federal Highway Administration, Washington DC, Report No. HI-95-038 Corbet, S.P. (1993) The design and specification of geotextile and geocomposites for filtration and drainage In Geotextile in Filtration and Drainages, S. Corbet and J. King Eds., Thomas Telford, London, UK, 29-40 Dierickx, W. (1999) Opening size determination of technical textiles used in agricultural applications, Geotextiles and Geomembranes, Elsevier, 17, 231-245 Dimmick, K. and Bhatia, S. K. (1991) Geotextile edge drain design and specification by expert system, Geotechnical Conference, ASCE, Vol. 1, 281-297 Dullien, F. A. L. (1991) Characterization of porous media- pore level, Characterization of Porous Media, Kluwer Academic Publishers, Netherlands, 6, 581-606 Elisabeth, C., Etienne, G. and Stephane, R.(1987) Permeability of a random array of fractures of widely varying apertures, Transport in Porous Media, Kluwer Academic Publishers, Netherlands, 2, 31-43 El-Kadi, A. (1985) On estimating the hydraulic properties of soil, Part 1, Comparison between forms to estimate the soil water characteristics function, Advanced Water Resources, Vol. 8, 136-147 Elsharief, A.M. (1992) Laboratory Evaluation of Prefabricated Highway Edge Drains, Joint Highway Research Project, Final Report, FHWA/IN/JTRP-92/20, Purdue University, 283 Elsharief, A. M. and Lovell, C. W. (1996) A probabilistic retention criterion for non-woven geotextiles, Geotextile and Geomembranes, Elsevier, 14, 601-617 Espinoza, R.D. (1993) Numerical Analysis of Unsaturated Flow in Porous Media, PhD Dissertation, School of Civil Engineering, Purdue University Espinoza, D., Bourdeau, P.L. and White, T.D (1993) Pavement Drainage and Pavement-shoulder Joint Evaluation & Rehabilitation: Numerical Modeling of Infiltration and Drainage in Pavements, Joint Highway Research Project, Final Report, FHWA/JTRP/IN93-2, Purdue University
188
Fannin, R. J., Vaid, Y. P. and Shi, Y. C. (1994) Filtration behavior of nonwoven geotextiles, Canadian Geotechnical Journal, 31, 555-563 Faure, Y.H. (1988) Approche structurale du comportement filtrantdrainant des geotextiles, Ph.D Thesis, L’Universite Joseph Fourier, L’Institut National Polytechnique de Grenoble, France, 352 Faure, Y. H., Gourc, J. P. and Gendrin, P. (1990) Structural study of porometry and filtration opening size of geotextiles, Geosynthetics: Microstructure and Performance, ASTM STP 1076, Peggs, I.D., Ed., ASTM, Philadelphia, 102-119 Faure, Y. H. and Kehila, Y. (1998) Filter behavior of hydraulically and mechanically damaged geotextiles, 6th International Conference on Geosynthetics, Vol. 2, 1017-1020 Fischer, G.R., Christopher, B.R. and Holtz, R.D. (1990) Filter criteria based on pore size distribution In Proceedings, 4th International Conference on Geotextiles, The Hague, The Netherlands, 289-294 Fleming, I. R. and Rowe, R. K. and Cullimore, D. R. (1999) Field observation of clogging in a landfill leachate collection system, Canadian Geotechnical Journal, 36, 685-707 Fluet, J. E. Jr. and Luettich, S. M. (1994a) Geotextile design using flow nets, Proceedings, Geosynthetics ’93, NAGS Conference, Vancouver, B.C., Vol.1, 455-468 Fluet, J. E. Jr. and Luettich, S. M. (1994b) Geotextile filter criteria for gap-graded silty sands, Proceedings, Geosynthetics ’93, NAGS Conference, Vancouver, B.C., Vol. 1, 469-481 Fo, O. B. D., Marra, W. D. Jr., Kachan, G. C. and Coury, J. R. (2000) Filtration of electrified solid particles, Industrial and Engineering Chemistry Research , No. 39, 3884-3895 Forsyth, R.A., Wells, G.K. and Woodstrom (1987) Economic Impact of Pavement Subsurface Drainage, Transportation Research Record 1121, Washington, DC, Transportation Research Board Fourie, A.B. and Addis, P.C. (1999) Changes in filtration opening size of woven geotextile subjected to tensile loads, Geotextiles and Geomembranes, Elsevier, Vol. 17, No. 5, Oct., 331-340 Fourie, A. B. and Kuchena S. M. (1995) The influence of tensile stresses on the filtration characteristics of geotextiles, Geosynthetics International, Vol.2, No.2, 455-471
189
French Committee on Geotextiles and Geomembranes (1981) Recommendations for the Use of Geotextiles in Drainage and Filtration Systems (in French; draft translation in English, 1986) Gabr, M. A., Akram, M. H. and Zayed, A. M. (1998) Field versus laboratory filtration performance of a non-woven geotextile with fly ash, Geotextiles and Geomembranes, Elsevier, 16, 247-255 Gardoni, M. G. and Palmeira, E. M. (1998) The performance of a geotextile filter in tropical soil, 6th International Conference on Geosynthetics, Vol. 2, 1027-1032 GEO (1993) Review of granular and geotextile filters, GEO Publication No. 1/93, Geotechnical Engineering Office, Civil Engineering Department, Hong Kong Government, 141 Giroud J. P. (1982) Filter criteria for geotextiles In Proceedings of the Second International Conference on Geotextiles, Vol.1, Las Vegas, Nevada, USA, August, 103-108 Giroud J. P. (1988) Review of geotextile filter criteria, Proceedings of the First Indian Geotextiles Conference, Bombay, India, December, 1-6 Giroud, J. P. (1996) Granular filters and geotextile filters, Geofilters ’96 Conference, Montreal, 565-680 Giroud, J. P., Delmas, P. and Artieres, O. (1998) Theoretical basis for the development of a two-layer geotextile filter, Sixth International Conference on Geosynthetics, Atlanta, Vol. 2, 1037 – 1044 Govindaraju, R. S. (1997) Stochastic analysis for movement of fine particles in porous media, Journal of Hydrologic Engineering, Vol. 1, No. 4, Oct., 161-168 Guler, E. and Baran, E. (1998) Effect of cavities between soil and geotextile filter on permeability, 6th International Conference on Geosynthetics, Vol. 2, 1033-1036 Haegeman, W. and Van, I. (1999) Filtration performance testing of geotextile for vacuum consolidation drains, Geosynthetics International, Vol.6, No.1, 41-51 Harney, M. D. and Holtz, R. D. (2001) A Flexible wall gradient ratio test, Geosynthetics Conference 2001, Portland, Oregon, 409-422 Heerten, G. (1982) Dimensioning the filtration properties of geotextiles considering long-term conditions. 2nd international Conference on Geotextile, Las Vegas, Vol. 1, 115-120
190
Hoffman, G. L. and Turgeon, R. (1983) Long Term In-situ Properties of Geotextiles, Research Project 82-83, Pennsylvania Department of Transportation Bureau of Construction Quality Control Materials and Testing Division Honjo, Y. and Veneziano, D. (1989) Improved filter criterion for cohesionless soils, Journal of Geotechnical Engineering, Vol. 115, No.1, ASCE, 75-94 Hwang, G., Hwu, B. L. Hsing, W. and Lu, C. (1998) Manufacturing effects on the hydraulic properties of needlepunched nonwoven geotextiles, Geotextiles and Geomembranes, Elsevier, 16, 355-363 Indraratna, B. and Locke, M. R. (1999) Design methods for granular filters; critical review, Proceedings, Inst.. Civ. Engrs. Geotechnical Engineering, 137, Jul., 137-147 Indraratna, B. and Radampola, S. (2002) Analysis of critical hydraulic gradient for particle movement in filtration, Journal of Geotechnical and Geoenvironmental Engineering, Apr., 347-350 Indraratna, B. and Vafai, F. (1997) Analytical model for particle migration within base soil-filter system, Journal of Geotechnical and Geoenvironmental Engineering, Vol. 123, No. 2, Feb., 100 – 109 Indraratna, B., Vafai, F. and Haque, A. (1998) Experimental and analysis modeling of filtration in granular media, Filtration and Drainage in Geotechnical/Geoenvironmental Engineering, STP 78, ASCE, 89-107 John, N.W.M. (1987) Geotextiles, Blackie and Son Ltd. Glasgow, UK, 347 Juang, C. H. and Holtz, R. D. (1986) A probabilitstic permeability model and the pore size density function, International Journal for Numerical ad Analytical Methods in Geomechanics, Vol. 10, 543-553 Karcz, D.A. and Holtz, R.D. (1988) Development of the IDOH Classification System for Geotextiles, Joint Highway Research Project, Final Report JHRP-88/14, Purdue University, 69 Kellner, L. and Matei, S. (1991) Criteria for geotextile filters in clayey soils, Geotextile and Geomembranes, Elsevier, 9, 79-88 Kenney, T. C., Chahal, R., Chiu, E., Ofoegbu, G. I., Omange, G. N., and Ume, C. A. (1985) Controlling constriction sizes of granular filters, Canadian Geotechnical Journal, 22, 32-43 Kenney, T. C. and Lau, D. (1985) Internal stability of granular filters, Canadian Geotechnical Journal, 22, 215-225
191
Koerner, G.R. (1998). Designing with Geosynthetics, 4th Edition, Prentice-Hall Koerner, G. R., Koerner, R. M. and Wilson-Fahmy, R. F (1996) Field performance of geosynthetic highway drainage systems, Recent Developments in Geotextile Filters and Prefabricated Drainge Geocomposites, ASTM STP 1281, Bhatia, S. K. and Suits, L. D. Eds., American Society for Testing and Materials, 165-181 Kossendey, T. (1999) Long-term performance assessed from compatibility tests, Geotextiles and geomembranes, Elsevier, 17, 281-298 Kossendey, T. and Karam, G. (1998) Large-scale performance tests to evaluate filtration process, 6th International Conference on Geosynthetics, Vol. 2, 1021-1026 Lafleur, J. (1984) Filter testing of broadly graded cohesionless tills, Canadian Geotechnical Journal, 21, 634-643 Lafleur, J. (1998) Particle washout associated with the retention of broadly graded soils by geotextile, 6th International Conference on Geosynthetics, Atlanta, Vol.2, 1001-1004 Lafleur, J. (1999) Selection of geotextiles to filter broadly graded cohesionless soils, Geotextiles and Geomembranes, Elsevier, 17, 299-312 Lafleur, J., Mlynarek, J. and Rollin, A.L. (1990) Filtration of broadly graded cohesionless soils, Journal of Geotechnical Engineering, Vol.115, No.12, 1747-1767 Lafleur, J. and Tetreault, M. (1986) Controlling constriction sizes of granular filters, Discussion, Canadian Geotechnical Journal, 23, 97-98 Laidlaw, W. G. and Wilson, W. G. (1993) A lattice model of foam flow in porous media, A Percolation Approach Transport in Porous Media, Kluwer Academic Publishers, Netherlands,11, 139-159 Lambe, T.W. and Whitman, R.V. (1979) Soil Mechanics, S.I. version, John Wiley and Sons, New York Lawson, C.R. (1986) Geotextile filter criteria for tropical residual soils In 3rd International Conference on Geotextiles, Vienna, Austria, Vol.2, 557-562 Lawson, C.R. (1987) Use of geotextiles for subsurface drainage in South East Asian context. In International Symposium on Geosynthetics, Kyoto, Japan, 145-165 Locke, M., Indraratna, B. and Adikari, G. (2001) Time-dependent particle transport through granular filters, Journal of Geotechnical and Geoenvironmental Engineering, Vol. 127, No.6, 521-529
192
Loebotsjkov, E. A. (1969) The calculation of suffosion properties of noncohesive soils when using the non-suffosion analog (in Russian), International Conference on Hydraulic Research, Brno, Czeckoslovakia, Publication of the Technical University of Brno, Svazek B-5, 135-148 Luettich, S. M. (1993) Geotextile filters: designing for the application, Geotechnical Fabrics Report, Vol. 11, No. 1, 70-78 Luettich, S. M., Giroud, J. P. and Bachus, R. C. (1992) Geotextile filter design guide, Geotextiles and Geomembranes, Elsevier, 11, 355-370 Maier, R. and Laidlaw W. G. (1990) Fluid percolation in bond-site size correlated three-dimensional networks, Transport in Porous Media, Kluwer Academic Publishers, Netherlands, 5, 421-428 Mannsbart, G. and Christopher, B. R. (1997) Long term performance of non-woven geotextile filters in five coastal and bank protection projects, Geotextiles and Geomembranes, Elsevier, 15, 207-221 Merwe, C.J.V.D. and Horak, E. (1989) Evaluation of soil/geotextile compatibility, Proceedings,11th Geofilter, Rio de Janero, Vol.3, Brazil, 1671-1677 Millar, P.J., Ho, K.W. and Turnbull, H.R. (1980) A study of filter fabrics for geotechnical applications in New Zealand, Central Laboratories Report, No. 2-80/5, Ministry of Works and Development Mlynarek, J. (1985) Designing geotextiles as protective filters In 21th IAHR Congress, Melbourne, Australia, 154-158 Mlynarek, J., Lafleur, J. and Lewandowski, J.B. (1990) Field study on long term geotextile filter performance In 4 th International Conference on Geotextiles, Geomembranes and Related Products, The Hague, The Netherlands, Vol. 1, 259-262 Mlynarek, J., Lafleur, J., Rollin, A. and Lombard, G. (1993) Goetextile filter design based on the filtration opening size obtained by hydrodynamic sieving, Filters in Geotechnical and Hydraulic Engineering, Proceedings of the 1st International Conference “Geo-Filters’92”, Karlsruhe, Germany, 26-33 Mlynarek, J., Lewwandowski, J. B., Rollin A. L. and Bolduc, G. (1991) Soil-geotextiles system interaction, Geotextiles and Geomembranes, Elsevier, 10,161-176 Murty A. V. S. R., Mathur, S., Chandra, D. and Rao, K. N. (1994) Selection of geotextile filters wrapped around pipes in pavement edge drains, Geotextiles and Geomembranes, Elsevier,13, 519-529
193
Nishigata, T., Fannin, R. T. and Vaid, Y. P. (2000) Blinding and clogging of a non-woven geotextile, Soils and Foundations, Japanese Geotechnical Society, Vol.40, No. 4, 121-127 Ogink, M.J.M. (1975) Investigations on the hydraulic characteristics of synthetic fabrics, Delf Hydraulics Laboratory, The Netherlands, Publication No. 146 OMT (1992) Guidelines for the design and quality control of geotextiles, Draft Engineering Material Report, Engineering Materials Office, Soils and Aggregate Section, Ontario Ministry of Transportation, Ontario, Downsview, Canada Palmeira, E. M. and Fannin, R.J. (2002) Soil-geotextile compatibility in filtration, Proceedings, 7th International Conference on Geosynthetics, Nice, France, Sep., 853-872 Palmeira, E. M. and Gardoni, M.G. (2000a) Geotextiles in filtration: A state-of-the-art review and remaining challenges. International Symposium on Geosynthetics held as part of GeoEng 2000, M. Bouazza Ed., Melbourne, Australia, 85-110 Palmeira, E. M. and Gardoni, M.G. (2000b) The influence of partial clogging and pressure on the behavior of geotextiles in drainage systems, Geosynthetics International, Vol. 7, No. 4-6, 403-431 Qureshi, S., Kogler, R.M. and Bhatia, S.K. (1990) Long term filtration behavior of nonwoven geotextiles, 4th International Conference on Geotextiles, Geomembranes and Related Products, Vol.1, The Hague, Netherlands, 279-283 Ragutzki, G. (1973) Beitrag zur ermittlung der filterwitksamkeit durch-lassiger kunststoffe. Jahresbericht der Forschungstelle für Insel und Küstenshutz, Band XXV, Nordeney Rankilor, P.R. (1981) Membranes in Ground Engineering, Wiley, 377 Rao, A. R. and Sitaram, N. (1999) Stability and mobility of sand-bed channels affected by seepage, Journal of Irrigation and Drainage Engineering, Vol.125, No. 16, Nov./Dec., 370 – 379 Reddi, L.N. (1997) Particle transport in soils; review of significant process in infrastructure systems, Journal of Infrastructure Systems, Vol.3, No.2, 78-86 Reddi, L. N. and Bonala, V. S. (1997) Analytical solution for fine particle accumulation in soil filters, Journal of Geotechnical and Geoenvironmental Engineering, Vol. 123, No. 12, Dec., 1143 – 1152
194
Reddi, L.N., Ming, X., Hajra, M.G. and Lee, I.M. (2000) Permeability reduction of soil filter due to physical clogging, Journal of Geotechnical and Geoenvironmental Engineering, Vol.126, No.3, Mar., 236-246 Renault, P. (1991) The effect of spatially correlated blocking-up of some bonds or nodes of a network on the percolation threshold, Transport in Porous Media, Kluwer Academic Publishers, Netherlands, 6, 451-468 Richards, E. A., Scott, J. D. and Smith, D. W. (1998) Aquatextiles: use of non-woven geotextiles for filtration in a municipal water treatment plant, 6th International Conference on Geosynthetics, 1045-1048 Rigo, J.M., Lhote, F., Rollin, A.L., Mlynarek, J. and Lombard, G.(1990) Influence of geotextile structure on pore size determination, Geosynthetics: Microstructure and Performance, ASTM, 90-101 Rollin, A. L. and Lombard, G. (1988) Mechanisms affecting long-term filtration behavior of geotextile, Geotextiles and Geomembranes, Elsevier, 7, 119-145 Rollin, A.L., Mlynarek, J., and Bolduc, G.E. (1990) Study of significance of physical and hydraulic properties of geotextiles used as envelopes in subsurface drainage systems In 4 th International Conference on Geotextiles, Geomembranes and Related Products, The Hague, The Netherlands, Vol. 1, 363 Rowe, R.K. (1993) Some challenging application of geotextile in filtration and drainage, Geotextiles in Filtration and Drainage ; Proceeding of the Conference Geofad ’92 ,1-12 Rowe, R.K., Armstrong, M.D. and Cullimore, D.R. (2000) Particle size and clogging of granular media permeated with leachate, Journal of Geotechnical and Geoenvironmental Engineering, ASCE, Vol.126, No.9 , Sep., 775-786 Rowe, R. K. and Smith, J. D. (1991) Geosynthetics- environmental application in waste contaiment, 44th Canadian Geotechnique Conference, Vol.2, No. 75, 1 - 7 Ruckert, H., Uhlig, T., Kruse, G. and Zschernitz, P. (1991) Utilization of clogging in geotextiles for the sealing of earthworks, Geotextiles and Geomembranes, Elsevier,10, 103-113 Schoeber, W. and Teindl, H. (1979) Filter criteria for geotextiles. In 7th European Conference on Soil Mechanics and Foundation Engineering, Brighton, UK, Vol. 2, 123-129 Scott, J.D., Wong, E.P. and Richards, E.A. (1991) Geotextile design for specialized filtration conditions, 44th Canadian Geotechnique Conference, Vol.2, No.77, 1-8
195
Sek, J. P. (1996) Self-diffusion in liquids predicted by a theory of flow through granular media, AIChE Journal, Vol. 42, No. 12, 3333-3339 Sharma, H.D. and Lewis, S.P. (1995) Waste Containment Systems, Waste Stabilization, and Landfills, Johns Wiley & Sons Sherard, J. I. and Dunnigan, L. P. (1988) Critical filters for impervious soils, Journal of Geotechnical Engineering, Vol. 115, No.7, Jul., ASCE, 927-947 Sholji, I. (1987) Expansion of granular filters during backwashing, Journal of Environmental Engineering, Vol.113, No.3, Jun., 516-531 Silvera, A. (1965) An analysis of the problem of washing through in protective filters, Proceedings, 6th International Conference on Soil Mechanics and Foundation Engineering, Montreal, Vol. 2, 551-555 Siva, U. and Bhatia, S.K. (1994) Filtration performance of geotextiles with fine-grained soils, Proceedings, Geosynthetics ’93, NAGS Conference, Vancouver, B.C., Vol. 1, 483-499 Sluys, L.U.D. and Dierickx, W. (1990) Comparative study of different porometry determination methods for geotextiles, Geotextiles and Geomembranes, Elsevier, 9, 183-198 Spearing, M. and Matthews, G. P. (1991) Modeling characteristic properties of sandstones, Transport in Porous Media, Kluwer Academic Publishers, Netherlands, 6, 71-90 Stauffer, D. (1985) Introduction to Percolation Theory, Taylor & Francis, London and Philadelphia, ISBN 0-85066-315-6 Stevenson, D. G. (1996) Flow and filtration through granular media; the effect of grain and particle size dispersion, Water Resource, Vol. 31, No. 2, Elsevier Science Ltd., 310-322 Sweetland, D.B. (1977) The Performance of non woven fabrics as drainage screens in subdrains, MSc. Thesis, University of Strathclyde, Scotland, UK. Taylor, S. W. (1990) Substrate and biomass transport in a porous medium, Water Resource Research, Vol. 26, No.9, Sep., 2181-2194 Terzaghi, K. (1922) Der grundbruch and stauwerken und seine verhutung, Forcheimer-Nummer der Wasserkraft, 17, 445-449
196
Thevanayagam, S., Shentha, T., Mohan, S. and Liang, J. (2002) Undrained fragility of clean sands, silty sands, and sandy silts, Journal of Geotechnical and Geoenvironmental Engineering, Vol. 128, No. 10, Oct., 849-859 Tien, C. and Payatakes, A. C. (1979) Advances in deep bed filtration, AIChE Journal, Vol. 25, No. 5, Sep., 737-749 Tomlinson, S. S. and Vaid, Y. P. (2000) Seepage forces and confining pressure effects on piping erosion, Canadian Geotechnical Journal, 37, 1-13 Truesdail, S. E., Westermann-Clark, G. B. and Shah, D. O. (1998) Apparatus for streaming potential measurements on granular filter media, Journal of Environmental Engineering, Vol. 124, No.12, Dec., 1228-1232 Urashima, D. C. and Vidal, D. (1998) Geotextiles filter design by probabilistic analysis, 6th Internal Conference on Geosynthetics, Vol. 2, 1013-1016 USACE (1977) Plastic filter cloth, Civil Works Construction Guide Specification No. CW-02215, United States Army Corps of Engineers, Office, Chief of Engineers, Washington, DC, USA USBR (1974). Earth Manual, 2nd Ed., US Bureau of Reclamation, US Department of the Interior, 810 USBR (1994). Design Standards, Embankment Dams, No 13, Chapter 5, Protective Filters, US Bureau of Reclamation, US Department of the Interior Vallejo, L. E. (2001) Iterpretation of the limits in shear strength in binary granular mixture, Canadian Geotechincal Journal, 38, 1097-1104 Vandervivere, P. and Baveye, P. (1992) Saturated hydraulic conductivity reduction caused by aerobic bacteria in sand columns, Soil Science Society of America Journal, Vol. 56, Jan./Feb., 1-12 Vigneswaran, S., Chang, J. S. and Janssens, J. G. (1990) Experimental investigation of size distribution of suspended particles in granular bed filtration, Water Resource, Vol. 24, No. 7, 927-930 Watson, P.D.J. and John, N.W.M. (1999) Geotextile filtration design and simulated bridge formation at the soil-geotextile interface, Geotextiles and Geomembranes, Elsevier, 17, 265-280 Wayne, M.H. and Koerner, R.M.(1993) Correlation between long-term flow testing and current geotextile filtration design practice, Geosynthetics ‘93 Conference, NAGS, Vancouver, BC, Canada, Vol. 1, 501-517
197
Williams, N. D. and Abouzakhm, M. A. (1989) Evaluation of geotextile/soil filtration characteristics using the hydraulic conductivity ratio analysis, Geotextiles and Geomembranes, Elsevier, 8, 1 – 26 Wilson-Fahmy, R.F., Koerner, G.R. and Koerner, R.M. (1996) Geotextile filter design critique, Recent Developments in Geotextile Filters and Prefabricated Drainage Geocomposites, ASTM STP 1281, Shobha K. Bhatia and L. David Suits, Eds., American Society for Testing and Materials, 132-164 Witt, K. J. and Brauns, J. (1984) The influence of parameter variation on the reliability of filters, Proceedings of the International Conference on Safety of Dams, 23-28 Wu, J., Gui, S., Stahl, P. and Zhang, R. (1997) Experimental study on the reduction of soil hydraulic conductivity by enhanced biomass growth, Soil Science, Vol. 162, No.10, 741-748 Wukash, R. and Siddiqui, R. (1996) Remediation of Hazardous Effluent Emitted from Beneath Newly Constructed Road Systems and Clogging of Underdrain Systems, Joint Highway Research Project, Final Report FHWA/IN/JHRP-96/13, Purdue University, 196 Xiao, M. and Reddi, L. N. (2000) Comparison of fine particle clogging in soils and geotextile filters, Advances in Transportation and Geoenvironmental Systems Using Geosynthetics, Proceeding Geo-Denver 2000, Denver, ASCE, 176-185 Yanuka, M. (1992) Percolation theory approach to transport phenomena in porous media,Transport in Porous Media, Kluwer Academic Publishers, Netherlands, 7, 265-282 Yao, K-M, Habibian, M. T. and O’Melia, C.R. (1971) Water and waste water filtration: concepts and applications, Environmental Science & Technology, Vol. 5, No. 11, Nov., 1105-1112 Zitscher, F.F. (1974) Recommendations for the use of plastics in soil and hydraulic engineering. Die Bautechnik, Vol. 52, No. 12, 397-402
198
Appendix A
Geotextile Retention Criteria in Published Literature (from Palmeira & Fannin, 2002)
199
200
201
Appendix B
Geotextile Survivability Specifications AASHTO-AGC-ARTBA, Task Force 25 and AASHTO M288
(after Koerner, 1998)
202
How to determine geotextile properties required for survivability: Step A: In table 2.22 next page, enter level of ground pressure applied to geotextile through construction equipment (e.g. compaction equipment) and level of subgrade preparation prior to geotextile installation. Obtain from the table the required level of survivability. Step B: Find the corresponding survivability class: Very high to high survivability level Class 1 High to moderate survivability level Class 2 Moderate to low level of survivability Class 3 Step C: In the following page, Table 2.2a, enter the survivability class and find the corresponding minimal requirements for grab, tear, puncture and burst strength.