Classification I S.Maehle, Gullfaks - prod. Bergen Co-worken Bodil Fjareide, LAB PVT analysis of Bottom hole sample from well 34/10 - 7: STATOIL EXPLORATION & PRODUCTION LABORATORY by Otto Rogne LAB 83.61 / Prepared 9 9.03.21 A
Transcript
Classification
I S.Maehle, Gullfaks - prod. Bergen
Co-worken
Bodil Fjareide, LAB
PVT analysis of Bottom hole sample from
well 34/10 - 7:
STATOIL
EXPLORATION & PRODUCTION LABORATORY
by Otto Rogne
LAB 83.61 /
Prepared 9
9.03.21 A
CONTENTS
Page
INTRODUCTION
SUMMARY
SAMPLING CONDITIONS
Bubble point check
Fig 1 Bubble point at amb~ent temp
FLASH OF RESERVOIR FLUID TO STOCK TANK
Extended moiecuiar composition
CONSTANT MASS EXPANSION
Fig 2 Re l at i ve vo i ume
DIFFERENTIAL DEPLETION
Molecular composition of liberated gas
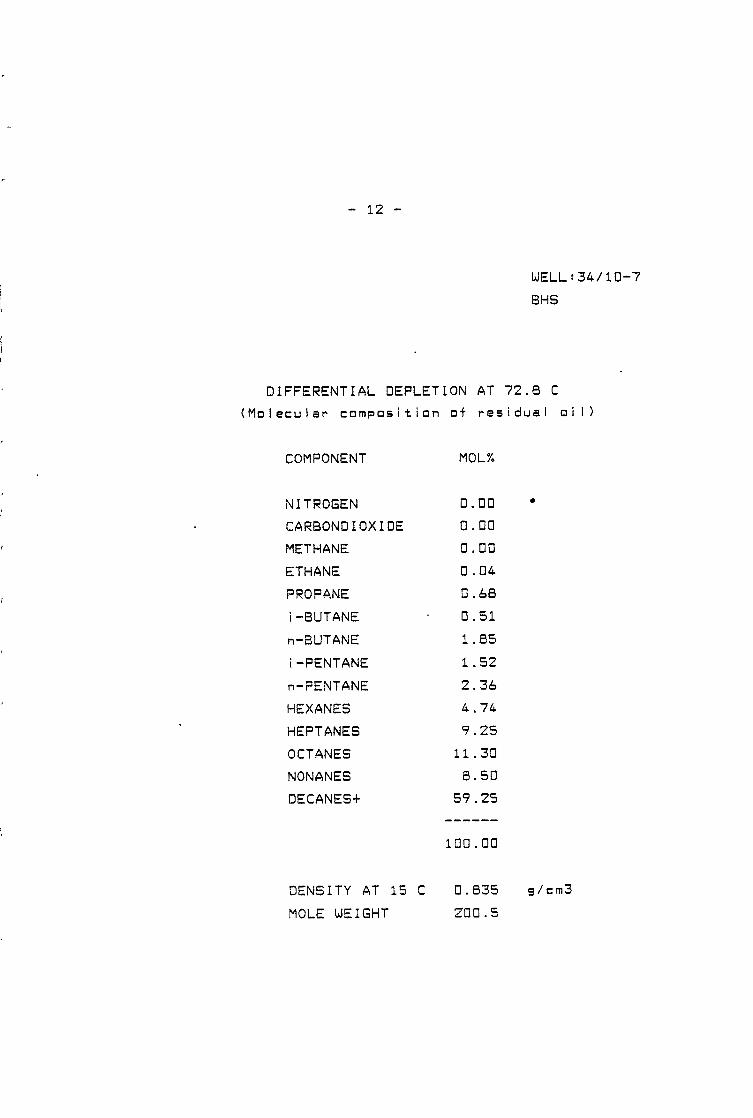
Molecular composition of residual oil
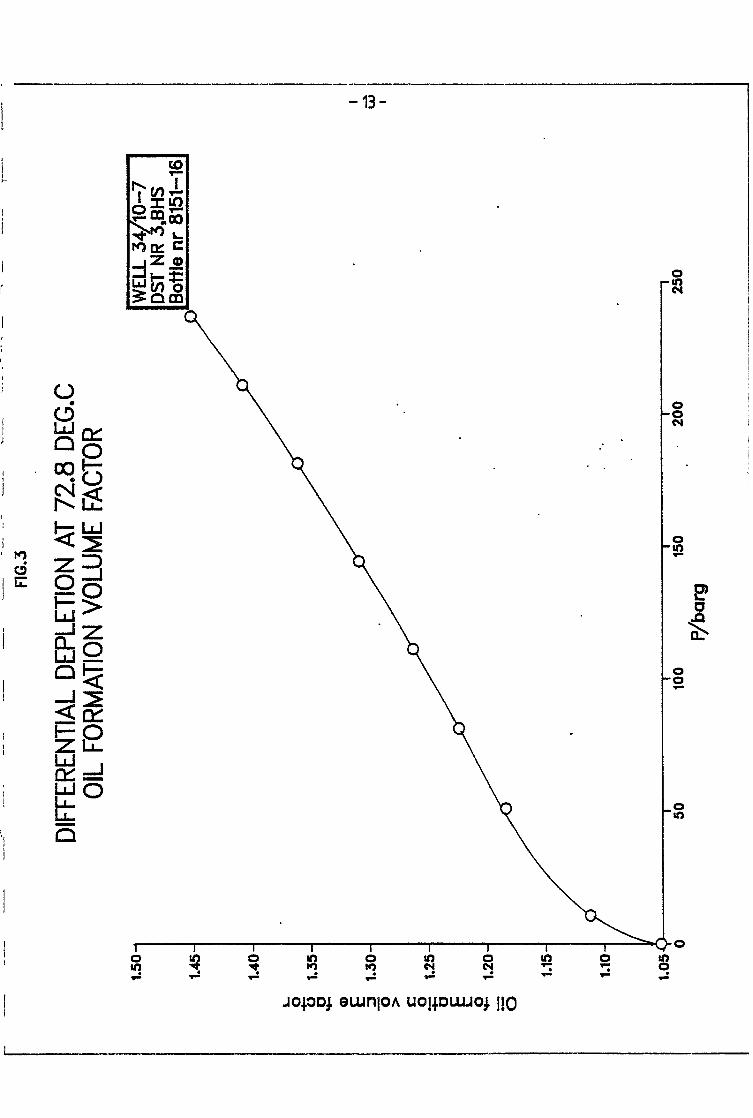
Fig 3 Formation volume factor Bod
Fig 4 Solution gas Rs
Fig 5 Gas formation volume factor Bg
Fig 6 Reservoir oil density
Fig 7 Compressibility factor Z
VISCOSITY OF RESERVOIR FLUID
Fig 6 Viscos~ty
SEPARATOR TEST
INTRODUCTION
The present report gives the experimental results of a PVT- analysis carried out on a bottom hole sample from test no 3 on well 3440-7, obtained by Flopetrol 08.07.83. A summary of the results are on page 2. Sampling details are on page 3.
The quality of the sample was checked by measuring the bubble point a t ambient laboratory conditions and found to be 207 barg as compared to 203 barg measured in the field (page 4).
A portion of the sample was charged to a high pressure cell a t reservoir ' . temperature ( 72.8 C ) where the bubble point, relative volumes and compressibility were determined. These results are on page 8.
To determine the reservoir fluid composition a portion of the fluid in the ceil was flashed through a laboratory separator a t 15 C and atmospheric pressure. The liberated gas and oil were collected, measured and analysed by gaschromatography through C9 with decanes plus fraction. The molecular composition of the liberated oil and gas, and the corresponding calculated composition .of the reservoir fluid, are given on page 6. The C6 to C9 groups consist of all components eluted after the previous n-alkane up to and including the next higher homologue. The molecular weights for these groups are calculated from the molecular composition. The molecular weight and density of the plus fraction is obtained from a TBP distillation of the stock tank oil as is also the extended composition beyond C9 given on page 7. The complete TBP distillation t o C30+ is reported seperately.
The remaining sample in the cell was finally differentially liberated through a series of pressure steps with the volumetric results shown on page 10. The composition of the liberated gases and residual oil are on page 11 and 12 respectively. The gas viscosity was calculated from the gas density according to Lee a t al:J.Pet.Techn.,997(1966). A separate portion of the sample was charged to a high pressure rolling ball viscosimeter for measuring the oil viscosity. The results are on page 18.
Separator tests were simuiated with an SRK equation of state model.The results are on page 20. Since separator tests were not requested, a temperature equal to that of the test separator in DST nr 3 were choosen.
SUMMARY
Bubble point pressure
Density at bubble point
Viscosity at bubble point
Compressibility at bubble point
Flash formation volume factor of
bubble point oil, one-stage flash
Differential formation volume factor
of bubble point oil
Gas solubility of bubble point oil
( i ) One-stage flash
C i i ) Differential lib at 7 2 . 8 C
Barg at 7 2 . 8 C
g/cm3
CP
10-4 I/Bar
m3/Srn3 Resid o i
Sm3/Sm3 ST0
Sm3/Sm3 Resid oi
Standard condition gas: 1 atm (1.013 bar) and 15 C
Standard condition oil: atmospheric pressure and 15 C
* )
SAMPLING CONDITIONS
FIELD WELL
TEST
PERFORATION
DATE
SAMPLE
DEPTH OF SAMPLER
SHIPPING BOTTLE
BOTTOM HOLE PRESSURE
BOTTOM HOLE TEMPERATURE
Gul lfaks 31/10-7
(DST 3 )
1807 - 1821 m RKB 08.07.83
BHS S/N 44
1774 m RKB
8151-16
313 bar
72.8 C
Well flowing on 8/64" fixed choke at 47 m 3 oil per day


![itobiad], 2020, 9 (5): 3440/3455](https://static.documents.pub/doc/80x56/61f57bf33898cd438b470e68/itobiad-2020-9-5-34403455.jpg)


