32


Page 1 of 30
STANDARD DOCUMENT COVER SHEET FOR SEC FILINGS
All documents should be submitted under a cover page which clearly identifies the company and
the specific document form as follows:
SEC Number PW-121 File Number
BANK OF THE PHILIPPINE ISLANDS BPI BUILDING, 6768 AYALA AVE. CORNER PASEO DE ROXAS
MAKATI CITY, METRO MANILA (632) 816-9705
FISCAL YEAR ENDING DECEMBER 31 (indicate if anything above is new and the date it was changed)
SEC FORM 17–Q QUARTERLY REPORT AMENDMENT DESIGNATION (if applicable)
PERIOD-ENDED SEPTEMBER 30, 2018 (if a report, financial statement, GIS, or related amendment or show-cause filing)
NONE EACH ACTIVE SECONDARY LICENSE TYPE AND FILE NUMBER
(state “NONE” if that is the case)

Page 2 of 30 Page 2 of 21
SECURITIES AND EXCHANGE COMMISSION
SEC FORM 17-Q QUARTERLY REPORT PURSUANT TO SECTION 17 OF THE SECURITIES REGULATION CODE AND SRC RULE 17 (2) (b) THEREUNDER
1. For the quarterly period ended September 30, 2018 2. Commission identification number PW-121 3. BIR Tax identification No. - TIN: 000-438-366-000 4. BANK OF THE PHILIPPINE ISLANDS Exact name of registrant as specified in its chart 5. Philippines Province, country or other jurisdiction of incorporation 6. Industry Classification Code: (SEC Use Only) 7. BANK OF THE PHILIPPINE ISLANDS BUILDING 6768 Ayala Avenue Corner Paseo de Roxas, Barangay San Lorenzo Makati City ZIP Code 1226 Address of principal office Postal Code 8. (632) 816-9705 Registrant’s telephone number, including area code 9. Not Applicable Former name, former address, and former fiscal year, if changed since last report 10. Securities registered pursuant to Sections 8 and 12 of the Code Title of each class Number of shares of common stock outstanding and amount of debt outstanding Common 4,502,449,501 11. Are any or all of the securities listed on the Philippine Stock Exchange? Yes [x] No [ ]
If yes, state the name of such stock exchange and the classes of securities listed therein: Philippine Stock Exchange Common

Page 3 of 30
12. Indicate by check mark whether the registrant: (a) Has filed all reports required to be filed by Section 17 of the Code and SRC Rule 17 thereunder or Sections 11 of the RSA and RSA Rule 11(a)-1 thereunder, and Sections 26 and 141 of the Corporation Code of the Philippines during the preceding 12 months (or for such shorter period the registrant was required to file such reports) Yes [8] No [ ] (b) Has been subject to such filing requirements for the last 90 days Yes [8] No [ ]

Page 4 of 30
UNAUDITED AUDITED
SEPTEMBER 30, 2018 DECEMBER 31, 2017
Cash and Other Cash Items 30,904,896 35,132,451
Due from Bangko Sentral ng Pilipinas 221,040,618 255,948,081
Due from Other Banks 12,476,531 14,406,141
Interbank Loans Receivable and Securities
Purchased under Agreements to Resell 20,176,653 18,585,764
Financial Assets at Fair Value through Profit or Loss
Derivative Financial Assets 4,915,882 4,980,742
Trading Securities 30,545,130 5,332,082
Financial Assets at Fair Value through OCI 21,687,562 23,312,583
Financial Assets at Amortized Cost 282,878,873 277,471,665
Loans and Advances, net 1,267,521,501 1,202,337,527
Assets Held for Sale, net 3,441,004 3,578,067
Bank Premises, Furniture, Fixtures and Equipment, net 16,198,975 15,056,439
Investment Properties, net 130,014 134,562
Investments in Subsidiaries and Associates, net 6,102,617 6,386,493
Assets Attributable to Insurance Operations 15,121,045 17,405,736
Deferred Income Tax Assets, net 8,514,104 8,091,454
Other Resources, net 18,965,276 15,744,914 -
TOTAL RESOURCES 1,960,620,680 1,903,904,703
Deposit Liabilities
Demand 256,117,255 252,238,118
Savings 885,557,857 860,611,696
Time 400,797,202 449,350,302
Sub-total 1,542,472,314 1,562,200,116
Derivative Financial Liabilities 4,713,543 4,788,711
Other Borrowed Funds 100,996,570 83,516,771
Due to Bangko Sentral ng Pilipinas and Other Banks 1,201,291 1,217,691
Manager's Checks and Demand Drafts Outstanding 6,977,765 7,022,059
Accrued Taxes, Interest and Other Expenses 8,678,324 7,116,647
Liabilities Attributable to Insurance Operations 12,725,329 14,512,712
Deferred Credits and Other Liabilities 34,019,283 39,978,950
TOTAL LIABILITIES 1,711,784,420 1,720,353,657
CAPITAL FUNDS ATTRIBUTABLE TO THE EQUITY HOLDERS OF BPI
Share Capital 44,953,015 39,336,269
Share Premium 74,124,289 29,770,688
Reserves 217,247 254,371
Surplus 128,959,670 116,415,390
Accumulated Other Comprehensive Income/ (Loss) (2,323,595) (5,087,969)
245,930,625 180,688,750 - -
NON-CONTROLLING INTERESTS 2,905,635 2,862,296
TOTAL CAPITAL FUNDS 248,836,260 183,551,046
TOTAL LIABILITIES AND CAPITAL FUNDS 1,960,620,680 1,903,904,703
RESOURCES
LIABILITIES AND CAPITAL FUNDS
BANK OF THE PHILIPPINE ISLANDS
CONSOLIDATED STATEMENT OF CONDITION
SEPTEMBER 30, 2018 AND DECEMBER 31, 2017
(in Thousands of Pesos)

Page 5 of 30
BANK OF THE PHILIPPINE ISLANDS
CONSOLIDATED STATEMENTS OF INCOME
For the Quarter Ended September 30, 2018 and 2017
(In Thousands of Pesos)
2018 2017
INTEREST INCOME
On loans and advances 18,427,407 14,146,683
On FA at amortized cost 2,291,836 2,192,304
On FA at FV through OCI 60,486 56,741
On deposits with BSP and other banks 323,766 564,704
On FA at FV through profit or loss 67,660 42,467
Gross Receipts Tax (678,683) (555,428)
20,492,472 16,447,472
INTEREST EXPENSE
On Deposits 5,216,789 4,190,782
On Bills Payable and other borrowings 611,093 271,353
5,827,882 4,462,135
NET INTEREST INCOME 14,664,590 11,985,337
IMPAIRMENT LOSSES 930,964 1,148,270
NET INTEREST INCOME AFTER IMPAIRMENT
LOSSES 13,733,626 10,837,066
OTHER INCOME
Fees and commissions 1,963,702 2,080,564
Income from foreign exchange trading 522,630 586,789
Trading gain (loss) on securities 75,081 (11,880)
Income attributable to insurance operations 257,640 488,742
Other operating income 2,518,159 2,941,916
Gross Receipts Tax (335,539) (369,088)
5,001,673 5,717,042
OTHER EXPENSES
Compensation and fringe benefits 3,839,977 3,467,311
Occupancy and equipment-related expenses 3,401,774 2,903,636
Other operating expenses 3,622,617 3,237,521
10,864,368 9,608,468
INCOME BEFORE INCOME TAX 7,870,931 6,945,640
PROVISION FOR INCOME TAX
Current 1,967,104 1,746,347
Deferred (141,472) (253,863)
1,825,631 1,492,485
NET INCOME FOR THE QUARTER 6,045,299 5,453,155
Attributable to:
Equity holders of BPI 5,983,682 5,356,260
Non-controlling interest 61,617 96,894
6,045,299 5,453,155

Page 6 of 30
BANK OF THE PHILIPPINE ISLANDS
CONSOLIDATED STATEMENT OF COMPREHENSIVE INCOME
For the Quarter Ended September 30, 2018 and 2017
(In Thousands of Pesos)
2018 2017
NET INCOME BEFORE MINORITY INTEREST 6,045,299 5,453,155
Other Comprehensive Income:
Items that may be reclassified subsequently to profit or loss
Net change, in fair value reserve on FVOCI securities,
net of tax effect (40,440) 109,147
Fair value reserve on investments of insurance subsidiaries,
net of tax effect (64,564) 61,605
Share in other comprehensive income of associates (305,101) (30,332)
Currency translation differences (60,897) 61,293
Items that will not be reclassified to profit or loss
Actuarial gains (losses) on defined benefit
plan, net of tax effect 130,666 0
Share in other comprehensive income gain (loss) of associates 238,641 (43,237)
Total Other Comprehensive Income (Loss), net of tax effect (101,695) 158,477
Total Comprehensive Income for the Year 5,943,604 5,611,632
Attributable to:
Equity holders of BPI 5,929,452 5,509,272
Non-Controlling Interest 14,152 102,359
5,943,604 5,611,632

Page 7 of 30

Page 8 of 30
BANK OF THE PHILIPPINE ISLANDS
CONSOLIDATED STATEMENT OF COMPREHENSIVE INCOME
For the Nine Months Ended September 30, 2018 and 2017
(In Thousands of Pesos)
Unaudited Unaudited
2018 2017
NET INCOME BEFORE MINORITY INTEREST 17,165,351 17,300,075
Other Comprehensive Income
Items that may be reclassified subsequently to profit or loss
Net change, in fair value reserve on FVOCI securities,
net of tax effect (830,563) 594,928
Fair value reserve on investments of insurance subsidiaries,
net of tax effect (434,404) 244,368
Share in other comprehensive income of associates (1,313,883) (85,533)
Currency translation differences 113,806 171,518
Items that will not be reclassified to profit or loss
Actuarial gains (losses) on defined benefit
plan, net of tax effect 125,726 (7,832)
Share in other comprehensive income gain (loss) of associates 524,987 (663,061)
Total Other Comprehensive Income (Loss), net of tax effect (1,814,331) 254,389 0 0
Total Comprehensive Income for the Year 15,351,020 17,554,463
Attributable to:
Equity holders of BPI 15,299,787 17,271,738
Non-Controlling Interest 51,233 282,725
15,351,020 17,554,463

Page 9 of 30 Page 9 of 21

Page 10 of 30 Page 10 of 21
Page 11 of 30

Page 12 of 30
BANK OF THE PHILIPPINE ISLANDS
Financial Indicators
As at September 30, 2018 and 2017
2018 2017
a) Liquidity Ratio * 53.2% 55.9%
b) Debt to Equity Ratio ** 41.1% 26.9%
c) Asset to Equity Ratio 797.2% 1005.2%
d) Interest Rate Coverage Ratio *** 252.5% 290.9%
e) Net Interest Margin on Average Earning Assets 3.1% 2.9%
f) Return on Average Equity 10.4% 13.1%
g) Return on Average Assets 1.2% 1.3%
h) Cost to Income Ratio 56.4% 52.5%
i) Cost to Assets Ratio 2.3% 2.2%
j) Capital to Assets Ratio 12.5% 10.0%
* Liquid Assets over Total Deposits
** Bills Payable and Unsecured Subordinated Debt over Total Equity
*** Net Income Before Income Tax add back Interest Expense and Depreciation and Amortization over Interest Expense

Page 13 of 30
NOTES TO FINANCIAL STATEMENTS SEPTEMBER 30, 2018
SEC REQUIREMENT DISCLOSURE
Disclosure that the issuer’s interim financial report is in compliance with generally accepted accounting principles
The Bank’s interim financial statements have been prepared in accordance with the Phil. Financial Reporting Standards (PFRS) which includes applicable PFRS, PAS (Phil. Accounting Standards) and interpretations approved by the FRSC (Financial Reporting Standards Council).
The following information, as a minimum, should be disclosed in the notes to financial statements, if material and if not disclosed elsewhere in the interim financial report:
A statement that the same accounting policies and methods of computation are followed in the interim financial statements as compared with the most recent annual financial statements or, if those policies or methods have been changed, a description of the nature and effect of the change.
The Bank’s interim financial statements have been prepared consistent with its most recent annual financial statements as of December 31, 2017 which was in accordance with the PFRS adopted by the SEC.
Explanatory comments about the seasonality or cyclicality of interim operations
Nothing to report
The nature and amount of items affecting assets, liabilities, equity, net income, or cash flows that are unusual because of their nature, size, or incidents
Nothing to report
The nature and amount of changes in estimates of amounts reported in prior interim periods of the current financial year or changes in estimates of amounts reported in prior financial years, if those changes have a material effect in the current interim period.
The Bank has adopted PFRS 9 effective January 2018 using Classification and Measurement business models and Expected Credit Loss models developed for its various products. An independent team is currently conducting validation of the ECL developed models. Full Impact of the PFRS 9 will be finalized once the validation is completed.

Page 14 of 30
NOTES TO FINANCIAL STATEMENTS SEPTEMBER 30, 2018
SEC REQUIREMENT DISCLOSURE
Issuances, repurchases, and repayments of debt and equity securities
On April 25, 2018, the Bank completed its P50 billion stock rights offering (“SRO”), issuing 558,659,210 new common shares (ratio of 1:7.0594 common shares as of record date April 6, 2018) at P89.50 per share. Shares were listed on the Philippine Stock Exchange on May 4, 2018.
On June 21, 2018, the Bank established its Medium Term Note Programme (“programme”) in the aggregate amount of up to US$ 2 billion, or its equivalent in other currencies. The maiden drawdown from the programme was a US$ 600 million five-year senior unsecured fixed rate S note issuance with a coupon rate of 4.25%. The bond was listed on the Singapore Stock Exchange with a Baa2 rating assigned by Moody’s Investor Service.
On September 19, 2018, the Board of Directors approved the establishment of a P50 billion Peso Bond and Commercial paper Program.
Dividends paid (aggregate per share) separately for ordinary shares and other shares
On January 19, 2018, total cash dividends paid to Common Stockholders of record as December 28, 2017 amounted to P3.5 billion.
On June 21, 2018, the Board declared a regular cash dividend of P0.90 per share on the total outstanding Common shares of the capital stock of BPI, payable to all Common stockholders of record as of July 4, 2018 and payable/distributable on July 25, 2018. Total dividends declared amounted to P4.1 billion.
Segment revenue and segment result for business segments or geographical segments, whichever is the issuer’s primary basis of segment reporting. (This shall be provided only if the issuer is required to disclose segment information in its annual financial statements).
Attached

Page 15 of 30
NOTES TO FINANCIAL STATEMENTS SEPTEMBER 30, 2018
SEC REQUIREMENT DISCLOSURE
Material events subsequent to the end of the interim period that have not been reflected in the financial statements for the interim period
Nothing to report
The effect of changes in the composition of the issuer during the interim period, including business combinations, acquisitions or disposal of subsidiaries and long-term investments, restructurings, and discontinuing operations.
Nothing to report
Changes in contingent liabilities or contingent assets since the last annual balance sheet date
Changes in contingent liabilities and contingent assets are in the normal course of business and are not anticipated to cause any material losses from those commitments/contingent liabilities.
Existence of material contingencies and any other events or transactions that are material to an understanding of the current interim period.
Nothing to report
Assess the financial risk exposures of the company and its subsidiaries particularly on currency, interest, credit, market and liquidity risks. If any change thereof would materially affect the financial condition and results of operation of the company, provide a discussion in the report on the qualitative and quantitative impact of such risks and include a description of any enhancement in the company’s risk management policies to address the same;
The BPI Group monitors and measures financial risks according to three major classifications: credit, market and liquidity, and operational/IT risks. The Bank is exposed to these financial risks primarily through lending activities, trading and investment in bonds, currencies, financial derivatives and structured investment products, and engaging in operating activities, infrastructure and technology to support the Bank’s day-to-day business. The risks associated with these activities are closely monitored through the various key risk indicators (KRIs) and metrics, risk appetite and limits, and management triggers defined and set by the Board through its Risk Management Committee (RMC). The Bank’s Risk Management Office (RMO), led by the BPI Group Chief Risk Officer, supports the RMC in identifying, measuring, controlling, and reporting the Bank’s financial and non-financial risks at the Management and

Page 16 of 30
NOTES TO FINANCIAL STATEMENTS SEPTEMBER 30, 2018
SEC REQUIREMENT DISCLOSURE
business line levels. BPI has since maintained its disciplined risk appetite by establishing and implementing prudent risk management policies and standards, concentrating on sovereign-issued and investment-grade securities, and by ensuring that controls are generally in place and working effectively, thus, exposing the Bank and its key subsidiaries to manageable credit, market, liquidity, and operational/IT risks which are within the RMC approved risk-appetite (BPI subsidiary Board-level RMCs, in the case of key BPI subsidiaries). Dedicated and skilled risk managers, including business risk and subsidiary risk officers, fully support the Bank’s three lines-of-defense (3LoD) risk organization.
The persistent challenges observed in the global and local financial markets have resulted to more active risk management strategies in the Bank. Sensitivity analyses, forward-looking simulations and stress testing, daily risk monitoring and escalation procedures, regular risk MIS reporting and in-depth discussions involving Senior Management and the Board of Directors are measures to strengthen the effectiveness of the Bank’s enterprise risk management framework. Moreover, the levels of risk exposures and limits are continuously reviewed to reflect the Board’s overall risk appetite and strategy. The Bank closely monitors the risk exposures of both trading and non-trading portfolios. Assets in both on- and off-balance sheet trading portfolios are marked-to-market and the resulting gains and losses are recognized through profit or loss. Furthermore, starting January 2018, the Bank adopted the new accounting classification and measurement under PFRS 9 guidelines. The Bank also started

Page 17 of 30
NOTES TO FINANCIAL STATEMENTS SEPTEMBER 30, 2018
SEC REQUIREMENT DISCLOSURE
recognizing credit losses upon initial recognition of the asset through the Expected Credit Loss (ECL) model.
Market risk exposures are measured using the historical simulation value-at-risk model complemented by several risk metrics such as Stop Loss and DV01. As of the third quarter of 2018, the Bank’s Value-at-Risk (VaR) is well within the RMC-approved limit.
The Bank conducts regular price stress tests that measure the potential impact of the adverse movements in interest rates on the Bank’s trading and banking book and the corresponding impact on the Capital Adequacy Ratio. The results of the third quarter 2018 price stress test on both the trading and banking book revealed that the Bank’s post-shock CAR is well above the minimum regulatory requirement given the adverse movements in risk factors.
Interest rate risk exposure arising from the core banking activities is measured by (a) earnings-at-risk (EaR), or the potential deterioration in net interest income over the next 12 months due to adverse movements in interest rates, and (b) balance sheet value-at-risk (BSVaR), or the impact on the economic value of the future cash flows in the banking book due to changes in interest rates. As of the third quarter of 2018, BPI Group’s BSVaR and EaR levels are well below the RMC-approved limits.
The Bank’s liquidity profile is measured and monitored through the minimum cumulative liquidity gap (MCLG) internal metric and the regulatory metric, liquidity coverage ratio (LCR). MCLG measures the smallest net cumulative

Page 18 of 30
NOTES TO FINANCIAL STATEMENTS SEPTEMBER 30, 2018
SEC REQUIREMENT DISCLOSURE
cash inflow (if positively gapped) or the largest net cumulative cash outflow (if negatively gapped) over the next three months. LCR determines the short-term resilience of the Bank’s liquidity risk profile, requiring financial institutions to hold adequate level of high-quality liquid assets to cover net cash outflows in the next 30 days. BPI, on a consolidated basis, should maintain adequate liquidity to provide sufficient buffer for critical liquidity situations. As of the third quarter of 2018, BPI Group’s MCLG is well above the RMC-approved floors while total LCR exceeds the prescribed minimum ratio set by the BSP. The Bank also conducts liquidity stress tests which have consistently revealed ample liquidity to meet its financial obligations under both name-specific and system-wide crisis scenarios.
The Bank is continuously improving its risk models and systems through upgrades and improvements in model assumptions and regularly conducts back-testing to assess the accuracy and effectiveness of its models and metrics.
On the Bank’s management of operational and IT risks, for the third quarter of 2018, the Bank has maintained estimated operational and IT losses related to the Bank’s operating activities to less than 1% of gross income. Such minimal losses are within the Senior Management and Board/RMC's conservative and prudent risk appetite, and are generally attributed as inherent risks in executing the Bank's day-to-day business operations. The Bank is conscientiously aware of new and emerging industry-wide risks, and duly consider these in regular risk

Page 19 of 30
NOTES TO FINANCIAL STATEMENTS SEPTEMBER 30, 2018
SEC REQUIREMENT DISCLOSURE
assessments and in updating the Bank’s risk strategies.
The Bank, to the best of its knowledge, deems that there are no anticipated and significant changes in risk exposures that shall materially affect the Bank's financial condition and results of operations.
The significant judgments made in classifying a particular financial instrument in the fair value hierarchy.
The assumptions/judgments made in the Bank’s interim financial statements are consistent with the most recent annual financial statements as of December 31, 2017.
A comparison of the fair values as of date of the recent interim financial report and as of date of the preceding interim period, and the amount of gain/loss recognized for each of the said periods
In accordance with PFRS 9, Financial Assets at Fair Value through Profit and Loss (FVPL) are marked to market as profit and loss. As such, these are reflected in Other Income – Trading gain (loss) on securities including realized gains (losses) from opportunistic sell down of inventory.
Financial Assets at Fair Value through Other Comprehensive Income (FVOCI) are marked to market against capital funds and reflected as Accumulated Other Comprehensive Income (Loss). The movements of these accounts are recognized as Other Comprehensive Income – Net Change in Fair Value Reserve for the banking books and Fair Value Reserve on investments of insurance subsidiaries.
The table below summarizes the carrying amount and fair value of Financial Assets at Amortized Cost, net:
Carrying
Amount Fair Value
Sep 30, 2018 (unaudited)
282,879 252,054
Dec 31, 2017 (audited)
277,472 268,301

Page 20 of 30

Page 21 of 30

Page 22 of 30
Item 2. Management Discussion and Analysis of Financial Condition and Results of Operations Financial Condition as of September 30, 2018 versus as of December 31, 2017 Total resources increased P56.716 million to P1.96 trillion. While this increase was minimal at 3.0%, it was impacted by the following movements:
Loans and advances, net at P1.27 trillion, increased P65.18 billion or 5.4% due to loan portfolio expansion on corporate, real estate and credit cards;
Financial assets at fair value through profit or loss trading securities at P30.55 billion increased P25.21 billion or 472.9% due to increased holdings of securities intended for trading;
Other resources, net at P18.97 billion, increased P3.22 billion or 20.5% on account of higher miscellaneous assets.
Interbank loans receivable and securities purchased under agreements to resell at P20.18 increased P1.59 billion or 8.6% due to higher volume of placement of Reserve Repurchase Agreements (RRP) and interbank term loans;
Bank premises, furniture, fixtures and equipment, net at P16.20 billion increased P1.14 billion or 7.6% due to higher depreciation on building and equipment;
Deferred income tax assets, net at P8.51 billion increased P422.65 million or 5.2% on account of the impairment losses setup for the period.
Above increases were partially tempered by the following:
Due from Banko Sentral ng Pilipinas at P221.04 billion, decreased P34.91 billion or 13.6% due to cut in reserve requirements by the BSP by 2% for 2018 year-to-date;
Cash and other cash items at P30.90 billion, decreased P4.23 billion or 12.0%, on account of lower cash requirement for the period as compared to year-end 2017;
Assets attributable to insurance operations at P15.12 billion decreased P2.28 billion or 13.1% due to the Bank’s non-life insurance subsidiary lower balances receivables and lower holdings of securities and property investments of insurance businesses;
Due from other banks at P12.48 billion, decreased P1.93 billion or 13.4%, due to lower working balances and placements maintained with correspondent banks;
Financial assets at fair value through OCI at P21.69 billion, decreased P1.63 billion or 7.0% due to decrease in position taking in various holdings doubled by the impact of securities reclassification as the Bank transitioned to PFRS 9.
Total liabilities decreased P8.57 billion, or 0.5% impacted by the following downward movements:
Total deposits at P1.54 trillion, lower by P19.73 billion or 1.3%, as the Bank paid down high cost time deposits, which ended at P400.80 billion for the period, down P48.55 billion or 10.8%;

Page 23 of 30
Demand and savings deposits both increased to P256.12 billion and P885.56 billion, up P3.88 billion or 1.5%, and P24.95 billion or 2.9%, respectively;
Deferred credits and other liabilities at P34.02 billion, down by P5.96 billion or 14.9%, due to the decline in bills purchased contra account and miscellaneous liabilities;
Liabilities attributable to insurance operations at P12.73 billion, down by P1.79 billion or 12.3% due to decline in reserves and other balances of life and non-life subsidiaries.
These decreases in liabilities were partly tempered by the following:
Other borrowed funds at P101.00 billion, increased by P17.48 billion or 20.9%, due to higher borrowings as the bank successfully raised US$600 million 5-year Senior Unsecured Fixed Rate S Notes under its US$2 billion Medium Term Note Programme launched in the third quarter of 2018.
Accrued taxes, interest and other expenses at P8.68 increased by P1.57 billion or 21.9% due to higher accrual of taxes and operating expenses.
Total Capital at P245.93 billion, increased P65.24 billion or 36.1%, from year-end 2017 because of the P50.00 billion increase in share premium and share capital owing to the May 2018 SRO. Surplus increased by P12.54 billion as a result of accumulated profits net of cash dividend payments.
Accumulated other comprehensive loss at P2.32 billion, decreased P2.76 billion or 54.3% on account of reclassification of certain FA at FV through OCI to FA at amortized costs;
Reserves at P217.25 million, decreased P37.12 million or 14.6%, on appropriation of reserve for general loan loss provision.
RESULTS OF OPERATIONS For the Quarters ended September 30, 2018 and 2017 Net income for the third quarter of 2018 was P5.98 billion, up P627.42 million or 11.7%, from the profit earned in the third quarter of 2017. Operational spending dragged down the bottom line as other expenses grew by P1.26 billion or 13.1% for the period. This was despite the P1.96 billion or 11.1%, growth in total revenues and P217.31 million or 18.9% drop in impairment losses. Net interest income at P14.66 billion, increased P2.68 billion, or 22.4% on account of the P175.24 billion expansion in average asset base and a 32-basis point increase in spreads. Interest income stood at P20.49 billion, up P4.05 billion, or 24.6%, and this was affected by the following movements:
Increase in interest income on loans and advances at P18.43 billion, up P4.28 billion or 30.3%, largely due to expansion in the average volume and higher yield;
Increase interest income on FA at FV through profit and loss at P67.66 billion, up P25.19 million, or 59.3%, due to significant increase in average volume despite drop in yield;

Page 24 of 30
Increase in interest income on FA at FV through OCI at P60.49 million, up P3.75 million or 6.6%, due to higher average volume and yield;
Decrease in interest income on deposits with BSP and other banks at P323.77 million, down P240.94 million or 42.7%, on lower average volume, partly offset by higher yield;
Increase in gross receipts tax at P678.68 million, up P123.26 million or 22.2%, as a result of higher interest income.
Interest expense at P5.83 billion, increased P1.37 billion, or 30.6%, largely driven by the increase in interest expense on deposits at P5.22 billion, up P1.03 billion or 24.5%, due to higher documentary stamps tax (DST) on deposits. Bills payable and other borrowings also contributed to the increase at P611.09 million, up P339.74 million or 125.2%, on higher average volume and interest cost. Other income at P5.00 billion was P715.37 million, or 12.5% lower than the P5.72 billion earned in the third quarter of 2017:
Other operating income at P2.52 billion, decreased P423.76 million or 14.4%, driven by lower trust fees and credit card income;
Income attributable to insurance operations at P257.64 million, decreased P231.10 million or 47.3%, largely due to the lower income contribution of the Bank’s insurance subsidiaries;
Fees and commissions at P1.96 billion, decreased P116.86 million or 5.6%, on lower income from bank commission and underwriting fees;
Income in from foreign exchange trading at P522.63 million, decreased P64.16 million or 10.9%, due to market volatility;
Trading gain (loss) on securities at P75.08 million, gained P86.96 billion from last year’s level of (P11.88 billion), due to profit taking on certain positions;
Gross receipts tax at P335.54 million, ended lower by P33.55 million or 9.1%, in spite of the overall decrease in other income impacted by the increase in higher tax-based fees and commission.
Other expenses at P10.86 billion, grew P1.26 billion or 13.1% driven by the following:
Compensation and Fringe Benefits at P3.84 billion, up P372.67 million or 10.7% on account of manpower expansion.
Other operating expenses at P3.62 billion, increased P385.10 million or 11.9%, largely due to expenses related to regulatory, consumables, and other miscellaneous transaction;
Occupancy and equipment-related expenses at P3.40 billion, up P498.14 million or 17.2%, due to increased spending on operation infrastructure;
Provision for income tax at P1.83 billion, increased P333.15 million or 22.3%, on higher current income tax at P1.97 billion, up P220.76 million or 12.6%, while recording lower deferred income tax at (P141.47) million versus last year’s (P253.86) million on lower impairment losses.

Page 25 of 30
Income attributable to non-controlling interest at P61.62 million, decreased P35.28 million or 36.4%, largely attributable to lower income contribution from insurance subsidiaries and leasing business. Total comprehensive income at P5.93 billion, increased P420.18 million, or 7.63%, due to the P592.14 million, or 10.9% growth in net income before minority interest despite registering a total other comprehensive loss, net of tax effect of P101.70 million or down P672.72. For Items that may be reclassified subsequently to profit and loss:
Share in other comprehensive income of associates at (P305.10) million, declined P274.77 million, due to the downward market valuation of the investments of the bancassurance affiliate which was evident in September;
Net change, in fair value reserve on FVOCI securities, net of tax effect at (P40.44) million, decreased P149.59 million or 137.1%, on account of lower market valuation of the Bank’s investment securities;
Fair value reserve on investments of insurance subsidiaries, net of tax effect at (P64.56) million, decreased P126.17 million or 204.8%, as a result of lower market valuation of the insurance subsidiaries’ investment funds;
Currency translation differences at (P60.90) million, down P122.19 million or 199.4%, on account of lower revenue arising from lower investment volume despite the weakening of the Philippine Peso against the Euro and Hong Kong Dollar Currencies;
For Items that will not be reclassified to profit and loss:
Actuarial gains (losses) on defined benefit plan net of tax effect, at P130.67 million, from zero level in the same period last year, on higher actuarial valuation of bank contribution on retirement fund;
Share in other comprehensive gain/(loss) of associates was at P238.64 million, up P281.88 million from a loss of P43.24 in the third quarter last year, impacted by the change in premium recognition from net to gross of the bancassurance affiliate.
Income attributable to non-controlling interest at P14.15 million, decreased P88.21 million, or 86.2%, due to lower income contribution by bancassurance affiliate. For the Nine Months ended September 30, 2018 and 2017 Net income in the first nine months of 2018 was P17.01 billion, down P37.78 million or 0.2%, from the profit earned in the first nine months of 2017. The decrease was driven largely by lower non-interest income and higher operating expenses and taxes, despite impact of higher net interest income and reduced provisions. Total revenues still increased P3.84 billion or 7.2%, to P56.89 billion.

Page 26 of 30
Net interest income stood at P40.88 billion, increased P5.38 billion or 15.1%, on account of the P162.88 billion or 9.4% expansion in average asset base, and 0.17 percentage points expansion in net interest margin (NIM). Interest income stood at P57.58 billion, up P9.12 billion or 18.8%, and this was driven by the following movements:
Increase in interest income on loans and advances at P51.46 billion, up P10.04 billion or 24.2%, due to improvement in average volume and yield;
Increase in interest income on FA at FV through profit or loss at P202.91 million, up P44.20 million or 27.9%, due to higher average volume and despite lower yield;
Decrease in interest income on deposits with BSP and other banks at P876.60 million, down P835.63 million or 48.8%, due to lower average volume coupled by lower yield;
Decrease in interest income on FA at FV through OCI at P174.11 million, down P107.47 million or 38.2%, despite slight increase in yield as average volume dropped for the period;
Increase in Gross Receipts Tax at P1.90 billion, up P294.46 million or 18.3%, as a result of higher interest income.
Interest expense at P16.70 billion, increased P3.74 billion, or 28.9%, driven by the increase in interest expense on deposits at P15.22 billion, up P3.11 billion or 25.7%, as expense on documentary stamps tax (DST) on deposits increased for the period. Bills payable and other borrowings at P1.48 billion, up P635.27 million or 75.0%, due to higher average volume and interest cost. Other income at P16.01 billion was P1.53 billion, or 8.7% lower than the P17.54 billion earned in the first nine months of 2017:
Other operating income at P7.89 billion, decreased P603.47 million or 7.1%, due to reduced management fees on UITFs and mutual funds, proceeds from assets sold this year was higher than booked last year, and lower miscellaneous income;
Income attributable to insurance operations at P859.31 million, decreased P382.30 million or 30.8%, due to life insurance subsidiary’s lower investment income arising from marked-to-market losses and non-life business’ higher claims expenses;
Trading gain (loss) on securities at P660.62 million, decreased P279.99 million or 29.8%, due to market volatility;
Other expenses at P32.08 billion, grew P4.22 million, or 15.2%, from P27.86 billion:
Occupancy and equipment-related expenses at P10.01 billion, up P1.78 billion or 21.6%, on increased premises and technology-related costs;
Other operating expenses at P10.64 billion, increased P1.29 billion or 13.8%, largely due to EMV-related, volume-driven transaction, marketing, and regulatory costs;
Compensation and Fringe Benefits at P11.43 billion, up P1.16 billion or 11.3%, on increased headcount, largely attributable to BPI Direct BanKo hiring for its new branches and branch-lite units.
Page 27 of 30
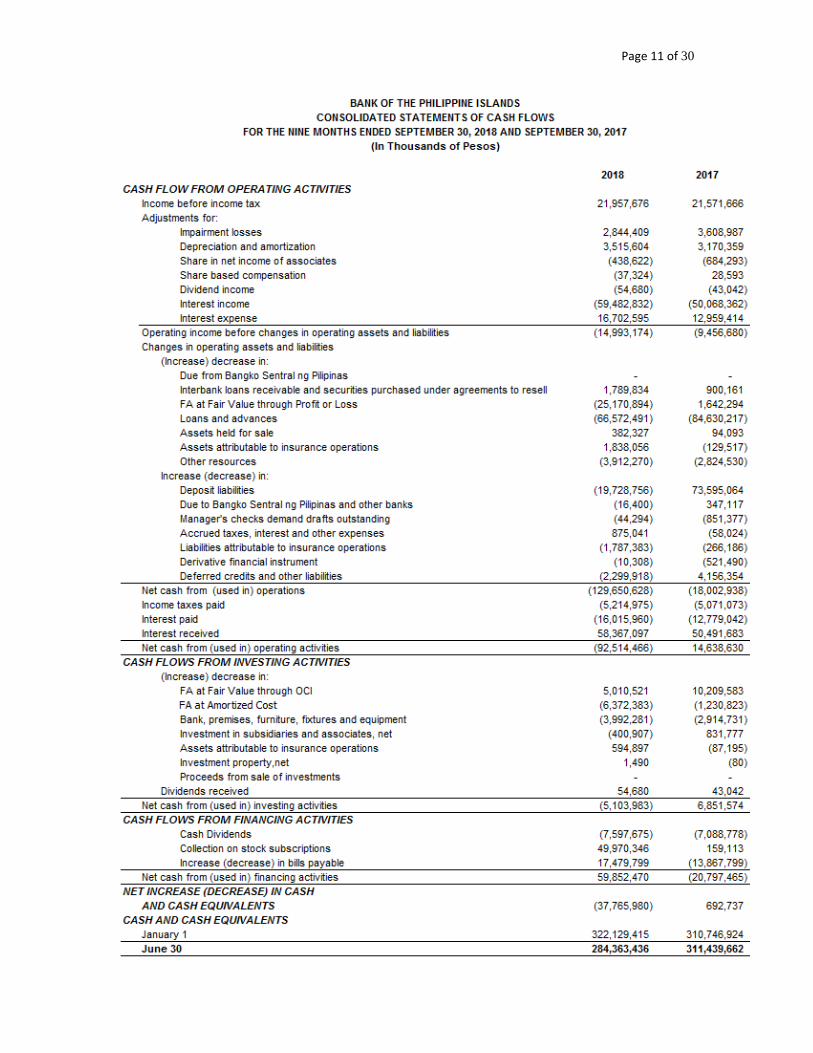
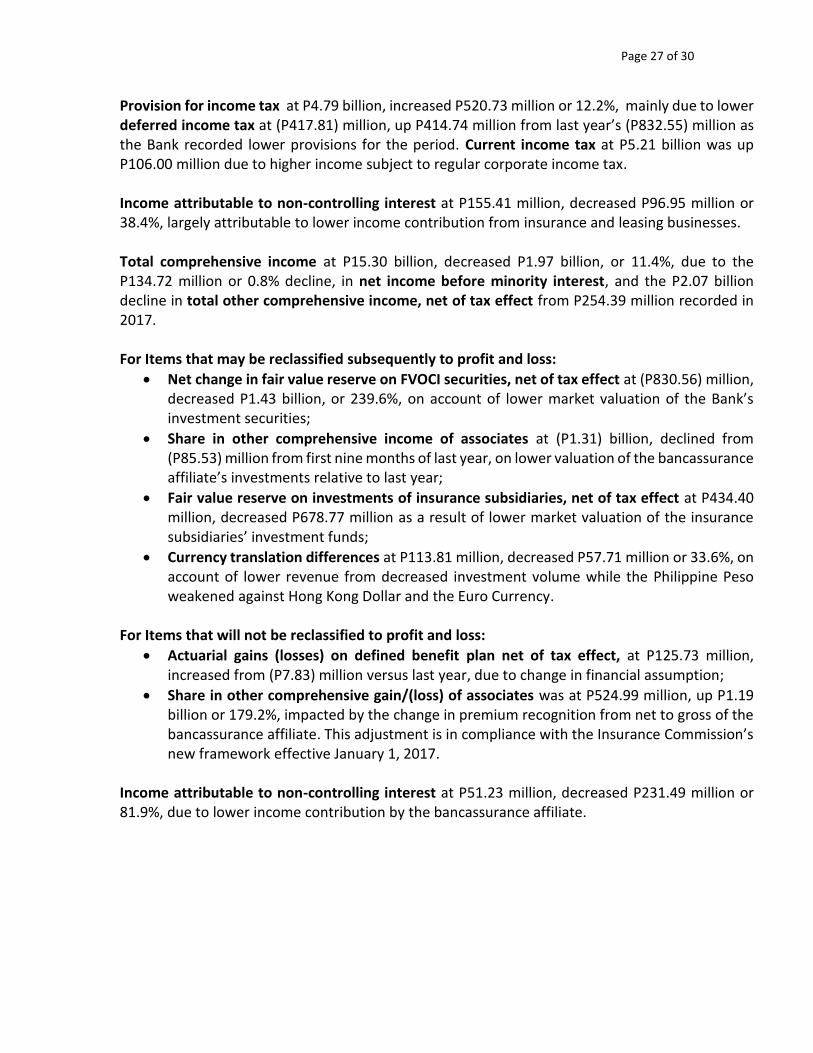
Provision for income tax at P4.79 billion, increased P520.73 million or 12.2%, mainly due to lower deferred income tax at (P417.81) million, up P414.74 million from last year’s (P832.55) million as the Bank recorded lower provisions for the period. Current income tax at P5.21 billion was up P106.00 million due to higher income subject to regular corporate income tax.
Income attributable to non-controlling interest at P155.41 million, decreased P96.95 million or 38.4%, largely attributable to lower income contribution from insurance and leasing businesses. Total comprehensive income at P15.30 billion, decreased P1.97 billion, or 11.4%, due to the P134.72 million or 0.8% decline, in net income before minority interest, and the P2.07 billion decline in total other comprehensive income, net of tax effect from P254.39 million recorded in 2017. For Items that may be reclassified subsequently to profit and loss:
Net change in fair value reserve on FVOCI securities, net of tax effect at (P830.56) million, decreased P1.43 billion, or 239.6%, on account of lower market valuation of the Bank’s investment securities;
Share in other comprehensive income of associates at (P1.31) billion, declined from (P85.53) million from first nine months of last year, on lower valuation of the bancassurance affiliate’s investments relative to last year;
Fair value reserve on investments of insurance subsidiaries, net of tax effect at P434.40 million, decreased P678.77 million as a result of lower market valuation of the insurance subsidiaries’ investment funds;
Currency translation differences at P113.81 million, decreased P57.71 million or 33.6%, on account of lower revenue from decreased investment volume while the Philippine Peso weakened against Hong Kong Dollar and the Euro Currency.
For Items that will not be reclassified to profit and loss:
Actuarial gains (losses) on defined benefit plan net of tax effect, at P125.73 million, increased from (P7.83) million versus last year, due to change in financial assumption;
Share in other comprehensive gain/(loss) of associates was at P524.99 million, up P1.19 billion or 179.2%, impacted by the change in premium recognition from net to gross of the bancassurance affiliate. This adjustment is in compliance with the Insurance Commission’s new framework effective January 1, 2017.
Income attributable to non-controlling interest at P51.23 million, decreased P231.49 million or 81.9%, due to lower income contribution by the bancassurance affiliate.
Page 28 of 30
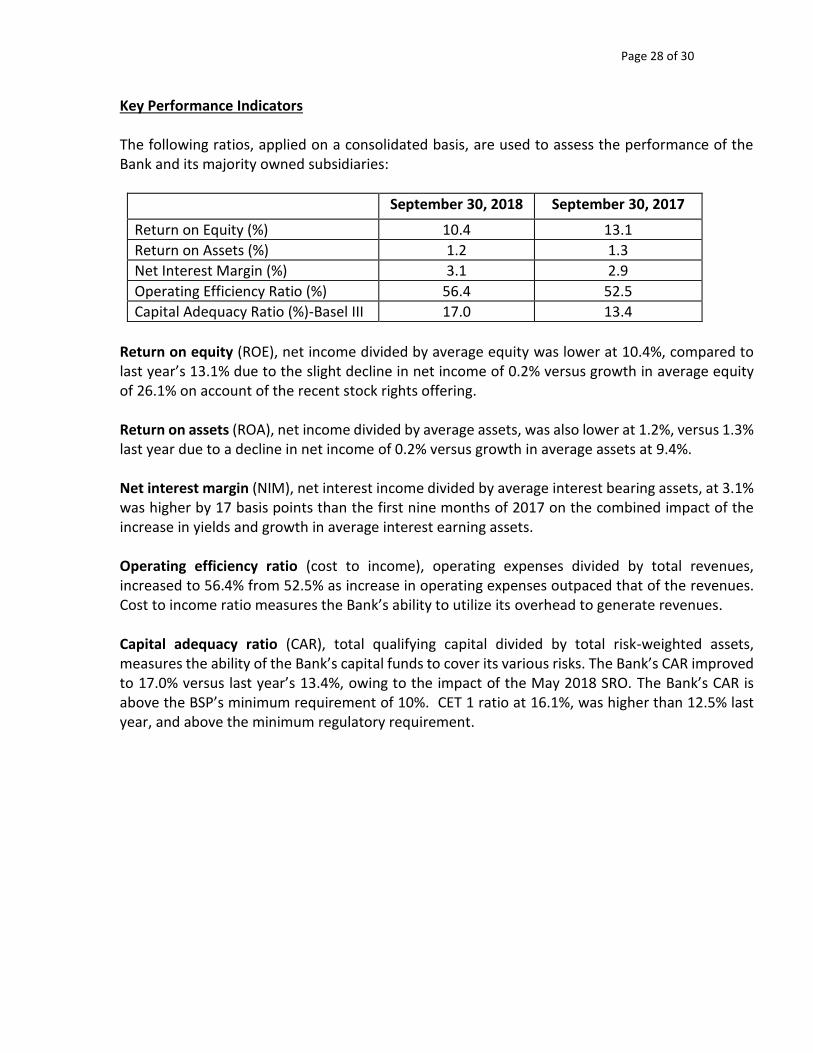
Key Performance Indicators The following ratios, applied on a consolidated basis, are used to assess the performance of the Bank and its majority owned subsidiaries:
September 30, 2018 September 30, 2017
Return on Equity (%) 10.4 13.1
Return on Assets (%) 1.2 1.3
Net Interest Margin (%) 3.1 2.9
Operating Efficiency Ratio (%) 56.4 52.5
Capital Adequacy Ratio (%)-Basel III 17.0 13.4
Return on equity (ROE), net income divided by average equity was lower at 10.4%, compared to last year’s 13.1% due to the slight decline in net income of 0.2% versus growth in average equity of 26.1% on account of the recent stock rights offering. Return on assets (ROA), net income divided by average assets, was also lower at 1.2%, versus 1.3% last year due to a decline in net income of 0.2% versus growth in average assets at 9.4%. Net interest margin (NIM), net interest income divided by average interest bearing assets, at 3.1% was higher by 17 basis points than the first nine months of 2017 on the combined impact of the increase in yields and growth in average interest earning assets. Operating efficiency ratio (cost to income), operating expenses divided by total revenues, increased to 56.4% from 52.5% as increase in operating expenses outpaced that of the revenues. Cost to income ratio measures the Bank’s ability to utilize its overhead to generate revenues.
Capital adequacy ratio (CAR), total qualifying capital divided by total risk-weighted assets, measures the ability of the Bank’s capital funds to cover its various risks. The Bank’s CAR improved to 17.0% versus last year’s 13.4%, owing to the impact of the May 2018 SRO. The Bank’s CAR is above the BSP’s minimum requirement of 10%. CET 1 ratio at 16.1%, was higher than 12.5% last year, and above the minimum regulatory requirement.

Page 29 of 30
Material Events and Uncertainties The Bank has nothing to report on the following: 1. Any known trends or any known demands, commitments, events or uncertainties that will
result in or that are reasonably likely to result in the registrant’s liquidity increasing or decreasing in any material way.
2. Any events that will trigger direct or contingent financial obligation that is material to the company, including any default or acceleration of an obligation.
3. Other material off-balance sheet transactions, arrangements, obligations (including contingent obligations), and other relationships of the company with unconsolidated entities or other persons created during the reporting period other than those mentioned above.
4. Material commitments for capital expenditures. 5. Any known trends, events or uncertainties that have had or that are reasonably expected to
have a material favorable or unfavorable impact on net sales or revenues or income from continuing operations.
6. Events that will cause material change in the relationship between costs and revenues (such as known future increases in cost of labor or materials or price increases or inventory adjustments).
7. Any significant elements of income or loss that did not arise from the registrant’s continuing operations.
8. Any seasonal aspects that had a material effect on the financial condition or results of operations.


