36
Turbulent times ahead Scottish Premier League Football 24th Review of Scottish Premier League Football Season 2011/12 www.pwc.co.uk/scotland

Turbulent times aheadScottish Premier League Football
24th Review of Scottish Premier League Football Season 2011/12
www.pwc.co.uk/scotland
Contents
Introduction .................................................................. 3
P&L Overview ................................................................. 6
Cash flow review .......................................................... 14
Appendices ................................................................... 31
Appendix one – Significant transfer activity 2011/12 ........... 32

3 PwC | Turbulent times ahead
Introduction
The past 12 months have seen some of the most uncertain and financially challenging times in Scottish football.
When we first published this report in the 1980s, a top division without Rangers and Hearts – traditionally two of Scotland’s most successful clubs – was unimaginable. Following Rangers’ liquidation and the administration of Dunfermline Athletic, Hearts have become the latest Scottish club to have their future clouded by financial uncertainty, with the Tynecastle side entering administration in June 2013.
Welcome to our 24th annual review of the Scottish Premier League (SPL).
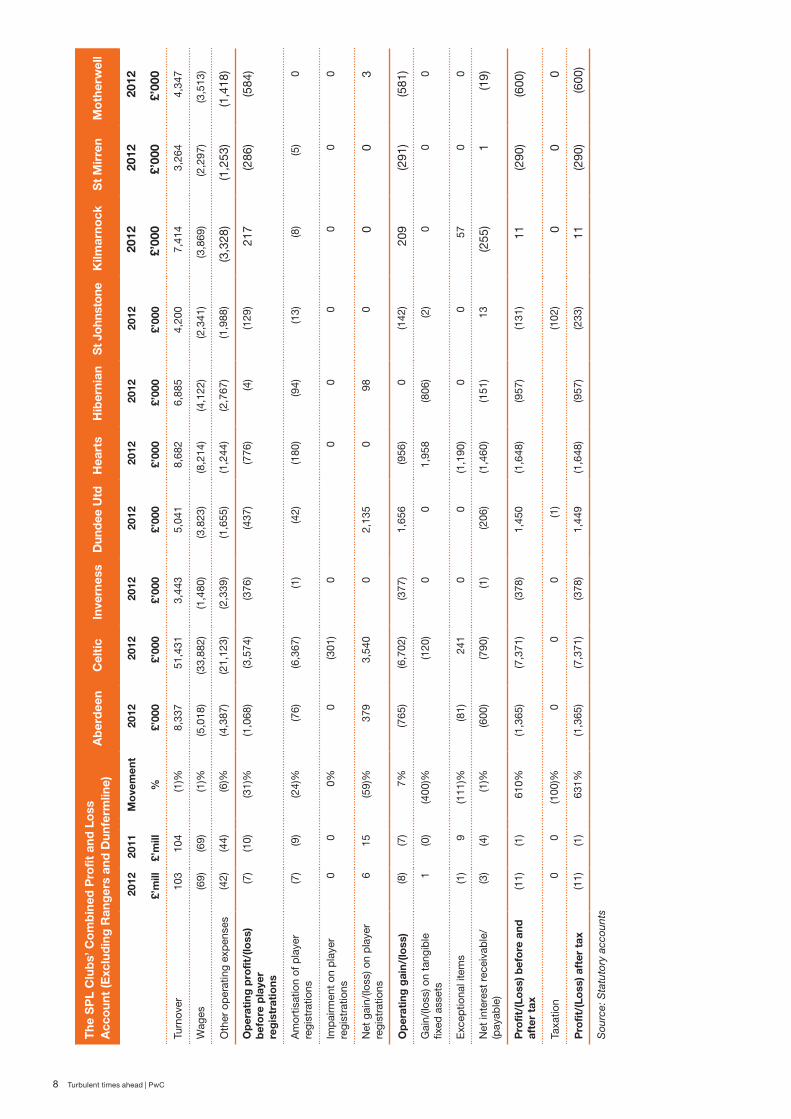
Combined Profit and Loss Account (Excluding Rangers and Dunfermline Athletic)
2012 £’mill 2011 £’mill
Turnover 103 104
Wages (69) (69)
Other operating expenses (42) (44)
Operating loss before player registrations (7) (10)
Amortisation of player registrations (7) (9)
Impairment on player registrations 0 0
Net gain on player registrations 6 15
Operating loss (8) (7)
Gain/(loss) on tangible fixed assets 1 (0)
Exceptional items (0) 10
Net interest payable (3) (4)
Loss before tax (11) (1)
Taxation 0 0
Loss after tax (11) (1)
Source: Statutory accounts
A ten team reportOn the pitch, season 2011/12 saw Celtic crowned champions for a 43rd time as they regained the SPL title from their city rivals Rangers; while Hamilton Academical faced relegation after three seasons in the top division.
It was, however, off pitch events which attracted the majority of the headlines. The administration, and subsequent liquidation, of Rangers ensured that season 2011/12 would be the club’s last in the SPL for a minimum of three seasons.
The lack of meaningful data available due to Rangers’ administration and the fact they will not be competing in the SPL from 2012/13 has led us to remove the club’s results from this analysis.
Administration has also led us to remove Dunfermline Athletic. In addition, in order to ensure meaningful comparatives between seasons 2011/12 and 2010/11, the results of Hamilton Academical – relegated in 2010/11 – have also been omitted, resulting in a report featuring the financial results for 10 clubs for both seasons.
A picture of redIn season 2011/12, the SPL posted a pre-tax loss of £11m (2011:£1m). This was largely driven by a £7.4m loss recorded by Celtic, but 80% of the member clubs recorded a financial loss with only Dundee United and Kilmarnock posting profits. The absence of European success is clearly felt in these results, as no Scottish club successfully advanced to the latter stages of European competition.
4 Turbulent times ahead | PwC
The economic downturn and the affect this had on fans has seen SPL attendances remain at the level recorded in 2010/11. This was reflected in the clubs top line revenues which were flat at £103m (2011:£104m). Wages, the largest operating costs, fell in line with turnover.
Other highlights over the season include;
• Dundee United becoming the league’s most profitable club, recording a profit of £1.5m (largely attributable to the sale of David Goodwillie for c£2m)
• Celtic’s £7.4m loss represented 69% of the total SPL loss
• Gains on player registrations fell to £5m (2011:£15m)
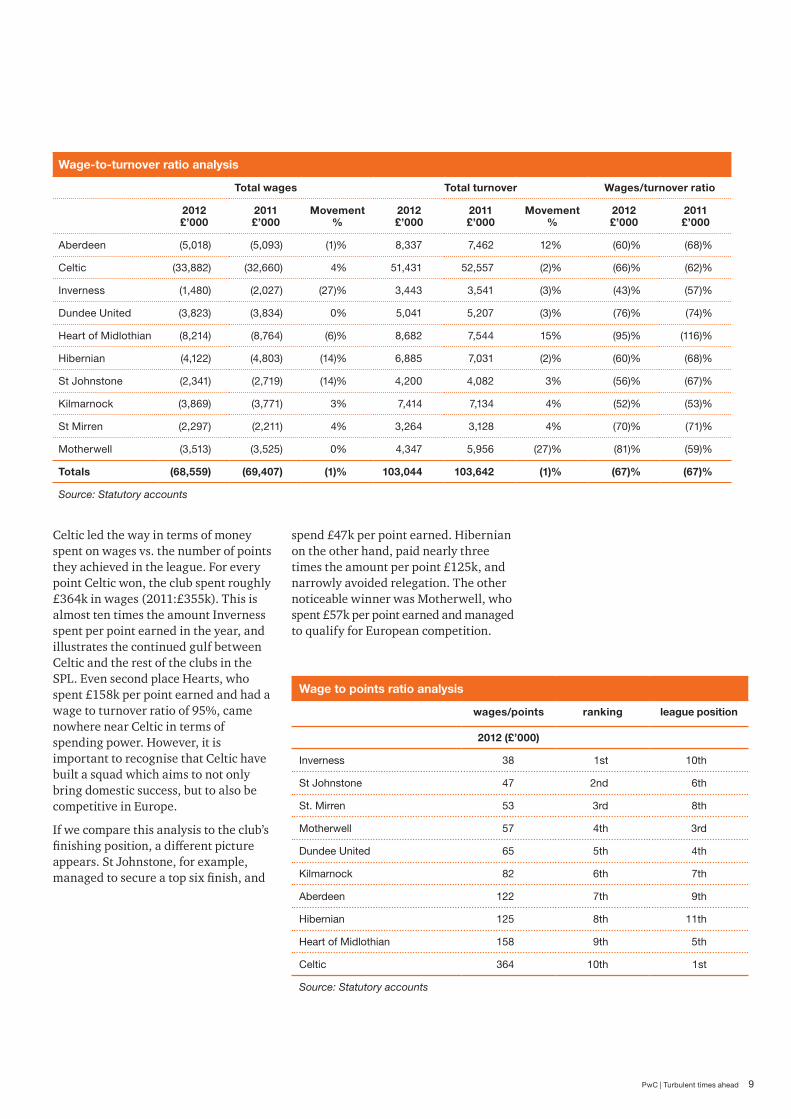
• Wage-to-turnover ratio remained static at 67%, with six clubs posting ratios in excess of our recommended sustainable level of 60%
• Inverness earned 39 points from a wages spend of £38k per point in 2011/12, the league’s lowest. The SPL champions, Celtic (93 points) spent £364k per point.
Rangers Football Club plc no more
Following a significant period of uncertainty, on 14 February 2012 Rangers Football Club was placed into administration. Initially, this led to the club incurring an immediate ten point penalty from the SPL and the appointment of Duff & Phelps as the Administrators. A near four month period of administration culminated in the rejection of a CVA by the club’s main creditor, HMRC. This effectively left liquidation as the only viable option and brought to an end the 140 year history of Rangers Football Club Plc and ended Sir David Murray’s 23-year ownership of Rangers as he sold his controlling stake to Craig Whyte.
Initially, Whyte’s takeover appeared to place the club on an improved financial footing and transferred the £18m debt due to Lloyds Banking Group. Rangers went on to lift the SPL title in May 2011, but on entering administration it emerged that during the period of Whyte’s ownership Rangers had failed to meet their liabilities to HMRC for VAT and PAYE. This led to debts of c£15m which were the catalyst to the club’s liquidation. Rangers were subsequently demoted to SFL3 after failing to gain the required number of votes to be reinstated to the SPL.
Trouble at Tynecastle
Hearts’ financial position has been the subject of media speculation for some time. The club has been living outside of their means in recent seasons, regularly posting wage-to-turnover ratios in excess of 100%, peaking at 126% in 2009/10.
Having already been subject to three separate HMRC winding up petitions (following the same non-payment of VAT and PAYE which led to Rangers’ initial administration), at the time of writing the future of Hearts is uncertain While the club has suffered cash flow problems for some time, the insolvency of the club’s parent company UBIG and its sister company Ukio Bankas, who together own 79% of the club’s shares, led to its financial position becoming untenable.
An uncertain future?Rangers revenue of £57.2m represented 35% of 2010/11 total SPL revenue, so the impact of a Rangers-less SPL is clear. Given the 2011/12 results include an element of Rangers driven revenue (away crowds/broadcasting revenue), the true impact of the Ibrox club’s demotion will not become apparent until our 25th review, which will focus on the financial results for the 2012/13 season.
Early signs suggest that a number of clubs will suffer a deterioration in their financial performance in the 2012/13 season. Kilmarnock, for example, have stated that they anticipate the absence of Rangers will cost the club a minimum of £0.3m through lost gate receipts alone (assuming two home games against Rangers).
Unlike major European leagues SPL ticket sales are the most important revenue stream, followed by TV and radio deals, with sponsorship ranked third. Indeed, concerns regarding reduced match-day revenues are backed up by the SPL attendance figures for 2012/13, which showed a 28% reduction in average attendances from 13,855 to 10,020. Although these figures are affected by the absence of Rangers, six SPL clubs recorded a drop in average attendance in 2012/13 and which will directly impact the top line revenues at these clubs. However, with Rangers recording an average attendance in excess of 45,000 in SFL3, it is important to note that these fans have not been ‘lost’ to the game in Scotland.
Celtic recorded the largest fall in average attendance – down to 46,917 from 50,904 – but this will be more than offset by revenue generated by the club’s run to the last 16 of the Champions League in 2012/13. We expect this to generate revenues in excess of £20m. This fall in numbers came despite tactics such as Sell Out Saturday campaigns and season ticket initiatives promoted by Aberdeen and Dundee United in particular, while there was the return of the Dundee and the leagues first ever Highland derby’s.
We anticipate that broadcasting revenues, Celtic aside, will also suffer a drop in 2012/13. A five year £80m deal beginning 2012/13 was agreed with Sky/ESPN, but it was widely reported that this was re-negotiated following Rangers’ demotion and the subsequent absence of Old Firm matches. The amount of any reduction is unconfirmed, however taken in conjunction with
5 PwC | Turbulent times ahead
reduced match-day revenues, it is clear that the financial results for season 2012/13 will show a very challenging picture for the vast majority of SPL clubs. Celtic’s results (buoyed by their Champions League run) will likely sheer up the position for the SPL as a whole.
The way forward?It is clear that turbulent times lie ahead for the SPL. However, we wish to stress that the clubs’ have it within their powers to make changes to adapt to this environment.
Reduction in player salaries
Several clubs in the SPL already have wage-to-turnover ratios in excess of our recommended sustainable level. Wages fell 1% in 2011/12, but given eight of the ten SPL clubs made a loss in the season we would note that there will be a continued reduction in player salaries moving forward, which will likely be accelerated in the short-term due to falling attendances and revenues. However, the Chairmen have a difficult balancing act appeasing fans and preventing the perceived quality of the product on the pitch suffering.
Focus on youth
It is vitally important for the future of SPL clubs that they to continue to work to develop young talent. In doing so, this would allow the clubs the opportunity to firstly, reduce the higher wage costs associated with more experienced players and secondly, provide the platform to generate profits. We see the player trading model as the only sustainable business model for SPL clubs moving forward in the short to medium term.
Maintain existing customer base
With SPL attendances in continual decline, the clubs must work to reverse this trend. It is imperative for clubs to strengthen their links to the local communities in order to attract younger fans, building a platform for the future. Communities are likely to have an existing affinity to their local club, and it is vital that they work to move fans away from their armchairs and through their gates.
Explore other revenue streams
Clubs should work to explore the growth of new revenue streams in order to compensate for the decline in revenue from their traditional sources. Kilmarnock, for example, generated revenue in excess of £2m from their Park Hotel.
An increasing number of SFL clubs are able to derive revenue from artificial pitches. Stenhousemuir and Alloa Athletic, for example rent out their pitches to the local communities. While the use of artificial pitches is currently prohibited in the SPL, we suggest that given the ever improving quality of the pitches this rule should be reviewed moving forward. In doing so, a potentially new revenue stream would be opened for the member clubs.
ThanksAs ever, I am indebted to my Sports Unit team – Stuart MacDougall, Alastair Scott, Stuart Teape and Steven Young – for their help in compiling this report.
David Glen PwC in Scotland November 2013

6 Turbulent times ahead | PwC
P&L Overview
Season 2011/12 saw the continuation of a number of long term trends affecting the profitability of the Scottish Premier League and its clubs. Total turnover of the ten clubs included in the analysis fell 1% to £103m (2011:£104m), while the cumulative bottom line of the league fell to a loss of £11m (2011:£1m loss).
The player trading model, outlined in detail in our 23rd review, failed to produce the bottom line boost it did in 2011.
Omitting the effects of Rangers and Dunfermline for reasons already discussed, the overall gain on sales on player registrations fell to £6m (2011:£15m). This was largely due to the substantial impact of Celtic selling Aiden McGeadyin 2011, whereas in 2012, the sale of Islam Feruz to Chelsea and Jos Hooiveld to Southampton did not generate the same gains for the club. Dundee United experienced a boost with the sale of David Goodwillie in August 2011 for a fee of £2m. This sale helped Dundee United become the most profitable SPL club in 2011/12.
The amortisation of player registrations once again fell in 2012 to £7m (2011:£9m). This is a clear indication that SPL clubs are spending less in the transfer market, as the league moves from being a buying league to a selling league.
The player trading model also has a knock-on effect on the perceived quality of the game in Scotland. As discussed in our 23rd review, this would usually (and has in the past) directly impacted revenue from matchday attendances. However, average attendance figures actually show a 1% rise overall. Only four teams experienced an overall fall in the year.
Aberdeen increased average attendances by 2%, predominately due to a strong run in the Scottish Cup following the arrival of veteran manager Craig Brown.
Motherwell continued to perform well domestically, and launched a number of initiatives to attract crowds such as reduced ticket prices and free entry for children, which contributed to an increased attendance of 13% on average. Whilst this did not translate into increased revenue in the year, with the club’s top line falling to £4.3m (2011:£6m), it should be recognised that this represents a long-term plan by the club to increase attendances. Celtic posted an attendance increase of 4% which helped to cushion the fall in the club’s turnover to 2% (2011:15%).
Attendance figures remain a key performance indicator, especially for the SPL, which still receives the majority of it’s income from ticket sales.
Scottish clubs once again failed to progress to the latter stages of the major European tournaments and this had a significant impact on the top line of the league as a whole. If we break this number down to a club level, Celtic make up £51.4m of the total £103m league revenue which compares negatively to 2010 when Celtic’s revenue reached £61.7m, helped by European success.
7 PwC | Turbulent times ahead
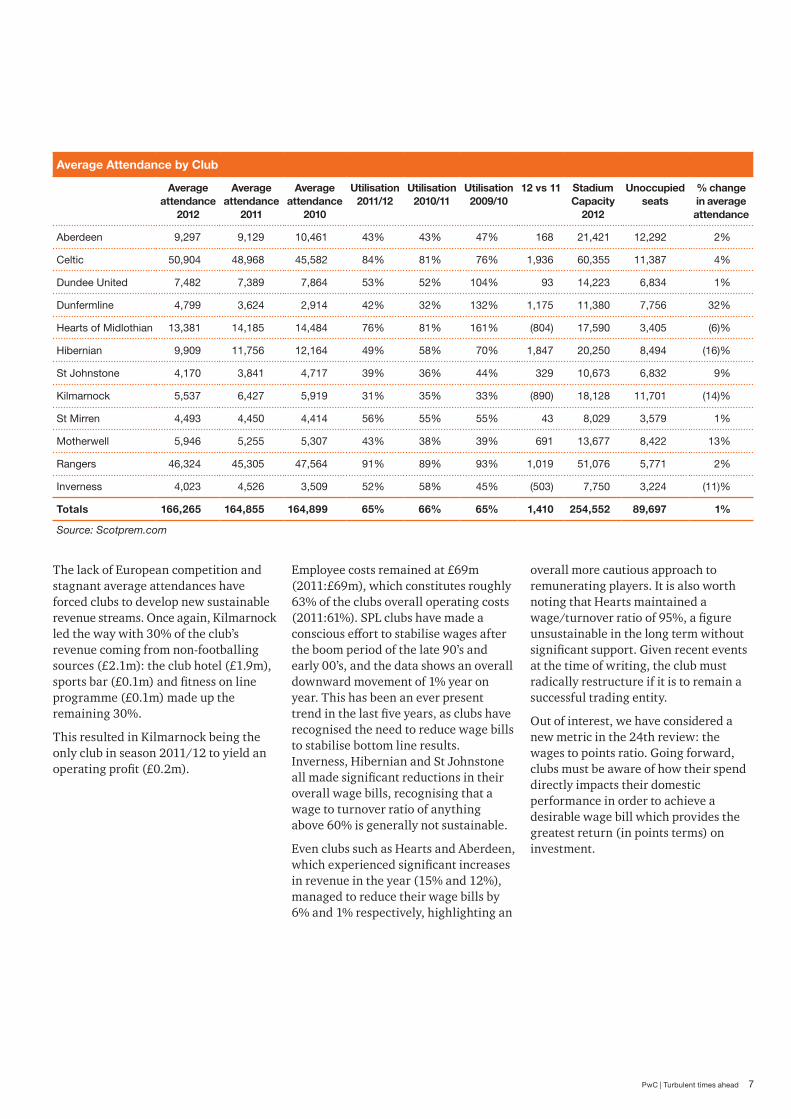
Average Attendance by Club
Average attendance
2012
Average attendance
2011
Average attendance
2010
Utilisation 2011/12
Utilisation 2010/11
Utilisation 2009/10
12 vs 11 Stadium Capacity
2012
Unoccupied seats
% change in average attendance
Aberdeen 9,297 9,129 10,461 43% 43% 47% 168 21,421 12,292 2%
Celtic 50,904 48,968 45,582 84% 81% 76% 1,936 60,355 11,387 4%
Dundee United 7,482 7,389 7,864 53% 52% 104% 93 14,223 6,834 1%
Dunfermline 4,799 3,624 2,914 42% 32% 132% 1,175 11,380 7,756 32%
Hearts of Midlothian 13,381 14,185 14,484 76% 81% 161% (804) 17,590 3,405 (6)%
Hibernian 9,909 11,756 12,164 49% 58% 70% 1,847 20,250 8,494 (16)%
St Johnstone 4,170 3,841 4,717 39% 36% 44% 329 10,673 6,832 9%
Kilmarnock 5,537 6,427 5,919 31% 35% 33% (890) 18,128 11,701 (14)%
St Mirren 4,493 4,450 4,414 56% 55% 55% 43 8,029 3,579 1%
Motherwell 5,946 5,255 5,307 43% 38% 39% 691 13,677 8,422 13%
Rangers 46,324 45,305 47,564 91% 89% 93% 1,019 51,076 5,771 2%
Inverness 4,023 4,526 3,509 52% 58% 45% (503) 7,750 3,224 (11)%
Totals 166,265 164,855 164,899 65% 66% 65% 1,410 254,552 89,697 1%
Source: Scotprem.com
The lack of European competition and stagnant average attendances have forced clubs to develop new sustainable revenue streams. Once again, Kilmarnock led the way with 30% of the club’s revenue coming from non-footballing sources (£2.1m): the club hotel (£1.9m), sports bar (£0.1m) and fitness on line programme (£0.1m) made up the remaining 30%.
This resulted in Kilmarnock being the only club in season 2011/12 to yield an operating profit (£0.2m).
Employee costs remained at £69m (2011:£69m), which constitutes roughly 63% of the clubs overall operating costs (2011:61%). SPL clubs have made a conscious effort to stabilise wages after the boom period of the late 90’s and early 00’s, and the data shows an overall downward movement of 1% year on year. This has been an ever present trend in the last five years, as clubs have recognised the need to reduce wage bills to stabilise bottom line results. Inverness, Hibernian and St Johnstone all made significant reductions in their overall wage bills, recognising that a wage to turnover ratio of anything above 60% is generally not sustainable.
Even clubs such as Hearts and Aberdeen, which experienced significant increases in revenue in the year (15% and 12%), managed to reduce their wage bills by 6% and 1% respectively, highlighting an
overall more cautious approach to remunerating players. It is also worth noting that Hearts maintained a wage/turnover ratio of 95%, a figure unsustainable in the long term without significant support. Given recent events at the time of writing, the club must radically restructure if it is to remain a successful trading entity.
Out of interest, we have considered a new metric in the 24th review: the wages to points ratio. Going forward, clubs must be aware of how their spend directly impacts their domestic performance in order to achieve a desirable wage bill which provides the greatest return (in points terms) on investment.
8 Turbulent times ahead | PwC
The
SP
L C
lub
s’ C
om
bin
ed P
rofit
and
Lo
ss
Acc
oun
t (E
xclu
din
g R
ang
ers
and
Dun
ferm
line)
Ab
erd
een
Cel
ticIn
vern
ess
Dun
dee
Utd
Hea
rts
Hib
erni
anS
t Joh
nsto
neK
ilmar
nock
St
Mir
ren
Mo
ther
wel
l
20
1220
11M
ove
men
t20
1220
1220
1220
1220
1220
1220
1220
1220
1220
12
£’
mill
£’m
ill%
£’00
0£’
000
£’00
0£’
000
£’00
0£’
000
£’00
0£’
000
£’00
0£’
000
Turn
over
103
104
(1)%
8,33
751
,431
3,44
35,
041
8,68
26,
885
4,20
07,
414
3,26
44,
347
Wag
es(6
9)(6
9)(1
)%(5
,018
)(3
3,88
2)(1
,480
)(3
,823
)(8
,214
)(4
,122
)(2
,341
)(3
,869
)(2
,297
)(3
,513
)
Oth
er o
pera
ting
expe
nses
(42)
(44)
(6)%
(4,3
87)
(21,
123)
(2,3
39)
(1,6
55)
(1,2
44)
(2,7
67)
(1,9
88)
(3,3
28)
(1,2
53)
(1,4
18)
Op
erat
ing
pro
fit/(
loss
) b
efo
re p
laye
r re
gis
trat
ions
(7)
(10)
(31)
%(1
,068
)(3
,574
)(3
76)
(437
)(7
76)
(4)
(129
)21
7(2
86)
(584
)
Am
ortis
atio
n of
pla
yer
regi
stra
tions
(7)
(9)
(24)
%(7
6)(6
,367
)(1
)(4
2)(1
80)
(94)
(13)
(8)
(5)
0
Impa
irmen
t on
play
er
regi
stra
tions
0 0
0%0
(301
)0
00
00
00
Net
gai
n/(lo
ss) o
n pl
ayer
re
gist
ratio
ns6
15
(59)
%37
93,
540
02,
135
098
00
03
Op
erat
ing
gai
n/(lo
ss)
(8)
(7)
7%(7
65)
(6,7
02)
(377
)1,
656
(956
)0
(142
)20
9(2
91)
(581
)
Gai
n/(lo
ss) o
n ta
ngib
le
fixed
ass
ets
1 (0
)(4
00)%
(120
)0
01,
958
(806
)(2
)0
00
Exc
eptio
nal i
tem
s(1
)9
(111
)%(8
1)24
10
0(1
,190
)0
057
00
Net
inte
rest
rece
ivab
le/
(pay
able
)(3
)(4
)(1
)%(6
00)
(790
)(1
)(2
06)
(1,4
60)
(151
)13
(255
)1
(19)
Pro
fit/(
Loss
) bef
ore
and
af
ter
tax
(11)
(1)
610%
(1,3
65)
(7,3
71)
(378
)1,
450
(1,6
48)
(957
)(1
31)
11(2
90)
(600
)
Taxa
tion
0 0
(100
)%0
00
(1)
(102
)0
00
Pro
fit/(
Loss
) aft
er t
ax(1
1)(1
)63
1%(1
,365
)(7
,371
)(3
78)
1,44
9(1
,648
)(9
57)
(233
)11
(290
)(6
00)
Sou
rce:
Sta
tuto
ry a
ccou
nts
9 PwC | Turbulent times ahead
Wage-to-turnover ratio analysis
Total wages Total turnover Wages/turnover ratio
2012 £’000
2011 £’000
Movement %
2012 £’000
2011 £’000
Movement %
2012 £’000
2011 £’000
Aberdeen (5,018) (5,093) (1)% 8,337 7,462 12% (60)% (68)%
Celtic (33,882) (32,660) 4% 51,431 52,557 (2)% (66)% (62)%
Inverness (1,480) (2,027) (27)% 3,443 3,541 (3)% (43)% (57)%
Dundee United (3,823) (3,834) 0% 5,041 5,207 (3)% (76)% (74)%
Heart of Midlothian (8,214) (8,764) (6)% 8,682 7,544 15% (95)% (116)%
Hibernian (4,122) (4,803) (14)% 6,885 7,031 (2)% (60)% (68)%
St Johnstone (2,341) (2,719) (14)% 4,200 4,082 3% (56)% (67)%
Kilmarnock (3,869) (3,771) 3% 7,414 7,134 4% (52)% (53)%
St Mirren (2,297) (2,211) 4% 3,264 3,128 4% (70)% (71)%
Motherwell (3,513) (3,525) 0% 4,347 5,956 (27)% (81)% (59)%
Totals (68,559) (69,407) (1)% 103,044 103,642 (1)% (67)% (67)%
Source: Statutory accounts
Celtic led the way in terms of money spent on wages vs. the number of points they achieved in the league. For every point Celtic won, the club spent roughly £364k in wages (2011:£355k). This is almost ten times the amount Inverness spent per point earned in the year, and illustrates the continued gulf between Celtic and the rest of the clubs in the SPL. Even second place Hearts, who spent £158k per point earned and had a wage to turnover ratio of 95%, came nowhere near Celtic in terms of spending power. However, it is important to recognise that Celtic have built a squad which aims to not only bring domestic success, but to also be competitive in Europe.
If we compare this analysis to the club’s finishing position, a different picture appears. St Johnstone, for example, managed to secure a top six finish, and
Wage to points ratio analysis
wages/points ranking league position
2012 (£’000)
Inverness 38 1st 10th
St Johnstone 47 2nd 6th
St. Mirren 53 3rd 8th
Motherwell 57 4th 3rd
Dundee United 65 5th 4th
Kilmarnock 82 6th 7th
Aberdeen 122 7th 9th
Hibernian 125 8th 11th
Heart of Midlothian 158 9th 5th
Celtic 364 10th 1st
Source: Statutory accounts
spend £47k per point earned. Hibernian on the other hand, paid nearly three times the amount per point £125k, and narrowly avoided relegation. The other noticeable winner was Motherwell, who spent £57k per point earned and managed to qualify for European competition.
10 Turbulent times ahead | PwC
Balance sheet review
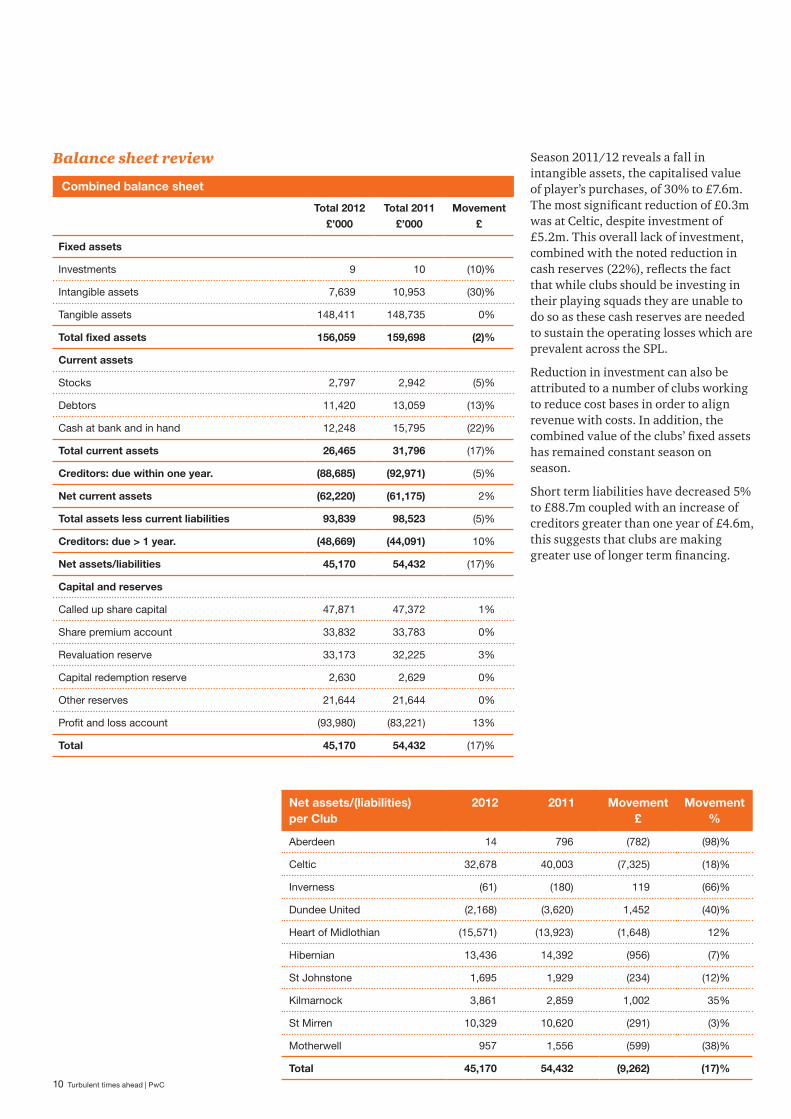
Combined balance sheet
Total 2012 £’000
Total 2011 £’000
Movement £
Fixed assets
Investments 9 10 (10)%
Intangible assets 7,639 10,953 (30)%
Tangible assets 148,411 148,735 0%
Total fixed assets 156,059 159,698 (2)%
Current assets
Stocks 2,797 2,942 (5)%
Debtors 11,420 13,059 (13)%
Cash at bank and in hand 12,248 15,795 (22)%
Total current assets 26,465 31,796 (17)%
Creditors: due within one year. (88,685) (92,971) (5)%
Net current assets (62,220) (61,175) 2%
Total assets less current liabilities 93,839 98,523 (5)%
Creditors: due > 1 year. (48,669) (44,091) 10%
Net assets/liabilities 45,170 54,432 (17)%
Capital and reserves
Called up share capital 47,871 47,372 1%
Share premium account 33,832 33,783 0%
Revaluation reserve 33,173 32,225 3%
Capital redemption reserve 2,630 2,629 0%
Other reserves 21,644 21,644 0%
Profit and loss account (93,980) (83,221) 13%
Total 45,170 54,432 (17)%
Season 2011/12 reveals a fall in intangible assets, the capitalised value of player’s purchases, of 30% to £7.6m. The most significant reduction of £0.3m was at Celtic, despite investment of £5.2m. This overall lack of investment, combined with the noted reduction in cash reserves (22%), reflects the fact that while clubs should be investing in their playing squads they are unable to do so as these cash reserves are needed to sustain the operating losses which are prevalent across the SPL.
Reduction in investment can also be attributed to a number of clubs working to reduce cost bases in order to align revenue with costs. In addition, the combined value of the clubs’ fixed assets has remained constant season on season.
Short term liabilities have decreased 5% to £88.7m coupled with an increase of creditors greater than one year of £4.6m, this suggests that clubs are making greater use of longer term financing.
Net assets/(liabilities) per Club
2012 2011 Movement £
Movement %
Aberdeen 14 796 (782) (98)%
Celtic 32,678 40,003 (7,325) (18)%
Inverness (61) (180) 119 (66)%
Dundee United (2,168) (3,620) 1,452 (40)%
Heart of Midlothian (15,571) (13,923) (1,648) 12%
Hibernian 13,436 14,392 (956) (7)%
St Johnstone 1,695 1,929 (234) (12)%
Kilmarnock 3,861 2,859 1,002 35%
St Mirren 10,329 10,620 (291) (3)%
Motherwell 957 1,556 (599) (38)%
Total 45,170 54,432 (9,262) (17)%
11 PwC | Turbulent times ahead
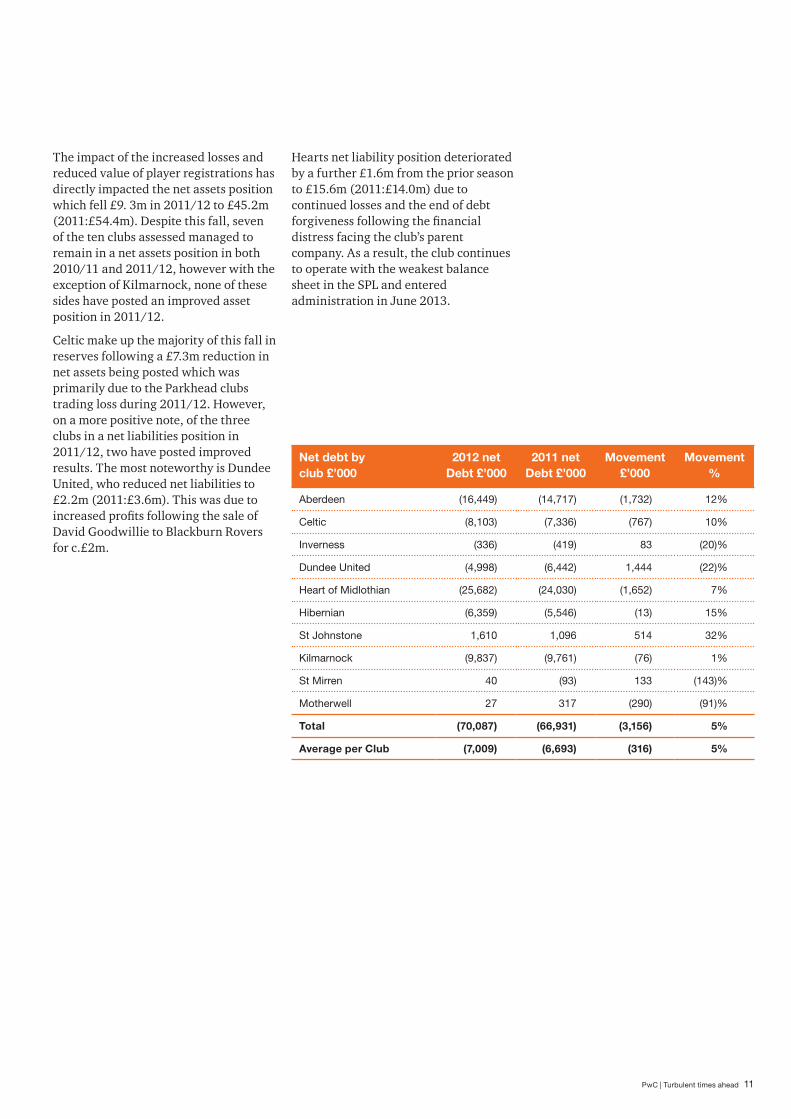
The impact of the increased losses and reduced value of player registrations has directly impacted the net assets position which fell £9. 3m in 2011/12 to £45.2m (2011:£54.4m). Despite this fall, seven of the ten clubs assessed managed to remain in a net assets position in both 2010/11 and 2011/12, however with the exception of Kilmarnock, none of these sides have posted an improved asset position in 2011/12.
Celtic make up the majority of this fall in reserves following a £7.3m reduction in net assets being posted which was primarily due to the Parkhead clubs trading loss during 2011/12. However, on a more positive note, of the three clubs in a net liabilities position in 2011/12, two have posted improved results. The most noteworthy is Dundee United, who reduced net liabilities to £2.2m (2011:£3.6m). This was due to increased profits following the sale of David Goodwillie to Blackburn Rovers for c.£2m.
Net debt by club £’000
2012 net Debt £’000
2011 net Debt £’000
Movement £’000
Movement %
Aberdeen (16,449) (14,717) (1,732) 12%
Celtic (8,103) (7,336) (767) 10%
Inverness (336) (419) 83 (20)%
Dundee United (4,998) (6,442) 1,444 (22)%
Heart of Midlothian (25,682) (24,030) (1,652) 7%
Hibernian (6,359) (5,546) (13) 15%
St Johnstone 1,610 1,096 514 32%
Kilmarnock (9,837) (9,761) (76) 1%
St Mirren 40 (93) 133 (143)%
Motherwell 27 317 (290) (91)%
Total (70,087) (66,931) (3,156) 5%
Average per Club (7,009) (6,693) (316) 5%
Hearts net liability position deteriorated by a further £1.6m from the prior season to £15.6m (2011:£14.0m) due to continued losses and the end of debt forgiveness following the financial distress facing the club’s parent company. As a result, the club continues to operate with the weakest balance sheet in the SPL and entered administration in June 2013.
12 Turbulent times ahead | PwC
Source of borrowings 2012
£’000 Borrowings due < 1 year
Borrowings due > 1 year
Club External Connected External Connected HP/Finance Leases
Total Borrowing
Overdraft/(Cash) balance
Net Debt
Aberdeen (10,820) (300) (2,250) (3,500) (90) (16,960) 511 (16,449)
Celtic (118) - (12,093) - (4,090) (16,301) 8,198 (8,103)
Inverness (491) - - (491) 155 (336)
Dundee United (3,930) (377) - (19) (4,326) (672) (4,998)
Heart of Midlothian - (23,055) - (321) - (23,376) (2,306) (25,682)
Hibernian (371) (250) (6,671) - (66) (7,358) 999 (6,359)
St Johnstone - - - - - - 1,610 1,610
Kilmarnock (78) (6,464) (13) (6,555) (3,282) (9,837)
St Mirren - (30) - (23) (7) (60) 100 40
Motherwell - - - (367) (7) (374) 401 27
Total (15,808) (24,012) (27,478) (4,211) (4,292) (75,801) 5,714 (70,087)
2012% 23% 34% 39% 6% 6% - (8%) 100%
2011% 61% 2% 40% 8% 8% - (19%) 100%
Source: Statutory accounts
Combined SPL net debt
2012 2011 Movement % 2012 % of total debt
2011 % of total debt
Cash at bank and in hand 12,248 15,763 (22)%
Bank Overdraft (6,534) (3,259) 100%
Net cash/(overdraft) 5,714 12,504 (54)% (8)% (19)%
Borrowings due within one year (39,820) (41,683) (4)% 57% 62%
Borrowings due in more than one year (31,689) (32,153) (1)% 45% 48%
Amounts owed under hire purchase (4,292) (5,599) (23)% 6% 8%
Net debt (70,087) (66,931) 5% 100% 100%

13 PwC | Turbulent times ahead
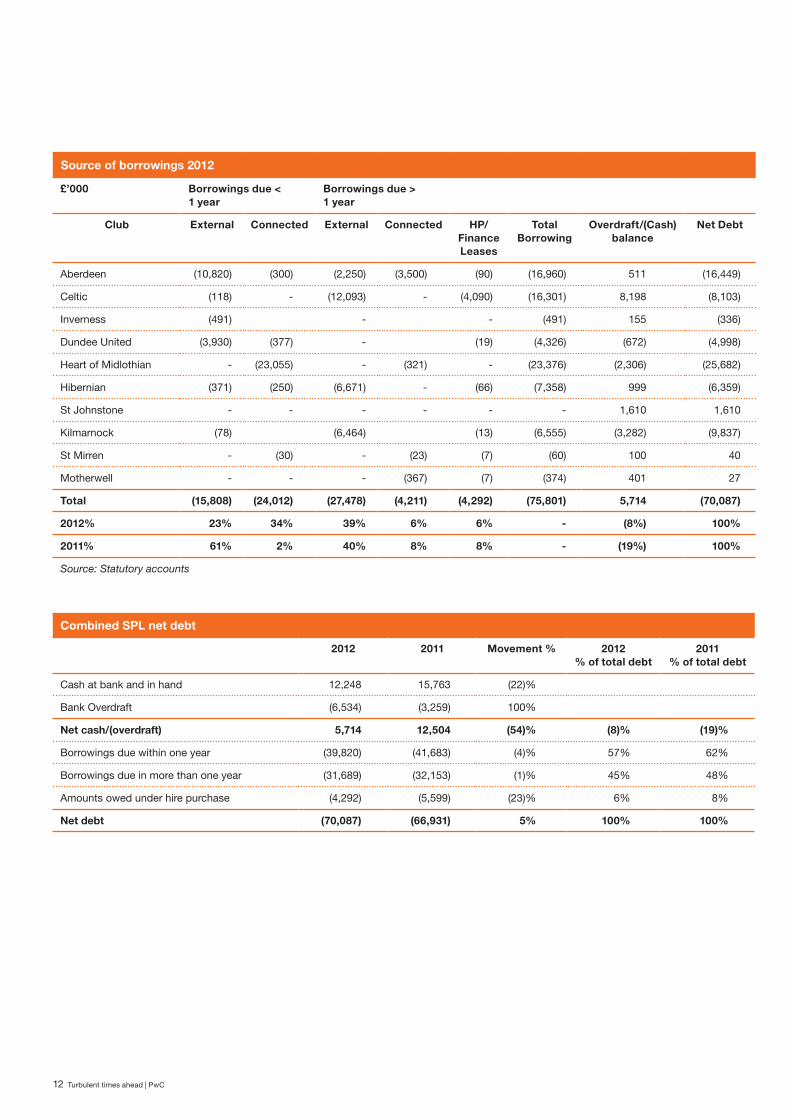
In considerable contrast to 2010/11 where a £16.6m fall in debt was recorded, season 2011/12 saw SPL debt rise by £3.2m to £70.1m (2011: £66.9m). Nevertheless, the decrease noted in the prior season was almost entirely driven by a forgiveness of debt at Hearts to the tune of £8.8m.
Dundee United, Inverness, St Mirren and St Johnstone all recorded a decrease in net debt position during 2011/12, with the largest decrease of £1.4m being attributed to Dundee United. This followed revised banking facilities being implemented during the season coupled with the sale of David Goodwillie which reduced the debt at the Tannadice club to £5.0m (2011: £6.4m). St Johnstone continue to enjoy the coveted position of being debt free and recorded an increase in cash held at the end of the season to £1.6m (2011: £1.1m).
The most prominent increase in debt is accredited to Aberdeen, followed closely by Hearts. The increase in debt of the Pittodrie side to £16.5m (2011: £14.7m) is attributable to increased external debt levels with Aberdeen Asset Management no longer being a related party of the club. Hearts continue to hold the undesirable position at the top of the SPL debt table in 2011/12, with debt increasing £1.7m to £25.7m (2011: £24.0m) as a
result of an increase in related party debt being coupled with depleted cash reserves. Hearts also lead the table in interest expenses with interest of £1.5m in the current year representing 43% of the total £3.5m paid across all clubs. The Edinburgh side have no external debt placing continued reliance on its financially distressed parent companies.
The most significant driver of the increase in net debt in 2011/12 is the overall cash reduction of £6.8m due to the increased use of overdraft facilities. The most significant reduction was noted at Celtic, who recorded a £2.6m decrease.
The aging of debt has remained relatively constant with the prior season with the majority, £23.1m, of the current balance being due to the parent company of Hearts. It should be noted that post year end £15.0m of this debt was transferred to another related party of Hearts, AB Ukio Bankas, with an extended maturity date.
This resulted in a shift in the composition of external to connected debt with 39% (2011: 8%) of debt being internal. This signifies either a saturation of available external debt, or that clubs are showing a preference to connected debt due to stricter financial restrictions.
14 Turbulent times ahead | PwC
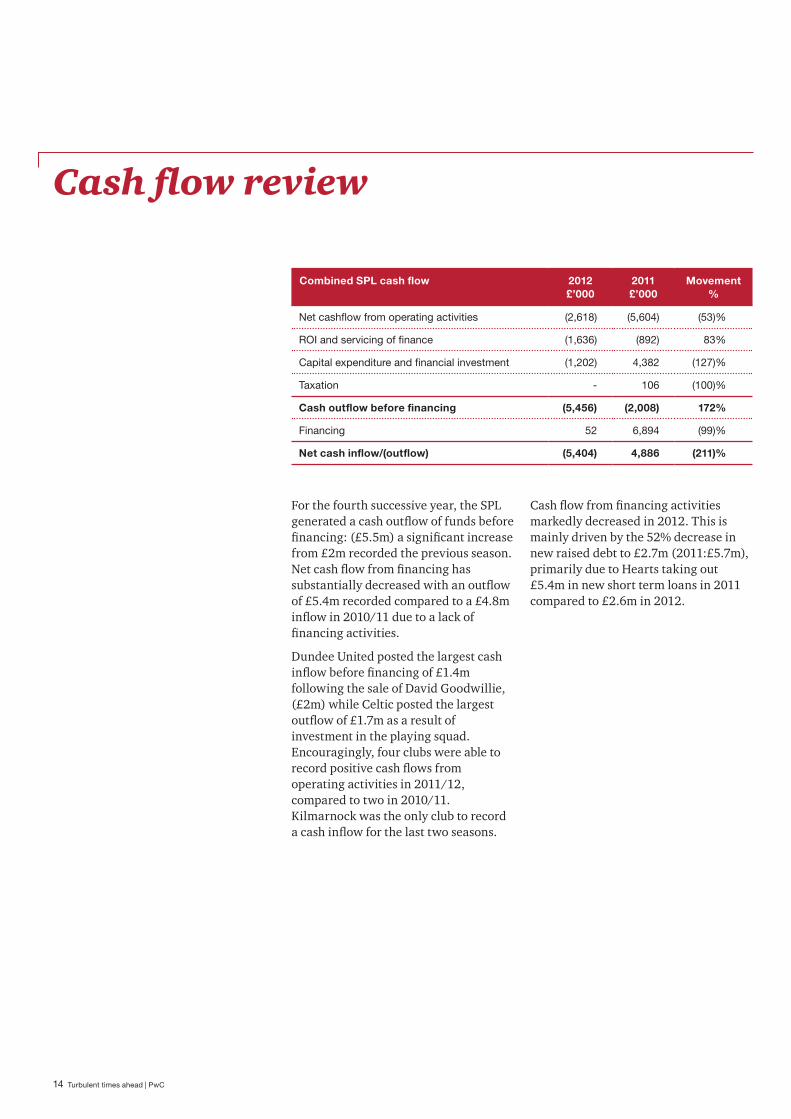
For the fourth successive year, the SPL generated a cash outflow of funds before financing: (£5.5m) a significant increase from £2m recorded the previous season. Net cash flow from financing has substantially decreased with an outflow of £5.4m recorded compared to a £4.8m inflow in 2010/11 due to a lack of financing activities.
Dundee United posted the largest cash inflow before financing of £1.4m following the sale of David Goodwillie, (£2m) while Celtic posted the largest outflow of £1.7m as a result of investment in the playing squad. Encouragingly, four clubs were able to record positive cash flows from operating activities in 2011/12, compared to two in 2010/11. Kilmarnock was the only club to record a cash inflow for the last two seasons.
Cash flow from financing activities markedly decreased in 2012. This is mainly driven by the 52% decrease in new raised debt to £2.7m (2011:£5.7m), primarily due to Hearts taking out £5.4m in new short term loans in 2011 compared to £2.6m in 2012.
Cash flow review
Combined SPL cash flow 2012 £’000
2011 £’000
Movement %
Net cashflow from operating activities (2,618) (5,604) (53)%
ROI and servicing of finance (1,636) (892) 83%
Capital expenditure and financial investment (1,202) 4,382 (127)%
Taxation - 106 (100)%
Cash outflow before financing (5,456) (2,008) 172%
Financing 52 6,894 (99)%
Net cash inflow/(outflow) (5,404) 4,886 (211)%
15 PwC | Turbulent times ahead
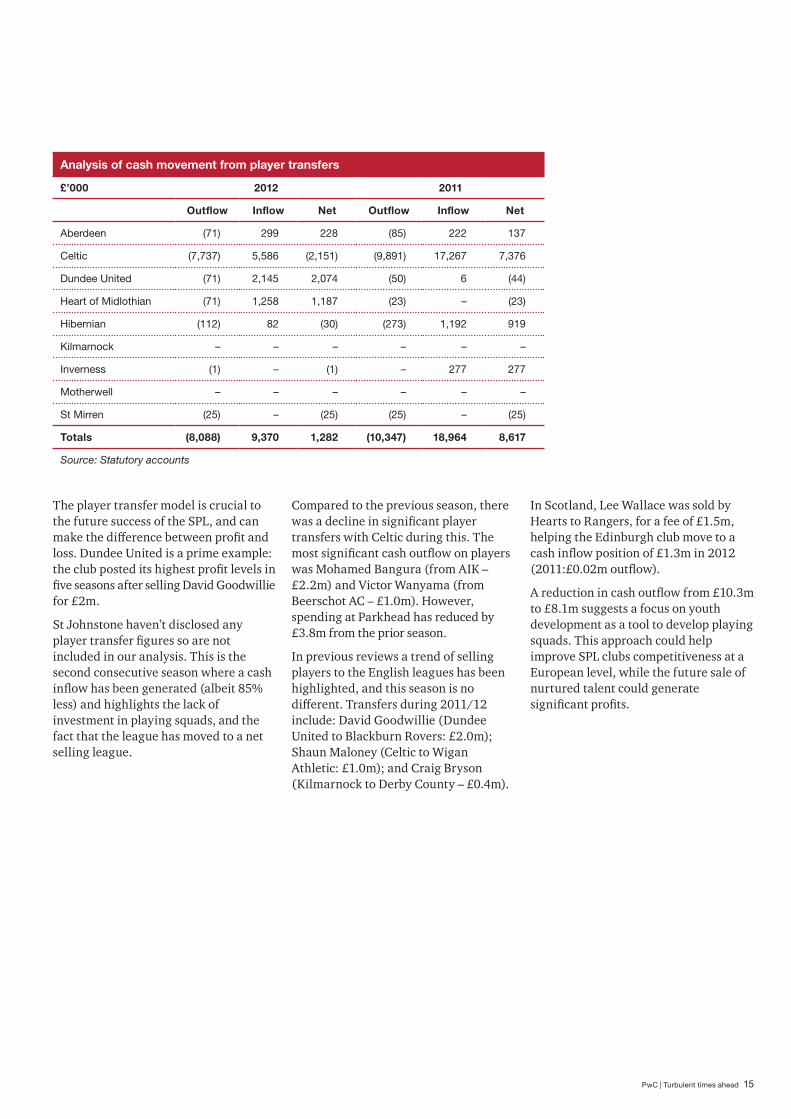
The player transfer model is crucial to the future success of the SPL, and can make the difference between profit and loss. Dundee United is a prime example: the club posted its highest profit levels in five seasons after selling David Goodwillie for £2m.
St Johnstone haven’t disclosed any player transfer figures so are not included in our analysis. This is the second consecutive season where a cash inflow has been generated (albeit 85% less) and highlights the lack of investment in playing squads, and the fact that the league has moved to a net selling league.
Compared to the previous season, there was a decline in significant player transfers with Celtic during this. The most significant cash outflow on players was Mohamed Bangura (from AIK – £2.2m) and Victor Wanyama (from Beerschot AC – £1.0m). However, spending at Parkhead has reduced by £3.8m from the prior season.
In previous reviews a trend of selling players to the English leagues has been highlighted, and this season is no different. Transfers during 2011/12 include: David Goodwillie (Dundee United to Blackburn Rovers: £2.0m); Shaun Maloney (Celtic to Wigan Athletic: £1.0m); and Craig Bryson (Kilmarnock to Derby County – £0.4m).
In Scotland, Lee Wallace was sold by Hearts to Rangers, for a fee of £1.5m, helping the Edinburgh club move to a cash inflow position of £1.3m in 2012 (2011:£0.02m outflow).
A reduction in cash outflow from £10.3m to £8.1m suggests a focus on youth development as a tool to develop playing squads. This approach could help improve SPL clubs competitiveness at a European level, while the future sale of nurtured talent could generate significant profits.
Analysis of cash movement from player transfers
£’000 2012 2011
Outflow Inflow Net Outflow Inflow Net
Aberdeen (71) 299 228 (85) 222 137
Celtic (7,737) 5,586 (2,151) (9,891) 17,267 7,376
Dundee United (71) 2,145 2,074 (50) 6 (44)
Heart of Midlothian (71) 1,258 1,187 (23) – (23)
Hibernian (112) 82 (30) (273) 1,192 919
Kilmarnock – – – – – –
Inverness (1) – (1) – 277 277
Motherwell – – – – – –
St Mirren (25) – (25) (25) – (25)
Totals (8,088) 9,370 1,282 (10,347) 18,964 8,617
Source: Statutory accounts
16 Turbulent times ahead | PwC
Aberdeen F.C.
“We recognise that the financial challenges presented at Club and Scottish level will demand that we deliver even more talent from our Youth Development system, whilst balancing this with an appropriate cost base that is aligned with the realities of the football industry in Scotland.” Stewart Milne (Chairman) 21 November 2012
P&L OverviewAberdeen posted an improved £1.4m loss in the year to June 2012 (2011:£2.1m loss) due to a combination of increasing revenue, reducing exceptional operating charges and interest paid. While an improvement, the Board still acknowledged the need to enhance on field results in order to regenerate interest from supporters and improve declining attendances.
The Don’s top line revenue increased 11.7% to £8.3m in 2012 (2011:£7.5m), partly due to a successful run to the semi-finals of the Scottish Cup. Turnover was further increased by a rise in the number of revenue streams. Although average attendances remained stable, gate receipts fell 13% to £2.4m (2011:£2.8m). However, improvements across sponsorship, advertising and broadcasting revenue saw a top line improvement of £0.5m offset this fall in ticket sales. Aberdeen also brought the club shop back in-house from mid-June 2011, resulting in a 31% rise in commercial revenue to £3.1m (2011:£2.3m).
Aberdeen reduced their wage bill to £5m (2011:£5.1m) and this combined with an increase in turnover, led to a fall in the all important wage-to-turnover ratio from 68% in 2011 to the sustainable industry benchmark of 60%. For the club to return to profitability it will need to closely monitor this level while exploring other ways to maximise revenue through streams other than gate receipts.
Other operating charges rose to £4.4m (2011:£4.1m) mainly due to the £0.6m additional cost of bringing the club shop back in-house for the first time since 2004. On stripping this one-off item from the analysis, overall costs were down on the prior season. Other notable movements include a fall in exceptional operating charges – £0.1m (2011:£0.4m) due to less contract termination activity and a reduction in interest expense £0.6m (2011:£0.7m).
Balance sheet and cash flowNet debt rose in the season to £16.4m (2011:£14.7m) despite a fall in long term related party loans owed to the Stewart Milne Group £3.8m (2011:£4.8m). Another party loan with Aberdeen Asset Management plc (AAM) was reclassified to ‘Other Loans’, due to AAM no longer being a related party of the club.
The net debt position was also hit by a 48% drop in cash held at the end of the year, down from £1m last season to £0.5m, although net cash flow from operating activities was positive at slightly less than £0.1m (2011:£0.3m outflow). Overall, net cash outflow fell to £0.5m (2011:£0.1m outflow) due to capital expenditure and financial investment increasing 47% to £1.1m (2011:£0.8m) and pay rising threefold to £0.6m (2011:£0.2m).
17 PwC | Turbulent times ahead
Five year review
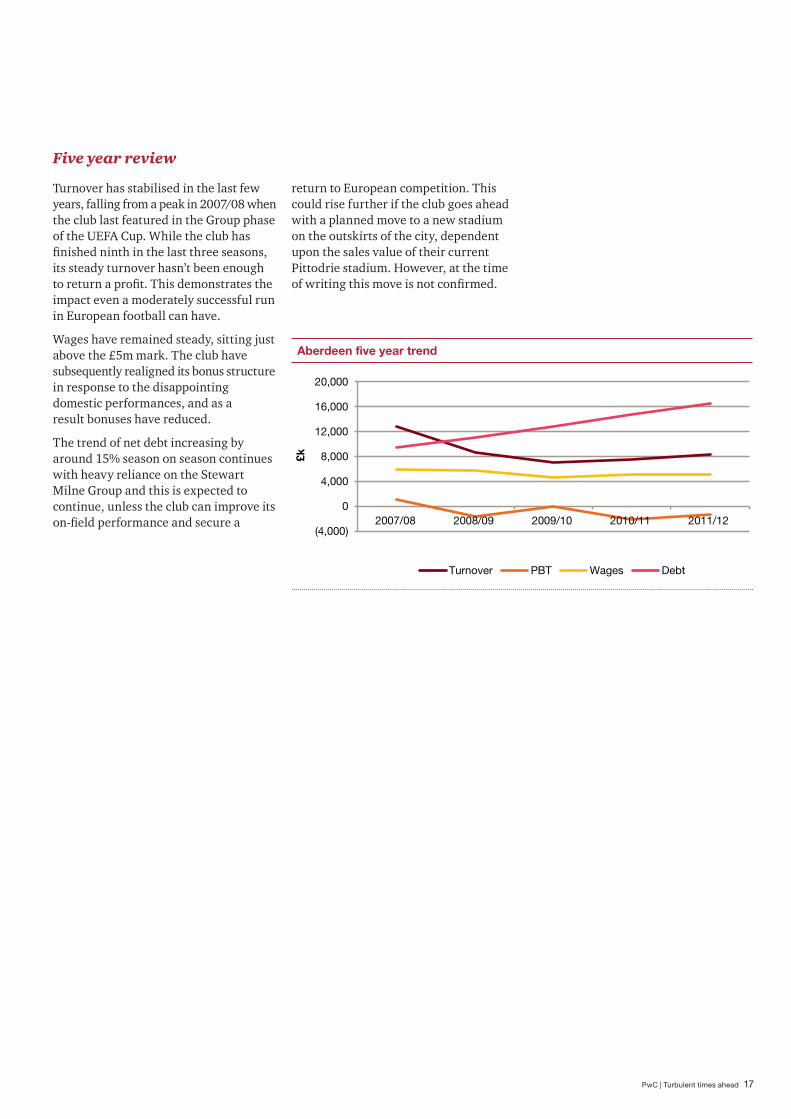
Turnover has stabilised in the last few years, falling from a peak in 2007/08 when the club last featured in the Group phase of the UEFA Cup. While the club has finished ninth in the last three seasons, its steady turnover hasn’t been enough to return a profit. This demonstrates the impact even a moderately successful run in European football can have.
Wages have remained steady, sitting just above the £5m mark. The club have subsequently realigned its bonus structure in response to the disappointing domestic performances, and as a result bonuses have reduced.
The trend of net debt increasing by around 15% season on season continues with heavy reliance on the Stewart Milne Group and this is expected to continue, unless the club can improve its on-field performance and secure a
return to European competition. This could rise further if the club goes ahead with a planned move to a new stadium on the outskirts of the city, dependent upon the sales value of their current Pittodrie stadium. However, at the time of writing this move is not confirmed.
Aberdeen five year trend
(4,000)
0
4,000
8,000
12,000
16,000
20,000
2007/08 2008/09 2009/10 2010/11 2011/12
£k
Turnover PBT Wages Debt
18 Turbulent times ahead | PwC
Celtic F.C.
“Although…the financial outcome for the year ended 30 June 2012 appears disappointing, this was the result of a deliberate policy of retaining key players in order to achieve key strategic objectives…the success gained on the pitch now provides us with greater flexibility than would otherwise have been the case”. Peter Lawwell (Chief Executive) 18 September 2012
P&L OverviewWhile 2011/12 saw Celtic claim their 43rd league title and first in four seasons, the Parkhead side’s financial performance fell short of the club’s on-field success. Falling revenues and rising costs contributed to a £7.4m loss, compared to profit of £0.1m in 2010/11.
Revenue fell 2% to £51.3m (2011:£52.6m), largely attributable to a 6.6% fall in match day revenue from football and stadium operations to £28.9m (2011:£31m), in spite of increased attendance levels at Celtic Park. Average attendances over 24 home matches grew 4% from 49,090 to 50,904. Merchandising revenue also fell £1m to £13.3m, however more encouragingly, against the backdrop of the continuing recession, Celtic were able to demonstrate their commercial strength by growing broadcasting revenues 25% to £9.1m (2011:£7.2m) on the back of increased television income resulting from playing four home European ties in the season (2011/12).
Driven by a desire to win the SPL title and return to the lucrative UEFA Champions League, Celtic invested £5.3m in the first team squad, purchasing players including Wanyama (£1m), Bangura (£2m), Matthews (£0.2m) and Forster (£0.1m).
The club raised £5.6m primarily through the sale of Maloney (£1.0m), Boruc (£2m) and Hooiveld (£0.5m), considerably less than the £13.2m gain 2010/11.
Rising wage costs and bonus payments on the back of the club’s on-field success saw staff costs rise 4% to £33.9m (2011:£32.7m) and consolidated Celtic’s position at the top of the SPL wage table. Coupled with the fall in revenue, the 66% wage-to turnover ratio remains in excess of the recommended 60% (2011:62%). However, the Board is focused on managing this and with an expected increase in revenue during season 2012/13 after featuring in the UEFA Champions League, it’s anticipated that this ratio will fall.
19 PwC | Turbulent times ahead
Celtic five year trend
(20,000)
0
20,000
40,000
60,000
80,000
2007/08 2008/09 2009/10 2010/11 2011/12
£k
Turnover PBT Wages Debt
Balance sheet and cash flowNet debt increased 10% in 2011/12 to £8.1m (2011:£7.4m) as a result of the cash generated from trading and player sales being offset by expenditure on player additions and other capital expenditure. While the club was able to record a net cash inflow from operating activities of £1.3m (2011:£0.7m outflow), a net cash outflow of £2.6m was noted overall, with Celtic’s closing cash balance falling to £8.2m (£10.8m).
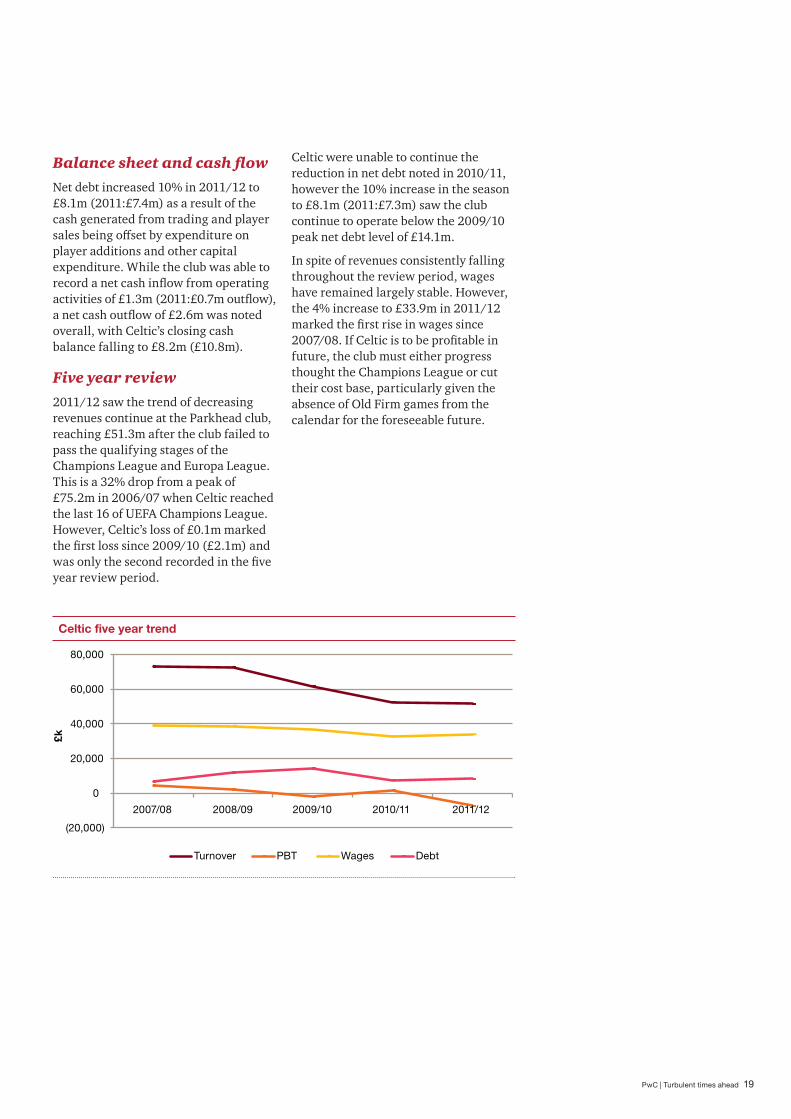
Five year review2011/12 saw the trend of decreasing revenues continue at the Parkhead club, reaching £51.3m after the club failed to pass the qualifying stages of the Champions League and Europa League. This is a 32% drop from a peak of £75.2m in 2006/07 when Celtic reached the last 16 of UEFA Champions League. However, Celtic’s loss of £0.1m marked the first loss since 2009/10 (£2.1m) and was only the second recorded in the five year review period.
Celtic were unable to continue the reduction in net debt noted in 2010/11, however the 10% increase in the season to £8.1m (2011:£7.3m) saw the club continue to operate below the 2009/10 peak net debt level of £14.1m.
In spite of revenues consistently falling throughout the review period, wages have remained largely stable. However, the 4% increase to £33.9m in 2011/12 marked the first rise in wages since 2007/08. If Celtic is to be profitable in future, the club must either progress thought the Champions League or cut their cost base, particularly given the absence of Old Firm games from the calendar for the foreseeable future.

20 Turbulent times ahead | PwC
Dundee United F.C.
“Scottish football in general continues to face challenging economic conditions and this is not anticipated to ease in the foreseeable future. The directors remain focused on aligning the cost base of the company to revenue streams and the nurturing and development of young talent is crucial to the sustainability of the company.” Stephen Thompson (Chairman) 17 October 2012
P&L OverviewMaintaining its on field success of 2010/11, the Dundee side has returned to black, posting profits of £1.4m (2011:loss £0.5m). This is attributable to the gain on disposal of player registrations of £2.1m (2011:loss £0.01m) which includes the sale of David Goodwillie to Blackburn Rovers for £2m, the highest negotiated fee since 1993 when Duncan Ferguson went to Rangers for £4m.
While the bottom line is encouraging, Dundee United posted an increased operating loss of £0.5m (2011:£0.3m) for the second consecutive season, highlighting the important part played by profitable player transfers.
This shift is driven by falling gross profit margins (10% to 9%) and a 3.2% drop in turnover from £5.2m to £5m. A slight reduction in the number of games played by United from 47 to 46 in 2011/12 also impacted revenue despite average home support increasing from 7,389 to 7,482. These results emphasise the significance of aligning the clubs costs with revenue.
Staff costs remained in line with the previous season at £3.8m (2011:£3.8m), however the reduction in the club’s top line has resulted in an increased wage-to-turnover ratio to 76% (2011:74%). The directors have made it a priority to reduce the wage bill and have vowed that costs will be further reduced in the coming season.
Balance sheet and cash flowThe club has slashed its net debt position by 14% in 2011/12 to £5m (2011:£5.9m) by revising its banking facilities during November 2011 coupled with the transfer income from the sale of Goodwillie. A new term loan for £4.6m was negotiated maturing in 2014, which has resulted in the clubs statutory auditors removing the emphasis of matter over going concern which was noted in the clubs previous accounts. The Dundee club is one of three clubs in the SPL to report a net liabilities position. It’s clear that Dundee’s survival is pivotal on the support of the bank and shareholders.
The club still appears to be managing working capital with the use of an overdraft facility. The negative net cash position has increased from c£0.6m to c£0.7m with the overdraft facility of £1m currently being 84% utilised. Current cash flow forecasts show an additional £0.2m of funding is required to meet the day-to day cash needs of the business during the peak months of January to April 2013, which the clubs bank has agreed to provide. Nevertheless, the reduction in the overall net debt position should be viewed as a step in the right direction.
21 PwC | Turbulent times ahead
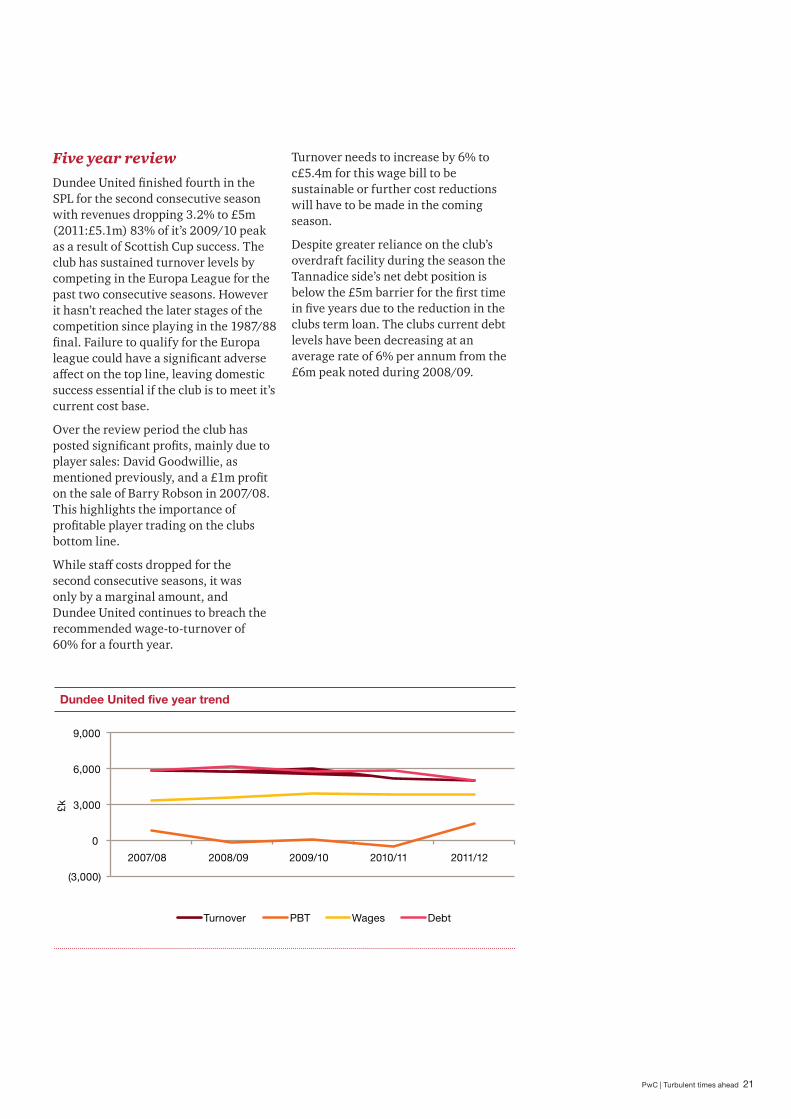
Five year review Dundee United finished fourth in the SPL for the second consecutive season with revenues dropping 3.2% to £5m (2011:£5.1m) 83% of it’s 2009/10 peak as a result of Scottish Cup success. The club has sustained turnover levels by competing in the Europa League for the past two consecutive seasons. However it hasn’t reached the later stages of the competition since playing in the 1987/88 final. Failure to qualify for the Europa league could have a significant adverse affect on the top line, leaving domestic success essential if the club is to meet it’s current cost base.
Over the review period the club has posted significant profits, mainly due to player sales: David Goodwillie, as mentioned previously, and a £1m profit on the sale of Barry Robson in 2007/08. This highlights the importance of profitable player trading on the clubs bottom line.
While staff costs dropped for the second consecutive seasons, it was only by a marginal amount, and Dundee United continues to breach the recommended wage-to-turnover of 60% for a fourth year.
Turnover needs to increase by 6% to c£5.4m for this wage bill to be sustainable or further cost reductions will have to be made in the coming season.
Despite greater reliance on the club’s overdraft facility during the season the Tannadice side’s net debt position is below the £5m barrier for the first time in five years due to the reduction in the clubs term loan. The clubs current debt levels have been decreasing at an average rate of 6% per annum from the £6m peak noted during 2008/09.
Dundee United five year trend
(3,000)
0
3,000
6,000
9,000
2007/08 2008/09 2009/10 2010/11 2011/12
£k
Turnover PBT Wages Debt

22 Turbulent times ahead | PwC
Heart of Midlothian F.C.
“The company continues to be resolute in its belief that the future of the business is dependent on three key factors – developing the best young footballers in the country, building a stadium that is befitting of one of the biggest clubs in the United Kingdom and expanding the supporter base on the club. We remain resolute and due to the commitment of all those associated with the club we are cautiously optimistic about the future of the business.” Sergejus Fedotovas (Director) 8 April 2013
P&L OverviewA combination of the club’s Scottish Cup triumph over Hibernian and participation in European football helped boost topline revenues by 15% to £8.7m (2011:£7.5m), albeit against the backdrop of a 5th place finish in the SPL (2011:3rd). The club remains, for the seventh consecutive season, the most supported Scottish club outside the Old Firm, although it saw stadium utilisation dip to 76% (2011:81%).
Hearts profited from the sale of Lee Wallace and Eggert Janssion (£2m), but despite this still posted a £1.7m loss (2011:profit £0.23m).
During the season, the club was hit with £1.2m of costs for an HMRC settlement for PAYE and NIC payments on players on loan from FBK Kaunas (FBK), although this was more than offset by exceptional income from a breach of contract between the club and FBK for player transfers of £2.9m. It appears the main issue is the club’s cost base, which continues to be unsustainable despite it’s revenue potential. It should be noted that although the club has again posted an operating loss, this is an improvement on the previous season at £5m (2011:£6.7m).
For the third successive season the club reduced its wage bill by 6.3% from £8.8m to £8.2m. With staff numbers remaining fairly constant, this achievement highlights management’s commitment to lowering its cost base. It has also shaved 21% off its wage-to-turnover ratio through a combination of a reduced wage spend and an increase in revenue, although at 95%, the club remains the highest in the league. This is a step in the right direction and is the first time revenue has exceeded staff costs since 2004/05. However with the club posting another operating loss there is a long way to go to satisfy the break-even requirement of the new UEFA financial fair play regulations and reach the desired 60% wage to turnover ratio.
Balance sheet and cash flowNet debt decreased for the second consecutive year from £26.4m to £25.7m. The club continues to be heavily reliant on its parent company, UAB Ukio Banko Investicine Grupe (UBIG), for short-term financial support with the majority of debt, £23.2m (2011:£22.4m), being current and relating to UBIG. The amounts due to mature during 2012/13 however the term of the loan has been extended until at least March 2015. The club is also in the undesirable position of being in an insolvent position and continues to lead the SPL net debt table.
The club’s auditors raised an emphasis of matter over going concern due to its reliance on UBIG and related parties to continue to trade and its ongoing cash flow difficulties. UBIG have also confirmed that it will not be providing any additional funding to the club; however Hearts did make a payment of £0.1m during the season to UBIG. The cash flow difficulties mentioned by the club’s auditors are evident as the Tynecastle side have continued to post a number of significant operating losses in recent seasons as well as a net cash outflow of £3.5m (2011:£5.1m) and an overdraft facility of £2.4m (2011:£2.3m).
During the season, £2.7m (2011:£4.8m) was advanced to the club from UBIG however this was mitigated by £2.9m being offset against a balance due from FBK to UBIG. Overall, £2.9m was borne by FBK. Post year end, £15m owed by the club to UBIG was transferred from UBIG to AB Ukio Bankas, due for repayment by December 2015 with fixed security over Tyncastle and the floating charge over assets also being transferred. In February 2013 AB Ukio Bankas entered into administration, meaning the £15m owed by the club could be called up leading to further financial strain.
23 PwC | Turbulent times ahead
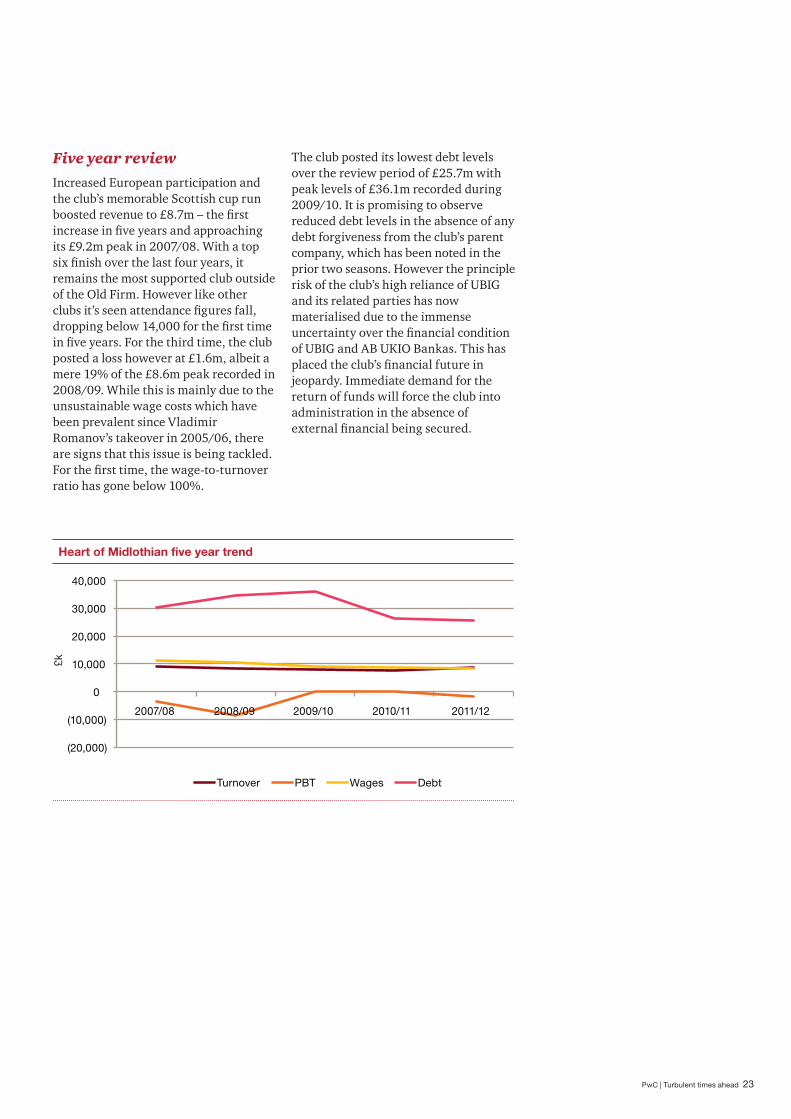
Five year reviewIncreased European participation and the club’s memorable Scottish cup run boosted revenue to £8.7m – the first increase in five years and approaching its £9.2m peak in 2007/08. With a top six finish over the last four years, it remains the most supported club outside of the Old Firm. However like other clubs it’s seen attendance figures fall, dropping below 14,000 for the first time in five years. For the third time, the club posted a loss however at £1.6m, albeit a mere 19% of the £8.6m peak recorded in 2008/09. While this is mainly due to the unsustainable wage costs which have been prevalent since Vladimir Romanov’s takeover in 2005/06, there are signs that this issue is being tackled. For the first time, the wage-to-turnover ratio has gone below 100%.
The club posted its lowest debt levels over the review period of £25.7m with peak levels of £36.1m recorded during 2009/10. It is promising to observe reduced debt levels in the absence of any debt forgiveness from the club’s parent company, which has been noted in the prior two seasons. However the principle risk of the club’s high reliance of UBIG and its related parties has now materialised due to the immense uncertainty over the financial condition of UBIG and AB UKIO Bankas. This has placed the club’s financial future in jeopardy. Immediate demand for the return of funds will force the club into administration in the absence of external financial being secured.
Heart of Midlothian five year trend
(20,000)
(10,000)
0
10,000
20,000
30,000
40,000
2007/08 2008/09 2009/10 2010/11 2011/12
Turnover PBT Wages Debt
£k
24 Turbulent times ahead | PwC
Hibernian F.C.
“The Club’s financial results mirror its disappointing performance on field of play, as the club incurred a bottom line loss for the year due to falling revenues and the lack of transfer income. The reduction in turnover was a consequence of the Club finishing in 11th place in the SPL, and the difficulty in generating commercial income in the current economic climate.” Jamie Marwick (Finance Director) 30 August 2012
P&L Overview Despite cup revenues increasing during 2011/12, a drop in average attendances meant the top line fell £0.1m to £6.9m. primarily due to a 16% fall in average attendances. This fall is disappointing following the Board’s decision to increase the stadiums capacity during the previous season. This had a detrimental impact on stadium utilisation, which at 49% is the third lowest in the SPL – and certainly not the return on investment the Board had hoped for.
The results were also affected by a lack of revenue from player transfer activity, with 2010/11 revenues enjoying the benefits of the sale of Anthony Stokes to Celtic for a fee of £1.2m.
Overall, the club posted a second successive loss, of £1m (2011:£0.9m). Steps have been taken to address the continued operating losses in 2011/12 with staff costs falling £0.7m to £4.1m (2011:£4.8m) directly decreasing the operating loss by 48%. In order to prevent further drastic cost savings, on field performances will need to improve to encourage fans back through the turnstiles and prevent further future losses.
Balance sheet and cash flowNet debt increased £0.9m during the season to £6.4m (2011:£5.5m) due to a combination of the club’s operating performance coupled with season 2011/12 being the first to trigger the repayment of the loan facility following the redevelopment of the East Stand. This impacted cash reserves by 51% from £2m to £1m. In addition, the fall in net cash outflow from operating activities to £0.2m (2011:£0.5m) substantiates the clubs commitment to reducing its cost base.
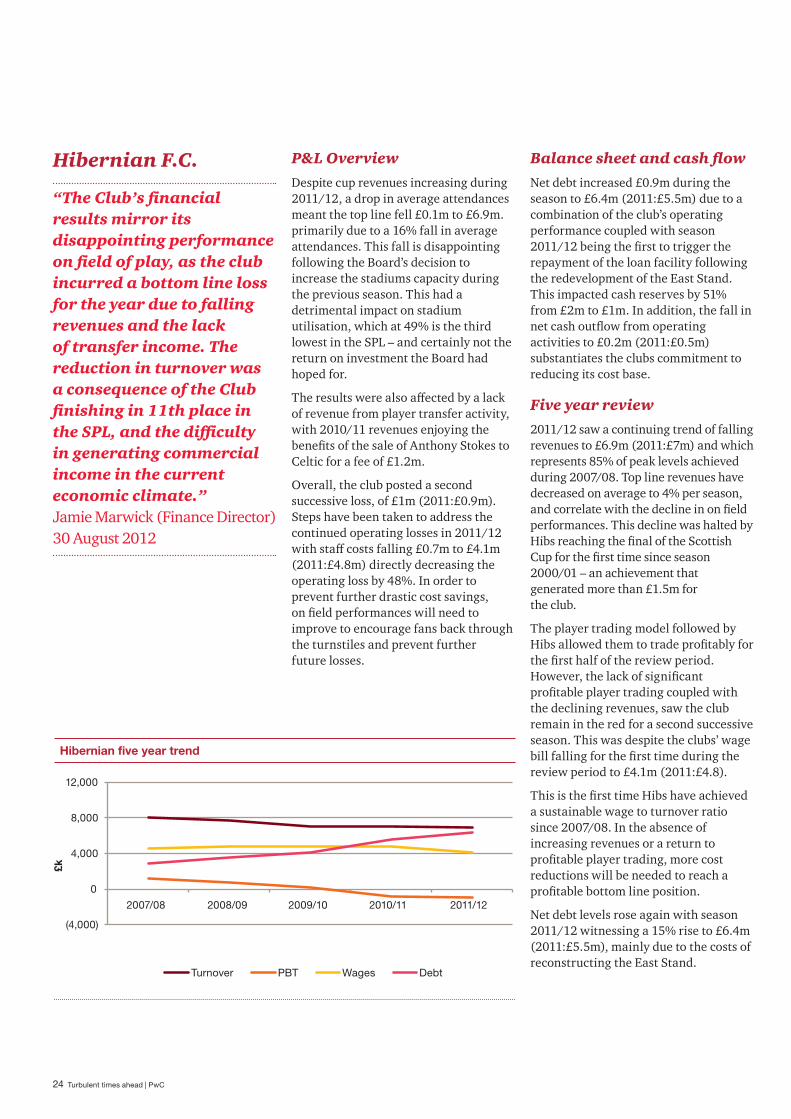
Five year review 2011/12 saw a continuing trend of falling revenues to £6.9m (2011:£7m) and which represents 85% of peak levels achieved during 2007/08. Top line revenues have decreased on average to 4% per season, and correlate with the decline in on field performances. This decline was halted by Hibs reaching the final of the Scottish Cup for the first time since season 2000/01 – an achievement that generated more than £1.5m for the club.
The player trading model followed by Hibs allowed them to trade profitably for the first half of the review period. However, the lack of significant profitable player trading coupled with the declining revenues, saw the club remain in the red for a second successive season. This was despite the clubs’ wage bill falling for the first time during the review period to £4.1m (2011:£4.8).
This is the first time Hibs have achieved a sustainable wage to turnover ratio since 2007/08. In the absence of increasing revenues or a return to profitable player trading, more cost reductions will be needed to reach a profitable bottom line position.
Net debt levels rose again with season 2011/12 witnessing a 15% rise to £6.4m (2011:£5.5m), mainly due to the costs of reconstructing the East Stand.
Hibernian five year trend
(4,000)
0
4,000
8,000
12,000
2007/08 2008/09 2009/10 2010/11 2011/12
£k
Turnover PBT Wages Debt
25 PwC | Turbulent times ahead
Inverness Caledonian Thistle F.C.
“With the continued support and co-operation of directors, shareholders, sponsors advertisers and, most of all, our supporters, we look forward to a more positive outcome in the coming accounting period. Given the uncertainties experienced throughout Scottish football over the summer months of 2012, it is pleasing to note that our season ticket revenues for season 2012/13 are currently on budget.” Kenny Cameron (Chairman) 30 August 2012
P&L OverviewInverness posted another loss before tax in season 2011/12 of £0.4m (2011:£0.2m). This was caused by three main factors; a 3% fall in revenue to £3.4m (2011:£3.5m), coupled with a significant increase in non-payroll related operating expenses by 41% to £2.3m (2011:£1.7m), partially offset by a 27% decrease in wages and salaries to £1.5m (2011:£2m). This loss before tax represents a long term trend experienced by the Highland side, which, given the current state of Scottish football, will become increasingly more difficult to turn around, however the introduction of Ross County to the top flight should help with four Highland derbies on 2012/13. Revenue remained relatively stable in season 2011/12, falling 3%, which can be attributed to an 11% increase in average attendances, coupled by a 10th place finish in the SPL (2011:7th place) and only managing to reach the 5th round in the Scottish Cup (2011:Quarter Finals).
Despite a drop in wages and salaries and the wage to turnover ratio falling from 57% to 43%, overall operating expenses rose £3.8m (2011:£3.7m). Given the limited information available from the
financial statements of Inverness, it would appear that the club have reclassified wage costs in the year, with this overall rise due to an increase in physiotherapy costs and other costs related to injuries sustained by first team players, as well as costs linked with the purchase of new players.
Again, net interest was negligible and due to the long term losses experiences by the club, no tax charge was made to the P&L.
Balance sheetEncouragingly, net debt fell in season 2011/12 to £0.3m (2011:£0.4m). Although external debt remained relatively stable, this was offset by an increase in cash held at the year end from £0.1m (2011) to £0.2m (2012).
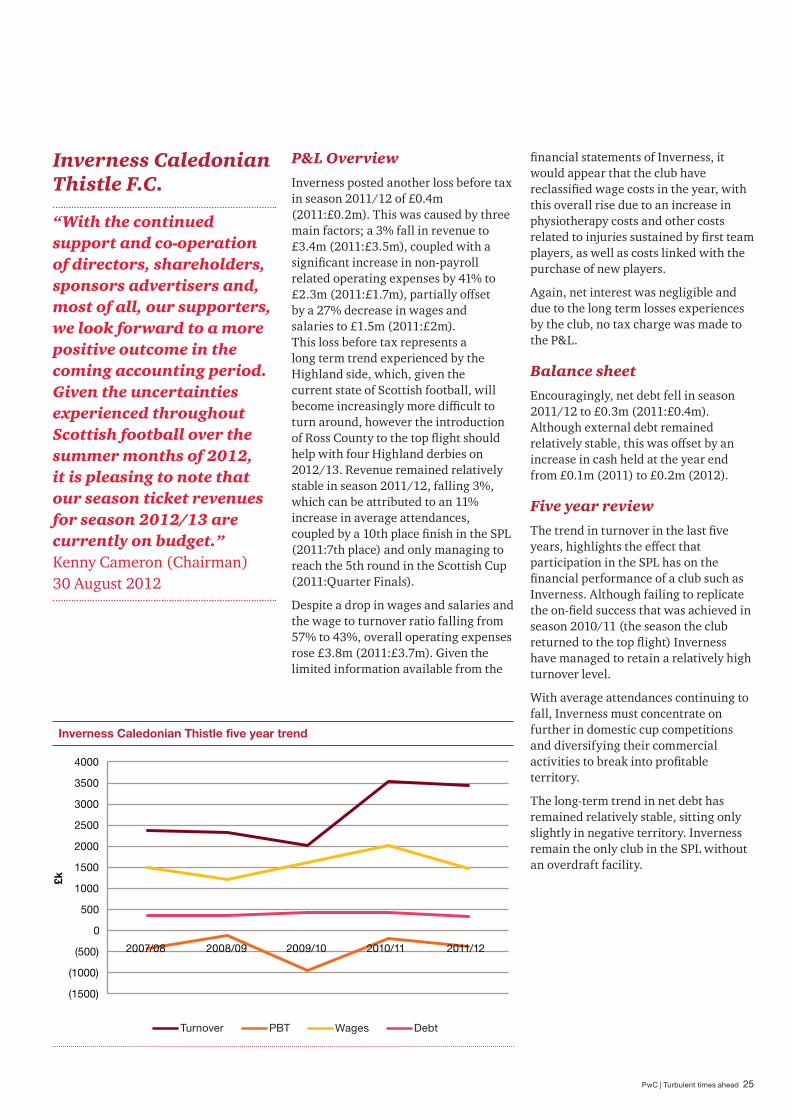
Five year review The trend in turnover in the last five years, highlights the effect that participation in the SPL has on the financial performance of a club such as Inverness. Although failing to replicate the on-field success that was achieved in season 2010/11 (the season the club returned to the top flight) Inverness have managed to retain a relatively high turnover level.
With average attendances continuing to fall, Inverness must concentrate on further in domestic cup competitions and diversifying their commercial activities to break into profitable territory.
The long-term trend in net debt has remained relatively stable, sitting only slightly in negative territory. Inverness remain the only club in the SPL without an overdraft facility.
Inverness Caledonian Thistle five year trend
(1500)
(1000)
(500)
0
500
1000
1500
2000
2500
3000
3500
4000
2007/08 2008/09 2009/10 2010/11 2011/12
£k
Turnover PBT Wages Debt
26 Turbulent times ahead | PwC
Kilmarnock F.C.
“If the year ahead holds the same level of sporting enjoyment and success, we’re all in for a wonderful treat.” Michael Johnston (Chairman) 17 December 2012
P&L OverviewKilmarnock posted profit of £11k in 2012 (2011:£0.2m). Despite increasing turnover to £7.4m (2011:£7.1m), a rise in administrative expenses and interest payable to £0. 3m (2011:£0.1m) coupled with a 44% fall in other operating income to just over £50k, meant the club’s profit fell year on year.
Kilmarnock continue to have four key revenue streams which contributed to a 4% top line increase: football activities, hotel income, the club’s sport bar, and fitness on line. Hotel and sports bar income remained stable year on year at £1.9m and £0.1m respectively, with a slight rise of £5k in fitness. The greatest contributing factor to the increase in revenue was rise in income from football activities to £5.2m (2011:£4.9m). This was driven by Kilmarnock making history by winning the League Cup for the first time, after the clubs sixth League Cup Final, offsetting a 14% fall in average attendances.
With this success came an increase in wages and salaries with staff costs increasing 3% to £3.9m (2011:£3.8m) due to increased appearance and win bonuses associated with the successful cup run. Encouragingly however, due to the proportionately greater increase in turnover, Kilmarnock’s wage to turnover ratio fell 1% to 52%. This illustrates how strong domestic form and monitoring operating costs can reap rewards for SPL clubs. The club’s ability to maintain a wage to turnover ratio below 60% has been a key factor in remaining profitable and reducing net debt.
Balance sheet and cash flowNet debt remained consistent in 2012 at £9.8m (2011:£9.8m) A £0.4m reduction in secured bank loans in the year to £5.5m (2011:£5.9m) was offset by an increase in bank overdraft to £3.3m (2011:£2.7m).
Kilmarnock’s cash position was impacted by a number of negative factors in 2012. A general fall in net cash inflow from operating activities to £0.2m in the year (2011:£1m), an increase in interest payments and the repayment of bank loans all took affect. This left the club with an overall decrease in cash of £0.6m in the year, as opposed to a £0.7m increase in cash in 2011.

27 PwC | Turbulent times ahead
Kilmarnock five year trend
(4,000)
0
4,000
8,000
12,000
16,000
2007/08 2008/09 2009/10 2010/11 2011/12
£ k
Turnover PBT Wages Debt
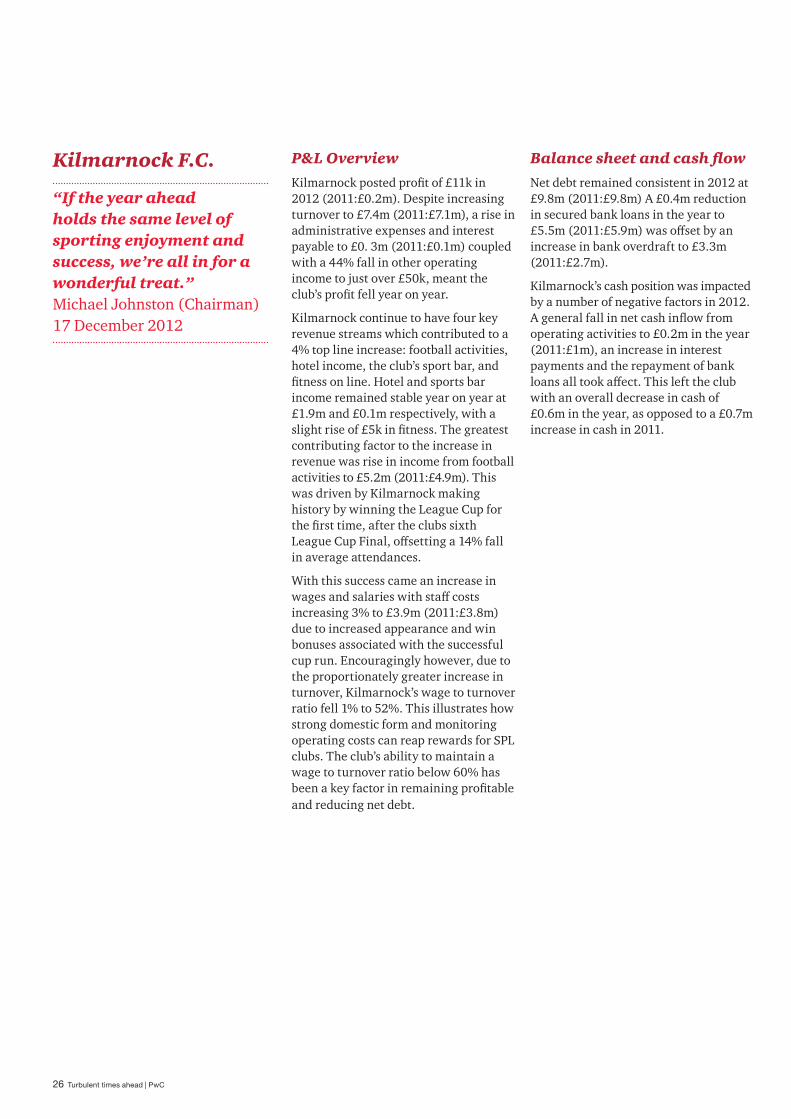
Five year review Turnover continues to recover and remains above the £7m barrier for the second consecutive season. The Ayrshire club’s non-traditional ventures have acted as a steady revenue stream, an impressive feat in the current economic climate. A top five finish in season 2010/11 and the League Cup victory in 2011/12 have contributed to a growth in revenue from football activities. Despite winning domestic honours for the first time since 1997, overall revenue in the year did not exceed the £8m barrier, which it did comfortably in 2007/08. Since then, there has been a dramatic fall in average attendances at Rugby Park, a trend which must be reversed if Kilmarnock are to reach this level of turnover again however this will not be helped by the absence of Rangers FC for the next 3 seasons.
Wages continue to remain around the £4m mark in the year, although slightly bolstered by the additional games played in 2011/12 due to the League Cup victory. The current wage to turnover ratio of 52% is a healthy one, and well within the recommended
60% level, although this must be closely monitored if wages remain steady, attendances continue to fall, and the club fails to replicate its recent domestic success.
The net debt held by Kilmarnock remains relatively high in comparison to other SPL clubs, with the figure staying above £9.8m in the last five years. Although still an improvement on the £13m peak debt level experienced in 2004/05, the current year’s debt burden has begun to show some strain on the club’s financials. The increased interest payments relating to the club’s overdraft increased substantially in the year threatening to bring the club back into the red for the first time since season 2009/10.
28 Turbulent times ahead | PwC
Motherwell F.C.
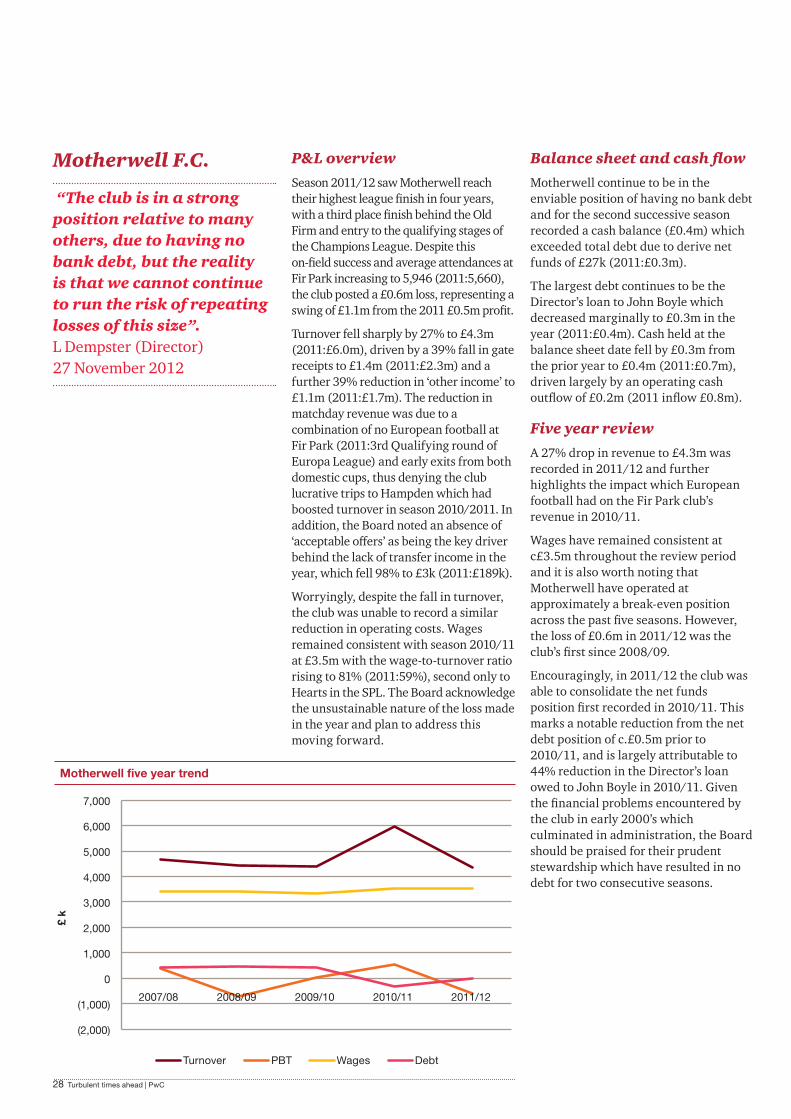
“The club is in a strong position relative to many others, due to having no bank debt, but the reality is that we cannot continue to run the risk of repeating losses of this size”. L Dempster (Director) 27 November 2012
P&L overviewSeason 2011/12 saw Motherwell reach their highest league finish in four years, with a third place finish behind the Old Firm and entry to the qualifying stages of the Champions League. Despite this on-field success and average attendances at Fir Park increasing to 5,946 (2011:5,660), the club posted a £0.6m loss, representing a swing of £1.1m from the 2011 £0.5m profit.
Turnover fell sharply by 27% to £4.3m (2011:£6.0m), driven by a 39% fall in gate receipts to £1.4m (2011:£2.3m) and a further 39% reduction in ‘other income’ to £1.1m (2011:£1.7m). The reduction in matchday revenue was due to a combination of no European football at Fir Park (2011:3rd Qualifying round of Europa League) and early exits from both domestic cups, thus denying the club lucrative trips to Hampden which had boosted turnover in season 2010/2011. In addition, the Board noted an absence of ‘acceptable offers’ as being the key driver behind the lack of transfer income in the year, which fell 98% to £3k (2011:£189k).
Worryingly, despite the fall in turnover, the club was unable to record a similar reduction in operating costs. Wages remained consistent with season 2010/11 at £3.5m with the wage-to-turnover ratio rising to 81% (2011:59%), second only to Hearts in the SPL. The Board acknowledge the unsustainable nature of the loss made in the year and plan to address this moving forward.
Balance sheet and cash flowMotherwell continue to be in the enviable position of having no bank debt and for the second successive season recorded a cash balance (£0.4m) which exceeded total debt due to derive net funds of £27k (2011:£0.3m).
The largest debt continues to be the Director’s loan to John Boyle which decreased marginally to £0.3m in the year (2011:£0.4m). Cash held at the balance sheet date fell by £0.3m from the prior year to £0.4m (2011:£0.7m), driven largely by an operating cash outflow of £0.2m (2011 inflow £0.8m).
Five year reviewA 27% drop in revenue to £4.3m was recorded in 2011/12 and further highlights the impact which European football had on the Fir Park club’s revenue in 2010/11.
Wages have remained consistent at c£3.5m throughout the review period and it is also worth noting that Motherwell have operated at approximately a break-even position across the past five seasons. However, the loss of £0.6m in 2011/12 was the club’s first since 2008/09.
Encouragingly, in 2011/12 the club was able to consolidate the net funds position first recorded in 2010/11. This marks a notable reduction from the net debt position of c.£0.5m prior to 2010/11, and is largely attributable to 44% reduction in the Director’s loan owed to John Boyle in 2010/11. Given the financial problems encountered by the club in early 2000’s which culminated in administration, the Board should be praised for their prudent stewardship which have resulted in no debt for two consecutive seasons.
Motherwell five year trend
(2,000)
(1,000)
0
1,000
2,000
3,000
4,000
5,000
6,000
7,000
2007/08 2008/09 2009/10 2010/11 2011/12
£ k
Turnover PBT Wages Debt

29 PwC | Turbulent times ahead
St Johnstone F.C.
P&L OverviewSeason 2011/12 saw the Perth side competing in Scotland’s top division for the third consecutive season following their promotion from SFL1 in 2009/10. In each of these seasons the Saints have recorded a loss, however in 2011/12 a loss of £0.1m was 37% lower than 2010/11 (£0.2m). Turnover increased 3% to £4.2m (2011:£4.1m) due to increased matchday revenue and prize-money from the club’s 6th place finish (2011:8th).
Following this success of a top 6 finish, attendances rose to 4,170 (2011:3,841). The club was unable to derive any significant revenue from the domestic cup competitions, losing in the third round of the League Cup (2011: quarter finalist) and being eliminated by the eventual winners Hearts in the fifth round of the Scottish Cup (2011: semi finalist).
Encouragingly, St Johnstone was able to couple an increase in turnover with a reduction in wage costs in 2011/12. Wages dropped 14% to £2.3m (2011:£2.7m) with wage-to-turnover ratio reducing substantially to 56% (2011:67%), one of the lowest in the SPL.
Balance sheetSt Johnstone once again consolidated their debt-free position in 2011/12, operating in a net cash position and recording net funds of £1.6m, the highest in the SPL.
Five year review St Johnstone’s 2009/10 promotion to the SPL was the single biggest driver on the club’s financial performance over the five years. Promotion meant an initial 60% rise in turnover with revenues since stabilising above £4m, peaking at £4.2m in the current season. Despite this, the Saints have been unable to record a profit since their SPL return and have suffered losses in each of the last four seasons, the highest in 2008/09 (£0.3m) when the club pursued promotion.
Rising wage costs were reversed in 2011/12 as St Johnstone cut their wage bill for the first time in the review period. The club has operated in a net cash position for each of the last five years, and the Board should be praised for the financial prudence they are demonstrating in increasingly uncertain circumstances.
St Johnstone five year trend
(1,000)
0
1,000
2,000
3,000
4,000
5,000
2007/08 2008/09 2009/10 2010/11 2011/12
£ k
Turnover PBT Wages Cash

30 Turbulent times ahead | PwC
St Mirren F.C.
“At St Mirren we have a different view, yes things are changing, life changes and we must adapt to change, but we are very positive as to the direction of the club both on and off the field of play.” S G Gilmour (Chairman) 21 September 2012
P&L overviewSeason 2011/12 marked St Mirren’s sixth consecutive season in the SPL. However, for the third consecutive season, and the club’s third at St Mirren park, they found themselves in the red, posting a loss of £0.3m (2011:£0.3m). This was despite a 4% increase in turnover to £3.3m (2011:£3.1m) due to increased matchday revenues. Average attendance remained flat at 4,493 (2011:4,449) and the club failed to reach the latter stages of the domestic cup competitions preventing any lucrative trips to Hampden. Commercial revenues fell in the year, largely due to the end of a government scheme training local youths for future employment.
While St Mirren reduced the size of their playing staff in the year to 42 (2011:45), wages increased 4% to £2.3m (2011:£2.2m) resulting in the wage-to – turnover ratio rising marginally to 71% (2011:70%), above the recommended sustainable ratio of 60%.
Balance sheet St Mirren were one of three SPL clubs to finish season 2011/12 in a net funds position, driven by a combination of an increased cash balance of £100k (2011:£10k) and a reduction in debt to £60k (2011:£103k) producing net funds of £40k (2011:net debt £93k). The Board should be praised for their commitment to reducing debt levels leaving the club’s balance sheet in a strong position.
Five year review St Mirren’s 2011/12 turnover of £3.3m was the fourth consecutive season the club recorded revenue in excess of £3m.
Profit before tax peaked at £9.2m in 2007/08, driven largely by the sale of Love Street for £9.2m. In the four seasons following this sale there has been only one recorded profit (£0.9m in 2008/09). Attendances have been stable at c.4,500 for the three years the club have been playing at St Mirren Park, however this remains below the level of 5,410 recorded in the club’s last game at Love Street in 2008/09.
Wages have fallen from the peak levels of 2009/10 when wage costs rose to £3m with a wage-to-turnover ratio of 74%. Wage costs of £2.3m in season 2011/12 represent a 22% reduction from this peak; but St Mirren have consistently exceeded a wage-to-turnover ratio of 70% across the review period.
In comparison to many of their SPL rivals, the Paisley club’s debt levels have been low for the past five seasons following the sale of their former home Love Street, peaking at £253k in 2007/08. Season 2011/12 is only the second season that the club has recorded a net funds position.
St Mirren five year trend
(4,000)
-
4,000
8,000
12,000
2007/08 2008/09 2009/10 2010/11 2011/12
£ k
Turnover PBT Wages Cash

31 PwC | Turbulent times ahead
Appendices
32 Turbulent times ahead | PwC
Appendix one – Significant transfer activity 2011/12
Summer transfers
Date Player Moving From Moving To Fee
1 June 2011 Thompson, Steven Burnley St Mirren Free
9 June 2011 Bryson, Craig Kilmarnock Derby County £350,000
15 June 2011 O’Connor, Garry Barnsley Hibernian Free
23 June 2011 Conway, Craig Dundee United Cardiff City Free
1 July 2011 Wilson, Kelvin Nottingham Forest Celtic Free
9 July 2011 Wanyama, Victor Beerschot AC Celtic £1,000,000
21 July 2011 Wallace, Lee Hearts Rangers £1,500,000
21 July 2011 Sheridan, Cillian CSKA Sofia St Johnstone Loan
25 July 2011 Goian, Dorin Palermo Rangers Undisclosed
3 August 2011 Goodwillie, David Dundee United Blackburn Rovers £2,000,000
10 August 2011 Bougherra, Madjid Rangers Lekhwiya £1,700,000
17 August 2011 Forster, Fraser Newcastle United Celtic Loan
25 August 2011 McKay, Matt Brisbane Roar Rangers £450,000
30 August 2011 Bangura, Mohamed AIK Celtic £2,200,000
31 August 2011 Maloney, Shaun Celtic Wigan Athletic £1,000,000
Winter transfers
Date Player Moving From Moving To Fee
15 November 2011 Neilson, Robert Leicester City Dundee United Free
1 December 2011 Hooiveld, Jos Celtic Southampton Undisclosed
1 January 2012 Lustig, Mikael Rosenborg Celtic Free
1 January 2012 Jónsson, Eggert Hearts Wolverhampton Wanderers
Undisclosed
4 January 2012 Ojamaa, Henrik RoPS Motherwell Free
6 January 2012 Foster, Richard Aberdeen Bristol City Undisclosed
20 January 2012 Imrie, Douglas Hamilton Academical St Mirren £35,000
30 January 2012 Stevenson, Ryan Hearts Ipswich Town Undisclosed
31 January 2012 Jelavić, Nikica Rangers Everton £4,000,000
30 March 2012 Riordan, Derek Shaanxi Chanba St Johnstone Free

33 PwC | Turbulent times ahead

34 Turbulent times ahead | PwC

35 PwC | Turbulent times ahead

www.pwc.co.uk/scotlandThis document has been prepared only for Scottish Premier League and solely for the purpose and on the terms agreed with Scottish Premier League. We accept no liability (including for negligence) to anyone else in connection with this document, and it may not be provided to anyone else.
© 2013 PricewaterhouseCoopers LLP. All rights reserved. In this document, “PwC” refers to the UK member firm, and may sometimes refer to the PwC network. Each member firm is a separate legal entity. Please see www.pwcscotland.com/structure for further details.
130704-160542-SM-OS


![Pwc Uk 2011 Annual Report[1]](https://static.documents.pub/doc/80x56/547fabb1b379597b2b8b5881/pwc-uk-2011-annual-report1.jpg)


