39
PY5020 Nanoscience Scanning probe microscopy
PY5020 Nanoscience
Scanning probe microscopy
Outline
Scanning tunnelling microscopy (STM)
- Quantum tunnelling
- STM tool
- Main modes of STM
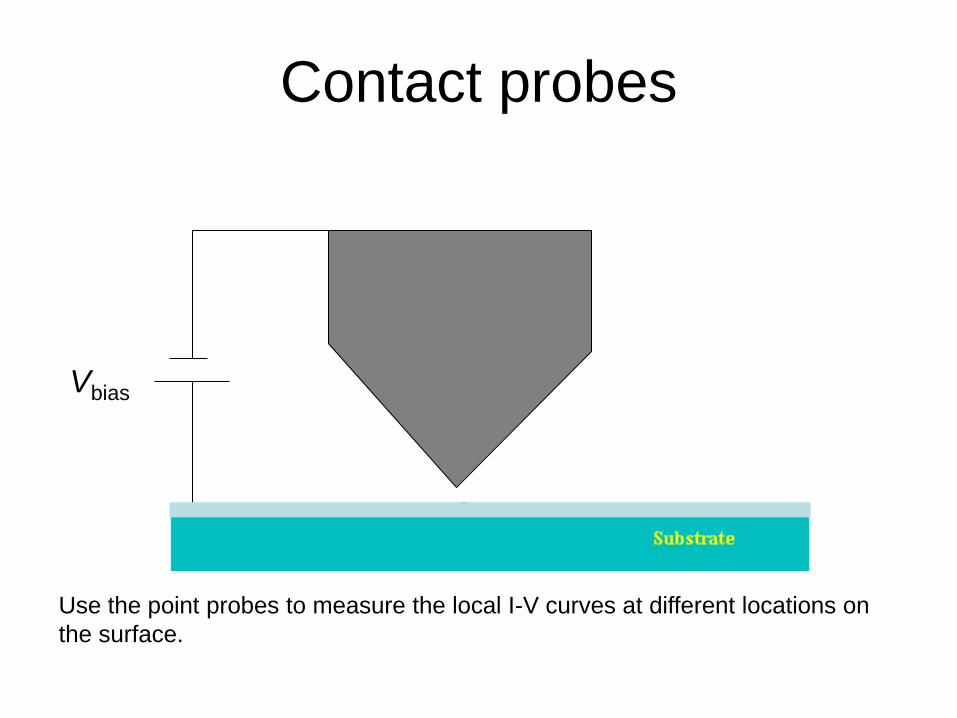
Contact probes
Vbias
Use the point probes to measure the local I-V curves at different locations on
the surface.
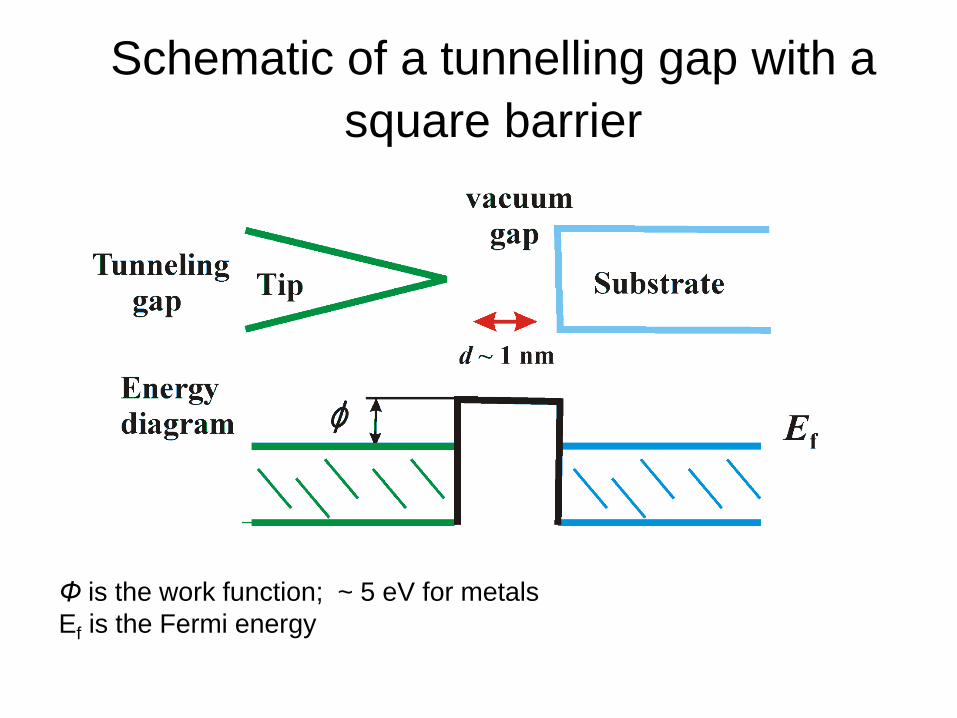
Schematic of a tunnelling gap with a
square barrier
Φ is the work function; ~ 5 eV for metals
Ef is the Fermi energy
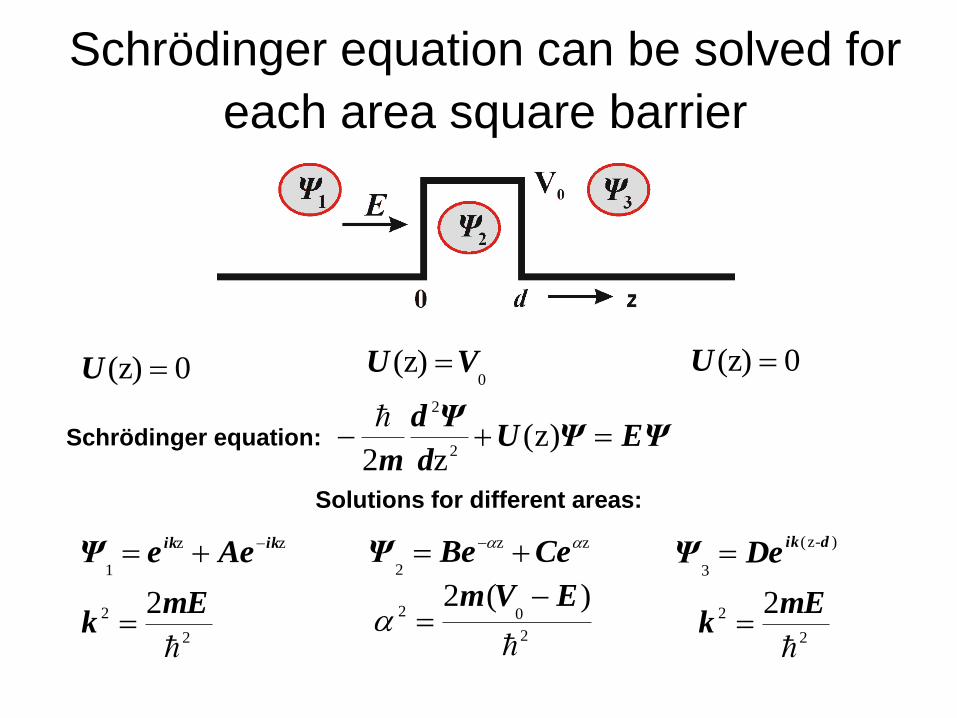
Schrödinger equation can be solved for
each area square barrier
EΨΨUd
Ψd
m )z(
z2 2
2Schrödinger equation:
Solutions for different areas:
zz
1
ikikAeeΨ
zz
2
CeBeΨ )-z(
3
dikDeΨ
0(z) U 0(z) VU 0(z) U
2
2 2
mEk
2
2 2
mEk
2
02)(2
EVm
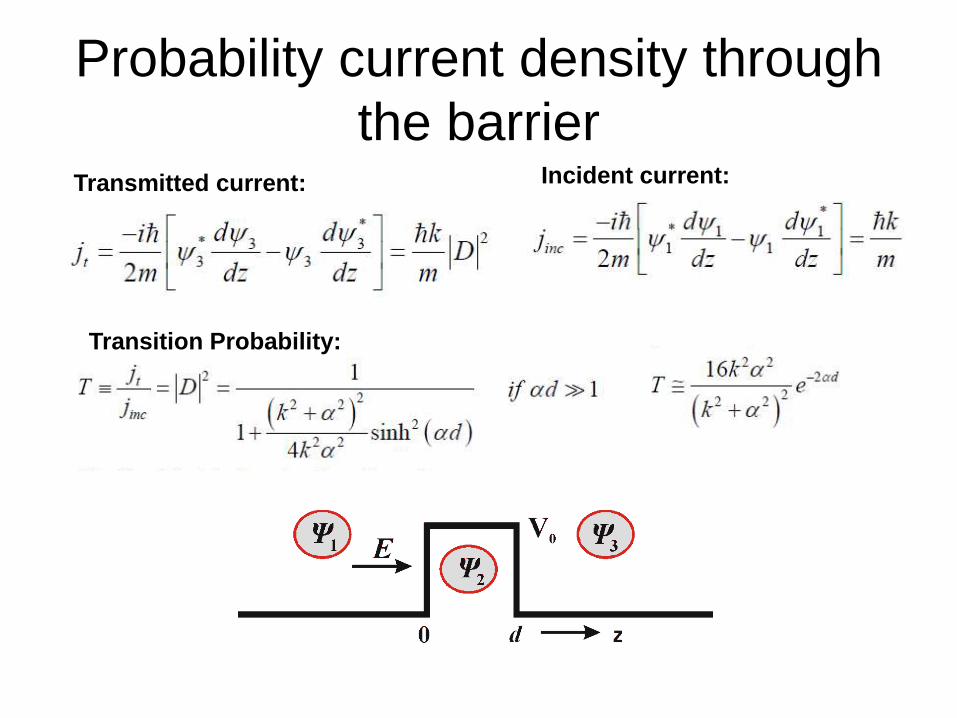
Probability current density through
the barrier Transmitted current:
Transition Probability:
Incident current:
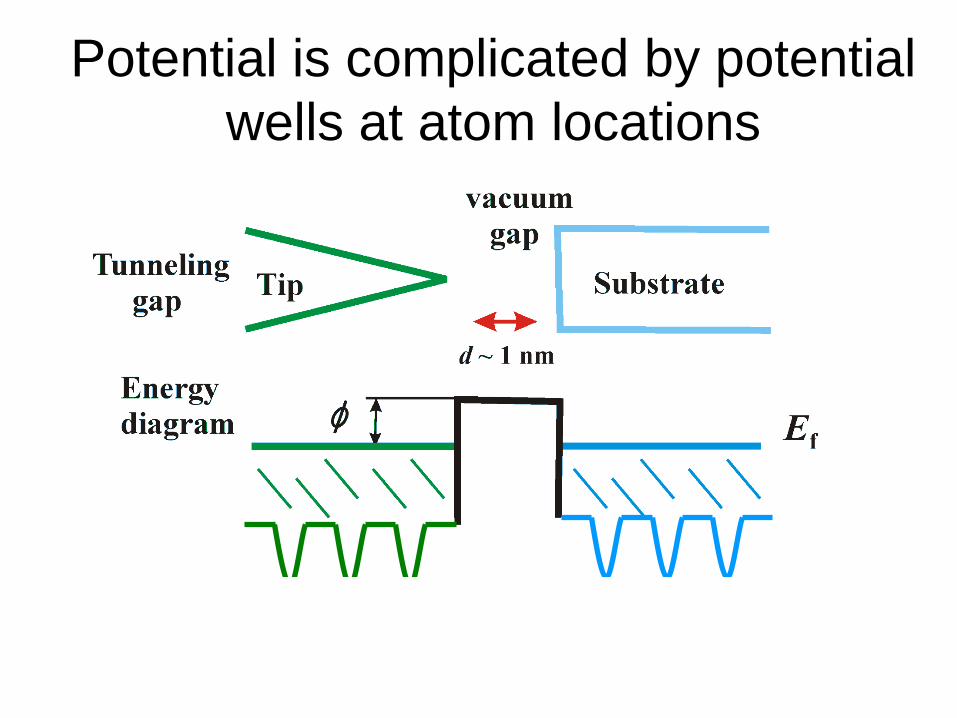
Potential is complicated by potential
wells at atom locations
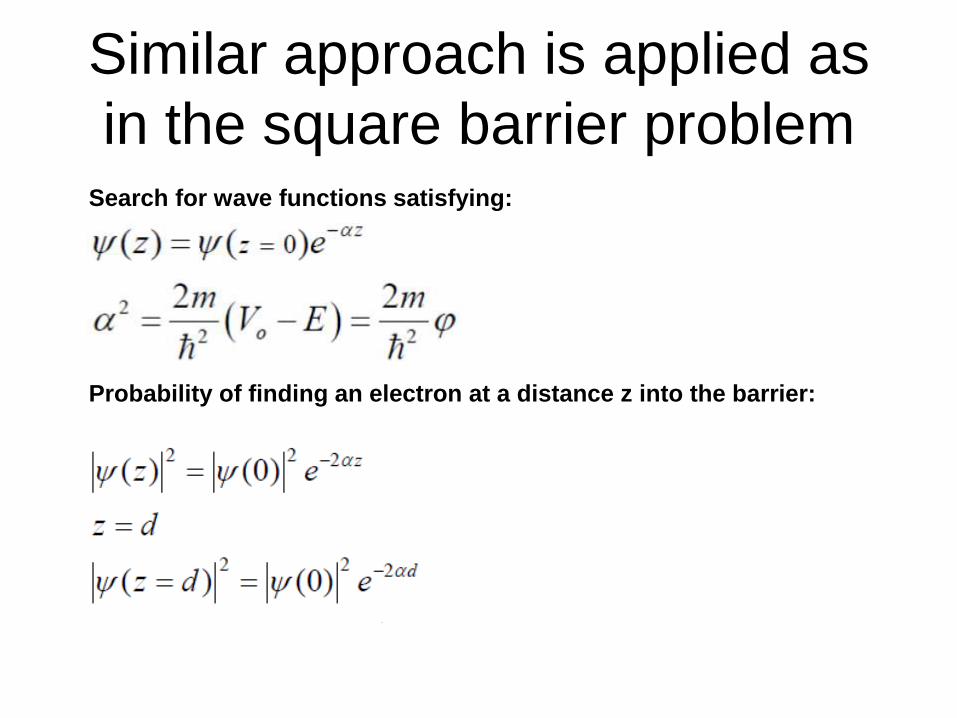
Similar approach is applied as
in the square barrier problem Search for wave functions satisfying:
Probability of finding an electron at a distance z into the barrier:
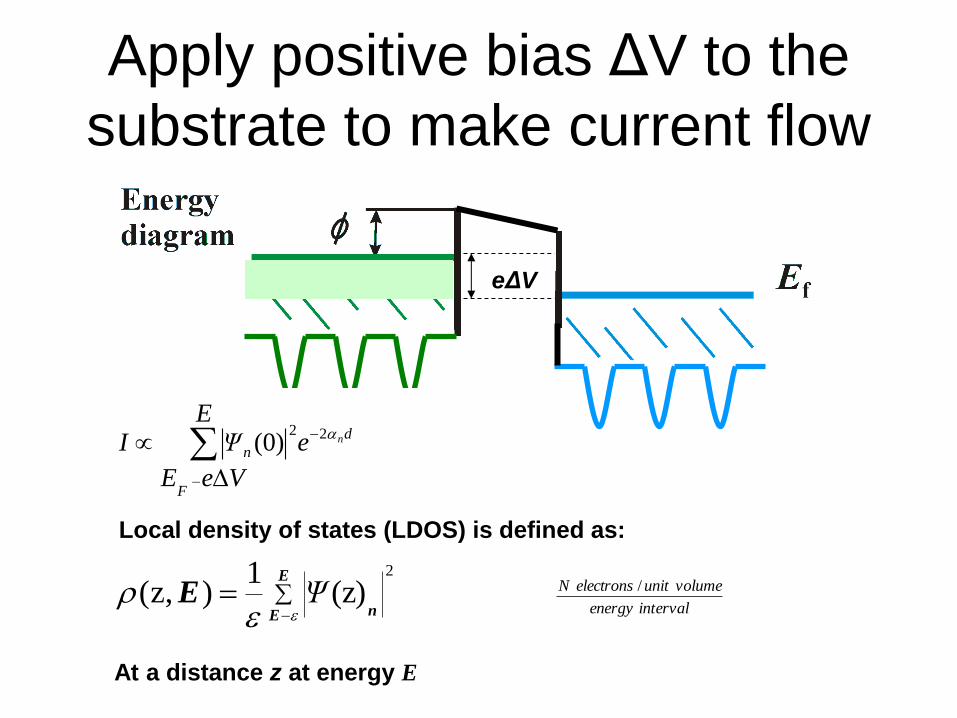
Apply positive bias ΔV to the
substrate to make current flow
eΔV
Local density of states (LDOS) is defined as:
2
(z)1
),z(
E
E nE
Ψ
ervalintenergy
volumeunitelectronsN /
At a distance z at energy E
d
F
nne
E
VeE
ΨI22
(0)
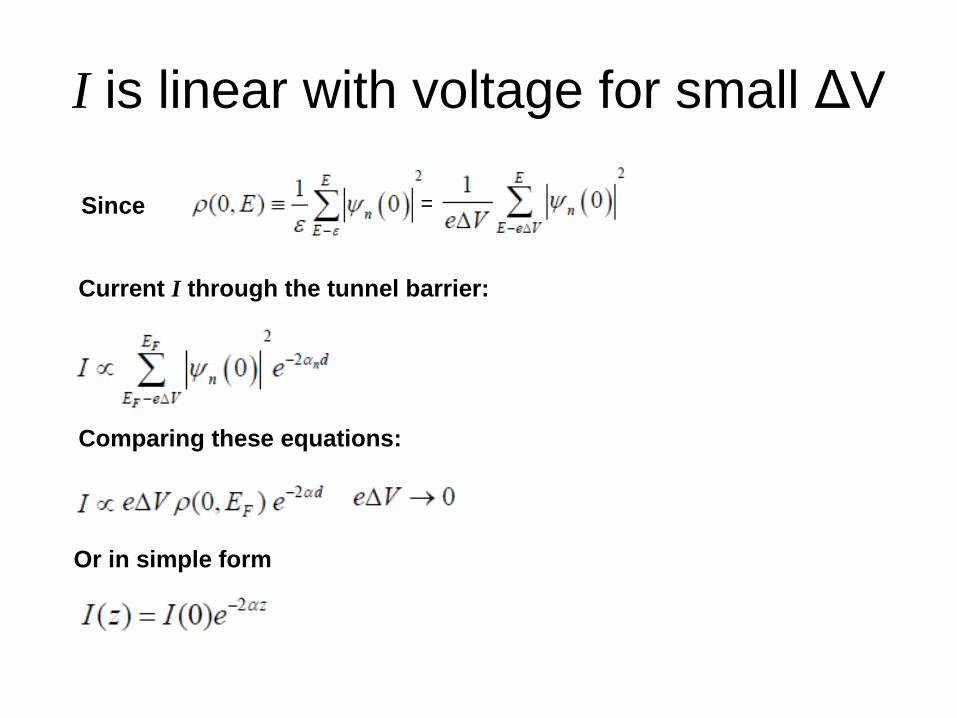
I is linear with voltage for small ΔV
Current I through the tunnel barrier:
Or in simple form
Since =
Comparing these equations:
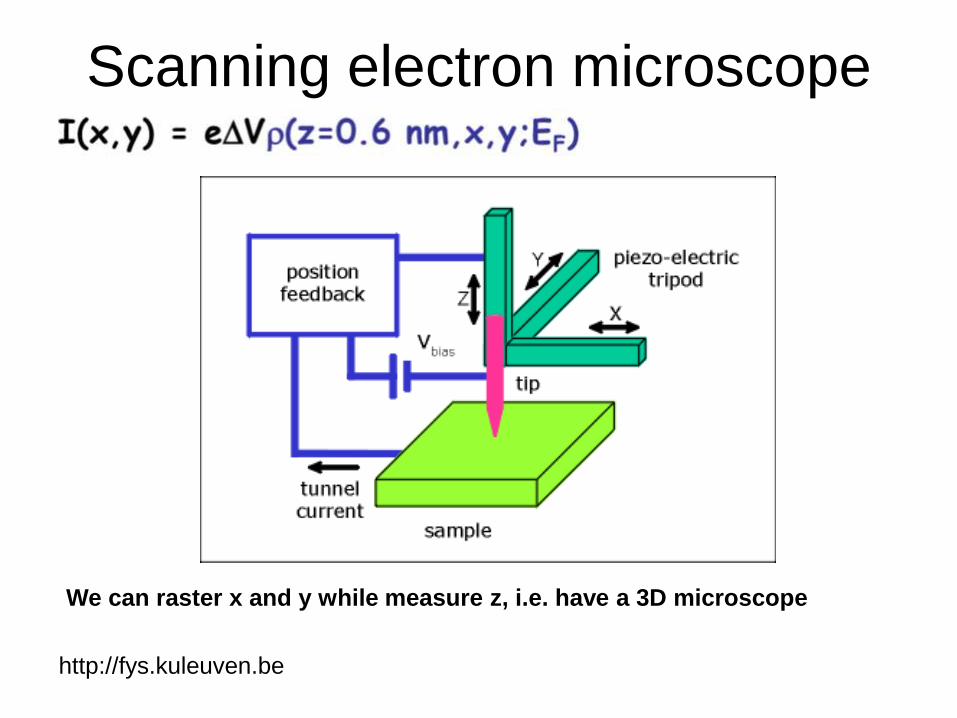
Scanning electron microscope
http://fys.kuleuven.be
We can raster x and y while measure z, i.e. have a 3D microscope
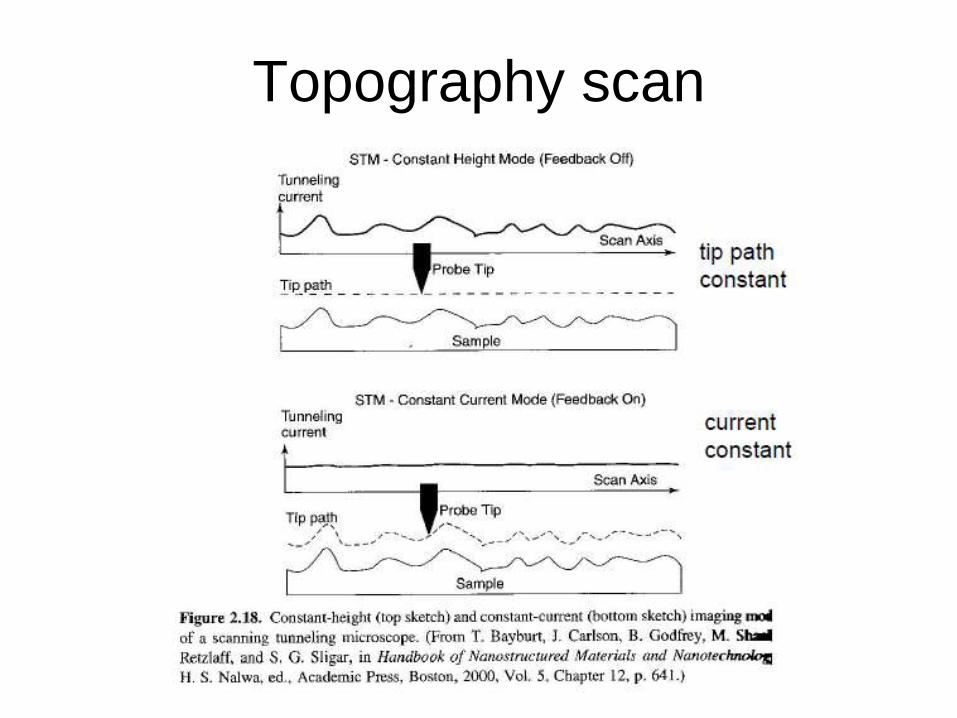
Topography scan
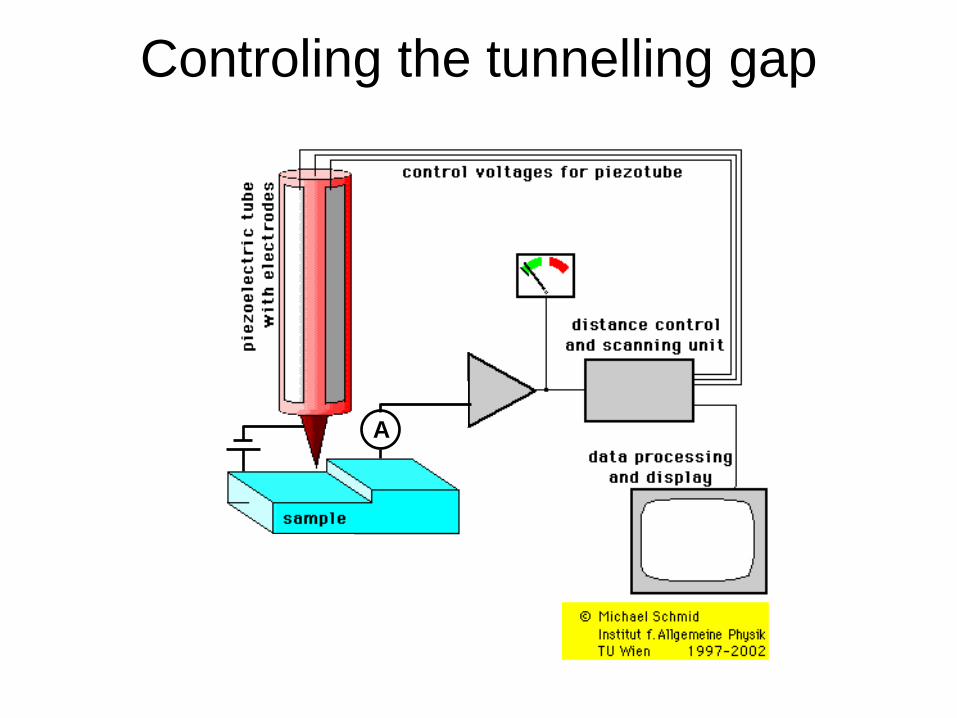
Controling the tunnelling gap
A
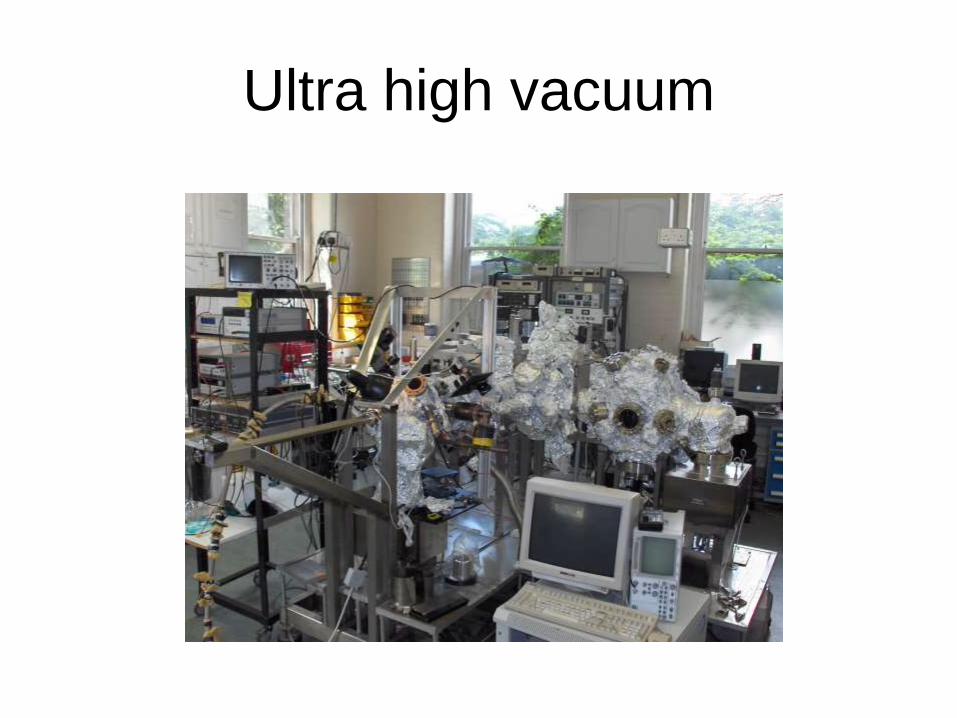
Ultra high vacuum
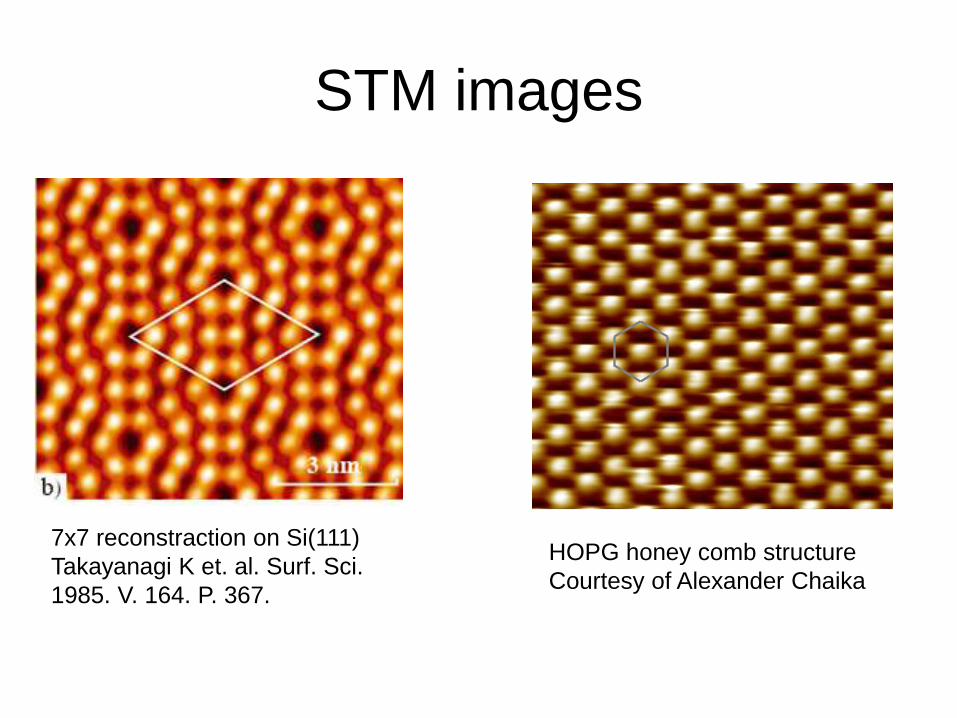
STM images
7x7 reconstraction on Si(111)
Takayanagi K et. al. Surf. Sci.
1985. V. 164. P. 367.
HOPG honey comb structure
Courtesy of Alexander Chaika
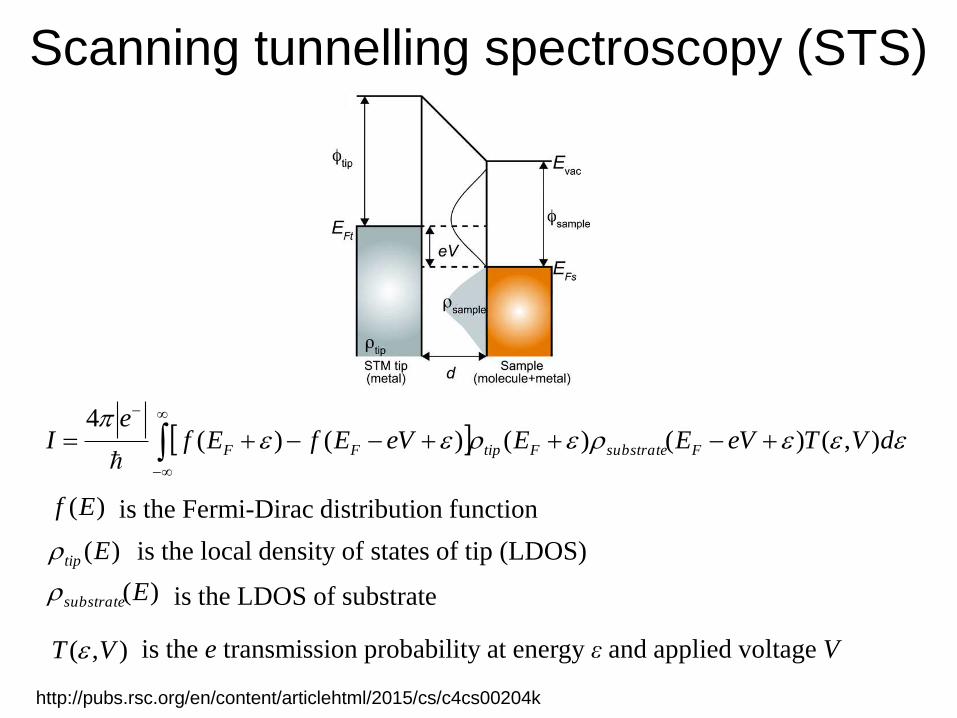
Scanning tunnelling spectroscopy (STS)
http://pubs.rsc.org/en/content/articlehtml/2015/cs/c4cs00204k
dVTeVEEeVEfEfe
I FsubstrateFtipFF ),()()()()(4
)(Ef
)(Etip
)(Esubstrate
),( VT
is the Fermi-Dirac distribution function
is the local density of states of tip (LDOS)
is the LDOS of substrate
is the e transmission probability at energy ε and applied voltage V
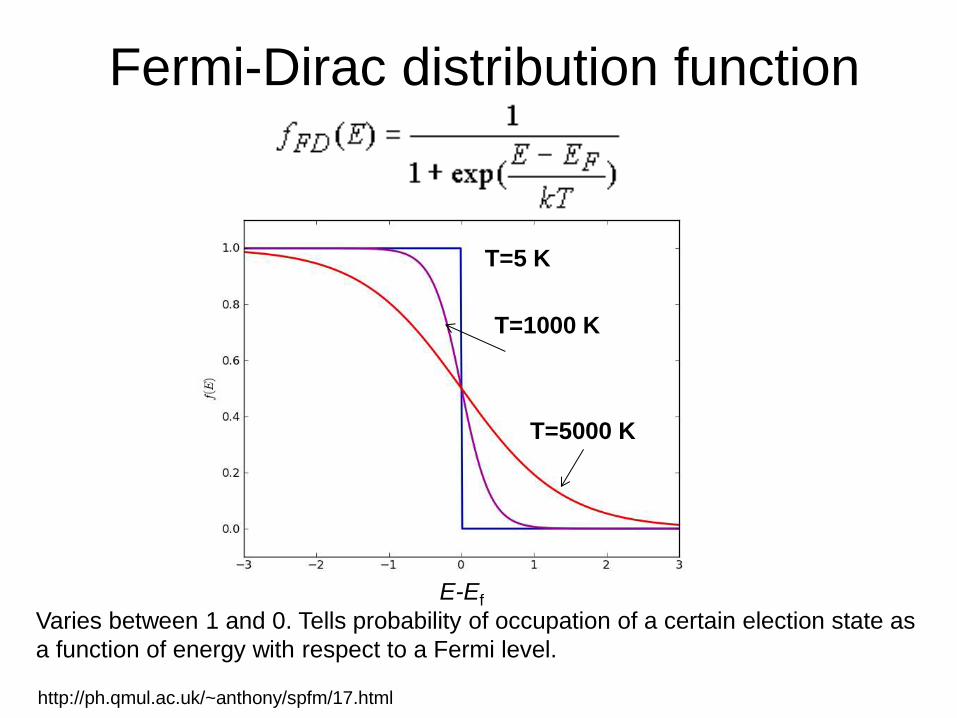
Fermi-Dirac distribution function
Varies between 1 and 0. Tells probability of occupation of a certain election state as
a function of energy with respect to a Fermi level.
http://ph.qmul.ac.uk/~anthony/spfm/17.html
E-Ef
T=5 K
T=1000 K
T=5000 K
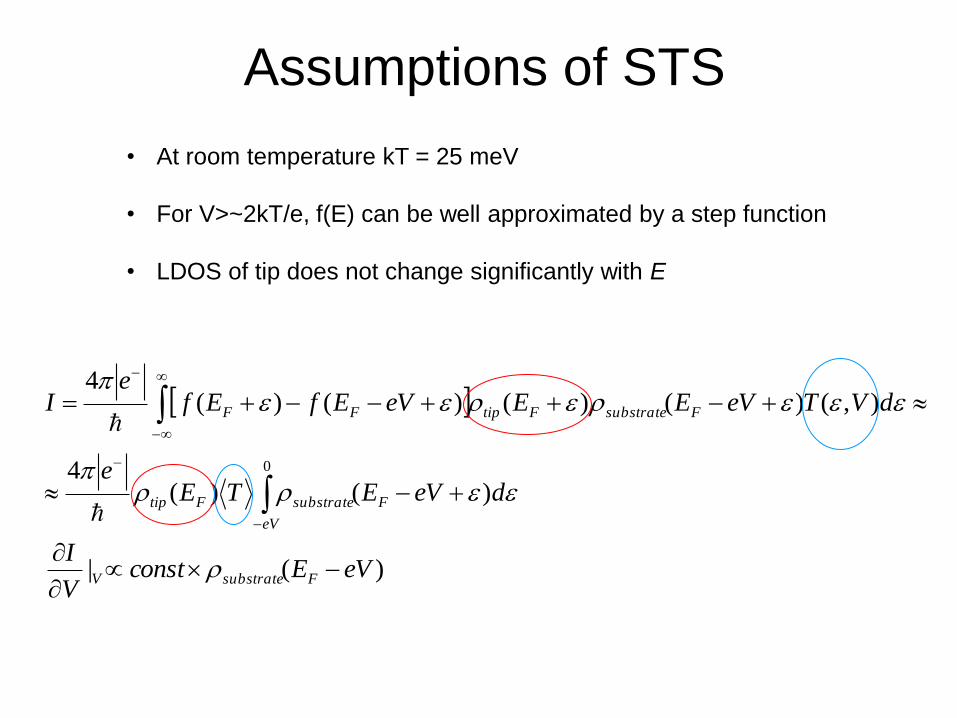
Assumptions of STS
0
)()(4
eV
FsubstrateFtip deVETEe
dVTeVEEeVEfEfe
I FsubstrateFtipFF ),()()()()(4
)(| eVEconstV
IFsubstrateV
• At room temperature kT = 25 meV
• For V>~2kT/e, f(E) can be well approximated by a step function
• LDOS of tip does not change significantly with E
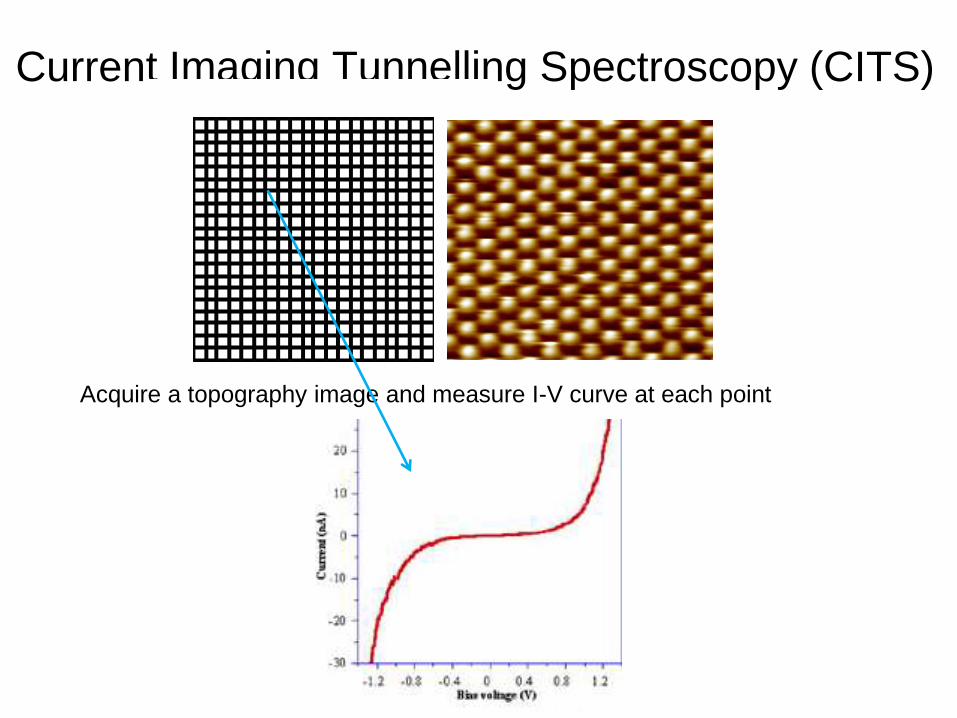
Current Imaging Tunnelling Spectroscopy (CITS)
Acquire a topography image and measure I-V curve at each point
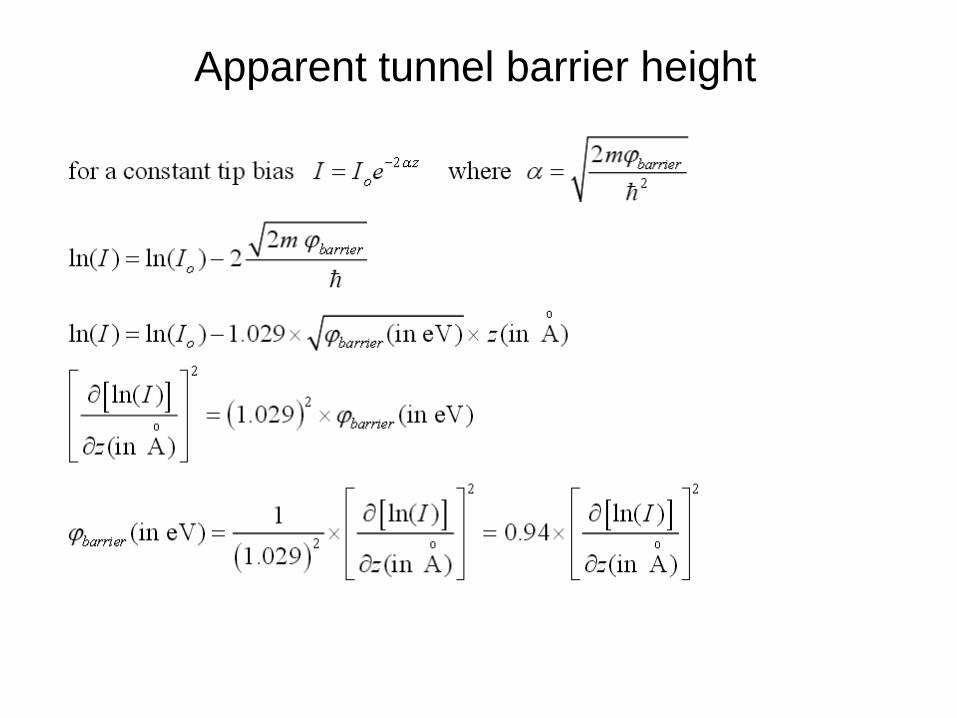
Apparent tunnel barrier height
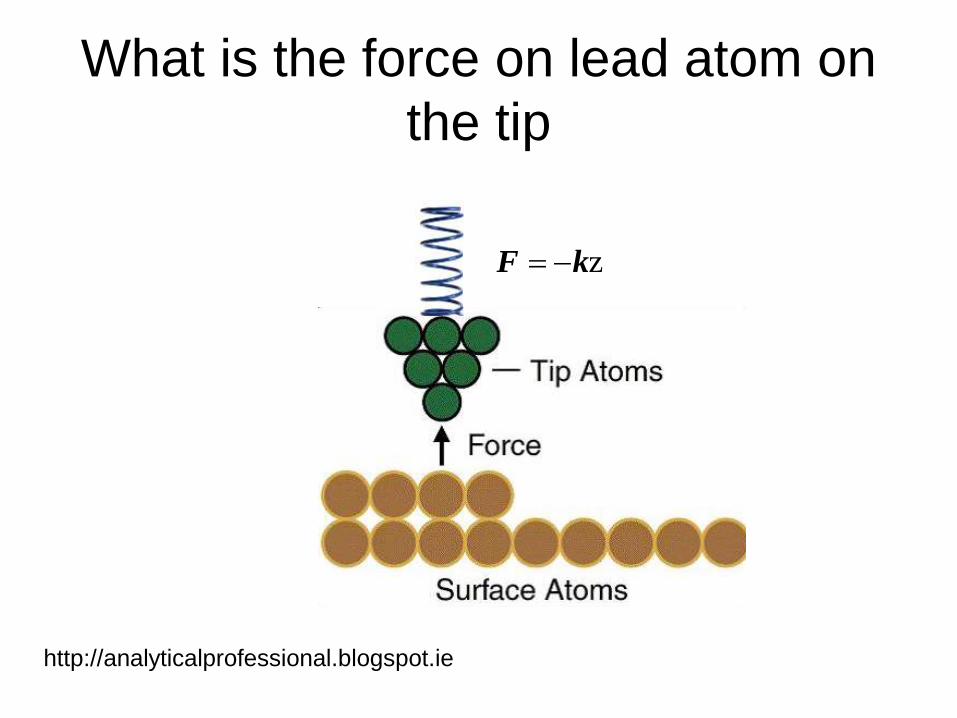
What is the force on lead atom on
the tip
zkF
http://analyticalprofessional.blogspot.ie
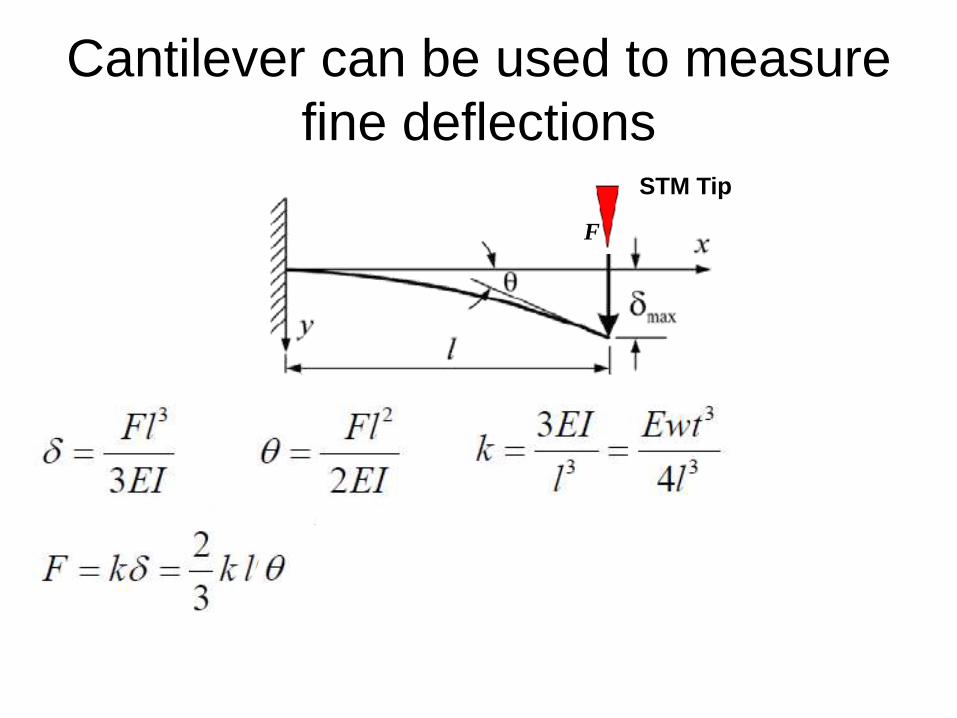
Cantilever can be used to measure
fine deflections
F
STM Tip
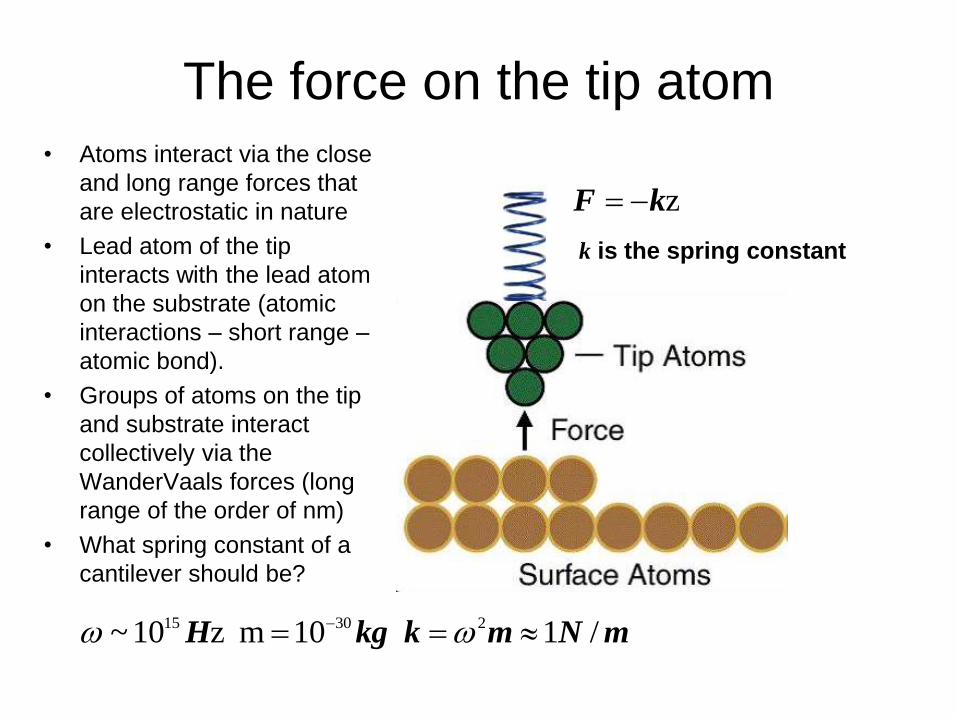
The force on the tip atom
zkF
k is the spring constant
• Atoms interact via the close
and long range forces that
are electrostatic in nature
• Lead atom of the tip
interacts with the lead atom
on the substrate (atomic
interactions – short range –
atomic bond).
• Groups of atoms on the tip
and substrate interact
collectively via the
WanderVaals forces (long
range of the order of nm)
• What spring constant of a
cantilever should be?
mNmkkgH /110m z10~ 23015
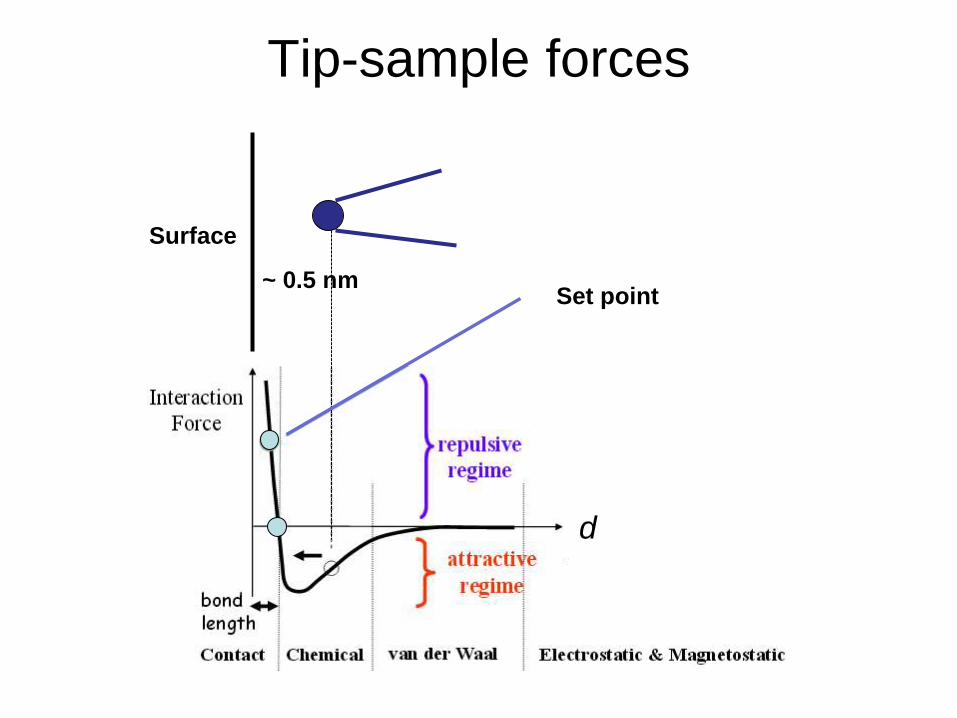
Tip-sample forces
Set point ~ 0.5 nm
Surface
d
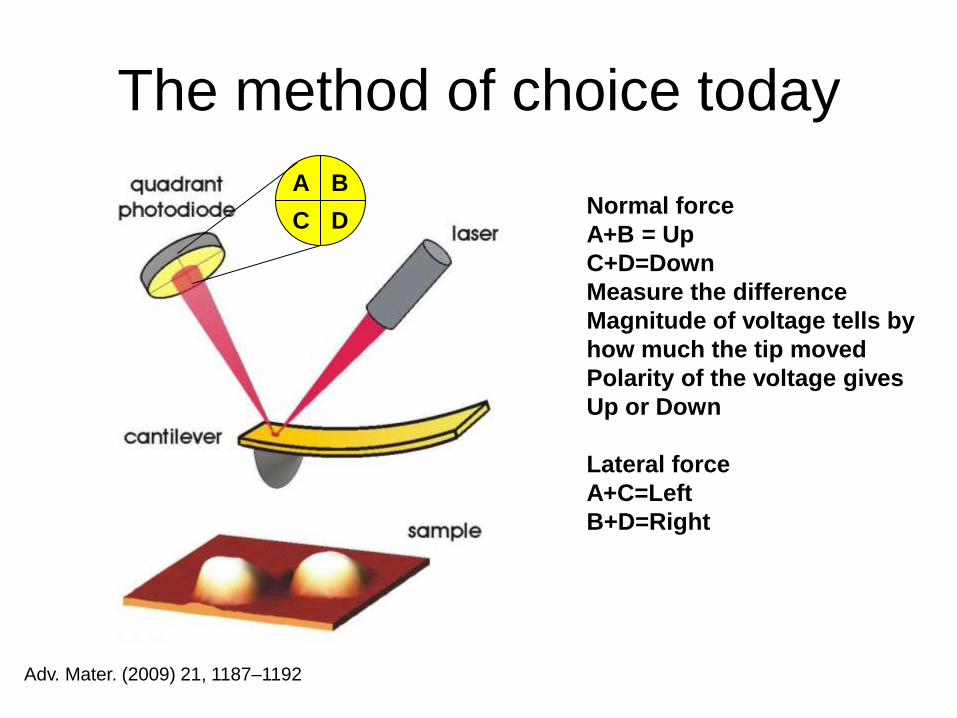
The method of choice today
Adv. Mater. (2009) 21, 1187–1192
Normal force
A+B = Up
C+D=Down
Measure the difference
Magnitude of voltage tells by
how much the tip moved
Polarity of the voltage gives
Up or Down
Lateral force
A+C=Left
B+D=Right
A B
C D
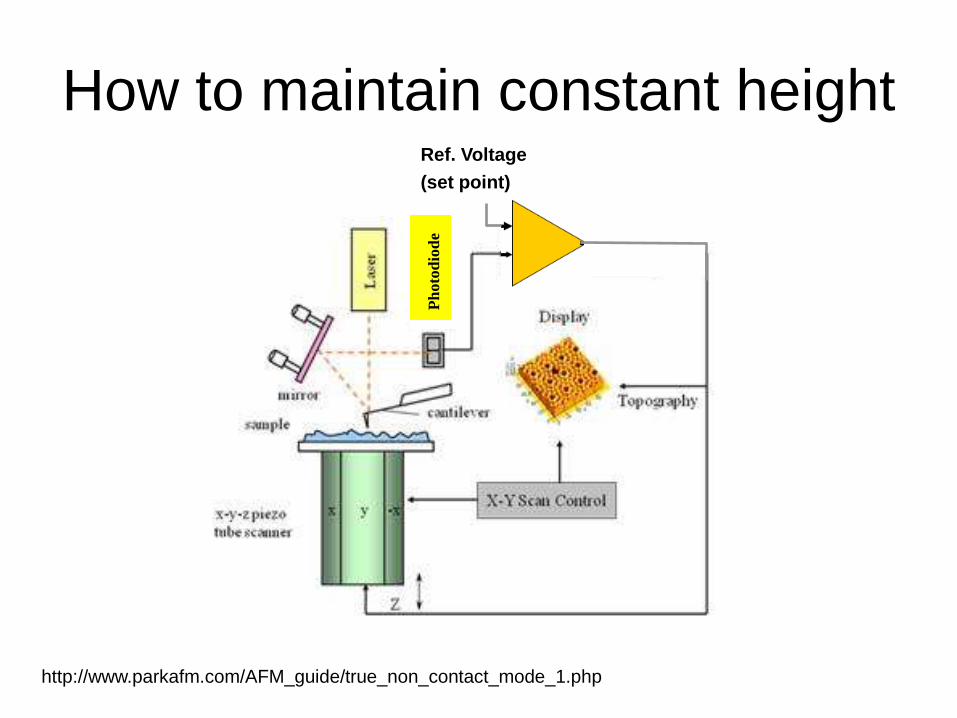
http://www.parkafm.com/AFM_guide/true_non_contact_mode_1.php
Ref. Voltage
(set point)
Ph
oto
dio
de
How to maintain constant height
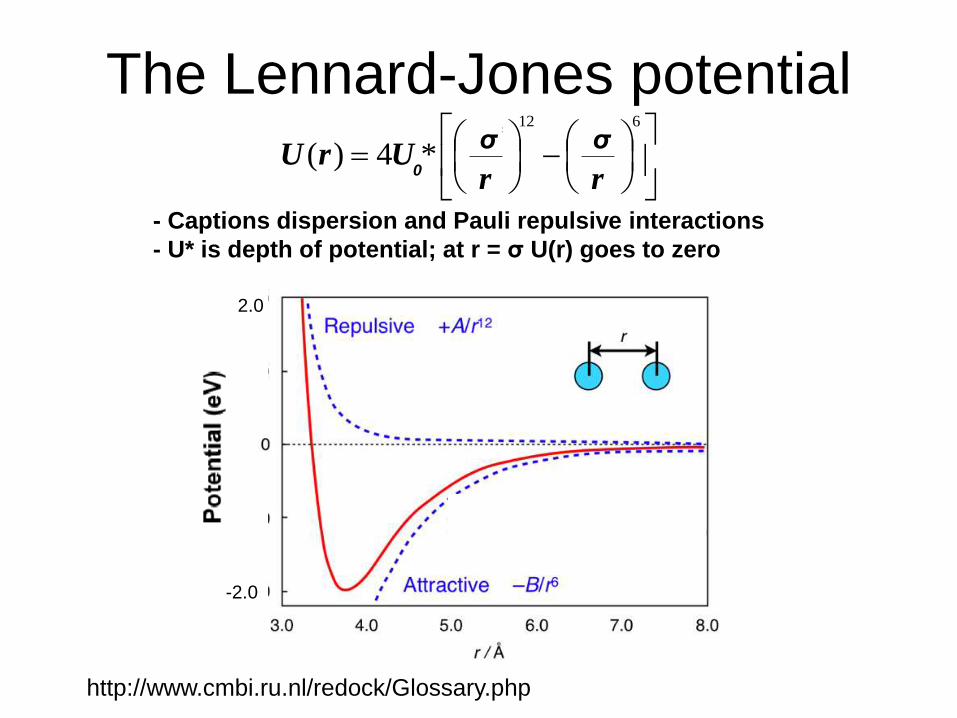
http://www.cmbi.ru.nl/redock/Glossary.php
The Lennard-Jones potential
- Captions dispersion and Pauli repulsive interactions
- U* is depth of potential; at r = σ U(r) goes to zero
612
***4)(
r
r
r
rUrU
-2.0
2.0
0
σ σ
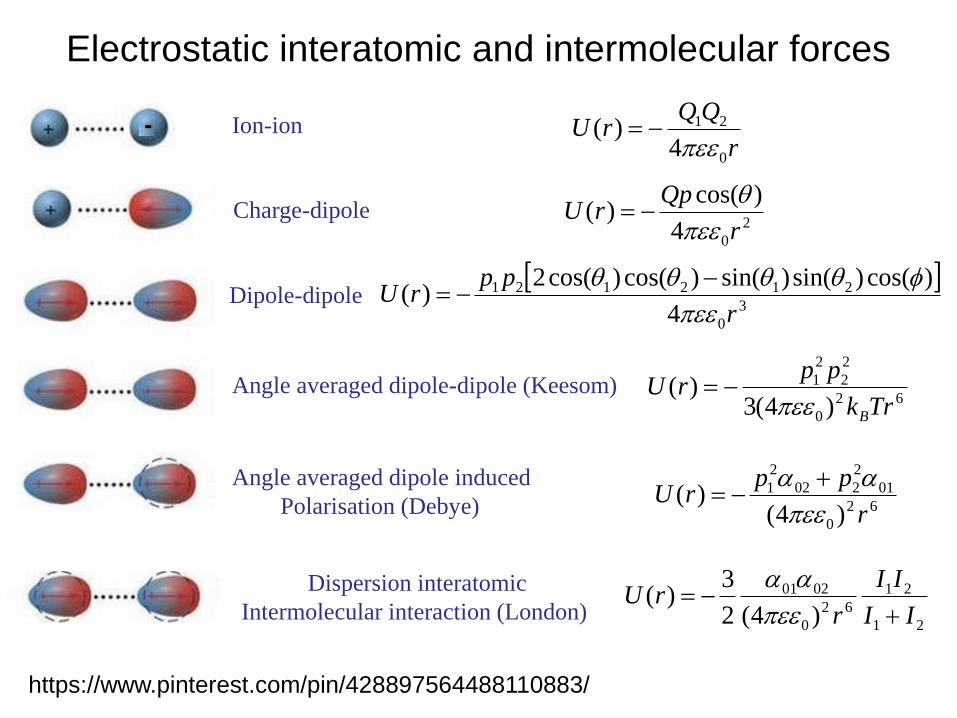
Electrostatic interatomic and intermolecular forces
https://www.pinterest.com/pin/428897564488110883/
2
04
)cos()(
r
QprU
3
0
212121
4
)cos()sin()sin()cos()cos(2)(
r
pprU
Angle averaged dipole-dipole (Keesom)
Angle averaged dipole induced
Polarisation (Debye)
Dipole-dipole
Charge-dipole
- Ion-ion r
QQrU
0
21
4)(
Dispersion interatomic
Intermolecular interaction (London)
62
0
2
2
2
1
)4(3)(
Trk
pprU
B
21
21
62
0
0201
)4(2
3)(
II
II
rrU
62
0
01
2
202
2
1
)4()(
r
pprU
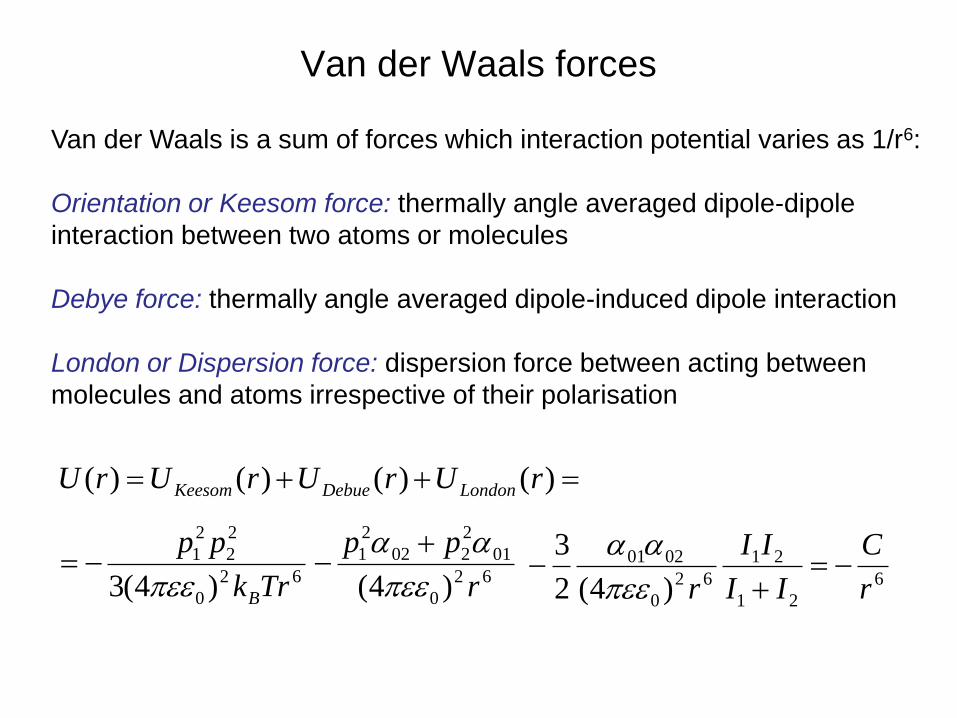
Van der Waals forces
Van der Waals is a sum of forces which interaction potential varies as 1/r6:
Orientation or Keesom force: thermally angle averaged dipole-dipole
interaction between two atoms or molecules
Debye force: thermally angle averaged dipole-induced dipole interaction
London or Dispersion force: dispersion force between acting between
molecules and atoms irrespective of their polarisation
62
0
2
2
2
1
)4(3 Trk
pp
B
62
0
01
2
202
2
1
)4( r
pp
6
21
21
62
0
0201
)4(2
3
r
C
II
II
r
)()()()( rUrUrUrU LondonDebueKeesom
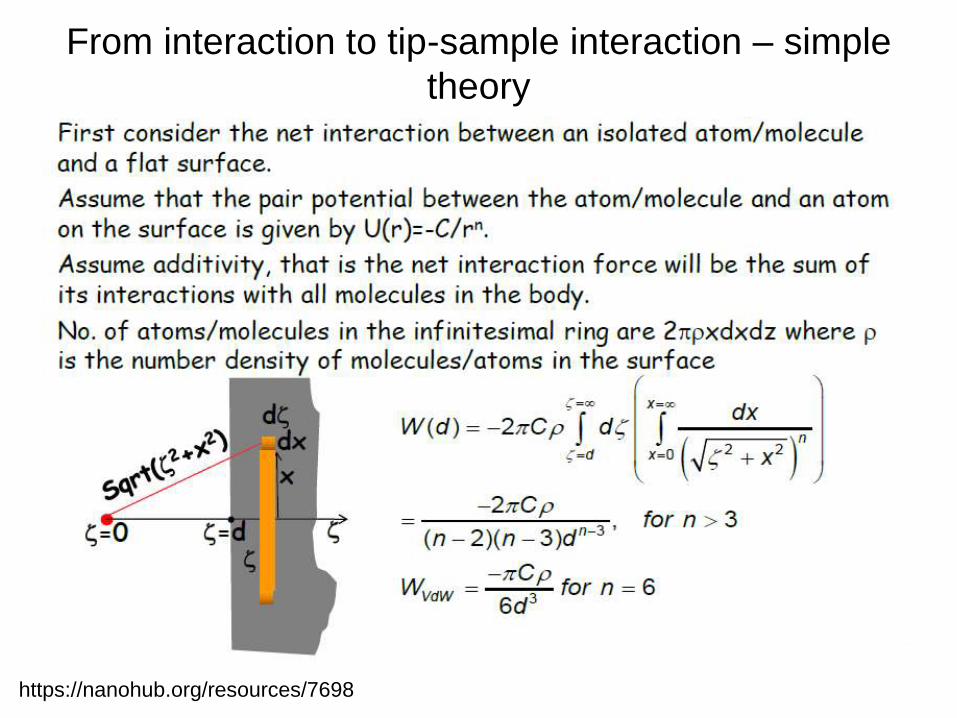
From interaction to tip-sample interaction – simple
theory
https://nanohub.org/resources/7698
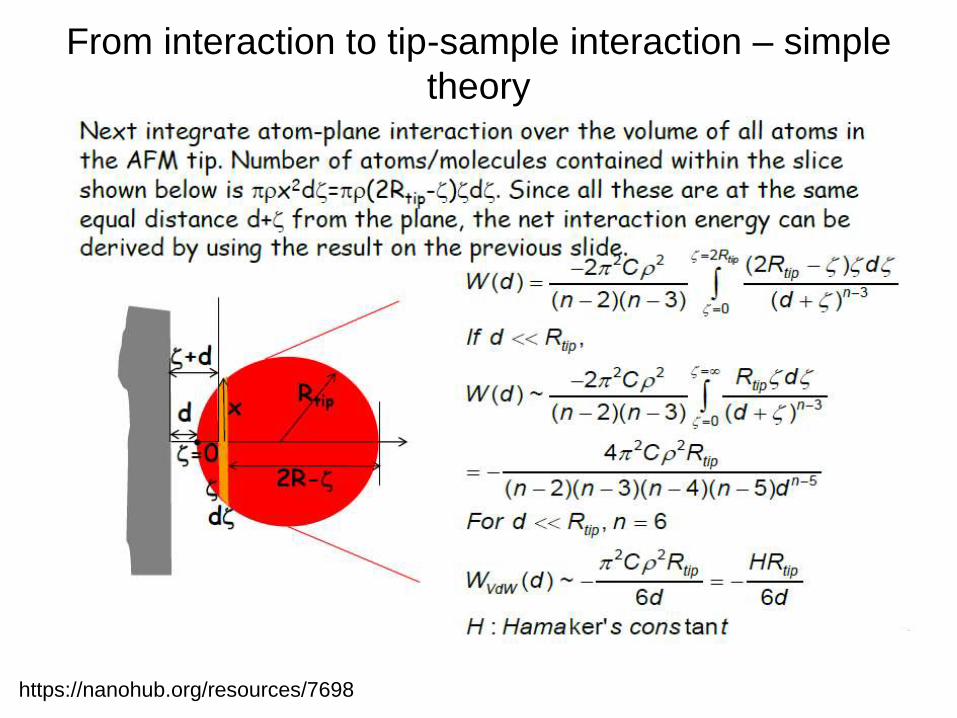
From interaction to tip-sample interaction – simple
theory
https://nanohub.org/resources/7698
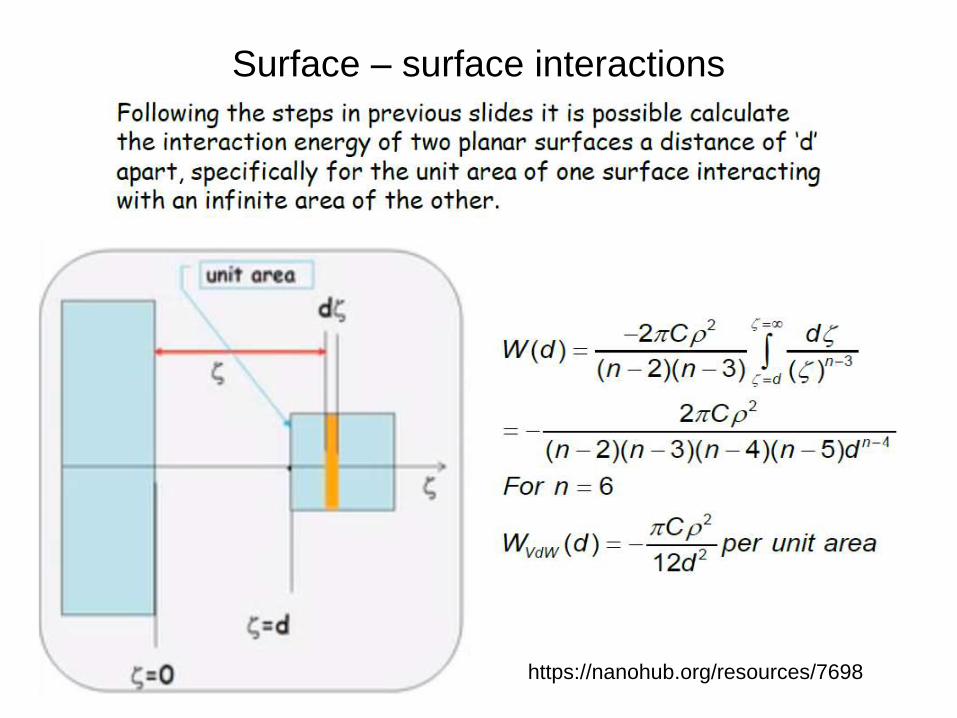
Surface – surface interactions
https://nanohub.org/resources/7698
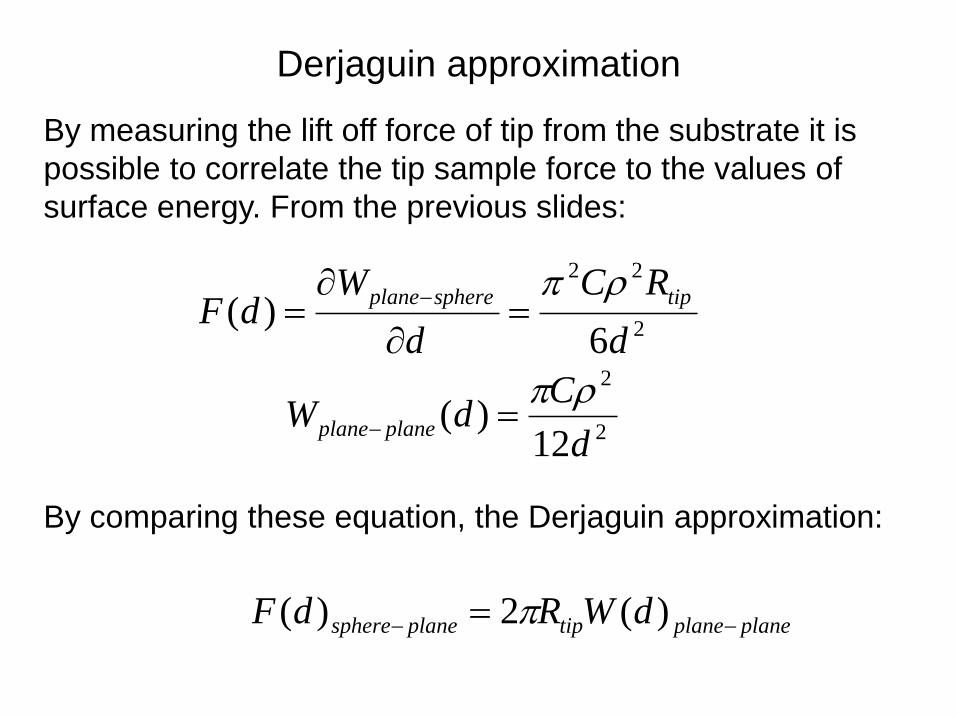
Derjaguin approximation
By measuring the lift off force of tip from the substrate it is
possible to correlate the tip sample force to the values of
surface energy. From the previous slides:
2
22
6)(
d
RC
d
WdF
tipsphereplane
2
2
12)(
d
CdW planeplane
By comparing these equation, the Derjaguin approximation:
planeplanetipplanesphere dWRdF )(2)(
http://nanohub.org/resources/7320
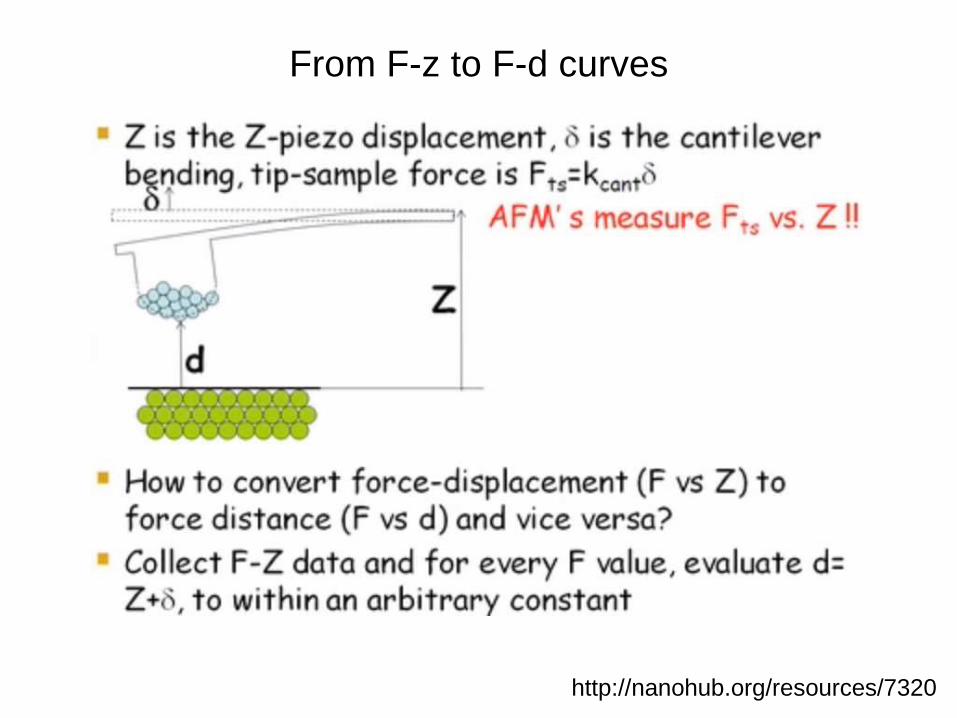
From F-z to F-d curves
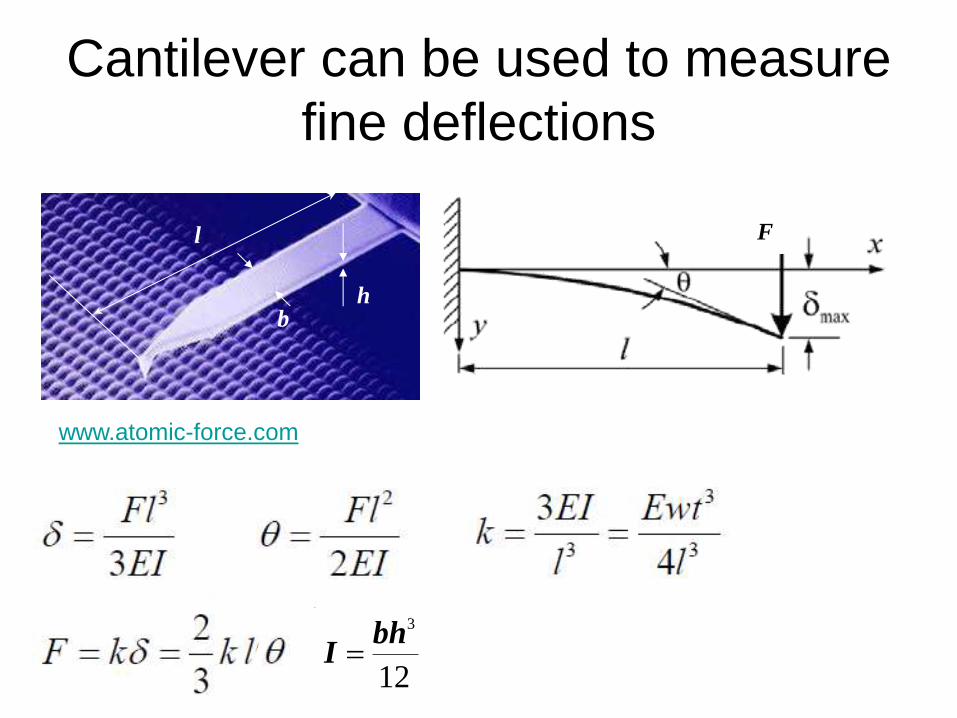
Cantilever can be used to measure
fine deflections
F
12
3bh
I
l
h b
www.atomic-force.com
δ
δ
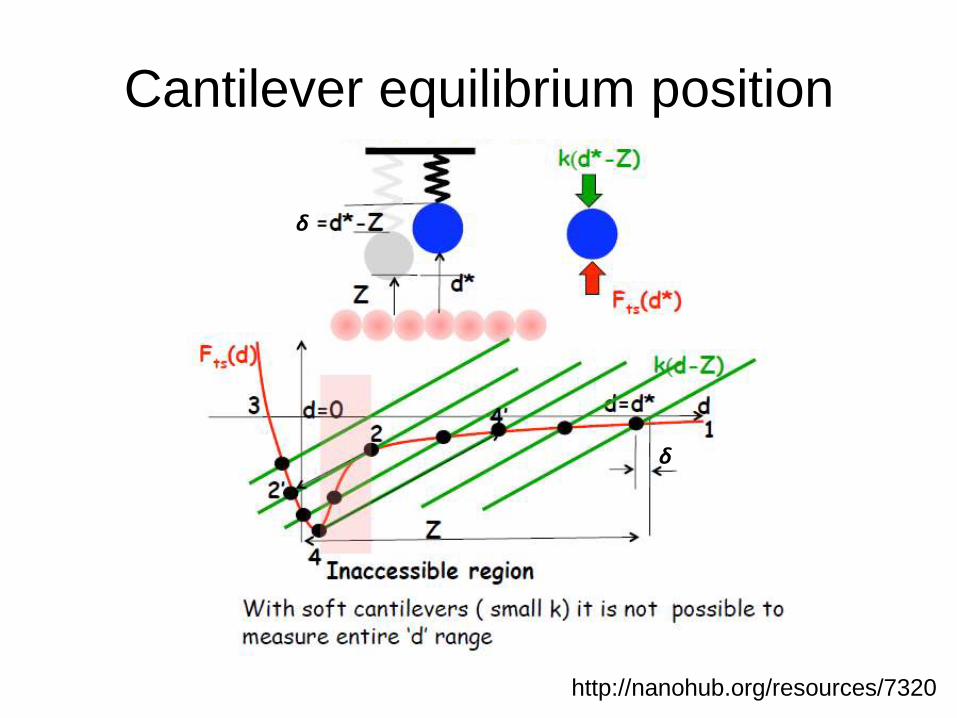
Cantilever equilibrium position
http://nanohub.org/resources/7320
http://www3.physik.uni-greifswald.de/method/afm/eafm.htm
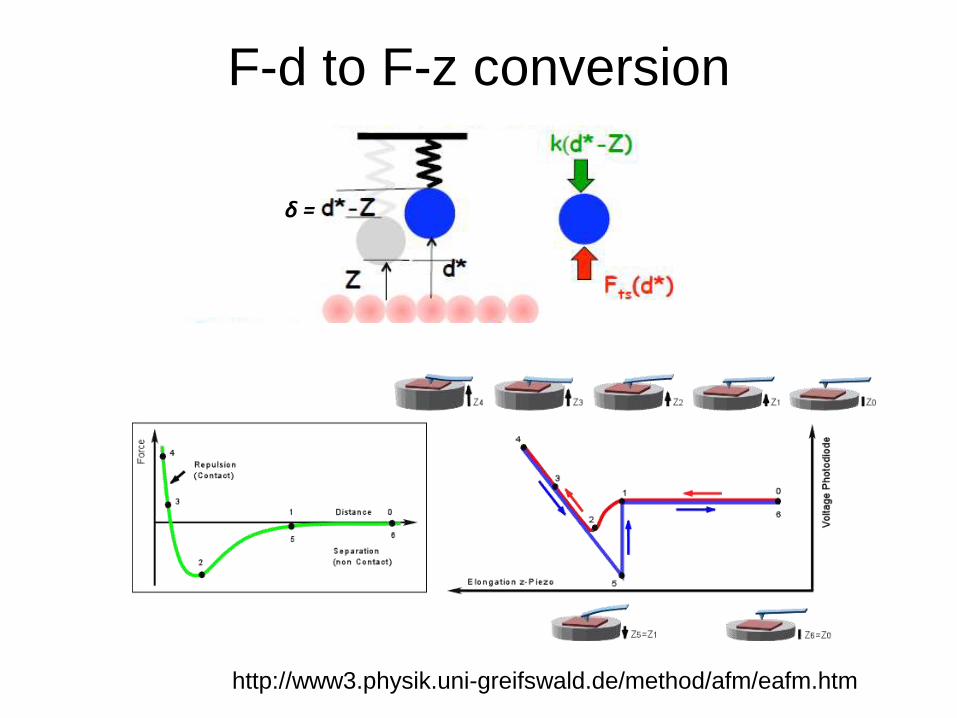
δ =
F-d to F-z conversion
http://www.rsc.org/chemistryworld/News/2007/February/28020702.asp
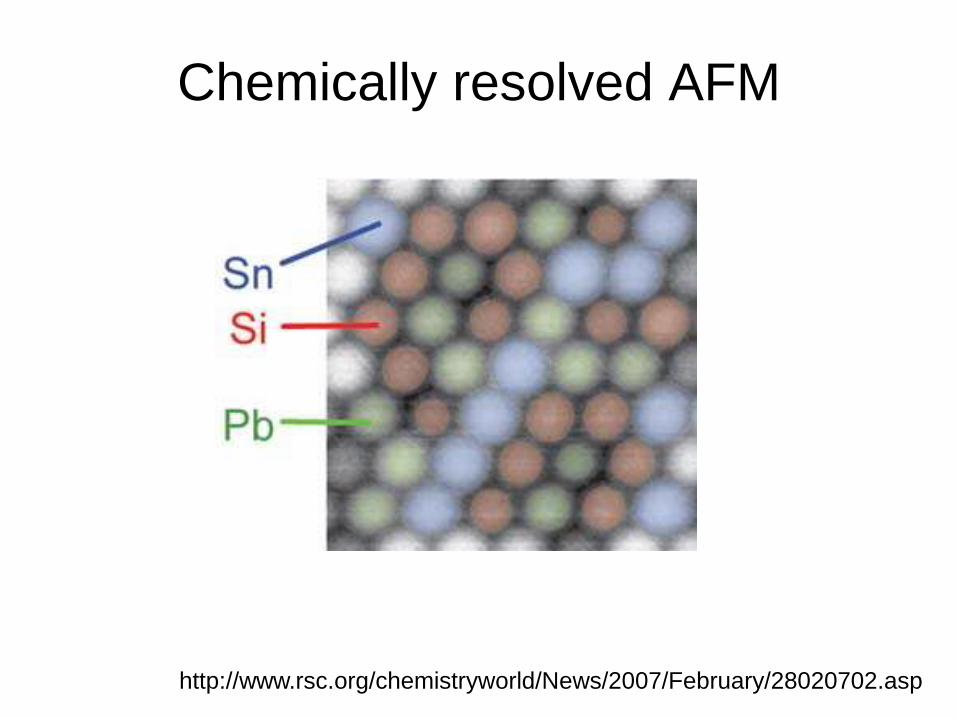
Chemically resolved AFM


