28
WHITENING THE BLACKBOX : WHY AND HOW TO EXPLAIN MACHINE LEARNING PREDICTIONS ? PyData 2015 / Paris Christophe Bourguignat (@chris_bour) Marcin Detyniecki Bora Eang
| Date post: | 17-Jul-2015 |
| Category: |
Data & Analytics |
| Upload: | pole-systematic-paris-region |
| View: | 487 times |
| Download: | 2 times |

WHITENING THE BLACKBOX : WHY AND HOW TO EXPLAIN
MACHINE LEARNING PREDICTIONS ?
PyData 2015 / Paris
Christophe Bourguignat (@chris_bour)
Marcin Detyniecki
Bora Eang

We are a new Data team
We are Python & scikit-learn heavy users and
hopefully contributors
We like tricky problems, doubts, questions
And love to share with data geeks about that !
DISCLAIMER - WHO ARE WE ?
2 | PyData 2015 - Paris

Why explaining Machine Learning models ?
3 | PyData 2015 - Paris

Why explaining Machine Learning models ?
4 | PyData 2015 - Paris
Explain why a given loan application
did not meet credit underwriting
policy

Why explaining Machine Learning models ?
5 | PyData 2015 - Paris
Explain why a given loan application
did not meet credit underwriting
policy
Explain why a given transaction is
suspicious

Why explaining Machine Learning models ?
6 | PyData 2015 - Paris
Explain why a given loan application
did not meet credit underwriting
policy
Explain why a given transaction is
suspicious
Explain why a given job is recommended
for an unemployed
Why explaining Machine Learning models ?
7 | PyData 2015 - Paris
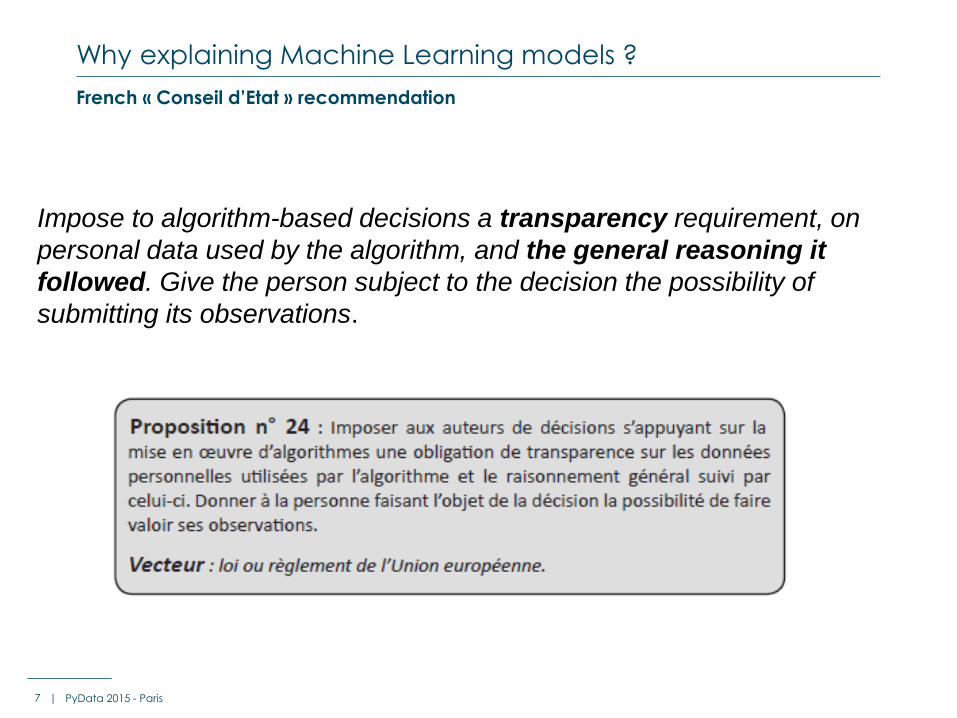
French « Conseil d’Etat » recommendation
Impose to algorithm-based decisions a transparency requirement, on
personal data used by the algorithm, and the general reasoning it
followed. Give the person subject to the decision the possibility of
submitting its observations.

8 | PyData 2015 - Paris

What do we actually want ?
9 | PyData 2015 - Paris
We don’t ask for a “typical profile” of the selected population
We want a reason why an observation got selected by our algorithm
This reason must be simple and understandable (actionable), but can
be specific to it
Observation A, next to observation B on our selected population, can
be selected for a completely different reason
http://www.holehouse.org/mlclass/07_Regularization.html

Toy Example : Titanic Dataset (1/2)
10 | PyData 2015 - Paris

Toy Example : Titanic Dataset (2/2)
11 | PyData 2015 - Paris
These women were predicted with
a high confidence as « survived »

Toy Example : Titanic Dataset (2/2)
12 | PyData 2015 - Paris
These women were predicted with as
high confidence as « not survived »
These women were predicted with
a high confidence as « survived »

Toy Example : Titanic Dataset (2/2)
13 | PyData 2015 - Paris
These women were predicted with as
high confidence as « not survived »
These women were predicted with
a high confidence as « survived »
We are looking for a method saying : why ?

A simple case : linear models
14 | PyData 2015 - Paris
-5
0
5
10
1 2 3 4
Beta
x
Beta.x
-5
0
5
10
1 2 3 4
Beta
x
Beta.x
Observation 1 Observation 2
Unfortunately, predictive
models that are the most
powerful are usually the
least interpretable
http://machinelearningmastery.com/model-prediction-versus-interpretation-in-machine-learning/
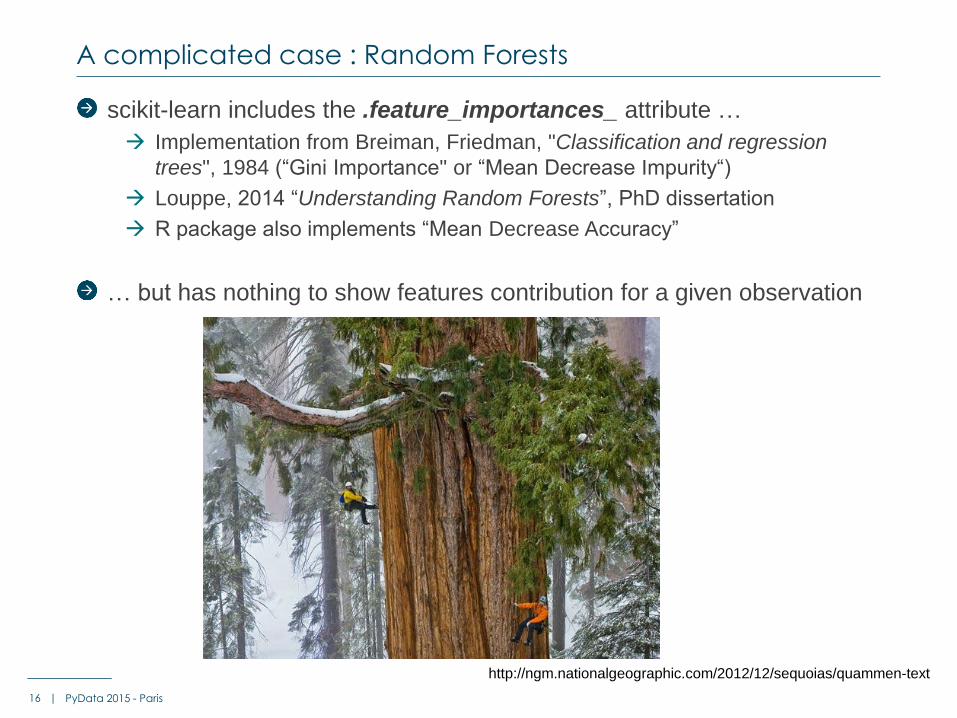
scikit-learn includes the .feature_importances_ attribute …
Implementation from Breiman, Friedman, "Classification and regression
trees", 1984 (“Gini Importance" or “Mean Decrease Impurity“)
Louppe, 2014 “Understanding Random Forests”, PhD dissertation
R package also implements “Mean Decrease Accuracy”
… but has nothing to show features contribution for a given observation
A complicated case : Random Forests
16 | PyData 2015 - Paris
http://ngm.nationalgeographic.com/2012/12/sequoias/quammen-text

« What if » explanation
Sensitivity of the variable
(i.e. derivative)
Feature contribution
« path approach »
How to interpret a forest?
17 | PyData 2015 - Paris MENTION DE CONFIDENTIALITÉ

« What if » explanation
Sensitivity of the variable
(i.e. derivative)
Feature contribution
« path approach »
How to interpret a forest?
18 | PyData 2015 - Paris
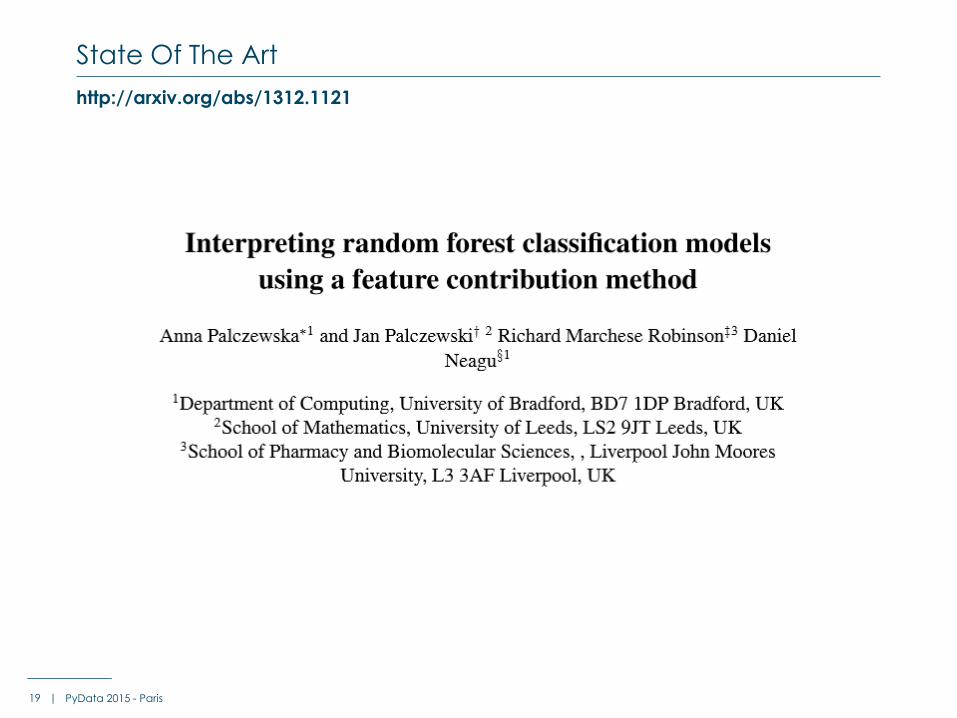
State Of The Art
19 | PyData 2015 - Paris
http://arxiv.org/abs/1312.1121

State Of The Art
20 | PyData 2015 - Paris
http://blog.datadive.net/interpreting-random-forests/
Scikit-Learn IPython demo
21 | PyData 2015 - Paris
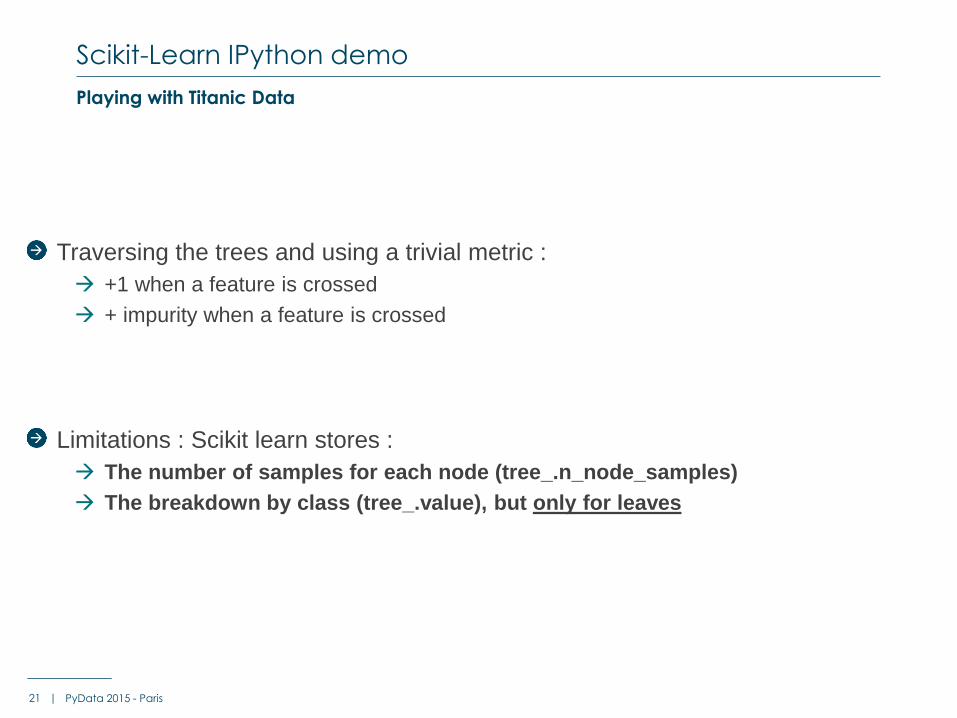
Playing with Titanic Data
Traversing the trees and using a trivial metric :
+1 when a feature is crossed
+ impurity when a feature is crossed
Limitations : Scikit learn stores :
The number of samples for each node (tree_.n_node_samples)
The breakdown by class (tree_.value), but only for leaves

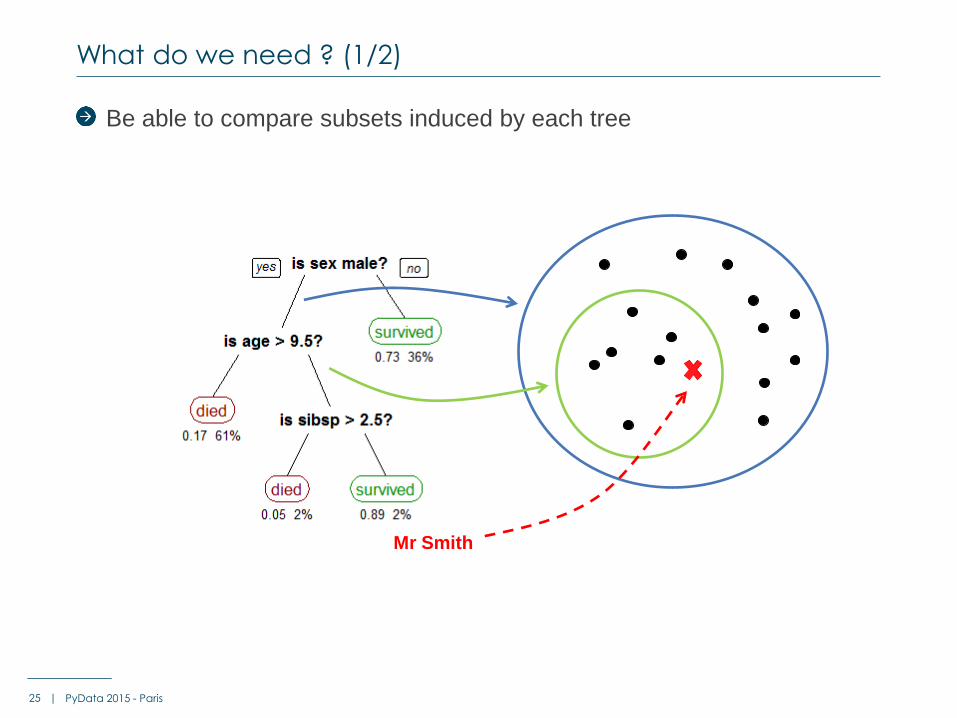
Be able to compare subsets induced by each tree
What do we need ? (1/2)
22 | PyData 2015 - Paris
Mr Smith

Be able to compare subsets induced by each tree
What do we need ? (1/2)
23 | PyData 2015 - Paris
Mr Smith

Be able to compare subsets induced by each tree
What do we need ? (1/2)
24 | PyData 2015 - Paris
Mr Smith
Be able to compare subsets induced by each tree
What do we need ? (1/2)
25 | PyData 2015 - Paris
Mr Smith

Be able to compare subsets induced by each tree
What do we need ? (1/2)
26 | PyData 2015 - Paris
Mr Smith

Ideally, we would need easy access to all nodes attributes :
Average_score
Node_size (absolute or %)
Number of class 0 samples (absolute or %)
Number of class 1 samples (absolute or %)
…
For each tree
For each node
- Metric += F(parent_node, node, left_child_node, right_child_node, brother_node)
- E.g : F = parent_node.average_score – node.average_score
What do we need (2/2)
27 | PyData 2015 - Paris

Thank You
and join us, we have many other
problems to crack !
Christophe Bourguignat (@chris_bour)
Marcin Detyniecki
Bora Eang


