47
What are we measuring and why? Daniel Godwin Kruger National Park, 2014
| Date post: | 18-Jul-2015 |
| Category: |
Science |
| Upload: | daniel-godwin |
| View: | 80 times |
| Download: | 4 times |

What are we measuring and why?
Daniel GodwinKruger National Park, 2014
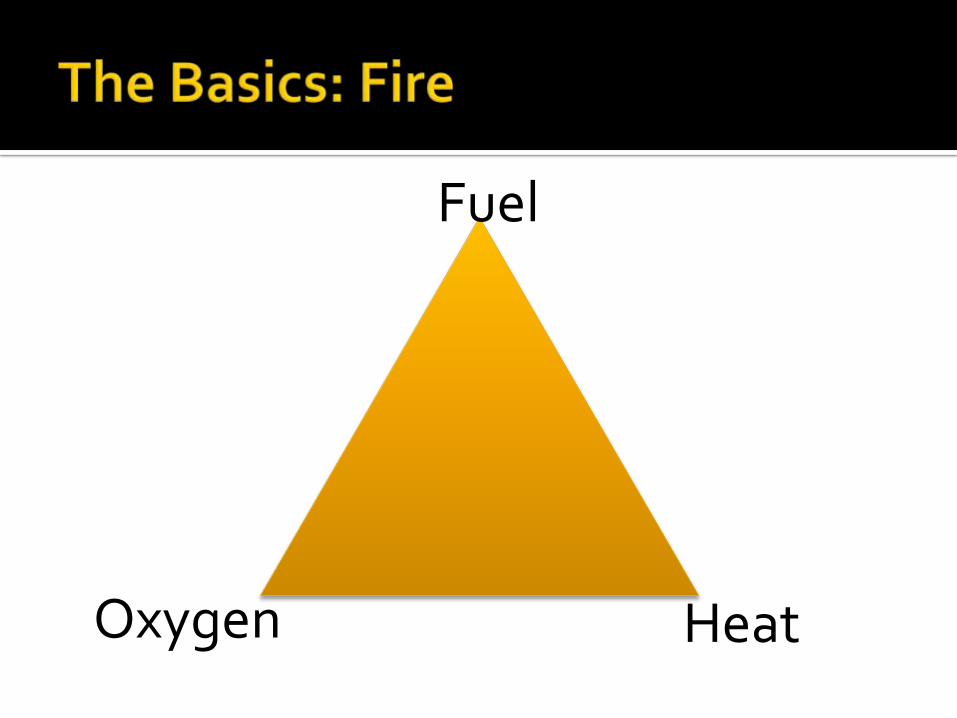
Fuel
Oxygen Heat
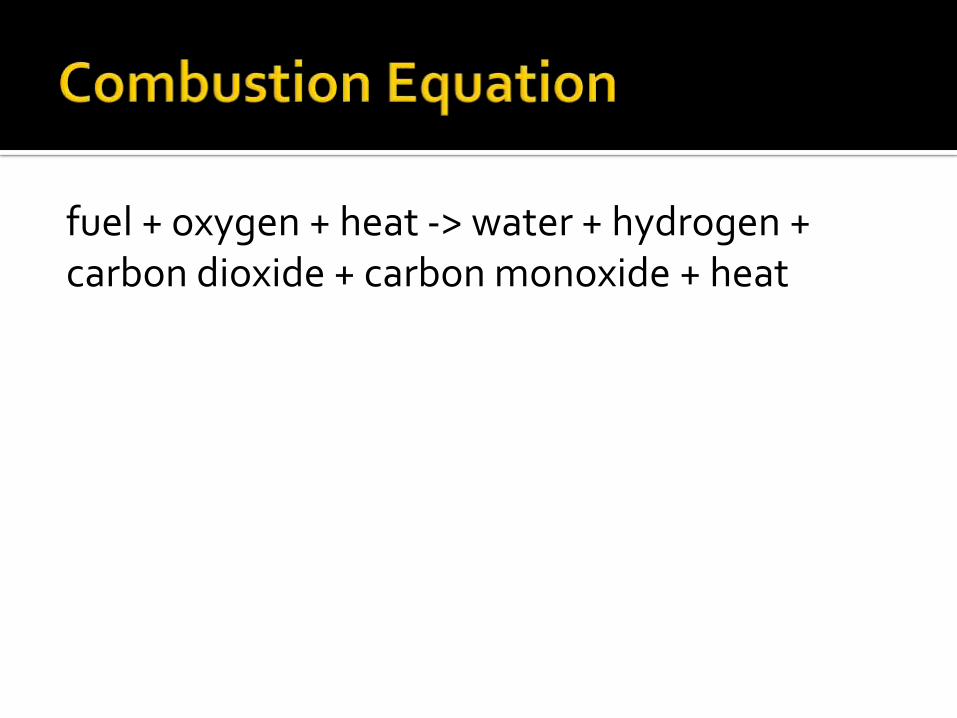
fuel + oxygen + heat -> water + hydrogen + carbon dioxide + carbon monoxide + heat
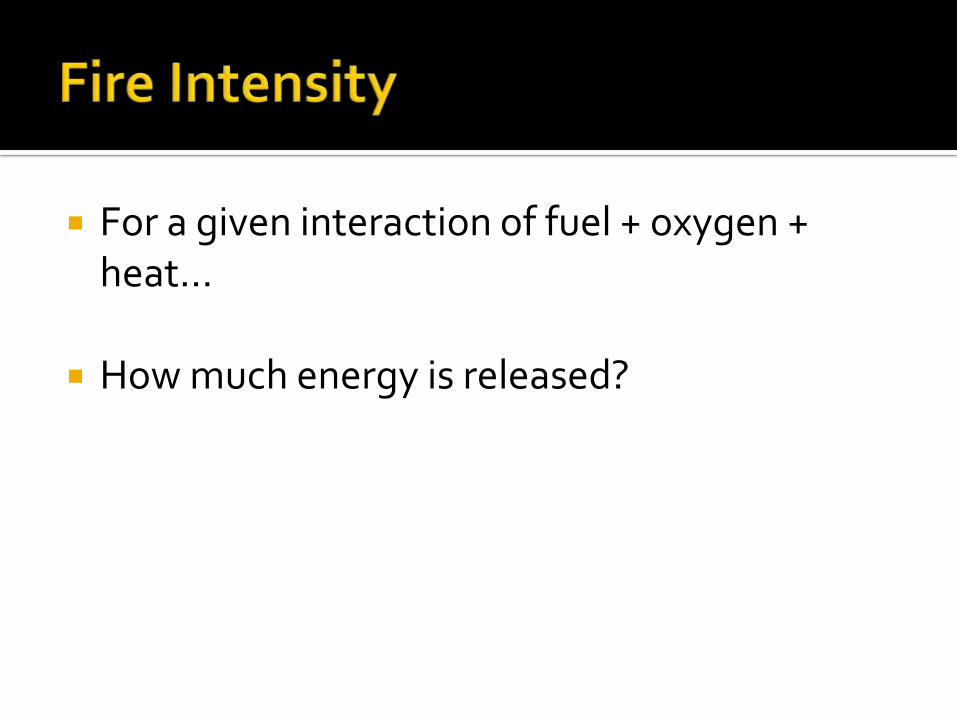
For a given interaction of fuel + oxygen + heat…
How much energy is released?
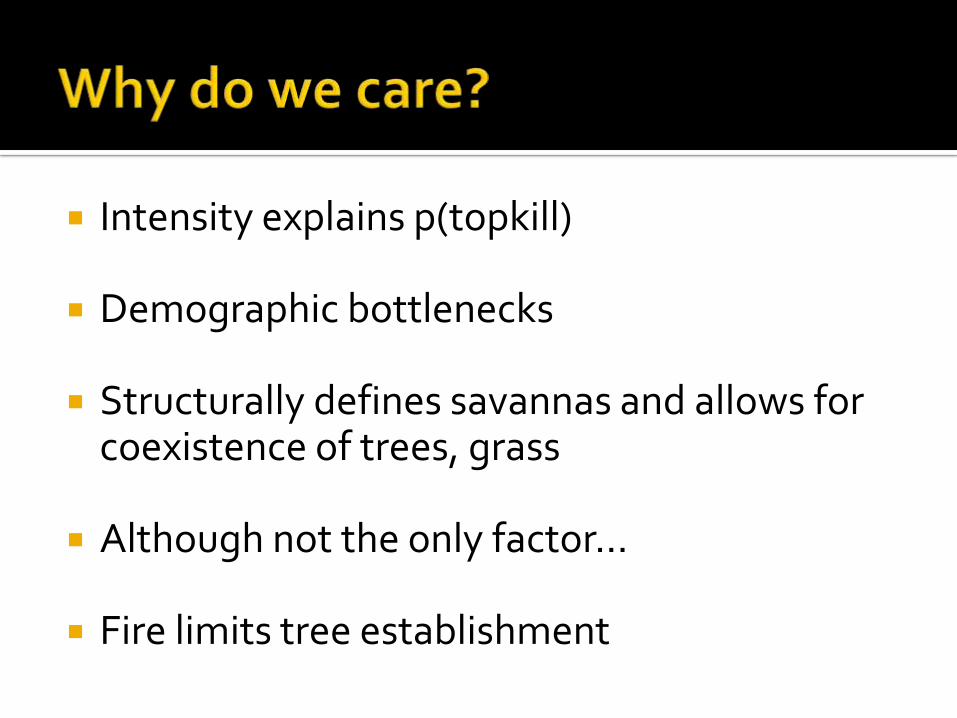
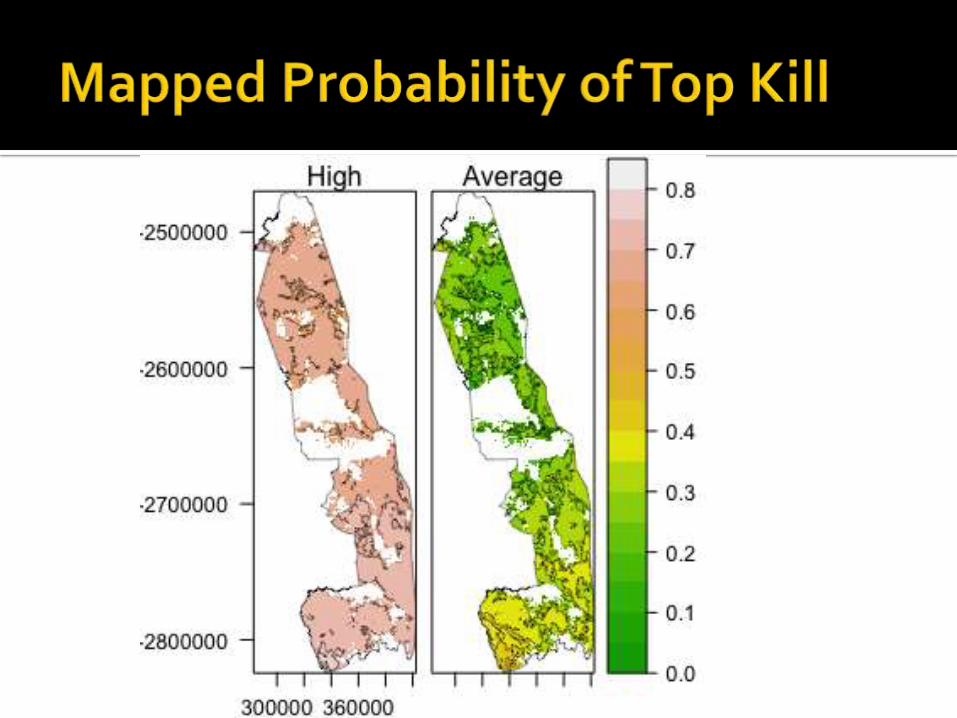
Intensity explains p(topkill)
Demographic bottlenecks
Structurally defines savannas and allows for coexistence of trees, grass
Although not the only factor…
Fire limits tree establishment
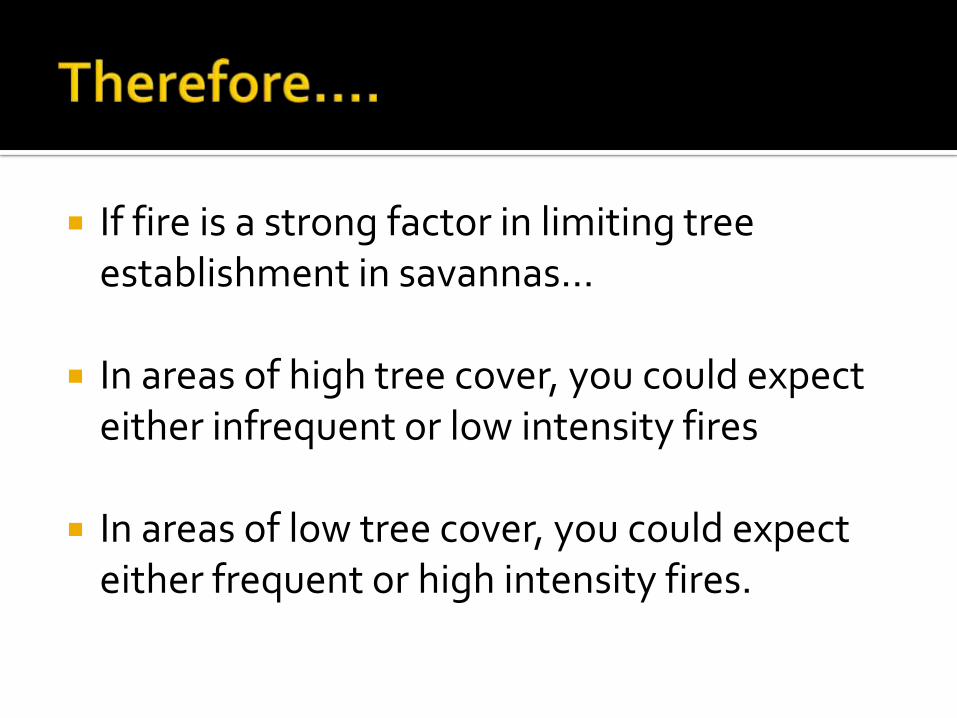
If fire is a strong factor in limiting tree establishment in savannas…
In areas of high tree cover, you could expect either infrequent or low intensity fires
In areas of low tree cover, you could expect either frequent or high intensity fires.
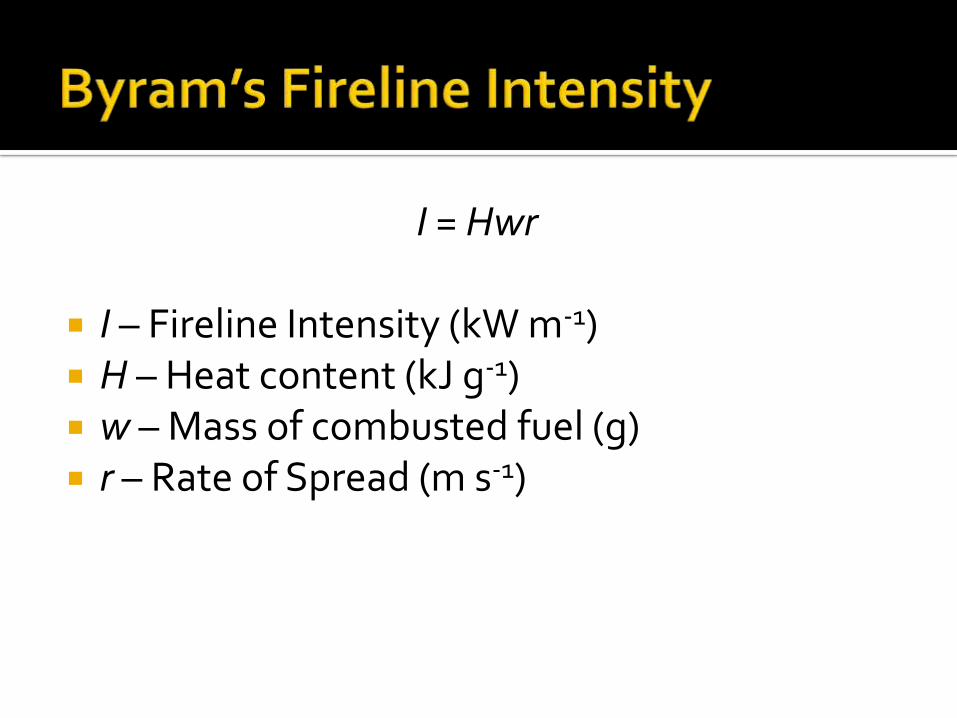
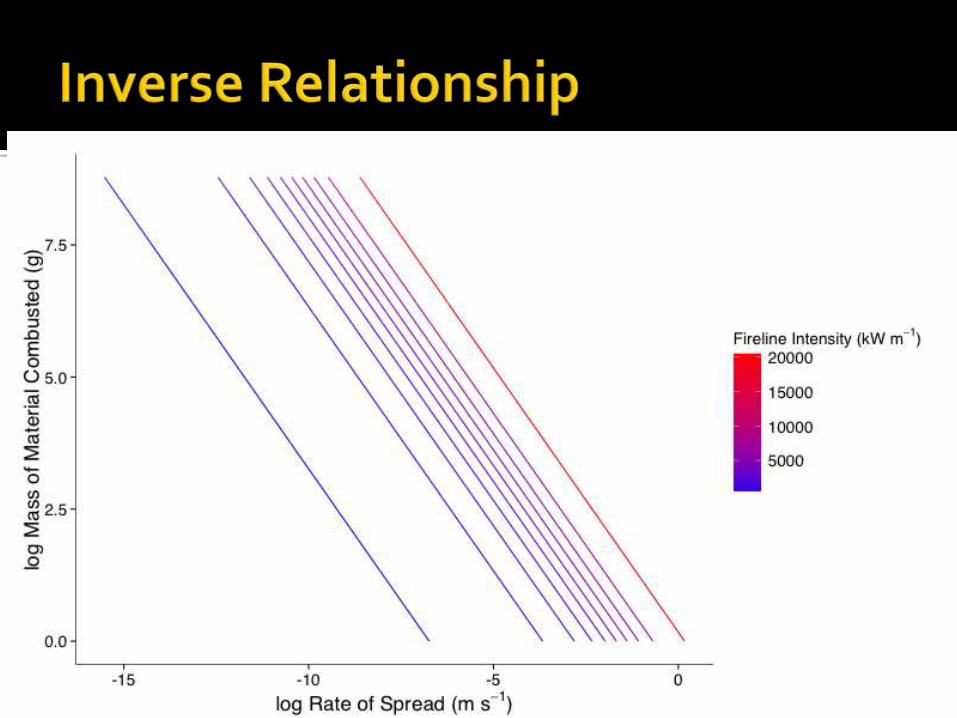
I = Hwr
I – Fireline Intensity (kW m-1) H – Heat content (kJ g-1) w – Mass of combusted fuel (g) r – Rate of Spread (m s-1)
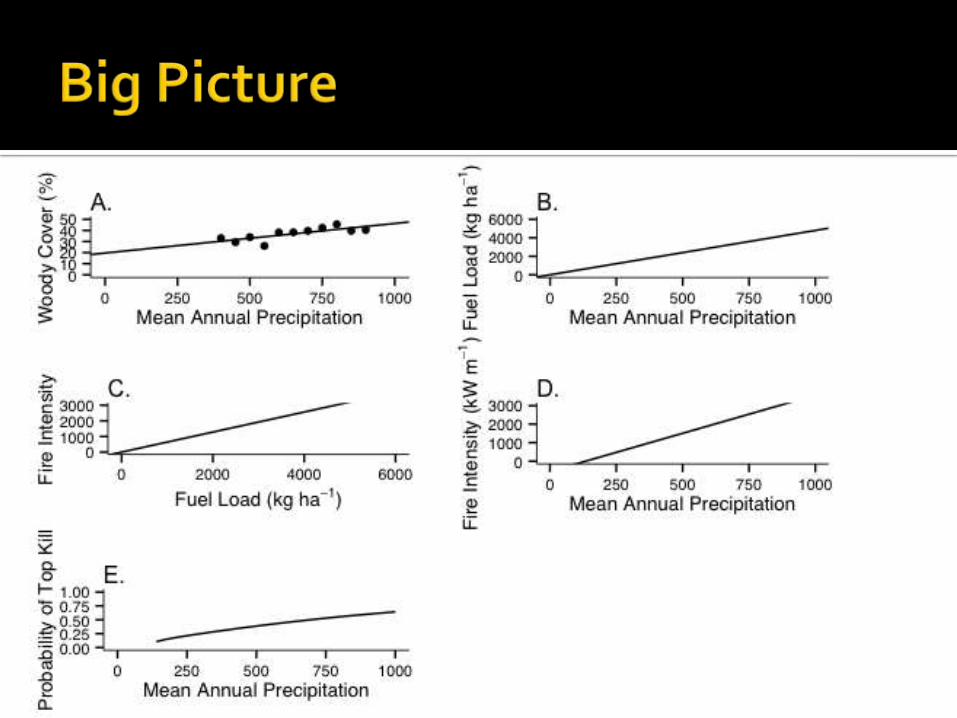
Why do we see increasing woody cover at the same time as increasing p(top kill)?
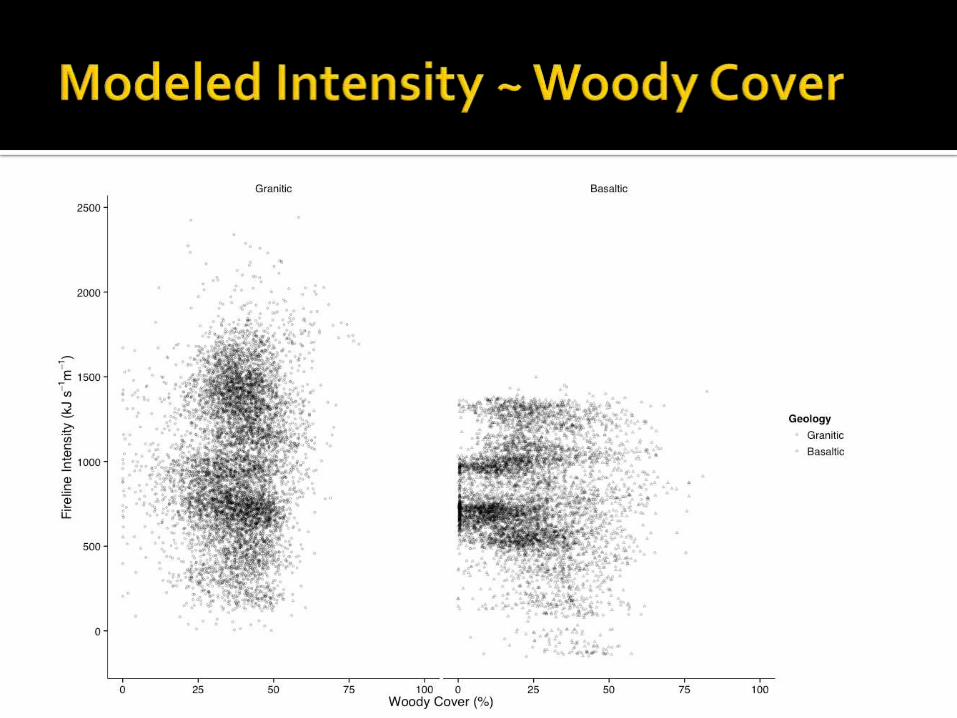
Confounding effects of granitic vs. basaltic?
Fire doesn’t limit as much as we think
Fire intensity as we measure it doesn’t capture the effects on woody cover that we think it should

Severity is the ecological impact of a fire
Plants
Animals
Soil
Intensity is energy released Intensity != Severity… …but no standard metric for severity in
savannas
Remote Sensing using MODIS Fire Product
Modeled fireline intensity
Analysis of fire scar reports from KNP
Local-scale intensity variation
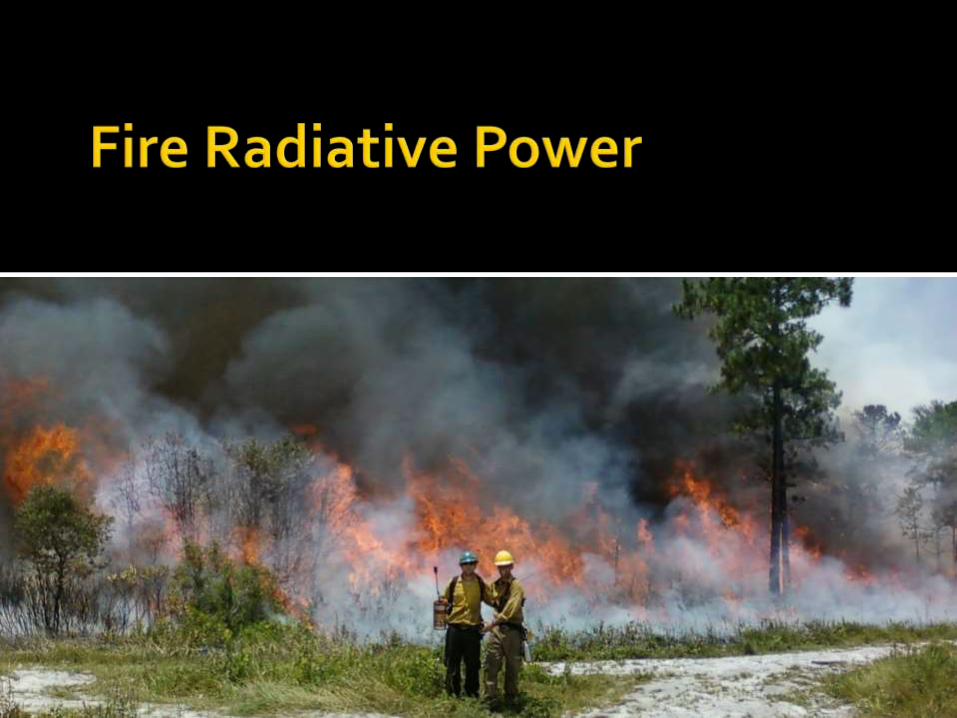
Ten years of data (1 Jan 2004 – 1 Jan 2014
Subset to only include fires of > 90% accuracy
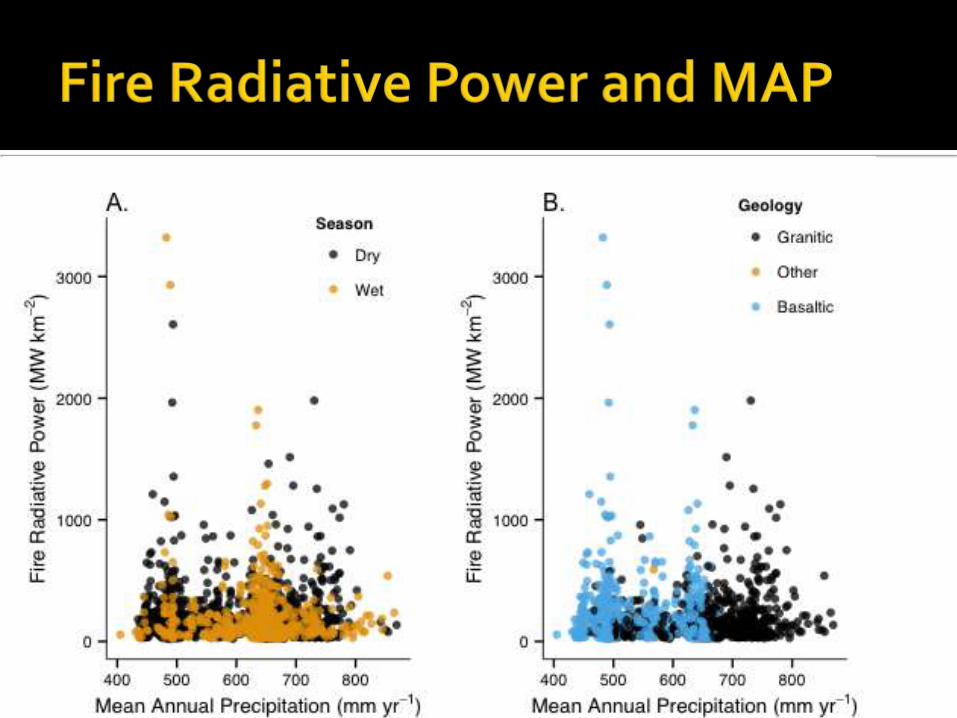

No clear relationship with MAP
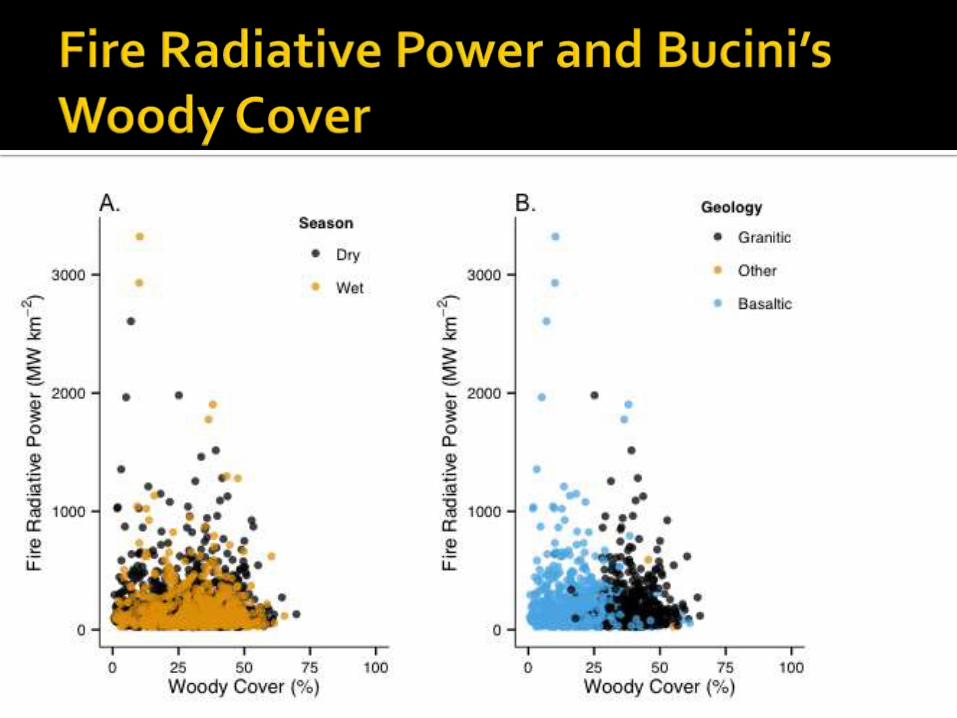
No clear relationship with woody cover
FRP bad metric for savanna fires?

Mean Low RH
Wind Speed Range
MAP
Fuel Load: f(Time Since Fire, Rainfall)
MFRI
Fire Intensity:f(Fuel Load, RH, Fuel
Moisture, Wind Speed)
Fuel Moisture
Range
Probability of Top Killf(Intensity, Height)
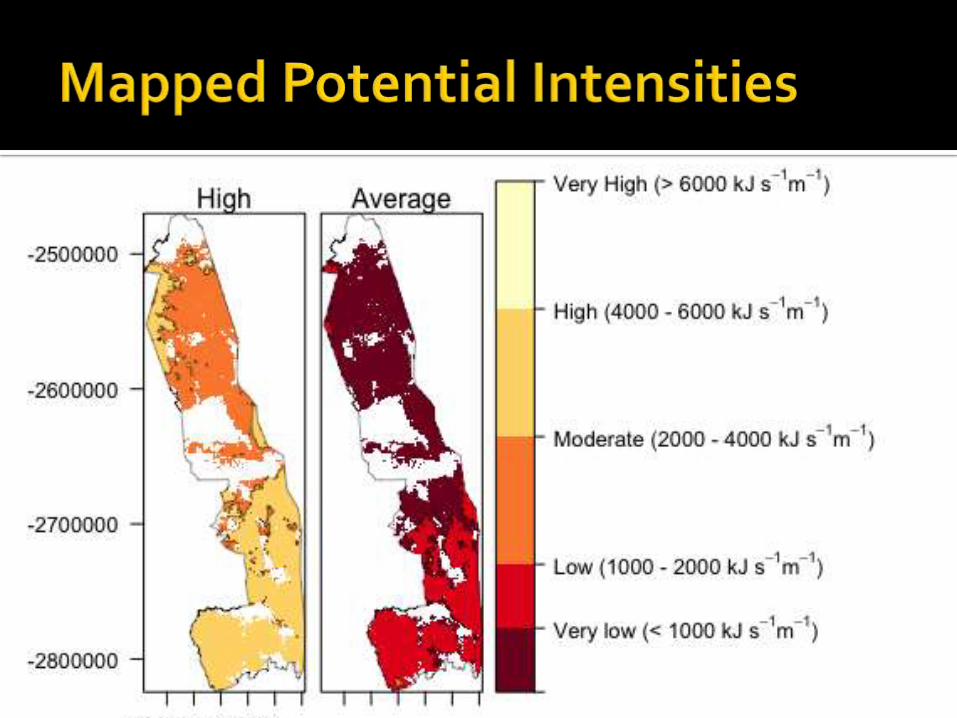


Intuitive: hotter fires near PRET
Clear relationship with MAP…but that’s expected given the model.
No clear relationship with woody cover, though differences in intensity between geologic material.

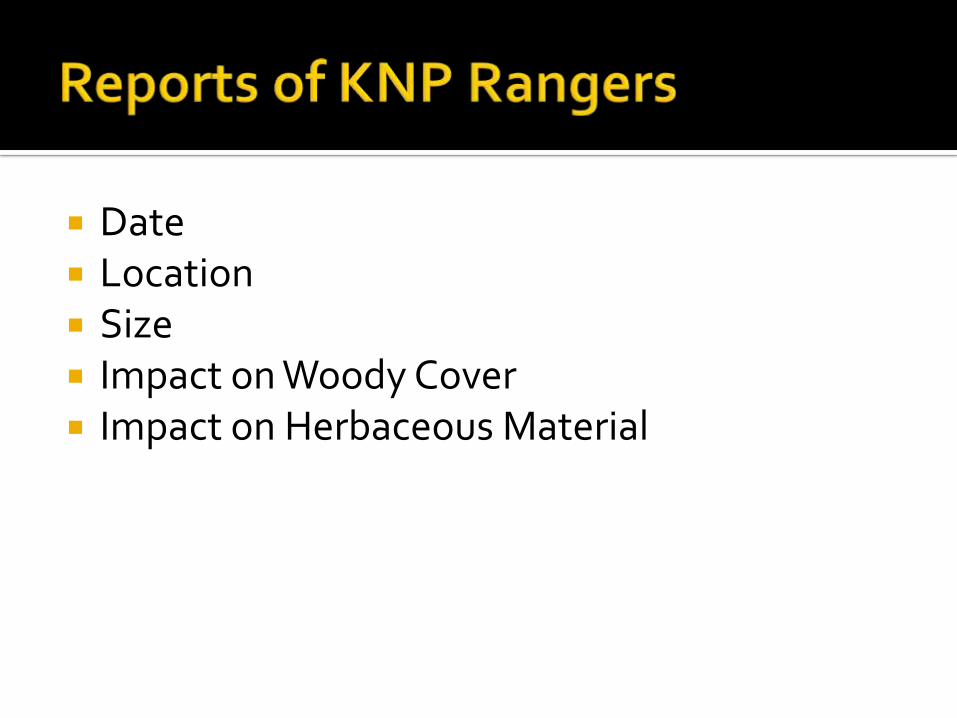
Date Location Size Impact on Woody Cover Impact on Herbaceous Material

Impact on Woody Cover
Very severe – None
Impact on Herbaceous Material
Very patchy – Clean
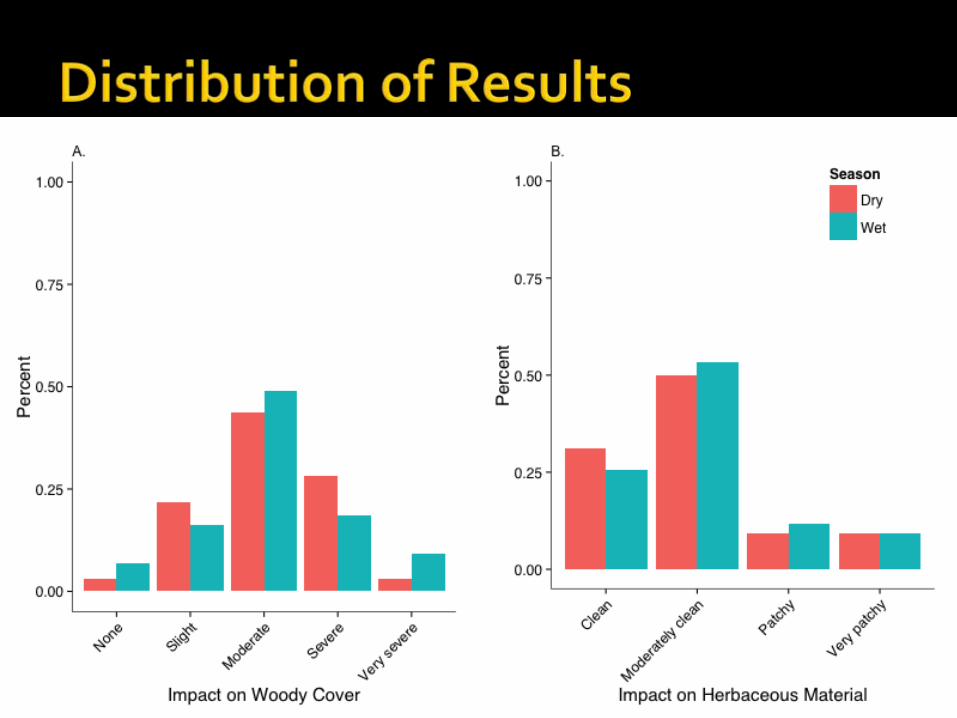
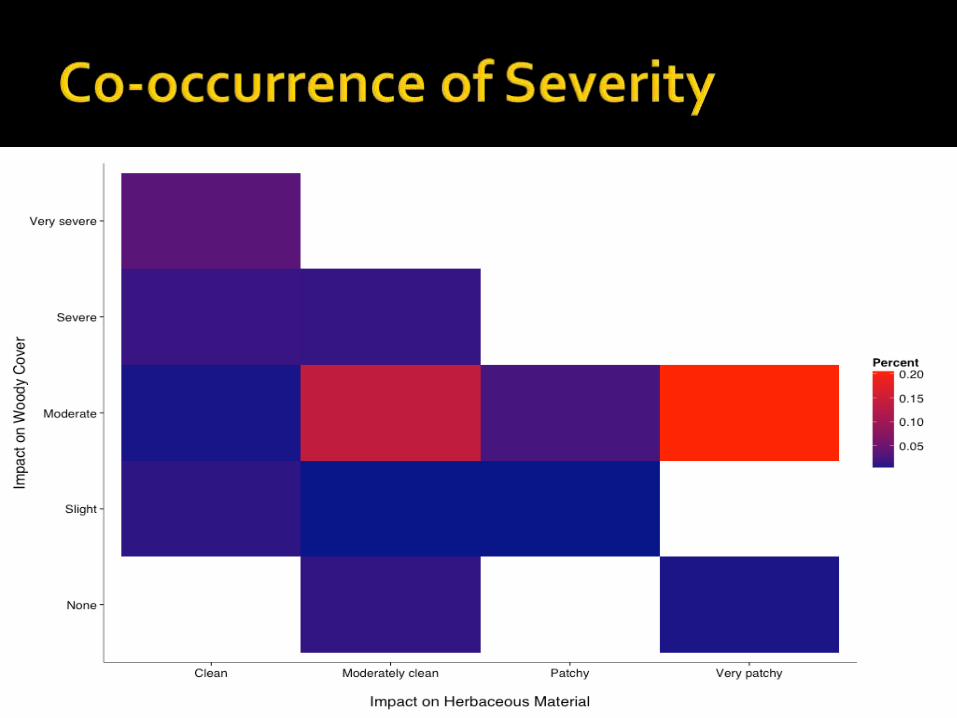
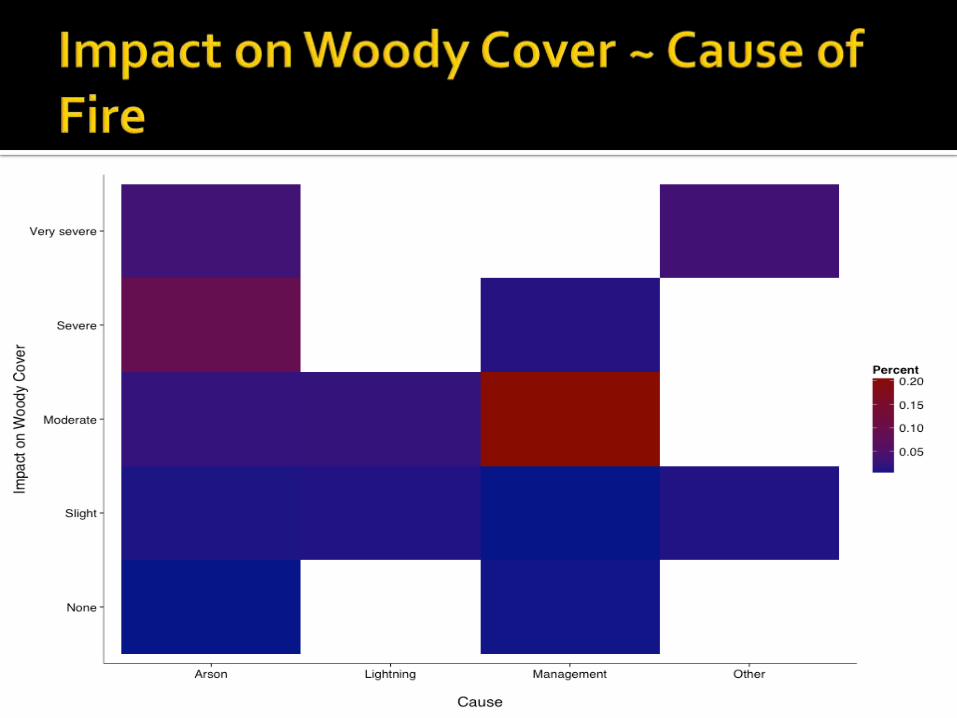
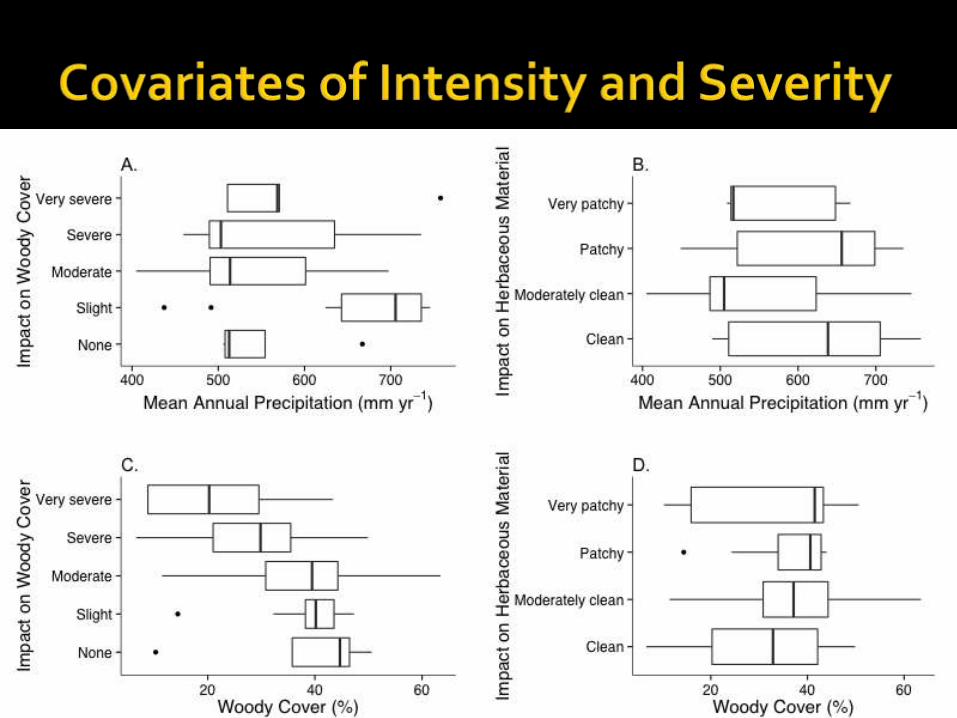
Most of this is intuitive
To do:
Link to previous summer’s rainfall
Use as training samples for remotely sensed data


How “spatial” is fire intensity?
Fire intensity has deterministic drivers (fuel moisture, available oxygen, fuel amount)
Do these vary enough around trees to drive potential effects on p(top kill)?

Ground level
3 cm
5 cm
30 cm
Sand
iButton
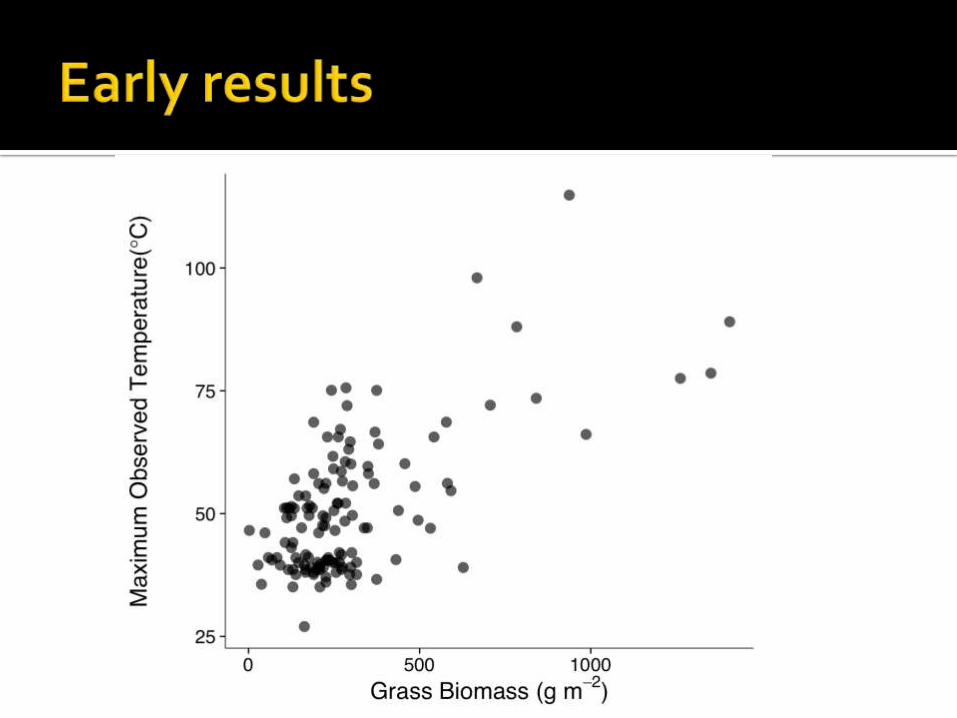

Classic point clouds.
Similar to earlier studies (Moustakas et al. 2013), at wetter end, grass biomass is decoupled from canopy coverage
Variation in fuel moisture content ~ Canopy Coverage.
Better assessment of intensity from temperature curves
Canopy opening patch size effect on fire intensity, controlling for RH%
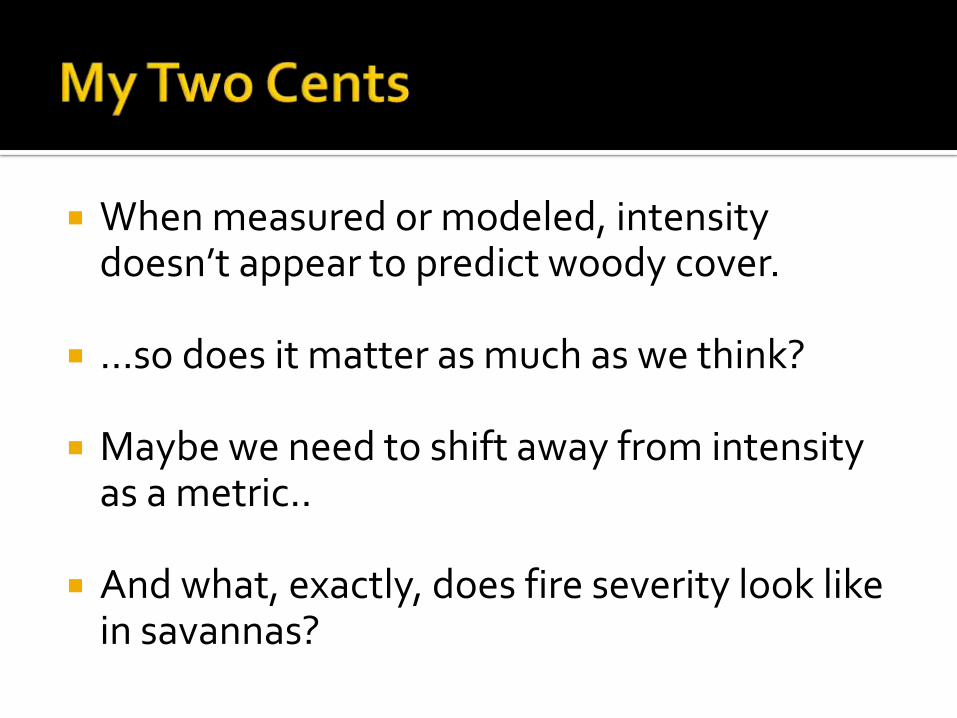
When measured or modeled, intensity doesn’t appear to predict woody cover.
…so does it matter as much as we think?
Maybe we need to shift away from intensity as a metric..
And what, exactly, does fire severity look like in savannas?
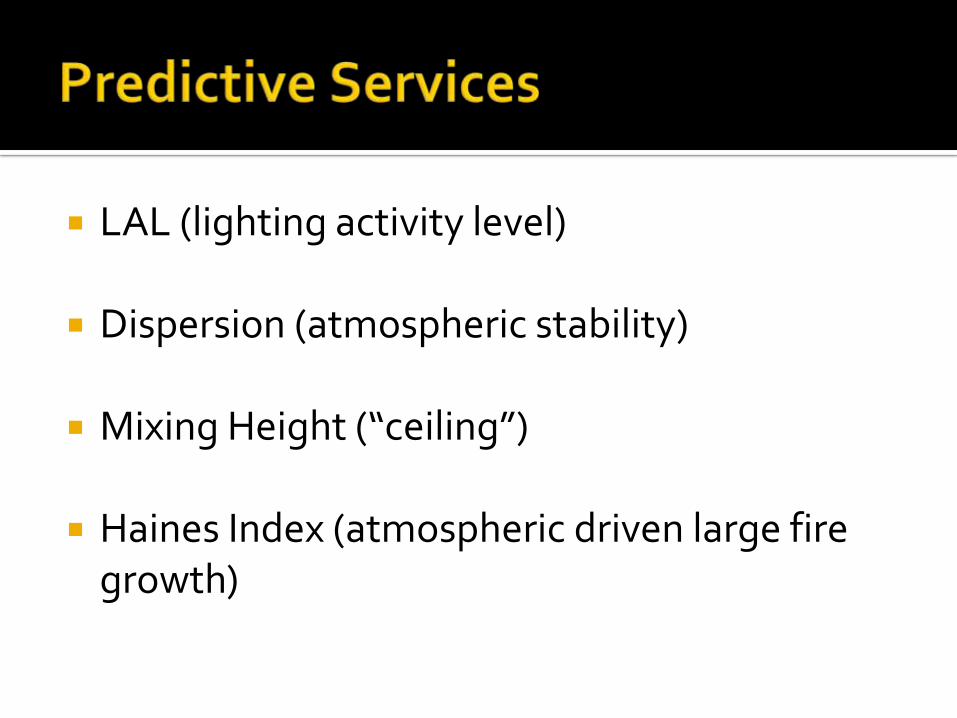
LAL (lighting activity level)
Dispersion (atmospheric stability)
Mixing Height (“ceiling”)
Haines Index (atmospheric driven large fire growth)
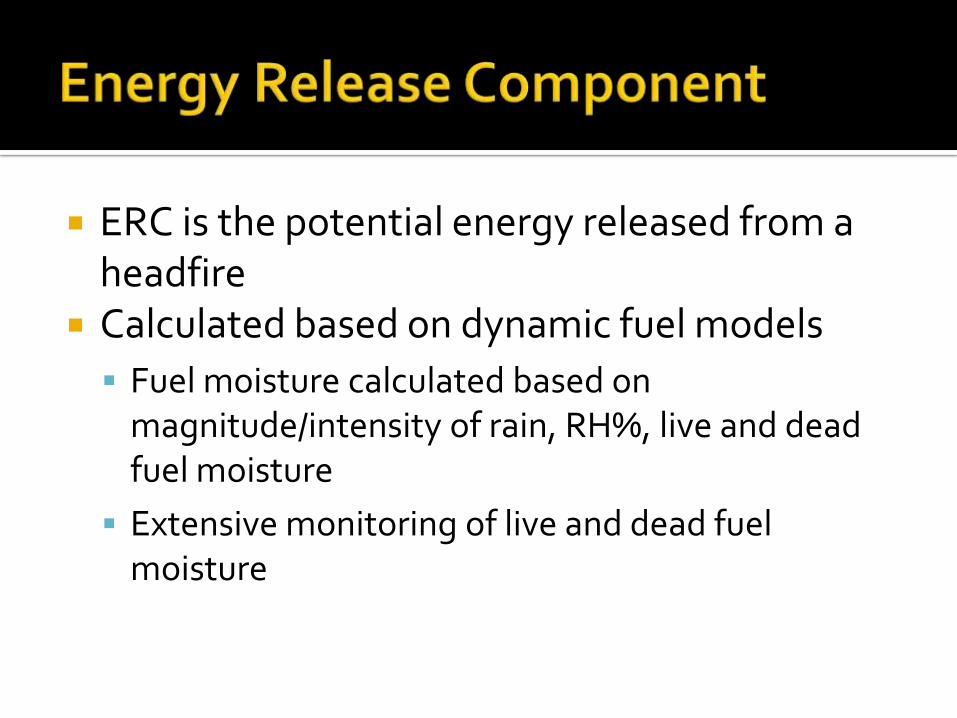
ERC is the potential energy released from a headfire
Calculated based on dynamic fuel models
Fuel moisture calculated based on magnitude/intensity of rain, RH%, live and dead fuel moisture
Extensive monitoring of live and dead fuel moisture
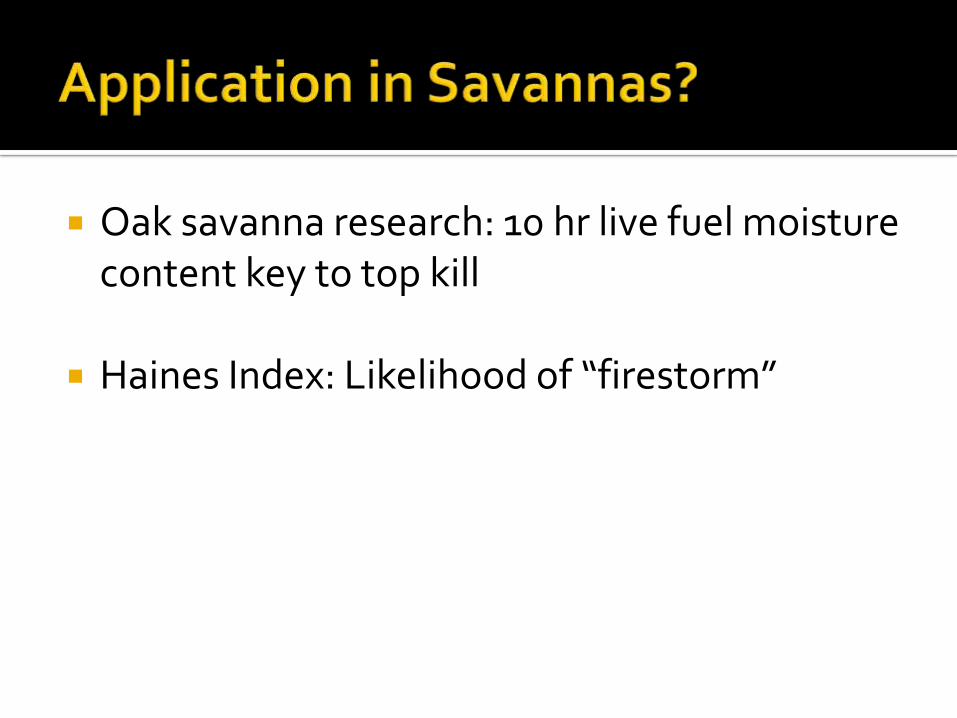
Oak savanna research: 10 hr live fuel moisture content key to top kill
Haines Index: Likelihood of “firestorm”