HAL Id: hal-00868596 https://hal.archives-ouvertes.fr/hal-00868596 Submitted on 1 Oct 2013 HAL is a multi-disciplinary open access archive for the deposit and dissemination of sci- entific research documents, whether they are pub- lished or not. The documents may come from teaching and research institutions in France or abroad, or from public or private research centers. L’archive ouverte pluridisciplinaire HAL, est destinée au dépôt et à la diffusion de documents scientifiques de niveau recherche, publiés ou non, émanant des établissements d’enseignement et de recherche français ou étrangers, des laboratoires publics ou privés. Pyrolysis in Porous Media: Part 1. Numerical model and parametric study Luigi Romagnosi, Nicolas Gascoin, Eddy El Tabach, Ivan Fedioun, Marc Bouchez, Johan Steelant To cite this version: Luigi Romagnosi, Nicolas Gascoin, Eddy El Tabach, Ivan Fedioun, Marc Bouchez, et al.. Pyrolysis in Porous Media: Part 1. Numerical model and parametric study. Energy Conversion and Management, Elsevier, 2013, 68, pp.63-73. 10.1016/j.enconman.2012.12.023. hal-00868596
Transcript
HAL Id: hal-00868596https://hal.archives-ouvertes.fr/hal-00868596
Submitted on 1 Oct 2013
HAL is a multi-disciplinary open accessarchive for the deposit and dissemination of sci-entific research documents, whether they are pub-lished or not. The documents may come fromteaching and research institutions in France orabroad, or from public or private research centers.
L’archive ouverte pluridisciplinaire HAL, estdestinée au dépôt et à la diffusion de documentsscientifiques de niveau recherche, publiés ou non,émanant des établissements d’enseignement et derecherche français ou étrangers, des laboratoirespublics ou privés.
Pyrolysis in Porous Media: Part 1. Numerical modeland parametric study
Luigi Romagnosi, Nicolas Gascoin, Eddy El Tabach, Ivan Fedioun, MarcBouchez, Johan Steelant
To cite this version:Luigi Romagnosi, Nicolas Gascoin, Eddy El Tabach, Ivan Fedioun, Marc Bouchez, et al.. Pyrolysis inPorous Media: Part 1. Numerical model and parametric study. Energy Conversion and Management,Elsevier, 2013, 68, pp.63-73. �10.1016/j.enconman.2012.12.023�. �hal-00868596�
= averaged value of general quantity upstream and downstream to the porous medium () 23
I. Introduction 24
Porous media are encountered in a wide variety of applications (geology, aerospace, biomass, separation 25
process). In the framework of aerospace structures cooling, ceramic matrix composite materials are used to sustain 26
the large heat load due to combustion [1-4]. Active transpiration cooling enables the internal cooling of the 27
structures by convection between the filtrating fluid and the solid [5-7]. In case of using hydrocarbon fuel as a 28
coolant, these heat and mass transfers imply also chemical reactions due to the fuel pyrolysis [8]. Fluid such as 29
methane are generally considered for rocket engines application [9]. Multi-species flow is obtained and multi-phase 30
3/30
flow can even be generated due to the formation of light species and heavy ones (up to solid coke particles). The 1
presence of solid carbon deposit inside the porosity of the solid modifies its permeability [8]. Similarly ablation 2
involves chemical reactions with surface effect, radiation and fluid flow in porosity caused by the formation of 3
permeable char [10,11]. The coal pyrolysis is driven by the same phenomena [12]. 4
The understanding of the multiphysics' coupling is necessary in order to predict the efficiency of the cooling 5
technique. The micro-scale of the pores in permeable materials makes this work challenging. The characteristic 6
timescales and length scales of the involved phenomena differ strongly. Either experimental or numerical studies are 7
possible to investigate separately the fluid flow, the heat transfer and the chemistry aspects. Nevertheless 8
experimentally investigating the coupling of these three aspects is quite complex. The formation of pyrolysis 9
products inside the porous medium is both dependent on temporal and spatial dwelling. The residence time is 10
different for each species (due to multi-component diffusion) [13] while the thermal and hydraulic gradients depend 11
on microscopic considerations such as fibers' layer, heterogeneity of the material, tortuosity, permeability [14]. The 12
coke formation impacts the permeability, and hence also the fluid flow and the associated heat transfer [15]. 13
Moreover, catalycity might be another phenomenon to be considered depending on the solid material composition 14
[16]. Consequently, to help analysing the experimental results a numerical approach is proposed in this work 15
obtained previously with a specific bench of heavy hydrocarbons pyrolysis within porous media [8]. 16
A brief overview of existing studies from open literature is proposed to clearly state what is currently achieved in 17
the framework of porous reacting flow simulation. Numerical modelling of pyrolysis in permeable structure is found 18
to be taken into account by either a one-step Arrhenius law or with semi-detailed kinetic [17]. The work of Ratte et 19
al. is interesting despite it is not specifically dedicated to porous materials because they investigate numerically the 20
chemical composition profile in a wood particle [18]. Their chemistry description is limited (about 10 species) but it 21
simulates the spatial profiles of coupled thermal and chemical parameters. Another modelling of reacting system 22
with explicit simulation of the porous zone is proposed by Margolis and Telengator [19]. Despite they do not 23
consider the chemical reaction pathway, their description enables investigating closely the effect of the pressure in 24
case of exothermic degradation within the energetic materials. The work of Ravi et al. [20] is similar in terms of 25
modelling despite the applications differ. A single chemical reaction (data derived from ThermoGravimetry 26
measures) is considered and the void fraction produced during the degradation is modelled. This enables considering 27
the thermal and fluid coupling. The thermal properties of the solid vary with the modification of the porosity, which 28
4/30
is related to the variation of the chemical composition (char and void content). Through these three studies [18-20], 1
it is seen that the modelling either focuses on the porous flow or on the chemistry but rarely on both key points, or 2
only with simple kinetic schemes. 3
Concerning the porous zone, its modelling is still not obvious (internal 3-D heterogeneous geometry, radiation, 4
physical properties, fluid-solid interactions). Jaojaruek and Kumar [21] consider the porous media with constant 5
average properties in equilibrium with the fluid phase. The material is assumed to be a grey body. A permanent 6
regime is considered and a single Arrhenius law is used for solving the chemistry. Their code allows the modelling 7
of gasification process involving the conversion of hydrocarbon fuels. Similarly for wood thermal degradation, Sand 8
et al. [22] use Navier-Stokes equations and energy balance to compute the porous flow. The permeability varies with 9
the solid conversion rate and a mixed series-and-parallel law takes the different constituents into account. A two-10
steps mechanism with the formation of six solid, liquid and gas species is used. The radiation is determined globally 11
for a grey body. The emissivity varies with the production of char. Some experiments are performed to validate this 12
code. The thermal and catalytic cracking of hydrocarbon feedstocks also conduct to study the formation of light 13
hydrocarbons in porous catalytic materials [23]. The numerical work of Mesalhy et al. [24] explicitly considers the 14
Darcy's and Forchheimer's terms for the fluid flow permeation. The thermal and porosity properties of the solid are 15
observed with respect to their effects on the change of phase of the inner fluid. Non-equilibrium conditions between 16
solid and liquid are used, which is not so common in open literature. In these works [21-24], neither turbulence 17
model nor highly detailed mechanism is used. 18
Numerous papers can be found on the theory of fluid filtration within porous media [25]. The different analytical 19
laws describing the fluid flow are now well-known [26]. Analytical equations for transport equations of species in 20
porous media are also found in studies related to permeation through membranes for separation process [27]. These 21
equations are simpler than those which are necessary to describe multi-species reacting flow. Some analytical work 22
can be mentioned considering the non-equilibrium thermal flow within porous media [28-30]. 23
In addition to pyrolysis processes, combustion is also observed in porous media with an increased efficiency as 24
the solid heat conditions enhance the heat transfer from the burned gases to the fresh gases. In case of solid fuel, its 25
porosity plays a role on the combustion efficiency [31]. The combustion studies within energetic porous materials 26
are of interest for solid propulsion and explosives applications [32]. Reactive flow permeation can even be found 27
under detonation regime, which shows the wide diversity of studies related to porous media. Al-Hamamre et al. [33] 28
5/30
present an experimental work with some numerical results to investigate the combustion of gases (CH4 and CO2 1
mainly) resulting from waste recycling. The detailed chemistry is split between heat and mass transfers which are 2
solved separately. The 3-D code solving the fluid flow in the porous media considers homogeneous properties of the 3
porous solid with the inner fluid. 4
The modelling of porous flow also refers to the solid itself. A large part of studies related to carbon based porous 5
materials is related to the production of carbon films for their adsorbent and catalyst characteristics. Experiments on 6
their pyrolysis enable studying the associated changes of porosity [34,35]. The determination of the pore size is 7
conducted either by visualisations or by permeation method [36]. The experiments are generally conducted under 8
steady-state conditions but some transient works also exist [37]. The oxidative pyrolysis is also investigated to 9
determine the formation of pores (void fractions and pore diameter distribution) in the solid phase due to the heating 10
and chemical reactions (function of the conversion rate) [38,39]. The pores' size and distribution in case of coal 11
pyrolysis at 1023 K has been experimentally investigated by Yardim et al. in presence of water [40]. The repartition 12
of solid, liquid and gas products has been observed. Takeichi et al. [41] propose SEM images of the porous carbon 13
materials in case of pyrolysis of raw organic material up to 1173 K. The pore size distribution is driven by the initial 14
composition of the material. The synthesis of carbon hollow spheres and tubes is also obtained by hydrocarbon raw 15
material pyrolysis [42,43]. All of these works are related to the degradation of the porous material itself while no 16
such a solid pyrolysis is expected in the present work. Nevertheless, these references are interesting because they 17
show the link between porosity and chemistry in case of degradation. It has been shown in previous work that the 18
permeability should also change in case of hydrocarbon pyrolysis within porous material because of coke formation 19
[8]. It is thus clear that the coupling between porous material and porosity changes are mainly studied by 20
experiments when coupled to chemistry. Very few works are dedicated to the simulation of hydrocarbon pyrolysis 21
without direct porosity modification (i.e. in case of solid degradation). In case of fuel degradation, the formation of 22
coke modifies the permeability but this is quite indirect. It depends on the fluid flow and on the size of the particles. 23
It can be concluded from this literature survey that the numerical simulation involving chemistry, porous 24
material and heat and mass transfers are quite rare. Only few consider explicitly the radiation through global law and 25
none of them investigate the multi-species flow. The physical properties are generally computed as average values 26
for the porous zone between the solid and fluid data. The microscopic description of the through flow is rarely 27
encountered in case of reactive flow. 28
6/30
The present study aims at proposing a numerical simulation of an experimental bench made for fuel pyrolysis 1
[8]. To ensure the reliability of this simulation, numerous verifications and validations are performed since the 2
modelling of reactive fluid flow in porous media is still scarce in the open literature. It has been a choice of the 3
authors to use ready-to-use commercial software to determine in which extent this kind of numerical tools is able to 4
handle complex multi-physic configurations. Without loosing in scientific quality and value, this contribution to the 5
porous flow research activities should be seen as a preliminary step to be later extended through the multiplication 6
of related works. Using semi-detailed kinetic mechanism is required to propose a fine description of the chemical 7
process. The maximum size of the kinetic scheme compatible with Computation Fluid Dynamics (CFD) code is 8
investigated. This simulation is then used for comparison in a companion paper [44] to improve the analysis and the 9
understanding of the experimental results. In this second paper, the validity of the numerical code will be discussed 10
in more details than in this first part (pressure drop is found with an uncertainty of ±0.005 %; permeabilities with 11
uncertainties of ±30 %; chemical composition with absolute uncertainties up to 25 %). 12
II. Description of the test cell geometry and of the numerical code 13
A steady-state and axisymmetric simulation is proposed using the commercial CFD code, Ansys/Fluent, to 14
support the experiments performed previously [8, 45]. The experimental apparatus to be simulated is referred in the 15
following as the "test cell". Large details on the numerical methods are given in the present section since this is as 16
much important as the results themselves to ensure their consistency. 17
A. Design of the test cell and boundary conditions 18
The test cell [45], made of stainless steel, is composed of a pipe of 5 mm diameter where the fluid is injected, of 19
a central body (36 mm long and 16 mm of inner diameter) and of an exit pipe, which is identical to the inlet one 20
(Figure 1). The porous sample is located slightly offset from the centreline of the cell. It has a radius of 15 mm and a 21
thickness of 3 mm. For the present work, a non-reacting and non-catalytic medium made of stainless steel is selected 22
(the so-called SS3 sample with porosity of 30.4 %, grain diameter of 14.1 m and pore diameter of 4.1 m) [45]. 23
The grid consists in 14,242 structured mesh cells with typical characteristic size of 0.2 mm, distributed uniformly 24
along the test cell. The reference position along the longitudinal axis is taken at the inlet of the porous zone and the 25
one along the radial axis is on the symmetry line (Figure 1). The x-axis is oriented from the left to the right and the 26
y-axis from the bottom to the top. Some elements of the real test cell (like the sensors, the drilling and the threading) 27
7/30
have not been modelled to simplify the numerical case. These elements are supposed to have a negligible impact on 1
the turbulence development and thus on the heat transfers. 2
The boundary conditions are the one of the experimental cases to be simulated. The walls temperature is constant 3
and it is the one experimentally measured for stabilized conditions. The inlet fluid presents the same temperature 4
because of a pre-heating zone in the experiments [8]. The downstream pressure is adjusted to get the experimentally 5
measured one at the inlet of the system. The mass flow rate is imposed at the inlet. Two fluids (nitrogen and 6
dodecane) and several operating conditions have been tested. Dodecane has been preferred for comparisons purpose 7
but methane should be considered in latter steps. The tests cases with nitrogen were formerly compared to the 8
experimental work (Figure 2) to define the best computing methods for the inert gas flow (work of Fedioun et al. 9
since 2008 [46-48]). On the basis of Figure 2, an uncertainty of 7.5 % is obtained when comparing experiments and 10
numerical results. This will be analysed in the companion papers when considering the permeabilities errors [44]. 11
The results corresponding to the hydrocarbon only are presented in this paper to specifically focus on reactive flow, 12
which is the aim of the present work. 13
Figure 1 should be placed here 14 Figure 2 should be placed here 15
B. Numerical modelling and assumptions 16
The porous zone is treated as a fluid zone where the pressure drop is simulated by adding a sink term Si (Eq. 1) 17
in the momentum equation (Eq. 2). Si is defined as the sum of viscous loss term (the Darcy’s term, the first one on 18
the right hand side of Eq. 1) and of the inertial loss term (the second one on the right-hand side of Eq. 1). The 19
permeability and the inertial resistance values of the SS3 porous sample are taken directly from the experimental 20
results (α = 2.061·10-13 m2 and C2 = 4,924,000 m-1) [45]. The modified governing equations for a single phase flow 21
are given by Eq.2, Eq. 3 and Eq. 4. 22
iii vvCvS
2
12 (1) 23
iff
f SgPvvt
v
(2) 24
0
v
t ff
(3) 25
hfiiieffffssff SvJhTkPEvEE
t
1 (4) 26
8/30
In this paper, the fuel physical properties are determined as a function of temperature during the simulation. 1
Concerning the computations of real fluid properties, the modified Redlich-Kwong equation developed by Aungier 2
was chosen [49]. It is specifically developed for solving supercritical flows. It requires knowing the species critical 3
properties such as the critical temperature, pressure and volume and the acentric factor. The mixture critical 4
properties are evaluated by Aungier-Redlich-Kwong mixture law. This cubic law takes into account the reduction in 5
pressure due to the intermolecular attractive forces and the lower available volume due to the repulsive forces 6
considering also that each particle occupies its own volume. 7
In the porous zone, the physical properties are obtained combining properly the fluid characteristics with the 8
solid ones. For example, by default, effk is the thermal conductivity of the binary system fluid plus solid evaluated 9
with a parallel law (Eq. 5). The thermal conductivity of the SS3 material is calculated as a function of the 10
temperature with an averaged method between the Parallel and the Maxwell Upper Limit methods 11
(kSS3 = – 1.1873·10-5 ·T2 + 2.6261·10-2 ·T + 6.7647) [46]. The radiative contributions are not considered due to the 12
low thermal gradients which are typically found in pyrolysis processes (in opposite to combustion cases). In 13
addition, using radiation is difficult because of a numerical code limitation which models the porous zone as a fluid 14
zone. Some computations were conducted by considering the radiation but no visible discrepancies have been 15
observed. For this reason, no radiation is explicitly considered in the present work. 16
sfeff kkk 1 (5) 17
Several tests have been performed to choose the best computing options. A pressure based solver is employed 18
and the gradients are solved with a Least Squares Cell based method. A 2nd order scheme is used for the momentum 19
and the energy equations. When ambient temperature tests are simulated with dodecane, incompressible fluid 20
hypothesis is preferred. When reactive dodecane flow is considered (roughly for temperature higher than 800 K), the 21
species transport equations are added to the Navier-Stokes equations system (Eq. 2 to Eq. 4) and the case is slightly 22
simplified switching from second to first order scheme. In this case, the transport mass balance is computed for all 23
the species except for the major one to ensure a mass fraction sum equal to unity. The low mass flow rate ensures 24
that the turbulence effects are negligible in the entire domain and low total pressure drop due to the dissipative effect 25
at the wall. For this reason, the turbulence model is turned off and the wall friction is set to zero in this case. In the 26
core of the present work, the quantitative effects of the most important parameters on the physical and chemical 27
9/30
variables are determined. Thus, details regarding the choice of the classical parameters mentioned above are not 1
given since the reader could refer to common knowledge from literature for CFD modelling and computations [50]. 2
All of the numerical test cases to be considered in this work correspond to laminar flows. Anyway, it is possible 3
to include the small turbulence effect within the cell in order to obtain a more realistic solution and to consider the 4
flow through the porous media as laminar. That means that the turbulence at the inlet of the SS3 sample will be 5
transported downstream and its effect on the mixing and on the momentum will be ignored. The assumption, in 6
considering the flow as laminar in the porous medium, has been verified as follows. Analytically, by reversing the 7
Forchheimer’s equation and by imposing the pressure drop obtained numerically, it is possible to calculate an 8
equivalent velocity. For a nitrogen case with the highest mass flow rate value which has been simulated (pressure 9
drop of 2.5 MPa and mass flow rate of 3.98 g.s-1), the fluid speed is about 0.63 m.s-1. This mass flow rate is the 10
maximum one in the test cases which have been performed. It is much lower for the dodecane tests (lower than 11
0.1 g.s-1). For this equivalent velocity of 0.63 m.s-1, the Reynolds number based on the pore diameter is Redp = 3.63 12
and the one based on the grain diameter is Redg = 12.49. The first value suggests that the flow inside the porous 13
medium is laminar while the second one is slightly over the limit given by Sobieski and Trykosko for such a flow 14
[51]. Indeed, they found that the ranges of validity for the Darcy's law is for a Reynolds number from 10-5 to 10, the 15
Forchheimer's range is from 10 to 80 and the Brinkman's equation (Eq. 6) is valid over 120. As a consequence, the 16
flow is laminar in all the cases presented in this work. This is also probably valid for the above nitrogen case (Redg = 17
12.49) because the limit at Re = 10 is not so accurate. The definition of the Reynolds number (either a function of 18
pore or grain diameters) is even questionable. 19
vvK
vKx
P
FD
22
(6) 20
In case of reactive flow, a semi-detailed kinetic mechanism can be used. The one proposed by You et al. [52] is 21
considered (56 species and 289 reactions). It has been manually reduced by the present authors to get different size 22
mechanisms. First, a very simple scheme has been tested (Eq. 7 and Eq. 8). It involves four species (dodecane, 23
ethylene, propyl and butyl) and two reactions. Other mechanisms have also been generated and tested. Among them, 24
one with 15 species and 20 reactions will be presented in the results (section III). 25
C12H26 => 3 C2H4+2 C3H7 (7) 26
C12H26 => 2 C2H4+2 C4H9 (8) 27
10/30
The In-Situ Adaptive Tabulation (ISAT) method has been used for some reactive cases. It consists in tabulating 1
the chemistry after having construct data tables during the simulation by using the detailed kinetic mechanism. The 2
fundamental principle of the algorithm is to avoid the direct integration over time of the chemical source terms (one 3
for each species) in updating the new species mass fractions. Indeed, it is possible to cover all the realizable initial 4
states and time steps, saving these in tables and solving the chemistry by “look-up tables”. Creating the tables a 5
priori including also none encountered states is a waste of time and for this reason the tables must be built during the 6
simulation (in-situ), based on realistic states. More details can be found in [53] on the ISAT theory. When not 7
mentioned in the paper, the tolerance for the ISAT convergence is 10-6 to compute the residuals. More generally, all 8
the residuals are below 10-5 in order to ensure the right convergence of mass, momentum and energy. The authors 9
noted during their work that the pressure based solver shows a faster convergence than the density based one, when 10
ISAT algorithm is turned on. 11
The multi-species diffusion has been considered in the numerical simulation. The effects of the enthalpy 12
transport due to the species diffusion are taken into account adding the following term in the energy equation: 13
N
j
jj Jh where jmixjj YDJ
, is the diffusion flux of the j-species and mixjD , is the diluted diffusion (i.e. 14
the diffusion coefficient of j-species in the mixture). Considering the Soret effect, the diffusion flux vector Jj must be 15
rewritten as (Fick’s law): T
TDYDJ jTjmixjj
,, . It allows considering the mass diffusion due to the thermal 16
gradient, which implies that heavy molecules diffuse less rapidly than the light ones. When the full multi-component 17
diffusion is turned on, the Maxwell-Stefan equation is used to compute the diffusion flux vector obtaining a 18
generalized Fick’s law where mixjD , is replaced by the mutual diffusion of each species in other species jiD , [13]. 19
This model requires computing N2 co-factor determinants of size 11 NN and one determinant of size 20
NN [54], where N is the number of species. 21
It can be noticed that the mass and energy conservations, when applicable, are monitored during the 22
computations to ensure their numerical reliability (which is the least for such CFD calculations and which mist be 23
coupled to the physical validation of the results). The numerical tolerances are generally 10-5 as stated above. 24
11/30
III. Parametric study on the modelling options of the numerical code 1
The aim of this work is to investigate the effects of several parameters on the numerical results to determine the 2
best way to simulate the complex multiphysics compressible unsteady reactive process. Two velocity models are 3
considered as well as the species diffusion, the In-Situ Adaptive Tabulation (ISAT) parameters, the kinetic scheme 4
and the perfect or real fluid behaviours. 5
A. Fluid velocity modelling in the porous zone 6
1. Inert fuel at the ambient temperature 7
For a mass flow rate of 65 mg.s-1 and an inlet pressure of 3.5 MPa, the cold kerosene surrogate enters the cell at 8
ambient temperature with a velocity of 4.4 mm.s-1 and a density of 746 kg.m-3. Crossing the porous zone, it 9
undergoes a pressure drop of about 7600 Pa (Figure 3a). The high viscosity of the fluid (µ = 0.0014 Pa·s at the inlet) 10
bounds the recirculation zone close to the upstream step and it nearly forms a uniform flow at the porous medium 11
inlet. Observing the contour of axial velocity in Figure 3b, no velocity variation within the porous medium appears. 12
It is due to the superficial velocity model used in the numerical code. The superficial velocity is defined as the ratio 13
between the volume flow rate [m3/s] and the geometrical cross section [m2]. This value is constant from the inlet to 14
the outlet. The pressure drop and its impact on the density are not considered. The porosity is not used in the 15
transport equations, which means that the cells of the porous medium are considered to be entirely open. As a 16
consequence, this model cannot predict the increase in velocity due to reduced cross section. For this reason, this 17
model is judged to be not adapted despite it is interesting for computation time and stability reasons. The velocity 18
gradients inside the porous medium should not be neglected because they become important when chemical 19
reactions occur. Thus, the physical velocity model is tested. 20
The effective cross section is about 65 mm2 when considering the porosity value (instead of 201 mm2 which is 21
the real cross section exposed to the flow). Thus, the axial velocity increases by 233 % along the axis of symmetry 22
from 0.37 mm.s-1 to 1.24 mm.s-1 (Figure 4a, for non-reactive isothermal dodecane at 300 K). This sudden jump of 23
velocity at the porous medium inlet is due to the mass conservation. The reduction in cross section at the interface 24
fluid-porous zone (upstream side) imposes that the product ρUx increases for the conservation of mass flow (Aeff < 25
Aexp). Since the density is set constant, the flow speed increases and it remains constant along each streamline. At 26
the outlet, the opposite of the inlet appears (sudden decrease of the fluid speed). By calculating varying density, the 27
12/30
effect of the pressure, which decreases through the permeable sample, could have been seen. This would correspond 1
to a velocity increase. Considering the velocity change in the porous zone modifies the Reynolds number (Redp = 2
2.78.10-3 for the physical model) and moreover the residence time (tr_phy = 2.42 s instead of tr_sup = 8.27 s). This is of 3
major importance because the residence time directly impacts the heat transfers between the porous solid and the 4
fluid. As a consequence, it plays a role on the pyrolysis process. For this reason, the way the fluid filtrates through 5
the porous zone needed to be investigated. 6
Figure 3 should be placed here 7 Figure 4 should be placed here 8
2. Reactive fuel at temperature over the pyrolysis one 9
In case of hot flow (inlet fluid: 3.5 MPa and 1200 K; walls: 1230 K; 2 reactions scheme), the velocity increases 10
through the porous zone due to the heating process (decrease of the density) (Figure 4b). This trend is less visible for 11
the superficial model than for the physical one. The rise is reinforced for the physical model because of the pressure 12
drop effect on the density (due to pyrolysis). In addition, the fluid flow model in the porous zone has a major impact 13
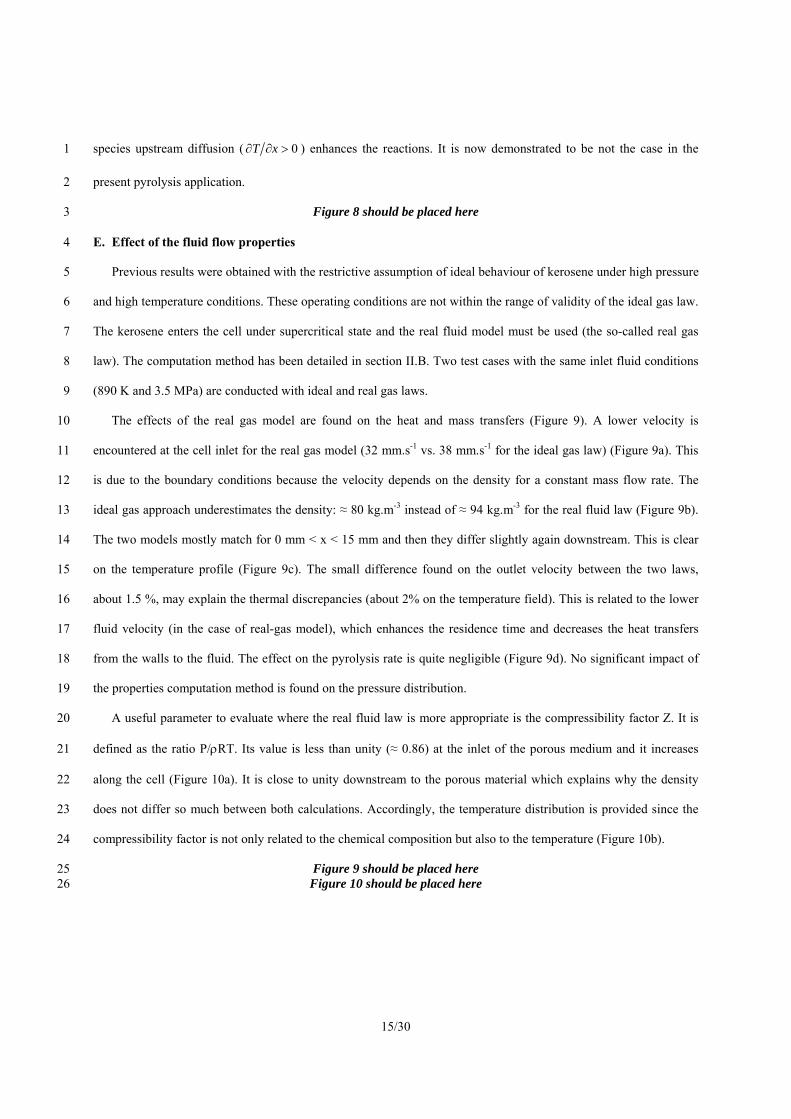
on the chemistry. To investigate this point, the species mass fractions have been averaged for each x-position over 14
the entire y-position and the difference of values between both cases is observed (Figure 5a). At the test cell outlet, 15
the superficial model presents a higher pyrolysis rate than the physical one because the remaining mass fraction of 16
dodecane is lower (Figure 5b). This is attributed to a longer residence time of the fluid in the porous medium with 17
the superficial model as presented in previous section. Nevertheless, the differences remain quite small. 18
Figure 5 should be placed here 19
B. Effect of the chemical reactions on the heat and mass transfers 20
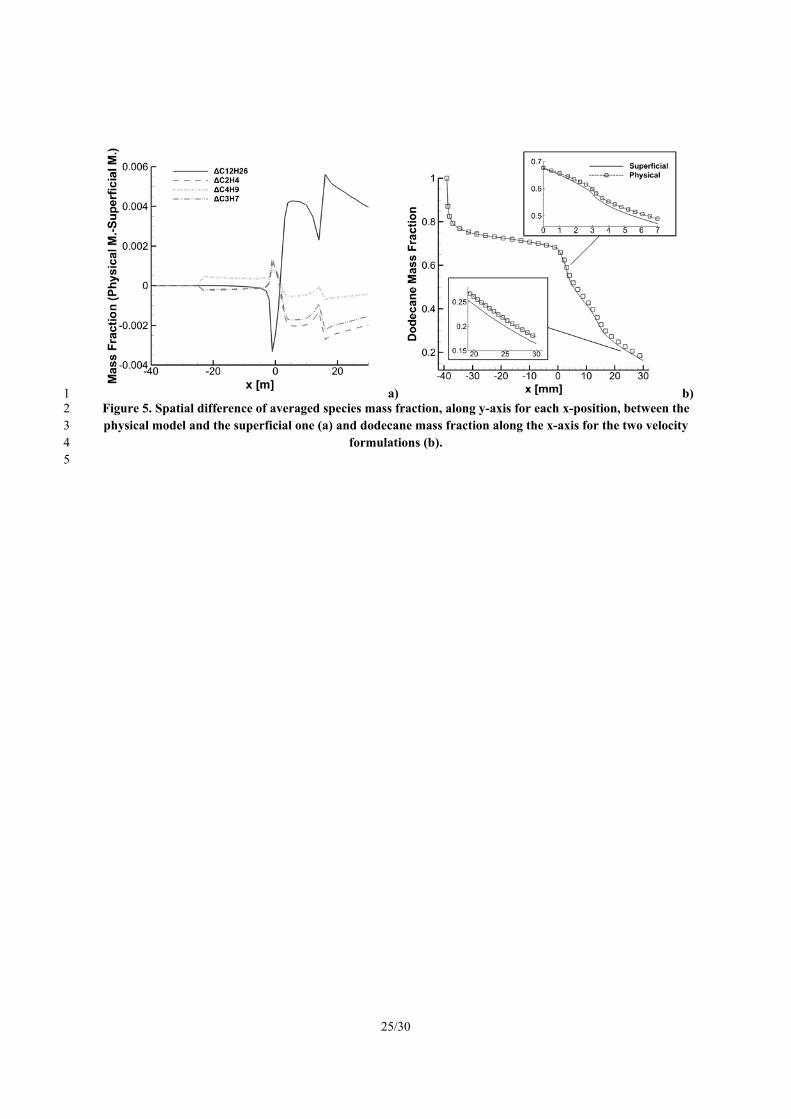
To identify the effect of the chemistry (fuel cracking), a similar computation to the one above at high 21
temperature (1200 K) is achieved by turning the chemical reactions off in the porous zone. The thermal effect is 22
investigated (without chemistry). Along the porous medium in the x-direction, the axial velocity clearly increases 23
when the chemical reactions are solved (Figure 6a). This is due to the decrease of the molecular weight during the 24
pyrolysis process. The fluid constant (r=R/M) increases resulting into an expansion of the flow. Because of the 25
boundary conditions, the outlet pressure in both reacting and none reacting cases are similar but the inlet one slightly 26
differs (Figure 6b). It is higher for the reactive case than for the other one, which is in agreement with the higher 27
fluid velocity. At the porous zone inlet, a temperature rise is observed (Figure 6c). This is due to the conductive heat 28
transfer between the porous medium and the fluid. The high thermal conductivity of the solid enhances the 29
13/30
conductive heat transfer and the temperature increases of about 50 K in less than 0.1 mm for the case without 1
reactions. Then, it continues to increase along the SS3 material (22 K more over the 3 mm). Around x = 3 mm, close 2
to the outlet of the porous zone, the temperature decreases sharply because a part of this accumulated heat is 3
transferred to the downstream system. By comparing both test cases, the heat transfers are clearly impacted by the 4
chemistry. The temperature gradient between points 0 mm and 3 mm is divided by a factor 2 when considering the 5
chemistry (34 K for the reactive case and 72 K for the inert one). Due to the endothermic effect of the pyrolysis, the 6
inlet temperature rise is the lowest for the reactive case, only 20 K instead of 50 K (Figure 6c). The maximum fluid 7
temperature reached in the reactive case is 1002 K (starting from 968 K at the inlet) instead of 1078 K for the inert 8
case (starting from 1006 K at the inlet). 9
The combined effect on the density decrease of the thermal heating of the fluid and of the pressure drop is 10
different between both cases (Figure 6d). For the reactive case, the chemistry tends to smooth the sharp gradients 11
observed at the porous zone inlet because of the difference in terms of cross section. For the inert case, the density is 12
almost constant around 30 kg.m-3; which shows that the slight pressure drop (around 7000 Pa) has a minor impact on 13
the density. A similar conclusion for the thermal effect on the density can be proposed. As a consequence, the 14
density changes in the porous zone are mainly due to the chemistry since the reacting case presents much density 15
variations. This imposes to investigate the way the multi-species flow is treated. The computation method of the 16
density will be investigated in section III.E. 17
Figure 6 should be placed here 18
C. Tabulation of the chemistry during kinetic computations 19
The stiff problems are characterized by different chemical timescales. The ISAT algorithm offers a faster 20
convergence but the accuracy of the results strictly depends on the configuration parameters (table size, number of 21
trees and tolerance). The first two parameters mainly affect the time required by the solver to build the tables. 22
Therefore a sensitivity analysis has been performed on the ISAT error tolerance. As an example, the results of two 23
calculations with 10-4 and 10-5 tolerances have been compared and the resulting differences in terms of species mass 24
fraction are presented in Figure 7a,b. Although all residuals are converged, the reduction of the ISAT tolerance from 25
10-4 to 10-5 causes some changes in the species mass fraction to the third decimal. This may be considered as 26
negligible but when using more complex kinetic schemes, this difference could be of importance. Indeed, some 27
important radicals are formed with much lower amount (generally less than 10-3). The higher discrepancies are 28
14/30
found for the dodecane in the porous zone (up to 0.009 in terms of mass fraction) (Figure 7a). The differences 1
become less significant when reducing further the ISAT value to 10-6 (Figure 7c,d). When decreasing the tolerance 2
by one order of magnitude (10-5 to 10-6), the difference is divided by a factor 4. As a consequence, this process 3
should be repeated until the species variation is lower than a fixed limit. However, a lower tolerance requires a 4
higher computation cost and a compromise between speed and accuracy should be found. For the simplest kinetic 5
scheme (4 species and 2 reactions), the ISAT tolerance of 10-5 is judged to be acceptable while a tolerance of 10-6 is 6
preferred for the more detailed schemes, where some fluctuations of species could appear for coarse tolerances. 7
Figure 7 should be placed here 8
The ISAT tolerance also impacts the heat and mass transfers. As an example, a discrepancy of 10 % is found 9
between two cases on the fluid temperature in the recirculation zone, before the porous zone inlet. Indeed, a 10
temperature around 940 K is calculated for a tolerance of 10-4 and it is about 1040 K for a tolerance of 10-6. 11
D. Effect of the multi-component diffusion 12
To evaluate the contribution of multi-component diffusion in the coupling between chemistry and mass transfer, 13
a more complex chemical kinetic mechanism has been used (15 species and 20 reactions). It includes lighter species 14
such as radicals H and CH3. This mechanism is a simplified version of the mechanism developed by You et al. [52]. 15
A maximum around hundred reactions was found by the authors to run the numerical simulation within a reasonable 16
time (less than one month for steady-state calculation) with a desktop computer (8 cores). Using a 20 reactions 17
scheme enables faster computations. Two computations have been done with and without diffusion. The effect of 18
the diffusion is observed on dodecane and on hydrogen (Figure 8). For a number of y-positions, the x-axis 19
evolutions of the mass fractions are slightly shifted downstream when considering the diffusion. As a consequence, 20
the pyrolysis process is slightly delayed due to the faster diffusion of light species such as the radicals. The 21
explanation is the following. Upstream to the porous medium, the thermal gradient along the x-coordinate is 22
negative. This means that when radical species are produced their axial diffusion velocity increases due to the Soret 23
effect. Consequently, the reaction zone slightly shifts downstream despite the effect of the diffusion is clearly less 24
than the other heat and mass transfer effects. This result is still interesting because in other reactive process like 25
combustion system, the temperature gradients between hot products and cold reactants are so high that the hot 26
15/30
species upstream diffusion ( 0 xT ) enhances the reactions. It is now demonstrated to be not the case in the 1
present pyrolysis application. 2
Figure 8 should be placed here 3
E. Effect of the fluid flow properties 4
Previous results were obtained with the restrictive assumption of ideal behaviour of kerosene under high pressure 5
and high temperature conditions. These operating conditions are not within the range of validity of the ideal gas law. 6
The kerosene enters the cell under supercritical state and the real fluid model must be used (the so-called real gas 7
law). The computation method has been detailed in section II.B. Two test cases with the same inlet fluid conditions 8
(890 K and 3.5 MPa) are conducted with ideal and real gas laws. 9
The effects of the real gas model are found on the heat and mass transfers (Figure 9). A lower velocity is 10
encountered at the cell inlet for the real gas model (32 mm.s-1 vs. 38 mm.s-1 for the ideal gas law) (Figure 9a). This 11
is due to the boundary conditions because the velocity depends on the density for a constant mass flow rate. The 12
ideal gas approach underestimates the density: ≈ 80 kg.m-3 instead of ≈ 94 kg.m-3 for the real fluid law (Figure 9b). 13
The two models mostly match for 0 mm < x < 15 mm and then they differ slightly again downstream. This is clear 14
on the temperature profile (Figure 9c). The small difference found on the outlet velocity between the two laws, 15
about 1.5 %, may explain the thermal discrepancies (about 2% on the temperature field). This is related to the lower 16
fluid velocity (in the case of real-gas model), which enhances the residence time and decreases the heat transfers 17
from the walls to the fluid. The effect on the pyrolysis rate is quite negligible (Figure 9d). No significant impact of 18
the properties computation method is found on the pressure distribution. 19
A useful parameter to evaluate where the real fluid law is more appropriate is the compressibility factor Z. It is 20
defined as the ratio P/RT. Its value is less than unity (≈ 0.86) at the inlet of the porous medium and it increases 21
along the cell (Figure 10a). It is close to unity downstream to the porous material which explains why the density 22
does not differ so much between both calculations. Accordingly, the temperature distribution is provided since the 23
compressibility factor is not only related to the chemical composition but also to the temperature (Figure 10b). 24
Figure 9 should be placed here 25 Figure 10 should be placed here 26
16/30
The numerical simulation is demonstrated to present important advantages for the reactive permeation studies 1
despite experiments are mandatory to ensure the validity of the computations, where all the microscopic phenomena 2
(heterogeneous reactions, pores size and distribution) cannot be accurately simulated but only fairly modelled. 3
IV. Conclusion 4
The numerical investigations of hydrocarbon fuel pyrolysis in porous media are generally found in extremely 5
limited number in the open literature. Most of the related works fall in the ablation topics and wood pyrolysis fields. 6
Experimentally, fuel decomposition is slightly more investigated despite the existing studies remain rare. To 7
enhance the comprehension of such coupled heat and mass transfers with chemical reactions, numerical simulation 8
is of interest to grant access to the residence time distribution, to the flow heterogeneities, to the not uniform 9
permeation profiles and to the thermal and chemical gradients. The present work, conducted within a European 10
collaboration, enables to settle a correct representation of an experimental reactive permeation bench. Numerous 11
numerical points (radiation, multi-component diffusion, fluid properties, fluid velocity in the porous zone and 12
computation way of the chemistry) have been investigated to ensure the validity of the results. Thanks to this 13
simulation development, reactive fluid is handled in a companion paper [44] with comparison to experiments in 14
order to provide a deeper analysis of these experimental results. A comparison to the one dimensional analytical 15
Forchheimer's equation will enable observing the effect of two dimensional heterogeneous flow profile on the inert 16
fluid permeation. Methane should be latter investigated for rocket engines application. 17
Acknowledgments 18
This work was supported by the ESA-ESTEC, Contract no.: 3-12861/09/NL/PA. The authors would like to 19
sincerely thank F. Travajno and B. Le Naour from MBDA-France, G. Fau, P. Gillard and C. Strozzi from PRISME, 20
D. Blanc and D. Courilleau from IUT Bourges, D. Davidenko from CNRS-ICARE Orléans, A. Ingenito from the 21
University of Rome La Sapienza (Italy) and all the students involved in the projects head by I. Fedioun for their 22
technical and scientific support involving the computations and the experiments. 23
References 24
[1] M. Bouchez, S. Beyer, PTAH-SOCAR Fuel-Cooled Composite Materials Structure: 2009 Status, 16th 25 AIAA/DLR/DGLR International Space Planes and Hypersonic Systems and Technologies Conference, 26 October 2009, Bremen, Germany, AIAA 2009-7353 27
17/30
[2] P Nguyen, C Pham, Innovative porous SiC-based materials: From nanoscopic understandings to tunable 1 carriers serving catalytic needs, Applied Catalysis A: General, 391 (2011) 443–454 2
[3] R. Arnold, D. Suslov, O. Haidn, Film Cooling of Accelerated Flow in a Subscale Combustion Chamber, 3 Journal of Propulsion and Power, 25 (2), (2009) 443-451 4
[4] T. Kanda, G. Masuya, Y. Wakamatsu, A. Kanmuri, N. Chinzei, M. Niino, Effect of regenerative cooling on 5 rocket engine specific impulse, Journal of Propulsion and Power, 10 (2) (1994) 286-288 6
[5] T. Langener, J. von Wolfersdorf, T. Laux, J. Steelant, Experimental Investigation of Transpiration Cooling 7 with Subsonic and Supersonic Flows at Moderate Temperature Levels, 44th AIAA/ASME/SAE/ASEE 8 Joint Propulsion Conference & Exhibit 21 - 23 July 2008, Hartford, CT, AIAA 2008-5174 9
[6] T. Langener, J. von Wolfersdorf, J.Steelant, Experimental Investigations on transpiration Cooling for 10 Scramjet Applications Using Different Coolants, AIAA Journal, 49 (7) (2011) 1409-1419. 11
[7] M. Kuhn and H. Hald, Application of Transpiration Cooling for Hot Structures, RESPACE – Key Tech. for 12 Reusable Space Sys., NNFM 98, (2008) 82–103 13
[8] G. Fau, N. Gascoin, P. Gillard, M. Bouchez, J. Steelant, Fuel Pyrolysis through Porous Media: Coke 14 Formation and Coupled effect on Permeability., 17th AIAA International Space Planes and Hypersonic 15 Systems and Technologies Conference, 11-14 Apr 2011, San Francisco, AIAA-2011-2206 16
[9] F. Di Matteo, M. De Rosa, M. Pizzarelli, M. Onofri, Modelling of Stratification in Cooling Channels and 17 its Implementation in a Transient System Analysis Tool, in: 46th AIAA/ASME/SAE/ASEE Joint 18 Propulsion Conference & Exhibit 25 - 28 July 2010, Nashville, TN, AIAA 2010-6974 19
[10] G.L. Vignoles, Y. Aspa, M. Quintard, Modelling of carbon–carbon composite ablation in rocket nozzles, 20 Composites Science and Technology, 70 (2010) 1303–1311 21
[11] J Lachaud, I Cozmuta, N N. Mansour, Multiscale Approach to Ablation Modeling of Phenolic Impregnated 22 Carbon Ablators, Journal of Spacecraft and Rockets, 47 (6) (2010) 23
[12] F Patisson, E Lebas, F Hanrot, D Ablitzer, J-L Houzelot, Coal Pyrolysis In A Rotary Kiln: Part I. Model Of 24 The Pyrolysis Of A Single Grain, Metallurgical And Materials Transactions B, 31 (2000) 381-388 25
[13] R. Taylor and R. Krishna. Multicomponent Mass Transfer. Wiley, New York. 1993. 26
[14] F Zhou, N. Kuentzer, P. Simacek, S. G. Advani, S. Walsh, Analytic characterization of the permeability of 27 dual-scale fibrous porous media, Composites Science and Technology, 66 (2006) 2795–2803 28
[15] B. Zhang and Y.Zhao, Numerical Simulations of Fluid Flow and Convection Heat Transfer Through 29 Fluid/Porous Layers, AIAA 1999-3627 30
[16] N. Gascoin, G. Abraham, P. Gillard, Thermal and hydraulic effects of coke deposit in hydrocarbon 31 pyrolysis process., Journal of Thermophysics And Heat Transfer, doi/jtht.2011.06.T3778 32
[17] B Moghtaderi, The state-of-the-art in pyrolysis modelling of lignocellulosic solid fuels, Fire Mater., 30 33 (2006) 1–34 34
[18] J. Ratte, F. Marias, J. Vaxelaire, P. Bernada, Mathematical modelling of slow pyrolysis of a particle of 35 treated wood waste Journal of Hazardous Materials, 170 (2009) 1023–1040 36
[19] Stephen B. Margolis and Alexander M. Telengator, Influence of Sublimation and Pyrolysis on Quasi-37 Steady Deflagrations in Confined Porous Energetic Materials, Comb. Flame, 127 (2001) 2135–2156 38
[20] M.R. Ravi, A Jhalani, S Sinha, A Ray, Development of a semi-empirical model for pyrolysis of an annular 39 sawdust bed, J. Anal. Appl. Pyrolysis, 71 (2004) 353–374 40
18/30
[21] K. Jaojaruek and S. Kumar, Numerical simulation of the pyrolysis zone in a downdraft gasification process, 1 Bioresource Technology, 100 (2009) 6052–6058 2
[22] U. Sand, J. Sandberg, J. Larfeldt, R. Bel Fdhila, Numerical prediction of the transport and pyrolysis in the 3 interior and surrounding of dry and wet wood log, Applied Energy, 85 (2008) 1208–1224 4
[23] R. Le Van Mao, N.-T. Vu, N. Al-Yassir, N. Francois, J. Monnier, The thermocatalytic cracking process for 5 the production of light olefins and transportation fuels from gas oils, Topics in Catalysis, 37 (2–4) (2006) 6
[24] O Mesalhy, K Lafdi, A Elgafy, K Bowman, Numerical study for enhancing the thermal conductivity of 7 phase change material (PCM) storage using high thermal conductivity porous matrix, Energy Conversion 8 and Management, 46 (2005) 847–867 9
[25] L-Z Zhang, A fractal model for gas permeation through porous membranes, International Journal of Heat 10 and Mass Transfer, 51 (2008) 5288–5295 11
[26] M.R. Shahnazari and A. Vahabikashi,, Permeability Prediction Of Porous Media With Variable Porosity 12 By Investigation Of Stokes Flowover Multi-Particles, J. Porous Media, 14 (3) (2011) 243-250 13
[27] M Dingemans, J Dewulf, L Braeckman, H Van Langenhove, K Friess, V Hynek, M Sipek, Mass transfer 14 characteristics for VOC permeation through flat sheet porous and composite membranes: The impact of the 15 different membrane layers on the overall membrane resistance, J. Membrane Sci., 32 (2) (2008) 234–242 16
[28] Y Mahmoudi and M Maerefat, Analytical investigation of heat transfer enhancement in a channel partially 17 filled with a porous material under local thermal non-equilibrium condition, International Journal of 18 Thermal Sciences, 50 (2011) 2386-2401 19
[29] D.Y. Lee, J.S. Jin, B.H. Kang, Momentum boundary layer and its influence on the convective heat transfer 20 in porous media, International journal of Heat and Mass transfer, 45 (2002) 229-233 21
[30] H. Shokouhmand, F. Jam, M.R. Salimpour, Simulation of laminar flow and convective heat transfer in 22 conduits filled with porous media using Lattice Boltzmann Method, International Communications in Heat 23 and Mass Transfer, 36 (2009) 378–384 24
[31] J. Madrigal, M. Guijarro, C. Hernando, C. Dıez, E. Marino, Effective Heat of Combustion for Flaming 25 Combustion of Mediterranean Forest Fuels, Fire Technology, 47 (2011) 461–474 26
[32] B.W. Asay, S. F. Son, J. B. Bdzil, The Role Of Gas Permeation In Convective Burning, Int. J. Multiphase 27 Flow, 22 (5) (1996) 923-952 28
[33] Z. Al-Hamamre, S. Diezinger, P. Talukdar, F. Von Issendorff, D. Trimis, Combustion Of Low Calorific 29 Gases From Landfills And Waste Pyrolysis Using Porous Medium Burner Technology, Process Safety and 30 Environmental Protection, 84(2004) 297–308 31
[34] C.O. Ania, J.B. Parra, C. Pevida, A. Arenillas, F. Rubiera, J.J. Pis, Pyrolysis of activated carbons exhausted 32 with organic compounds, J. Anal. Appl. Pyrolysis, 74 (2005) 518–524 33
[35] M Krzesinska and J Zachariasz, The effect of pyrolysis temperature on the physical properties of 34 monolithic carbons derived from solid iron bamboo, J. Anal. Appl. Pyrolysis, 80 (2007) 209–215 35
[36] H Kim, Y Han, J Park, Evaluation of permeable pore sizes of macroporous materials using a modified gas 36 permeation method, Materials Characterization, 60 (2009) 14–20 37
[37] P Capek, V Hejtmánek, O Šolcová, Permeation of gases in industrial porous catalysts, Chemical 38 Engineering Journal, 81 (2001) 281–285 39
[38] M L. Shchipko and B N. Kuznetsov, Catalytic pyrolysis of Kansk-Achinsk lignite for production of porous 40 carbon materials, Fuel, 14 (5) (1995) 751-755 41
19/30
[39] B. Ruiz, J.B. Parra, J.A. Pajares, J.J. Pis, Study of porous development in pyrolysis chars obtained from a 1 low-volatile coal, Journal of Analytical and Applied Pyrolysis, 58–59 (2001) 873–886 2
[40] M.F. Yardim, E. Ekinci, V. Minkov, M. Razvigorov, T. Budinov, N. Petrov, M. Goranov, Formation of 3 porous structure of semicokes from pyrolysis of Turkish coals in different atmospheres, Fuel, 82 (2003) 4 459–463 5
[41] T Takeichi, Y Yamazaki, M Zuo, A Itoa, A Matsumoto, M Inagaki, Preparation of porous carbon films by 6 the pyrolysis of poly(urethane-imide) films and their pore characteristics, Carbon, 39 (2001) 257–265 7
[42] C de Almeida Filho and A.J.G. Zarbin, Hollow porous carbon microspheres obtained by the pyrolysis of 8 TiO2/poly(furfuryl alcohol) composite precursors, Carbon, 44 (2006) 2869–2876 9
[43] C Quan, A Li, N Gao, Synthesis of carbon nanotubes and porous carbons from printed circuit board, waste 10 pyrolysis oil, Journal of Hazardous Materials, 179 (2010) 911–917 11
[44] N. Gascoin , L. Romagnosi , G. Fau , C. Strozzi , E. El-Tabach , P. Gillard, M. Bouchez, J. Steelant, I. 12 Fedioun, D. Davidenko, A. Ingenito, Kerosene Surrogate Pyrolysis in Porous Media: Part 2. Numerical 13 Analysis and Comparison to Experiments, submitted in Energy Conversion & Management. 14
[45] N. Gascoin, High temperature and pressure reactive flows through porous media, International Journal of 15 Multiphase Flow, 37 (2011) 24–35 16
[46] F.Travajno, P. Helwig, Calcul multiphysique dans une paroi poreuse, Master's Thesis, Supervisor: I. 17 Fedioun, Polytech Orléans, France, 2010/2011. 18
[47] F Blondel, Y. Préveraud, Master's Thesis, Supervisor: I. Fedioun, Polytech Orléans, France, 2009/2010. 19
[48] B. Orear, C. Marescaux, Master's Thesis, Supervisor: I. Fedioun, Polytech Orléans, France, 2008/2009. 20
[49] R. H. Aungier. A Fast, Accurate Real Gas Equation of State for Fluid Dynamic Analysis Applications, 21 Journal of Fluids Engineering, 117 (1995) 277–281 22
[50] X. Gao , Y. Zhu , Z. Luo , CFD modeling of gas flow in porous medium and catalytic coupling reaction 23 from carbon monoxide to diethyl oxalate in fixed-bed reactors, Chemical Engineering Science, 66 (23) 24 (2011) 6028-6038 25
[51] W. Sobieski, A. Trykozko, Darcy and Forchheimer laws in the experimental and simulation studies of flow 26 through porous media, http://www.math.oregonstate.edu/~mpesz/download/porescale/sobieski-27 trykozko.pdf, last accessed the 2012/01/01. 28
[52] X You, F N. Egolfopoulos, H Wang, Detailed and simplified kinetic models of n-dodecane oxidation: The 29 role of fuel cracking in aliphatic hydrocarbon combustion, Proceedings of the Combustion Institute, 32 (1) 30 (2009) 403-410. Mechanisms: http://ignis.usc.edu/Jet_Fuel_MechI.html 31
[53] S.B. Pope, Computationally efficient implementation of combustion chemistry using in situ adaptive 32 tabulation, Combustion Theory and Modelling, 1, (1997) 41-63. 33
[54] K. Sutton and P. A. Gnoffo. Multi-component Diffusion with Application to Computational 34 Aerothermodynamics, AIAA Paper (1998) 1998-2575. 35
36
20/30
Figure 1. Geometry of the numerical test cell 1
Figure 2. Pressure loss computed as a function of mass flow rate and compared to the experiments (N2, 300 K) [46]. 2
Figure 3. Streamlines, absolute pressure (a) and axial velocity (b) for dodecane at T = 300 K and P = 3.5 MPa (ρ 3
constant). 4
Figure 4. Comparison between the superficial and physical velocity models along the axis of symmetry for cold (a) 5
and hot reactive (b) cases. 6
Figure 5. Spatial difference of averaged species mass fraction, along y-axis for each x-position, between the physical 7
model and the superficial one (a) and dodecane mass fraction along the x-axis for the two velocity formulations (b). 8
Figure 6. Velocity (a), pressure (b), temperature (c) and density (d) distribution along the axis of symmetry of the 9
porous medium with (green line) and without reactions (red line) in the porous zone 10
Figure 7. Differences of C12H26 (a and c) and C2H4 (b and d) mass fractions computed between ISAT tolerances 11
of 10-5 and 10-4 (a and b) and of 10-6 and 10-5 (c and d). 12
Figure 8. Comparison of dodecane (a) and of monatomic hydrogen (b) mass fraction distribution with (solid line) 13
and without (dash-dot line) multi-component diffusion. 14
Figure 9. Effect of the equation of state on the velocity (a), density (b), temperature (c) and dodecane mass fraction 15
Figure 2. Pressure loss computed as a function of mass flow rate and compared to the experiments (N2, 300 K) 2
[46]. 3
4
23/30
a) 1
b) 2 Figure 3. Streamlines, absolute pressure (a) and axial velocity (b) for dodecane at T = 300 K and P = 3.5 MPa 3
(ρ constant). 4
5
24/30
a) b) 1
Figure 4. Comparison between the superficial and physical velocity models along the axis of symmetry for 2 cold (a) and hot reactive (b) cases. 3
4
25/30
a) b) 1 Figure 5. Spatial difference of averaged species mass fraction, along y-axis for each x-position, between the 2 physical model and the superficial one (a) and dodecane mass fraction along the x-axis for the two velocity 3
formulations (b). 4 5
26/30
a) b) 1
c) d) 2
Figure 6. Velocity (a), pressure (b), temperature (c) and density (d) distribution along the axis of symmetry of 3 the porous medium with (green line) and without reactions (red line) in the porous zone 4
5
27/30
a) b) 1
c) d) 2 Figure 7. Differences of C12H26 (a and c) and C2H4 (b and d) mass fractions computed between ISAT 3
tolerances of 10-5 and 10-4 (a and b) and of 10-6 and 10-5 (c and d). 4 5
28/30
a) b) 1
Figure 8. Comparison of dodecane (a) and of monatomic hydrogen (b) mass fraction distribution with (solid 2 line) and without (dash-dot line) multi-component diffusion. 3
4
29/30
a) b) 1
c) d) 2
Figure 9. Effect of the equation of state on the velocity (a), density (b), temperature (c) and dodecane mass 3
fraction (d). 4
5
30/30
a) 1
b) 2 Figure 10. Compressibility factor distribution (a) with corresponding thermal profile (b). 3


![Numerical Simulation of Multi-phase Flow in Porous Media on … · 2016-10-10 · arXiv:1606.00556v2 [cs.CE] 7 Oct 2016 Numerical Simulation of Multi-phase Flow in Porous Media on](https://static.documents.pub/doc/80x56/5f646817f6d93d3fff0a4579/numerical-simulation-of-multi-phase-flow-in-porous-media-on-2016-10-10-arxiv160600556v2.jpg)


