European Journal of Sustainable Development Research, 2018, 2(2), 18 ISSN: 2542-4742
Pyrolysis of Waste Castor Seed Cake: A Thermo-Kinetics Study
Abdullahi Muhammad Sokoto 1*, Thallada Bhaskar 2
1 Usmanu Danfodiyo University, Department of Pure and Applied Chemistry, Sokoto, NIGERIA 2 Indian Institute of Petroleum Dehradun, Dehradun, Uttarakhand, INDIA *Corresponding Author: [email protected] Citation: Sokoto, A. M. and Bhaskar, T. (2018). Pyrolysis of Waste Castor Seed Cake: A Thermo-Kinetics Study. European Journal of Sustainable Development Research, 2(2), 18. https://doi.org/10.20897/ejosdr/81642 Published: March 8, 2018 ABSTRACT Biomass pyrolysis is a thermo-chemical conversion process that is of both industrial and ecological importance. The efficient chemical transformation of waste biomass to numerous products via pyrolysis reactions depends on process kinetic rates; hence the need for kinetic models to best design and operate the pyrolysis. Also, for an efficient design of an environmentally sustainable pyrolysis process of a specific lignocellulosic waste, a proper understanding of its thermo-kinetic behavior is imperative. Thus, pyrolysis kinetics of castor seed de-oiled cake (Ricinus communis) using thermogravimetric technique was studied. The decomposition of the cake was carried out in a nitrogen atmosphere with a flow rate of 100mL min-1 from ambient temperature to 900 °C. The results of the thermal profile showed moisture removal and devolatilization stages, and maximum decomposition of the cake occurred at a temperature of 200-400 °C. The kinetic parameters such as apparent activation energy, pre-exponential factor, and order of reaction were determined using Friedman (FD), Kissinger-Akahira-Sunose (KAS), and Flynn-Wall-Ozawa (FWO) kinetic models. The average apparent activation energy values of 124.61, 126.95 and 129.80 kJmol-1 were calculated from the slopes of the respective models. The apparent activation energy values obtained depends on conversion, which is an evidence of multi-step kinetic process during the pyrolytic decomposition of the cake. The kinetic data would be of immense benefit to model, design and develop a suitable thermo-chemical system for the conversion of waste de-oil cake to energy carrier.
Generation of environmentally benign fuel is a goal of some the developing nations as well as other developed countries across the globe. Several approaches were devised towards achieving this objective especially by exploitation of nonedible feedstock, waste products, and other renewable resources through biological, chemical and thermochemical routes. The quest for potential biomass raw materials for fuel and chemical production through thermo-chemical approach has gained tremendous interest (Yee, 2010; Idris et al., 2012). The thermo-chemical methods encompass gasification, combustion, and pyrolysis. Pyrolysis is a vital method for the investigation of biofuels potential of lignocellulosic substrates. It is an excellent route for generating end-use energy products from agricultural and forest residues and waste streams. Through pyrolysis, polymeric substances are broken down into lower molecular weight products which include gas, liquids and solid char. These products are reported to be potential energy carriers (Ceylan, and Topcu, 2014). Although decomposition of biomass is a complex process due to its chemical make-up, and diverse nature of reaction it undergoes, a thorough understanding of these reactions can probably create wider options for the application of biomass. Knowledge of
kinetic parameters of biomass pyrolysis is of great significance in reactor design, controlled conversion rate as well as comprehension of stability of the feedstock.
It is evident from literature several studies have been reported for the conversion of lingo-cellulosic biomass through pyrolysis, gasification, and combustion (Biswas et al., 2016). However, pyrolysis is considered as an excellent method for utilizing agricultural waste and residues into diverse products. Its application is highly attractive especially when concerning environmental issues during energy production. Therefore, for an efficient design of an environmentally sustainable pyrolysis process of a specific lignocellulosic waste, a proper understanding of its thermo-kinetic behaviour is paramount (Lopez-Velazquez et al., 2013). The thermo-kinetic behaviour allows control of the reaction rate as a function of temperature, pressure, and composition. Furthermore, the information about biomass pyrolysis kinetics is necessary to accurately predict reactions behaviour, as well as to optimize and control the process of conversion toward products during the pyrolytic degradation (Damartzis et al., 2011).
The precision and accuracy of the kinetic expression governing the reaction mechanism and the kinetic parameters inferred from kinetic analysis have a profound dependence on the reliability of the evaluation methods used to study the decomposition behavior of biomass under different conditions of temperature and/or atmosphere (Mishra and Bhaskar, 2014). Numerous researchers have investigated the decomposition kinetics of biomass using model fitting approaches involving global or semi-global mechanisms. Di Blasi (1993) reported a comprehensive review of the different classes of mechanisms proposed for the pyrolysis of wood and other cellulosic materials. One step global model involving a single global reaction has been used but found unsuitable to predict the complex reactions involved in the decomposition of biomass (Varhegyi et al., 1989). The independent reaction model of three pseudo-components was used. This model ensures the possibility of simultaneous decomposition of pseudo-components. The biomass decomposition results reported in the literature (Varhegyi et al., 1997; Orfao et al., 1999; Gronli et al., 2002) show that this model provides consistent parameter values with low fitting errors. The macroscopic kinetics of biomass pyrolysis is complex as it includes information about simultaneously occurring multiple steps. Unraveling the macroscopic kinetics presents a certain challenge that can only be met by the computational methods that allow for detecting and treating multi-step processes (Vyazovkin and Sbirrazzuoli, 2006). According to the results of the ICTAC Kinetics Project (Brown et al., 2000), iso-conversional methods are among a few methods that are up to this challenge. Hence, the present study employed three different iso-conversional methods (Friedman (FD), Kissinger-Akahira-Sunose (KAS), and Flynn-Wall-Ozawa (FWO) to evaluate the thermogravimetric data of waste castor cake.
Ricinus communis is one of the non-edible weed crops which not commonly consumed by animals. Owing to the abundance of the Ricinus communis species and appreciable oil content of its seeds, focus on the use of seed oil for biodiesel production has been exploited but the seed cake is dumped in refuse. Furthermore, the castor seed cake contains some active compounds that are biologically toxic (Ricin and Ricinus communis agglutinin) to an animal, hence could not be used as animal feeds and could be detrimental when littered in the environment. The conversion of the castor seed cake to biofuels via biological might not be efficient owing to its inherent toxins.
The present study viewed pyrolysis and kinetic as a viable approach for the conversion of castor seed cake to biofuels which is widely acknowledged as environmentally benign. The conversion is more feasible with proper reactor design and a good understanding of the degradation pattern of the waste cake. The kinetic data provides vital information on these key factors. Although there are several approaches for waste stream remediation, the present study investigates the kinetic and thermodynamic of waste feedstock as gate-way for the conversion of waste to energy.
METHODOLOGY
Materials and Methods
The sample of castor seeds cake was obtained from Sokoto Energy Research Center Laboratory, Usmanu Danfodiyo University, Sokoto, Nigeria. The collected sample was air-dried and sieved through a 20mm pore size mesh, and then kept in an airtight plastic container. Moisture content was determined using halogen moisture analyzer (Mettler Toledo) at 105 °C in accordance with AOAC methods. Ash content was also determined using AOAC methods.
The volatile matter was determined by placing the known amount of the castor seed cake into a pre-weighed crucible. The crucibles containing the samples were covered and heated in a muffle furnace at 950°C ± 20°C for seven minutes then cooled first in the air, then placed into a desiccator. The percentage weight loss of the sample was considered as the volatile matter and calculated using Eqn. (1). An average value of triplicate determinations was reported.
European Journal of Sustainable Development Research, 2(2), 18
Vario Micro Cube Elemental Analyzer, Parr 6300 bomb Calorimeter, and Inductively coupled plasma- atomic emission spectrophotometer (ICP- DRE, PS-3000 UV Leeman Labs inc) was used for determination of CHNS, gross calorific value and trace metal content of the castor seed cake respectively.
Thermogravimetric Analysis
The pyrolysis experiment was performed using TGA analyzer (Shimadzu DTG-60) under a nitrogen atmosphere at 100 mL min-1 flow rate. The nitrogen was used for the purpose of maintaining the inert atmosphere and purging volatiles generated from pyrolysis. The experiments were carried out at different heating rates of 5, 10, 15, 20, 30, and 40 °C min-1 from ambient temperature to 900 °C.
Kinetics Modeling
Pyrolysis degradation of polymeric substrates in the solid state can be described by the general expression for reaction rate constant expressed mathematically as:
𝑑𝑑𝑑𝑑𝑑𝑑𝑉𝑉
= 𝑘𝑘(𝑇𝑇)𝑜𝑜(𝑑𝑑) (3)
where 𝑑𝑑𝑑𝑑𝑑𝑑𝑑𝑑
is the reaction rate (s-1), 𝑘𝑘(𝑇𝑇) denotes dependence of rate on temperature, 𝑜𝑜(𝑑𝑑) is the rate dependence on the model, 𝑇𝑇 denotes the absolute temperature in Kelvin (K) and 𝑉𝑉 is the time in seconds. The residual weight (𝑑𝑑) is defined in terms of change in mass (%) of the sample as:
𝑑𝑑 =𝑊𝑊𝑖𝑖 −𝑊𝑊𝑑𝑑
𝑊𝑊𝑖𝑖 −𝑊𝑊𝑓𝑓 (4)
where 𝑊𝑊𝑖𝑖 (%), 𝑊𝑊𝑑𝑑 (%) and 𝑊𝑊𝑓𝑓 (%) are an initial mass of the sample, mass at a given time and final weight of the sample at the end of reaction respectively. According to Barneto et al. (2010), the kinetic rates are based on the Arrhenius equation which can be expressed as:
𝑘𝑘 = 𝐴𝐴 exp �−𝐸𝐸𝑎𝑎𝑎𝑎𝑎𝑎𝑅𝑅𝑇𝑇
� (5)
where 𝐴𝐴 is the pre-exponential factor, 𝐸𝐸𝑎𝑎𝑎𝑎𝑎𝑎 is the apparent activation energy, 𝑅𝑅 is the gas constant and 𝑇𝑇, the temperature in Kelvin. Combination of Eqns. 3 and 5 gives:
𝑑𝑑𝑑𝑑𝑑𝑑𝑉𝑉
= 𝐴𝐴 exp �−𝐸𝐸𝑎𝑎𝑎𝑎𝑎𝑎𝑅𝑅𝑇𝑇
�𝑜𝑜(𝑑𝑑) (6)
at a controlled temperature and constant heating rate 𝑑𝑑𝑑𝑑𝑑𝑑𝑑𝑑
= 𝛽𝛽 = constant. The rearrangement of equation (6) gives: 𝑑𝑑𝑑𝑑𝑑𝑑𝑇𝑇
=𝐴𝐴𝛽𝛽
exp �−𝐸𝐸𝑎𝑎𝑎𝑎𝑎𝑎𝑅𝑅𝑇𝑇
�𝑜𝑜(𝑑𝑑) (7)
integration of equation (7) resulted in:
𝑊𝑊(𝑑𝑑) = �𝑑𝑑𝑑𝑑𝑜𝑜(𝑑𝑑)
𝑑𝑑
0
=𝐴𝐴𝛽𝛽� exp𝑑𝑑
𝑑𝑑0�−
𝐸𝐸𝑎𝑎𝑎𝑎𝑎𝑎𝑅𝑅𝑇𝑇
� 𝑑𝑑𝑇𝑇 =𝐴𝐴𝐸𝐸𝑎𝑎𝑎𝑎𝑎𝑎𝛽𝛽𝑅𝑅
� 𝑚𝑚−2ℓ−𝑢𝑢∞
𝑥𝑥𝑑𝑑𝑚𝑚 =
𝐴𝐴𝐸𝐸𝑎𝑎𝑎𝑎𝑎𝑎𝛽𝛽𝑅𝑅
𝑃𝑃(𝐹𝐹) (8)
where 𝑊𝑊(𝑑𝑑) is the integral form of the reaction model or conversion dependant 𝑜𝑜(𝑑𝑑). Also 𝐹𝐹 = 𝐸𝐸𝑎𝑎𝑎𝑎𝑎𝑎/𝑅𝑅𝑇𝑇. The function 𝑃𝑃(𝐹𝐹) has no exact analytical solution. Numerous approximations methods can be used for the right side of Eqn. 8 (Yee, 2010; White et al., 2011). This formed the basis upon which various model equations were derived.
Iso-conversion methods
Iso-conversional methods are model-free methods which are frequently used in solid-state kinetics for the prediction of activation energies at progressive values of conversion(Vyazovkin 2001, Khawam and Flanagan, 2006).These kinetic models include Friedman (FD), Kissinger-Akahira- Sunose (KAS), Flynn-Wall-Ozawa models (FWO) etc.
Friedman Method Friedman (FD) is a differential form of iso-conversion model used for the determination of activation energy.
The method is considered to be more accurate to determine the activation energy than the other iso-conversion
Sokoto and Baskar / Introduction, Materials, Results and Discussion, Conclusion
methods as it does not include mathematical approximations. The model equation is derived from equation (6) by dividing both sides of the equation with 𝛽𝛽:
𝛽𝛽𝑑𝑑𝑑𝑑𝑑𝑑𝑇𝑇
= 𝐴𝐴 exp �−𝐸𝐸𝑎𝑎𝑎𝑎𝑎𝑎𝑅𝑅𝑇𝑇
�𝑜𝑜(𝑑𝑑) (9)
Taking natural logarithm of each side of Eqn. (9) gives
ln �𝑑𝑑𝑑𝑑𝑑𝑑𝑉𝑉� = ln �𝛽𝛽 �
𝑑𝑑𝑑𝑑𝑑𝑑𝑇𝑇�� = ln[𝐴𝐴 𝑜𝑜(𝑑𝑑)] −
𝐸𝐸𝑑𝑑𝑅𝑅𝑇𝑇𝑑𝑑
(10)
The apparent activation energy (𝐸𝐸𝑎𝑎𝑎𝑎𝑎𝑎) can be obtained from the slope (−𝐸𝐸𝑅𝑅
) for the plot of ln ��𝑑𝑑𝑑𝑑𝑑𝑑𝑑𝑑�� versus
1𝑑𝑑𝛼𝛼
at a constant 𝑑𝑑 value.
Kissinger-Akahira-Sunose (KAS) The Kissinger-Akahira-Sunose (KAS) method is an integral iso-conversional method that applies the
approximation of 𝑃𝑃(𝐹𝐹) = 𝐹𝐹−2ℓ−𝑥𝑥 to Eqn. (8). Rearrangement of the expression gives:
ln �𝛽𝛽𝑇𝑇𝑑𝑑2� = ln �
𝐴𝐴𝑑𝑑𝑅𝑅(𝑊𝑊(𝑑𝑑))�
−𝐸𝐸𝑑𝑑𝑅𝑅𝑇𝑇𝑑𝑑
(11)
Therefore, a plot of ln � 𝛽𝛽
𝑑𝑑𝛼𝛼2� versus � 1
𝑑𝑑𝛼𝛼� at constant conversion (𝑑𝑑 = const) for different heating rates gives a
straight line whose slope can be used for evaluation of the apparent activation energy and pre-exponential factor can be obtained from its intercept.
Flynn -Wall-Ozawa (FWO) FWO method used Doyle’s approximation (Doyle, 1962), to express the 𝑃𝑃(𝐹𝐹) of right-hand side of Eqn. 8 as 𝑃𝑃(𝐹𝐹) ≈ −(−2.315− 0.457𝐹𝐹)
Substitution of Doyle’s approximation into Eqn. (8) gives:
log𝛽𝛽 = log �𝐴𝐴𝐸𝐸𝑎𝑎𝑎𝑎𝑎𝑎𝑅𝑅𝑊𝑊(𝑑𝑑)
� − 2.315− 0.457𝐸𝐸𝑎𝑎𝑎𝑎𝑎𝑎𝑅𝑅𝑇𝑇
(12)
Thus, the plot of log(𝛽𝛽) versus 1/𝑇𝑇; gives a slope −0.457𝐸𝐸𝑎𝑎/𝑅𝑅.
Coats-Redfern Method
Just as KAS and FWO methods are often described as an accurate model for the calculation of activation energy, likewise the Coats-Redfern method are frequently used in order to calculate the pre-exponential factor, the apparent reaction order, as well as to validate the estimated activation energy determined using iso-conversional methods (Damartzis et al., 2011; Sait, 2011). The equations for the Coats-Redfern method are:
ln �−ln(1− 𝑑𝑑)
𝑇𝑇2� = ln�
𝐴𝐴𝑅𝑅𝛽𝛽𝐸𝐸
�1 −2𝑅𝑅𝑇𝑇𝐸𝐸�� −
𝐸𝐸𝑅𝑅𝑇𝑇
,𝑐𝑐 = 1 (13)
ln �(1 − 𝑑𝑑)1−𝑛𝑛 − 1
(𝑐𝑐 − 1)𝑇𝑇2� = ln�
𝐴𝐴𝑅𝑅𝛽𝛽𝐸𝐸
�1 −2𝑅𝑅𝑇𝑇𝐸𝐸
�� −𝐸𝐸𝑅𝑅𝑇𝑇
,𝑐𝑐 ≠ 1 (14)
where 𝑐𝑐 is the reaction order, 𝛽𝛽 is the heating rate.
Thermodynamic Parameters
Thermodynamic parameters were derived using equation reported by Kim et al. (2010). These include changes in enthalpy, entropy and Gibbs free energy which were calculated from the following relationship:
𝐴𝐴 = 𝛽𝛽.𝐸𝐸.exp � 𝐸𝐸
𝑅𝑅𝑑𝑑𝑚𝑚�
𝑅𝑅𝑇𝑇𝑚𝑚2 (15)
∆𝐺𝐺≠ = 𝐸𝐸 + 𝑅𝑅𝑇𝑇𝑚𝑚ln �𝑘𝑘𝐵𝐵𝑇𝑇𝑚𝑚ℎ.𝐴𝐴
� (16)
where 𝑇𝑇𝑚𝑚 is maximum decomposition temperature from the DTG peak, 𝑘𝑘𝐵𝐵 represents the Boltzmann constant and ℎ, the plank constant. Since,
∆𝐻𝐻≠ = 𝐸𝐸 − 𝑅𝑅𝑇𝑇 (17)
∆𝐺𝐺≠ = ∆𝐻𝐻≠ − 𝑇𝑇∆𝑆𝑆≠ (18)
European Journal of Sustainable Development Research, 2(2), 18
The ∆𝑆𝑆≠ entropy change for the activated complex can be determined from thermodynamic expression given as:
∆𝑆𝑆≠ =∆𝐻𝐻≠ − ∆𝐺𝐺≠
𝑇𝑇𝑚𝑚 (19)
RESULTS AND DISCUSSION
Proximate and Ultimate Analyses
Some of the key properties of biomass material that are crucial for its proper handling and usage are obtained via proximate and ultimate analyses (Tables 1 and 2).Biomass conversion technologies are influenced by the feedstock moisture content. Low moisture content is more favorable for thermal conversion technique, although high moisture content feedstock can be processed; the overall energy balance for the conversion process gets adversely impacted. High moisture content feedstock may be favorable in biochemical conversion technologies (Mckendry, 2002). The moisture content of the cake (11.99%) is comparable to that of rapeseed cake (10.59%) (Ucar and Ozkan, 2008); but lower than the content in babool seeds (12.5%) (Garg et al., 2016). Ash is an inorganic residue generated from biomass thermal decomposition. High ash content decreases the available energy (heat) and leads to the formation of liquid phase product “slag”. Also, high ash content is associated with an increase in operating cost of the unit. The ash content of the castor seed cake is moderately low and might probably have less slagging tendency on thermal conversion of the cake at elevated temperature (Table 1).
Volatile matter and fixed carbon content provide a measure of the ease at which a biomass can be ignited and gasified. The high volatile matter is considered advantageous in biomass application as fuel. The calorific value of the material measures the energy or heat value it releases when burnt in air. It is one of the parameters used to assess the competitiveness of a processed fuel in a given market situation (Veeresh and Narayana, 2012). The HHV obtained in the present study is higher than the value reported for some tropical biomass like Tectona grandis and Guarea thompsonii of Nigerian origin (Oluti et al., 2014). The castor seed cake could thus be a valuable energy carrier.
The elemental composition of the biomass comprising C, H, N, S, and O (Table 2) denote the ultimate analysis. Biomass materials contain a higher proportion of oxygen, hydrogen and less carbon, which leads to lesser heating value than fossil fuels. The findings of this study imply that castor cake has appreciable heating value with a high content of volatiles, carbon, hydrogen, and oxygen. The content of nitrogen in the cake sample is high in relative to sulfur. The results of the present study showed some agreement with the values reported for de-oiled castor cake in the different topological area (Table 2). The elemental constituents in the biomass and their ratios are vital in the selection of energy conversion process (El-Sayed and Mostafa 2014).
Table 1. Proximate Analysis of Ricinus communis seed cake Parameter Values Moisture (db %) 11.99 ± 0.85 Ash (%) 8.08 ± 0.66 Volatile matter (%) 77.60 ± 0.05 Fixed carbon (%) 2.33 ± 0.12 HHV (MJ/kg) 21.58 NCV (MJ/kg) 17.27 HHV=High heating Value, NCV=Net calorific Value, db= dry basis, values are mean ± SD of triplicate measurement (n = 3) Table 2. Elemental Composition de-oiled castor seed cake (% wt air dry), and HHV (MJ/kg) Parameters Values C 44.20 H 7.47 N 7.04 O 32.6 S 0.61 H:C 0.23 O:C 0.74 HHV 21.58 Oxygen determined from the equation: % Oxygen = 100- %(C+H+N+S+Ash)
Sokoto and Baskar / Introduction, Materials, Results and Discussion, Conclusion
The concentration of trace metals content of the cake is shown in Table 3. The concentrations of alkali and alkaline earth metals, as well as some heavy metals, are crucial factors in the selection of biomass conversion technique especially using thermal process (Mckendry, 2002). The concentrations of alkali and alkaline metal in the cake were less than 2 w% which indicate the possibility of the feedstock to be processed by the thermo-chemical method.
Thermogravimetric Curves
The TG and DTG curves for the decomposition of Ricinus communis cake sample obtained at different heating rates (5, 10, 15, 20, 30 and 40 °C min-1) are shown in Figures 1a and 1b respectively. The observed thermograms showed two peaks and flat tailing at heating rates of 5-30 °C min-1 and four peaks at 40 C min-1 heating rate. The pyrolysis process of the lignocellulosic biomass is notably composed of regions that describe the moisture and very light volatile components removal; degradation of hemicellulose; lignin and cellulose decomposition and lignin degradation (Yang et al., 2007; Sanchez-Silva et al., 2012). From Figure 1b, a peak from ambient temperature to 200 °C might likely signify the removal of moisture and light volatiles; while active pyrolysis degradation of the cake occurred from 200-400 °C and above 400 °C flattened curve observed implies passive pyrolysis and probably showed a slow rate of carbonaceous matter decomposition. As shown in Figure 1b, most of the devolatilization occurred within the temperature range of 200-400 °C which is indicative of the region with a high weight loss of the sample. The stage is also considered as an active pyrolysis region where the main components, hemicelluloses, cellulose, and lignin decomposed. It is also a characterized by the high release of volatile matter (Ceylan, and Topcu, 2014). Also, the temperature range (200-400 °C) indicates the thermal breaking of weak bonds in the polymeric structure of the constituent components of the biomass and the formation of more stable bonds (Roque-Diaz et al., 1985). However, the loss of lignin typically occurs at a slower rate and over a wide temperature range of 180-900 °C (Barneto et al., 2010; Bilbao et al., 1997; Jauhiainen et al., 2004; Hu et al., 2007).
Table 3. Trace element constituents of de-oiled castor cake Element Concentration (mg/kg)
Mg 7293±2.12 Ca 1087±0.64 Ni <1 Mn 36±0.05 V <1 Fe 60±1.02 Zn 162±0.13 Al <1 Cr <1 P 17435±1.20
Na 307±0.06 K 11256±1.25 Pb <1 Co <1
Values are mean ± standard deviation of triplicate measurements
The observed thermogravimetric curves (Figure 1b) shows that the curves shifted to higher peak temperatures with an increase in heating rate. This could be due to a decrease in heat transfer efficiency at higher heating rates. It was reported that at lower heating rates the temperature profile along the cross-section of the biomass could linear, as both the outer surface and the inner core of the biomass material attains the same temperature at a particular time when the lower heating rate is employed (Shuping et al., 2010).The heating of biomass particles occurs more gradually and leads to a better heat transfer to the inner parts of biomass (Damartzis, et al., 2011; Chutia et al., 2013) At a higher heating rate, a substantial difference in temperature profile exists along the cross-section of the biomass (Maiti et al., 2007). The shift of DTG curves observed with increasing heating rate may also be attributed to the secondary reactions of the primary pyrolysis products (Juntgen, 1984), The peak temperature (𝑇𝑇max) for the decomposition of the castor cake was found to increase with an increase in heating rates. The 𝑇𝑇max
indicates the temperature value for maximum volatile matter release rate from the cake and is vital in conversion control during the thermal process.
Kinetics Study
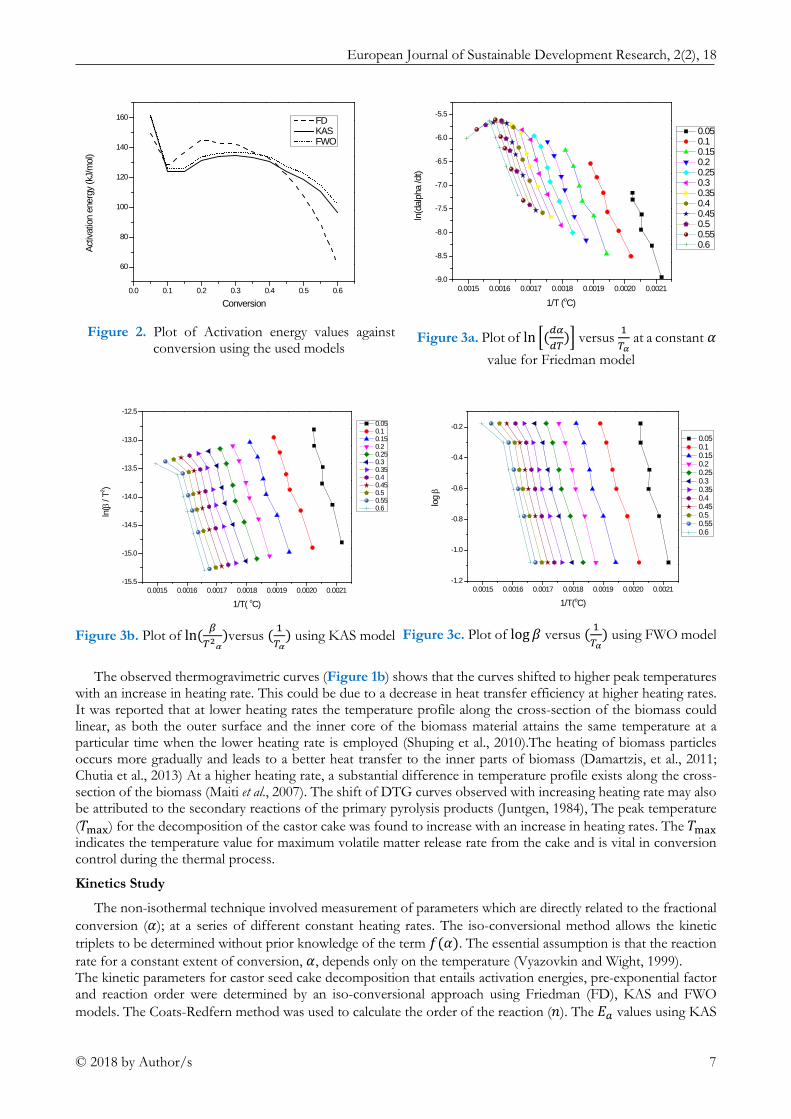
The non-isothermal technique involved measurement of parameters which are directly related to the fractional conversion (𝑑𝑑); at a series of different constant heating rates. The iso-conversional method allows the kinetic triplets to be determined without prior knowledge of the term 𝑜𝑜(𝑑𝑑). The essential assumption is that the reaction rate for a constant extent of conversion, 𝑑𝑑, depends only on the temperature (Vyazovkin and Wight, 1999). The kinetic parameters for castor seed cake decomposition that entails activation energies, pre-exponential factor and reaction order were determined by an iso-conversional approach using Friedman (FD), KAS and FWO models. The Coats-Redfern method was used to calculate the order of the reaction (𝑐𝑐). The 𝐸𝐸𝑎𝑎 values using KAS
equation are obtained from the plot of ln � 𝛽𝛽𝑑𝑑𝛼𝛼2� versus ( 1
𝑑𝑑𝛼𝛼) at constantconversion (𝑑𝑑 = const) for different heating
rates which gives a straight line graph whose slope can be used for evaluation of the apparent activation energy and pre-exponential factor from its intercept. Likewise, the plot of log (𝛽𝛽) versus 1/T, gives a linear graph with a slope (−𝐸𝐸𝑎𝑎/𝑅𝑅); the graph is shown in Figures (3a-c).
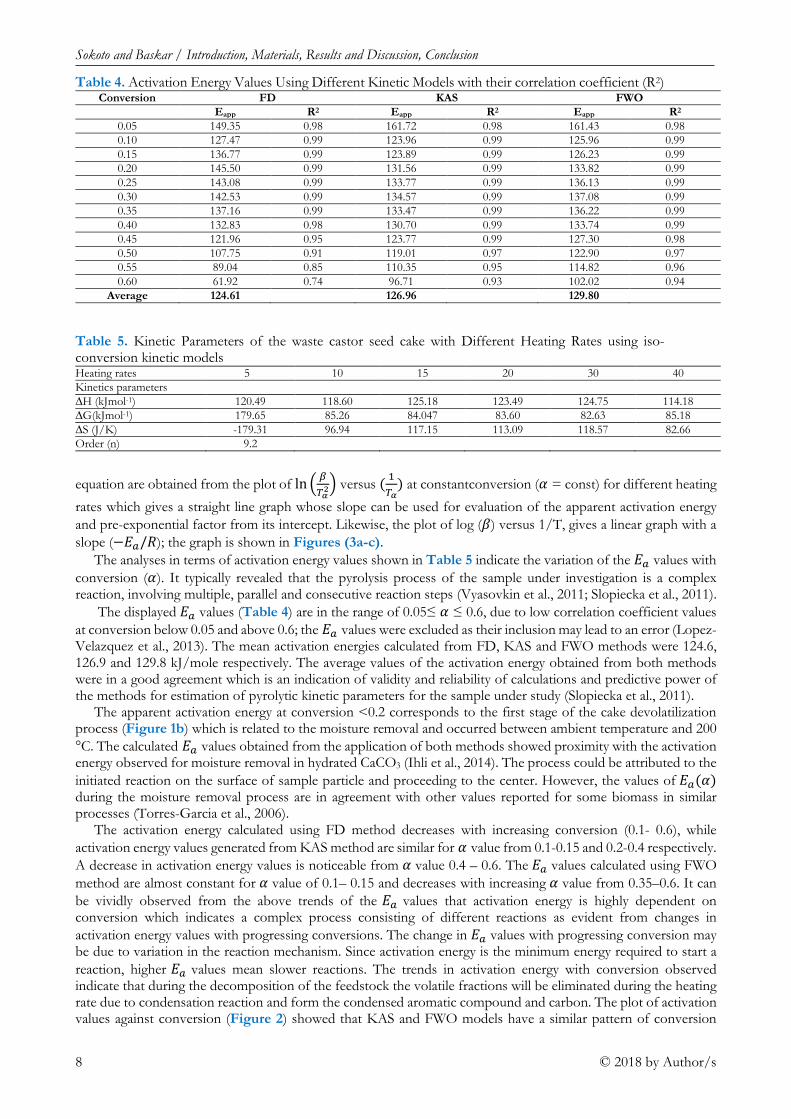
The analyses in terms of activation energy values shown in Table 5 indicate the variation of the 𝐸𝐸𝑎𝑎 values with conversion (𝑑𝑑). It typically revealed that the pyrolysis process of the sample under investigation is a complex reaction, involving multiple, parallel and consecutive reaction steps (Vyasovkin et al., 2011; Slopiecka et al., 2011).
The displayed 𝐸𝐸𝑎𝑎 values (Table 4) are in the range of 0.05≤ 𝑑𝑑 ≤ 0.6, due to low correlation coefficient values at conversion below 0.05 and above 0.6; the 𝐸𝐸𝑎𝑎 values were excluded as their inclusion may lead to an error (Lopez-Velazquez et al., 2013). The mean activation energies calculated from FD, KAS and FWO methods were 124.6, 126.9 and 129.8 kJ/mole respectively. The average values of the activation energy obtained from both methods were in a good agreement which is an indication of validity and reliability of calculations and predictive power of the methods for estimation of pyrolytic kinetic parameters for the sample under study (Slopiecka et al., 2011).
The apparent activation energy at conversion <0.2 corresponds to the first stage of the cake devolatilization process (Figure 1b) which is related to the moisture removal and occurred between ambient temperature and 200 °C. The calculated 𝐸𝐸𝑎𝑎 values obtained from the application of both methods showed proximity with the activation energy observed for moisture removal in hydrated CaCO3 (Ihli et al., 2014). The process could be attributed to the initiated reaction on the surface of sample particle and proceeding to the center. However, the values of 𝐸𝐸𝑎𝑎(𝑑𝑑) during the moisture removal process are in agreement with other values reported for some biomass in similar processes (Torres-Garcia et al., 2006).
The activation energy calculated using FD method decreases with increasing conversion (0.1- 0.6), while activation energy values generated from KAS method are similar for 𝑑𝑑 value from 0.1-0.15 and 0.2-0.4 respectively. A decrease in activation energy values is noticeable from 𝑑𝑑 value 0.4 – 0.6. The 𝐸𝐸𝑎𝑎 values calculated using FWO method are almost constant for 𝑑𝑑 value of 0.1– 0.15 and decreases with increasing 𝑑𝑑 value from 0.35–0.6. It can be vividly observed from the above trends of the 𝐸𝐸𝑎𝑎 values that activation energy is highly dependent on conversion which indicates a complex process consisting of different reactions as evident from changes in activation energy values with progressing conversions. The change in 𝐸𝐸𝑎𝑎 values with progressing conversion may be due to variation in the reaction mechanism. Since activation energy is the minimum energy required to start a reaction, higher 𝐸𝐸𝑎𝑎 values mean slower reactions. The trends in activation energy with conversion observed indicate that during the decomposition of the feedstock the volatile fractions will be eliminated during the heating rate due to condensation reaction and form the condensed aromatic compound and carbon. The plot of activation values against conversion (Figure 2) showed that KAS and FWO models have a similar pattern of conversion
Table 4. Activation Energy Values Using Different Kinetic Models with their correlation coefficient (R2) Conversion FD KAS FWO
with the activation energy; this implies more validity of the models to predict the kinetic decomposition pattern of the cake in comparison with the FD method. However, the activation energies from both models were moderately having low values which may likely be due to the lower content of lignin in the feedstock.
Figure 2 showed different stages of activation energy changed with increasing conversion, which can be attributed to the different pyrolysis characteristics of the three components of biomass (Dong et al., 2012). Hemicellulose has high activity in thermal decomposition due to its random amorphous structure with little strength. In contrast, cellulose has higher thermal stability because of its good ordered structure with a long polymer of glucose without any branches (Lu et al., 2011). Among the three components, lignin was the most difficult one to decompose. It is full of aromatic rings and is heavily cross-linked. The decomposition stage within the conversion range of 0.05 – 0.15 (Figure 2) occurs at activation energy value < 130 kJmol-1 probably indicate the dehydration stage due to loss of moisture. The decomposition stage between 0.15 – 0.45 showed a broad peak at approximate activation energy value of 138 kJmol-1 indicate simultaneous decomposition of hemicellulose and cellulose. While at conversion range between 0.45-0.6 showed drastic decreases in activation energy with the conversion. A similar trend of activation energy with conversion was reported for the decomposition of hazelnut husk using KAS and OFW models. Vamvuka et al., (2003) reported that the activation energies for cellulose, hemicelluloses, and lignin are in the range of 145-285, 90-125, and 30-39 kJ/mol, respectively. Therefore, the different pyrolysis behaviors of the three components led to the complexity of the pyrolysis and differences in the activation energy of the conversions.
In solid-state kinetic, the activation energy and the frequency factor (A) are often used to provide mechanistic clues for the conversion (Vyasovkin et al., 2011). When activation energy decreases with reaction progression, it is an indication of an endothermic reaction followed by an irreversible step. It should be noted, that the reaction progression (or conversion) is essentially dependent on the temperature of the reaction, and consequently the variations in Ea can be attributed to the differences in endothermicity and exothermicity of the breakdown of biomass constituents at different temperature ranges (Vaibhav et al., 2017). The frequency factor (A) also indicates the surface reactivity of a system; low pre-exponential factors (A < 109 s−1) indicate a system with less surface reactivity; but if the reactions are not dependent on surface area, the low value of A may indicate a closed complex. On the other hand, the high A (A ≥ 109 s−1) indicates a highly reactive system with a simple complex (Yuan et al., 2017).
Enthalpy is a state function of a chemical reaction that reflects reactions with heat absorbed or released during chemical bond dissociation under constant pressure. The ∆H values reported in Table 5 were calculated using Eqn. (16) and the values were positive which indicate endothermic reactions. The ∆H value influences the average product concentrations and pyrolysis time. High values of ∆H imply the high degree of endothermicity. An increase in the average concentration of char might be expected with an increase in the degree of endothermicity at the expense of volatiles and gases during pyrolysis. However, the final conversion time for pyrolysis increases with an increase in the ∆H value. Thus, a high degree of endothermicity could affect the activity of primary reaction in pyrolysis. The enthalpy values obtained were within the range of 114 - 125 kJ mol-1. High values of enthalpy indicate an increase in the thermal energy supply to the sample resulting in the dissociation of stronger chemical bonds.
The negative values of ∆S (Table 5) showed that the formation of the activated complex is accompanied by a decrease of the entropy, i.e. the activated complex is a more organized group compared to the initial reagents. The ∆S values obtained at heating rates of 10 – 40 °C min-1 were positive. Gibbs free energies values reflect the favorability of reactions with respect to both the first and the second laws of thermodynamics ranging between 82.6 and 179.6 kJ mol-1. The Gibbs free energy was found to increase with a decrease in entropy.
CONCLUSION
Thermal decomposition of the de-oiled castor seed cake was studied using thermogravimetry as a feasible option for conversion of waste cake to energy carrier. The thermal decomposition profiles showed that moisture removal occurred from ambient temperature to 200 °C, active pyrolysis within the temperature range of 200-400 °C and passive pyrolysis stage at a temperature > 400 °C. The maximum decomposition temperatures ranged from 329.94-355 °C. Iso-conversional kinetic analysis based on the FWO and KAS methods was found to be useful in evaluating the decomposition kinetic parameters. It was observed that the apparent activation energy of castor cake varied with the conversion fraction. The average activation energy values obtained using Friedman, Flynn-Wall-Ozawa and Kissinger-Akahira-Sunose methods were almost the same, but consistency with the degree of conversion was observed using Kissinger-Akahira-Sunose and Flynn-Wall-Ozawa methods which implies that both the methods can be used to correctly predict the activation energy for thermal degradation of the cake. The proximate and ultimate analyses result also indicate that castor seed cake can be a potential feedstock for the production of fuels and can be thermally converted to energy carrier. This kinetic data would be useful to model,
Sokoto and Baskar / Introduction, Materials, Results and Discussion, Conclusion
design, and develop a thermo-chemical system for waste castor seed cake conversion. The results of this study also provide insightful information for future use of waste castor seed cake as a feedstock for generation of biofuels or chemicals.
REFERENCES
Barneto, A. G., Carmona, J. A., Alfonso, J. E. M. and Serrano, R. S. (2010). Simulation of the Thermogravimetry Analysis of three Non-wood pulps. Bioresource Technology, 101, 3220-3229. https://doi.org/10.1016/j.biortech.2009.12.034
Bijoy, B., Krishna, B. B., Rawel S., Jitendra, K. and Thallada, B. (2016). Slow Pyrolysis of Spine Wood: Effect of CO2 and Nitrogen Atmosphere. Journal of Energy and Sustainable Environment, 2, 7-12.
Bilbao, R., Mastral, J. F., Aldea, M. E. and Ceamanos, J. (1997). The Influence of the Percentage of Oxygen in the Atmosphere on the Thermal Decomposition of Lignocellulosic Materials. J. Anal. Appl. Pyrolysis, 42(2), 189-202. https://doi.org/10.1016/S0165-2370(97)00050-8
Brown, M. E., Maciejewski, M., Vyazovkin, S., Nomen, R., Sempere, J., Burnham, A., et al., (2000). Computational aspects of kinetic analysis Part A: the ICTAC kinetics project-data, methods, and results. Thermochim. Acta, 355, 125 -143. https://doi.org/10.1016/S0040-6031(00)00443-3
Ceylan, S. and Topcu, Y. (2014). Pyrolysis kinetics of Hazelnut Husk using Thermogravimetric Analysis. Bioresource technology, 156, 182-188. https://doi.org/10.1016/j.biortech.2014.01.040
Chutia, R.S., Kataki and Bhaskar, T. (2013). Thermogravimetric and Decomposition Kinetic Studies of Mesua ferrea L. deoiled Cake. Bioresource Technology, 139, 66-72. https://doi.org/10.1016/j.biortech.2013.03.191
Damartzis, T., Vamvuka, D., Sfakiotakis, S. and Zabaniotou, A. (2011). Thermal Degradation Studies and Kinetic Modeling of Cardoon (Cynara cardunculus) Pyrolysis using Thermogravimetric Analysis (TGA). Bioresource Technology, 102, 6230-6238. https://doi.org/10.1016/j.biortech.2011.02.060
Di Blasi, C. (1993). Modeling and Simulation of Combustion Processes of Charring and non-charring solid fuels. Prog. Energy Combust. Sci., 19, 71-104. https://doi.org/10.1016/0360-1285(93)90022-7
Dong, C.-q., Zhang, Z.-f., Lu, Q., Yang, Y.-p. (2012). Characteristics and mechanism study of analytical fast pyrolysis of poplar wood. Energy Convers. Manage, 57, 49-59. https://doi.org/10.1016/j.enconman.2011.12.012
Doyle, C. D. (1962). Estimating Isothermal Life from Thermogravimetric Data. J. Appl. Polym. Sci., 6, 639. https://doi.org/10.1002/app.1962.070062406
El-Sayed, S. A. and Mostafa, M.E. (2014). Pyrolysis characteristics and kinetic parameters determination of biomass fuel powders by differential thermal gravimetric analysis (TGA/DTG). Energy Conversion and Management, 85, 165-175. https://doi.org/10.1016/j.enconman.2014.05.068
Garg, R., Anand, N., and Kumar, D. (2016). Pyrolysis of babool seeds (Acacia nilotica) in a fixed bed Reactor and bio-oil characterization, Renewable Energy, 96, 167-171. https://doi.org/10.1016/j.renene.2016.04.059
Gronli, M. G., Varhegyi, G. and Di Blasi, C. (2002). Thermogravimetric analysis and devolatilization kinetics of wood. Ind. Eng. Chem. Res., 41(17), 4201-4208. https://doi.org/10.1021/ie0201157
Hu, S., Jess, A. and Xu, M. (2007). Kinetic study of Chinese biomass slow pyrolysis: Comparison of different kinetic models. Fuel, 86, 2778-2788. https://doi.org/10.1016/j.fuel.2007.02.031
Idris, S. S., Rahman, N. A., Ismail, K., Alias, A. B., Rashid, Z. A. and Aris, M. J. (2010). Investigation of Thermochemical Behaviour of Low-Rank Malaysian Coal, Oil Palm Biomass and their Blends during Pyrolysis via Thermogravimetric Analysis (TGA) Bioresource Technology, 101(12), 4584-4592. https://doi.org/10.1016/j.biortech.2010.01.059
Idris, S. S., Abd Rahman, N. and Ismail, K. (2012). Combustion Characteristics of Malaysian oil Palm Biomass, sub-bituminous Coal and their Respective Blends via thermogravimetric analysis (TGA). Bioresource technology, 123, 581-591. https://doi.org/10.1016/j.biortech.2012.07.065
Ihli, J., Wong, W. C., Noel, E. H., Kim, Y., Kulak, A. N., Christenson, H. K., Duer, M. J. and Meldrum, F. C. (2014). Dehydration and crystallization of amorphous calcium carbonate in solution and in the air. Nature Communications, 5(316), 1-10. https://doi.org/10.1038/ncomms4169
Jauhiainen, J., Conesa, J. A., Font, R. and Martin-Gullón, I. (2004). Kinetics of the Pyrolysis and Combustion of Olive Oil Solid Waste. J. Anal. Appl. Pyrolysis, 72(1), 9-15. https://doi.org/10.1016/j.jaap.2004.01.003
Juntgen, H. (1984). Review of the kinetic of Pyrolysis and Hydropyrolysis in relation to the Chemical constitution of coal. Fuel, 63, 731-737. https://doi.org/10.1016/0016-2361(84)90058-9
Khawam, A. and Flanagan, D. R. (2006). Review of Solid-State Kinetic Models: Basics and Mathematical Fundamentals. J. Phys. Chem. B, 110, 17315-17328. https://doi.org/10.1021/jp062746a
Kim, Y. S., Kim, Y. S. and Kim, S. H. (2010). Investigation of Thermodynamic Parameters in Thermal Decomposition of Plastic Waste-Waste lube oil compound. Journal of Environ. Sci., 44, 5313-5317. https://doi.org/10.1021/es101163e
Lopez-Velazquez, M. A., Santes, V., Balmaseda, J. and Torres-Garcia, E. (2013). Pyrolysis of orange waste: a thermokinetic study. J. Anal. Appl. Pyrolysis, 99, 170-177. https://doi.org/10.1016/j.jaap.2012.09.016
Lu, Q., Yang, X.-c., Dong, C.-q., Zhang, Z.-f., Zhang, X.-m. and Zhu, X.-f. (2011). Influence of pyrolysis temperature and time on the cellulose fast pyrolysis products: analytical Py-GC/MS study. J. Anal. Appl. Pyrolysis, 92, 430-438. https://doi.org/10.1016/j.jaap.2011.08.006
Maiti, S., Purakayastha, S., Ghosh, B. (2007). Thermal characterization of mustard straw and stalk in nitrogen at different heating rates. Fuel, 86, 1513-1518. https://doi.org/10.1016/j.fuel.2006.11.016
McKendry, P. (2002). Energy Production from Biomass (part I): Overview of Biomass. Bioresource Technology, 83, 37- 46. https://doi.org/10.1016/S0960-8524(01)00118-3
Mishra, G. and Bhaskar, T. (2014). Nonisothermal Model free Kinetics for Pyrolysis of Rice Straw. Bioresource technology, 169, 614- 621. https://doi.org/10.1016/j.biortech.2014.07.045
Mohammed, T. H, Lakhmiri, R. and Azmani A. (2014) Bio-oil from Pyrolysis of Castor Seeds. International Journal of Basic & Applied Sciences IJBAS-IJENS, 14(4), 1-4.
Oluti, K., Richard, T., Doddapaneni, T. R. K. and Kanagasabapathi, D. (2014). Evaluation of the pyrolysis and Gasification Kinetics of Tropical Wood Biomass. Bio Resource, 9(2), 2179-2190. https://doi.org/10.15376/biores.9.2.2179-2190
Orfao, J. J. M., Antunes, F. A. and Figueiredo, J. L. (1999). Pyrolysis kinetics of lignocellulosic materials-three independent reaction model. Fuel, 78(3), 349-358. https://doi.org/10.1016/S0016-2361(98)00156-2
Roque-Diaz, P., University, C., Villas, L., Shemet, C. V. Z. h., Lavrenko, V. A. and Khristich, V. A. (1985). Studies on thermal decomposition and combustion mechanism of bagasse under non-isothermal conditions. Thermochim Acta, 93, 349-352. https://doi.org/10.1016/0040-6031(85)85088-7
Sait, H. H., Ahmad, H., Arshad, A. S. and Farid, N. A. (2012). Pyrolysis and combustion kinetics of Date Palm Biomass using thermogravimetric analysis. Bioresource Technology, 118, 382-389. https://doi.org/10.1016/j.biortech.2012.04.081
Sanchez-Silva, L., Lopez-Gonzalez, D., Villasenor, J., Sanchez, P. and Valverde, J. L. (2012). Thermogravimetric–mass spectrometric analysis of lignocellulosic and marine biomass pyrolysis. Bioresource Technology, 109,163-72. https://doi.org/10.1016/j.biortech.2012.01.001
Shuping, Z., Yulong, W., Mingde, Y., Chun, L. and Junmao, T. (2010). Pyrolysis characteristics and kinetics of the marine microalgae Dunaliella tertiolecta using thermogravimetric analyzer. Bioresource Technology, 101, 359-369. https://doi.org/10.1016/j.biortech.2009.08.020
Silva, R. V. S, Casilli, A., Sampaioa A. L, Ávila, B. M. F., Velosoa, M. C. C., Azevedo, D. A. and Romeiro, G. A. (2014). The Analytical Characterization of Castor Seed Cake Pyrolysis Bio-oils by using Comprehensive GC Coupled to Time of flight mass spectrometry. Journal of Analytical and Applied Pyrolysis, 106, 152-159. https://doi.org/10.1016/j.jaap.2014.01.013
Slopiecka, K., Bartocci, P. and Fantozzi, F. (2011). Thermogravimetric Analysis and Kinetics study of Poplar wood Pyrolysis. Third International Conference on Applied Energy, Perugia, Italy, pp 1687-1698.
Torres-Garcia, E., Balmaseda J., del Castillo L. F. and Reguera E. (2006). Thermal evolution of microporous nitroprussides on their dehydration process. Journal of Thermal Analysis and Calorimetry, 86(2), 371- 377. https://doi.org/10.1007/s10973-005-7385-1
Ucar, S. and Ozkan, A. R. (2008). Characterization of products from the pyrolysis of rapeseed oil cake. Bioresource Technology, 99, 8771- 8776. https://doi.org/10.1016/j.biortech.2008.04.040
Vaibhav, D., Jitendra K. and Bhaskar, T. (2017). Thermal Decomposition Kinetics of Sorghum Straw via Thermogravimetric Analysis. Bioresource technology, 245, 1122-1129. https://doi.org/10.1016/j.biortech.2017.08.189
Vamvuka, D., Kakaras, E., Kastanaki, E. and Grammelis, P. (2003). Pyrolysis characteristics and kinetics of biomass residuals mixtures with lignite. Fuel, 82, 1949-1960. https://doi.org/10.1016/S0016-2361(03)00153-4
Varhegyi, G., Antal, M. J., Jakab, E. and Szabo, P. (1997). Kinetic modeling of biomass pyrolysis. J. Anal. Appl. Pyrolysis, 42, 73-87. https://doi.org/10.1016/S0165-2370(96)00971-0
Varhegyi, G., Antal, M. J., Szekely, T. and Szabo, P. (1989). Kinetics of the thermal decomposition of cellulose, hemicellulose and sugarcane bagasse. Energy Fuels, 3(3), 329-335. https://doi.org/10.1021/ef00015a012
Veeresh S. J. and Narayana J. (2012). Assessment of Agro-Industrial Wastes Proximate, Ultimate, SEM and FTIR analysis for Feasibility of Solid Bio-Fuel Production. Universal Journal of Environmental Research and Technology, 2 (6), 575-581.
Vyasovkin, S., Burnham, A. K., Criado, J. M., Perez-Maqueda, L. A., Popescu, C. and Sbirrazzuoli, N. (2011). ICTAC Kinetics committee recommendation for performing kinetic computation on thermal Analysis Data. Thermochimica Acta, 520, 1-19. https://doi.org/10.1016/j.tca.2011.03.034
Vyazovkin, S. (2001). Modification of the Integral Isoconversional Method to account for Variation in the Activation Energy. Journal of Computational Chemistry, 22, 178-183. https://doi.org/10.1002/1096-987X(20010130)22:2<178::AID-JCC5>3.0.CO;2-#
Vyazovkin, S. and Sbirrazzuoli, N. (2006). Isoconversional kinetic analysis of thermally stimulated processes in polymers. Macromol. Rapid Commun., 27, 1515-1532. https://doi.org/10.1002/marc.200600404
Vyazovkin, S. and Wight, C. A. (1999). Model-free and model-fitting approaches to the kinetic analysis of isothermal and nonisothermal data. Thermochim. Acta, 53-68. https://doi.org/10.1016/S0040-6031(99)00253-1
White, J. E., Catallo, W. J. and Legendre, B. L. (2011). Biomass pyrolysis kinetics: a comparative critical review with relevant agricultural residue case studies. J. Anal. Appl. Pyrolysis, 91, 1- 33. https://doi.org/10.1016/j.jaap.2011.01.004
Yang, H., Yan, R., Chen, H., Lee, D. H. and Zheng, C. (2007). Characteristics of hemicellulose, cellulose and lignin pyrolysis. Fuel, 86, 1781-1788. https://doi.org/10.1016/j.fuel.2006.12.013
Yee, L. H. (2010). Initiatives to promote renewable energy. Available at: http://biz.thestar.com.my/news/story.asp?file=/2010/10/15/business/7229561
Yuan, X., He, T., Cao, H. and Yuan, Q. (2017). Cattle manure pyrolysis: kinetic and thermodynamic analysis with iso-conversional methods. Renewable Energy, 107, 489-496. https://dx.doi.org/10.1016/j.renene.2017.02.026