Page 1
University of Massachusetts Amherst University of Massachusetts Amherst
ScholarWorks@UMass Amherst ScholarWorks@UMass Amherst
Open Access Dissertations
2-2011
Pyrolysis Oils: Characterization, Stability Analysis, and Catalytic Pyrolysis Oils: Characterization, Stability Analysis, and Catalytic
Upgrading to Fuels and Chemicals Upgrading to Fuels and Chemicals
Tushar Vispute University of Massachusetts Amherst
Follow this and additional works at: https://scholarworks.umass.edu/open_access_dissertations
Part of the Chemical Engineering Commons
Recommended Citation Recommended Citation Vispute, Tushar, "Pyrolysis Oils: Characterization, Stability Analysis, and Catalytic Upgrading to Fuels and Chemicals" (2011). Open Access Dissertations. 349. https://scholarworks.umass.edu/open_access_dissertations/349
This Open Access Dissertation is brought to you for free and open access by ScholarWorks@UMass Amherst. It has been accepted for inclusion in Open Access Dissertations by an authorized administrator of ScholarWorks@UMass Amherst. For more information, please contact [email protected] .
Page 2
PYROLYSIS OILS: CHARACTERIZATION,
STABILITY ANALYSIS, AND CATALYTIC
UPGRADING TO FUELS AND CHEMICALS
A Dissertation Presented
by
TUSHAR P. VISPUTE
Submitted to the Graduate School of the
University of Massachusetts Amherst in partial fulfillment
of the requirements for the degree of
DOCTOR OF PHILOSOPHY
February 2011
Chemical Engineering
Page 3
© Copyright by Tushar P. Vispute 2011
All Rights Reserved
Page 4
PYROLYSIS OILS: CHARACTERIZATION,
STABILITY ANALYSIS, AND CATALYTIC
UPGRADING TO FUELS AND CHEMICALS
A Dissertation Presented
by
TUSHAR P. VISPUTE
Approved as to style and content by:
_______________________________________
George W. Huber, Chair
_______________________________________
W. Curt Conner, Member
_______________________________________
Scott M. Auerbach, Member
____________________________________
T. J. (Lakis) Mountziaris, Department Head
Chemical Engineering
Page 5
iv
ACKNOWLEDGEMENTS
I would like to deeply acknowledge the help and support of my advisor Prof.
George W. Huber on this fascinating research program. George is an excellent mentor
and provides an outstanding research environment in the group for graduate students to
work and develop. I am fortunate to be one of his first graduate students and witness him
build his successful career. I am also very thankful to Prof. Curt Conner and Prof. Scott
Auerbach, for being not only very helpful committee members but also invaluable
mentors on several occasions. Being one of the first two members of the group, we had to
build the Huber group labs from the scratch and Curt was a tremendous help for me in
that. I cannot forget that in our first year he took me and Hakan down to New Jersey in
his van to buy the used lab equipments to get us started. I would like to thank all the
present and past group members of Huber research group for all the enlightening
discussions we had in labs and group meetings. Specifically I would like to thank Hakan
Olcay and Geoff Tompsett for their insight and help with equipment design. I would like
to thank Torren Carlson for the collaboration on catalytic fast pyrolysis project. I would
also like to thank Asad Javaid and Xiaoming Pan for the collaboration on bio-oil
stabilization project and for carrying out bio-oil filtration and viscosity measurements
experiments respectively. I would like to thank Aimaro Sanna and Huiyan Zhang for help
with bio-oil hydroprocessing and zeolite upgrading experiments respectively. I would
also like to thank Aniruddha Upadhye for help with bio-oil characterization.
I would like to thank all the people I met here at UMass that made my five years
of stay happy and memorable. I would particularly like to thank Suresh Gupta, Sarvesh
Page 6
v
Agrawal, Vishal Gaurav, Achyuta Teella, and Hakan Olcay for their friendship. My
family has been a continuous source of encouragement and support for me. They have
guided and supported me through all my decisions. I would like to thank my parents, my
sister Prachi, and my brother Tejas for their unconditional love. Lastly I would like to
acknowledge my funding agencies. This work was supported by the U. S. Department of
Energy Office of Energy Efficiency and Renewable Energy, under grant DE-FG36-
08GO18212 and by the Defense Advanced Research Project Agency through the Defense
Science Office Cooperative Agreement HR0011-09-C-0075.
Page 7
vi
ABSTRACT
PYROLYSIS OILS: CHARACTERIZATION, STABILITY ANALYSIS, AND
CATALYTIC UPGRADING TO FUELS AND CHEMICALS
FEBRUARY 2011
TUSHAR P. VISPUTE
B.Chem.Engg., INSTITUTE OF CHEMICAL TECHNOLOGY, UNIVERSITY OF
MUMBAI
Ph.D., UNIVERSITY OF MASSACHUSETTS AMHERST
Directed by: Professor George W. Huber
There is a growing need to develop the processes to produce renewable fuels and
chemicals due to the economical, political, and environmental concerns associated with
the fossil fuels. One of the most promising methods for a small scale conversion of
biomass into liquid fuels is fast pyrolysis. The liquid product obtained from the fast
pyrolysis of biomass is called pyrolysis oil or bio-oil. It is a complex mixture of more
than 300 compounds resulting from the depolymerization of biomass building blocks,
cellulose; hemi-cellulose; and lignin. Bio-oils have low heating value, high moisture
content, are acidic, contain solid char particles, are incompatible with existing petroleum
based fuels, are thermally unstable, and degrade with time. They cannot be used directly
in a diesel or a gasoline internal combustion engine.
One of the challenges with the bio-oil is that it is unstable and can phase separate
when stored for long. Its viscosity and molecular weight increases with time. It is
important to identify the factors responsible for the bio-oil instability and to stabilize the
Page 8
vii
bio-oil. The stability analysis of the bio-oil showed that the high molecular weight lignin
oligomers in the bio-oil are mainly responsible for the instability of bio-oil. The viscosity
increase in the bio-oil was due to two reasons: increase in the average molecular weight
and increase in the concentration of high molecular weight oligomers. Char can be
removed from the bio-oil by microfiltration using ceramic membranes with pore sizes
less than 1 µm. Removal of char does not affect the bio-oil stability but is desired as char
can cause difficulty in further processing of the bio-oil. Nanofiltration and low
temperature hydrogenation were found to be the promising techniques to stabilize the
bio-oil.
Bio-oil must be catalytically converted into fuels and chemicals if it is to be used
as a feedstock to make renewable fuels and chemicals. The water soluble fraction of bio-
oil (WSBO) was found to contain C2 to C6 oxygenated hydrocarbons with various
functionalities. In this study we showed that both hydrogen and alkanes can be produced
with high yields from WSBO using aqueous phase processing. Hydrogen was produced
by aqueous phase reforming over Pt/Al2O3 catalyst. Alkanes were produced by
hydrodeoxygenation over Pt/SiO2-Al2O3. Both of these processes were preceded by a low
temperature hydrogenation step over Ru/C catalyst. This step was critical to achieve high
yields of hydrogen and alkanes. WSBO was also converted to gasoline-range alcohols
and C2 to C6 diols with up to 46% carbon yield by a two-stage hydrogenation process
over Ru/C catalyst (125 °C) followed by over Pt/C (250 °C) catalyst. Temperature and
pressure can be used to tune the product selectivity.
The hydroprocessing of bio-oil was followed by zeolite upgrading to produce C6
to C8 aromatic hydrocarbons and C2 to C4 olefins. Up to 70% carbon yield to aromatics
Page 9
viii
and olefins was achieved from the hydrogenated aqueous fraction of bio-oil. The
hydroprocessing steps prior to the zeolite upgrading increases the thermal stability of bio-
oil as well as the intrinsic hydrogen content. Increasing the thermal stability of bio-oil
results in reduced coke yields in zeolite upgrading, whereas, increasing the intrinsic
hydrogen content results in more oxygen being removed from bio-oil as H2O than CO
and CO2. This results in higher carbon yields to aromatic hydrocarbon and olefins.
Integrating hydroprocessing with zeolite upgrading produces a narrow product spectrum
and reduces the hydrogen requirement of the process as compared to processes solely
based on hydrotreating. Increasing the yield of petrochemical products from biomass
therefore requires hydrogen, thus cost of hydrogen dictates the maximum economic
potential of the process.
Page 10
ix
TABLE OF CONTENTS Page
ACKNOWLEDGEMENTS ............................................................................................... iv
ABSTRACT ....................................................................................................................... vi
LIST OF TABLES ............................................................................................................ xii
LIST OF FIGURES ...........................................................................................................xv
CHAPTER
1. INTRODUCTION AND OBJECTIVES .................................................................1
1.1 Introduction ............................................................................................1 1.2 Objectives ..............................................................................................5
2. MATERIALS AND METHODS .............................................................................7
2.1 Bio-oil ....................................................................................................7 2.2 Elemental Analysis, Ash Content, Viscometry, Accelerated
Stability Testing, Water Analysis, TAN Measurement, Catalyst
Characterization and TOC Analysis ............................................................8 2.3 Thermogravimetric Analysis .................................................................9
2.4 Gel Permeation Chromatography ..........................................................9
2.5 Bio-oil Extraction and Pre-treatment ...................................................10 2.6 Low Temperature Hydrogenation (LTH) of the Aqueous
Fraction of Bio-oil......................................................................................11
2.6.1 Batch Reactor ........................................................................11
2.6.2 Flow Reactor .........................................................................12
2.7 Aqueous Phase Processing ...................................................................14 2.8 Two Stage Hydrogenation of Water Soluble Bio-oil ...........................17
2.9 Zeolite Upgrading of Bio-oil, Water Soluble Bio-oil and
Hydrogenated Water Soluble Bio-oil.........................................................17 2.10 Bio-oil Microfiltration and Nanofiltration .........................................19
3. CHARACTERIZATION OF BIO-OIL .................................................................22
3.1 Introduction ..........................................................................................22
3.2 Experimental ........................................................................................24 3.3 Elemental Analysis ..............................................................................24 3.4 Solubility Studies and Chemical Composition ....................................24
Page 11
x
3.5 Viscosity Measurements ......................................................................28
3.6 Gel Permeation Chromatography ........................................................30 3.7 Conclusion ...........................................................................................31
4. STABILIZATION OF BIO-OIL ...........................................................................33
4.1 Introduction ..........................................................................................33
4.2 Material and Methods ..........................................................................35 4.3 Stability Analysis of Bio-oil and its Fractions .....................................36 4.4 Stability Analysis of the Model Bio-oil Systems .................................40 4.5 Effects of lignin on the bio-oil viscosity ..............................................43
4.6 Bio-oil Microfiltration .........................................................................50 4.7 Bio-oil Nanofiltration...........................................................................55
4.8 Conclusion ...........................................................................................59
5. AQUEOUS PHASE PROCESSING OF WATER SOLUBLE BIO-OIL .............63
5.1 Introduction ..........................................................................................63
5.2 Experimental ........................................................................................65 5.3. Proposed Process, Reaction System and Theoretical Yields ..............66
5.4 Low Temperature Hydrogenation (LTH) of the Aqueous
Faction of Bio-oil in Batch Reactor ...........................................................69 5.5 Aqueous Phase Reforming of the Aqueous Fraction of Bio-oil ..........74
5.6 Aqueous Phase Dehydration/Hydrogenation of the Aqueous
Fraction of Bio-oil......................................................................................80 5.7 Conclusion ...........................................................................................87
6. HYDROPROCESSING OF BIO-OIL ...................................................................90 6.1 Introduction ..........................................................................................90
6.2 Bio-oil Hydroprocessing: State of the Art ...........................................91 6.3 Experimental ........................................................................................93
6.4 Homogeneous Reactions ......................................................................94 6.5 Single Stage Hydrogenation of Water Soluble Pine Wood Bio-
oil ...............................................................................................................96
6.5.1 Effect of Temperature ...........................................................96
6.5.2 Effect of Space Velocity .......................................................99
6.6 Two-stage Hydrogenation of Water Soluble Pine Wood Bio-oil ......103 6.7 Hydroprocessing of Aqueous Fraction of DOE Bio-oil (WS-
DOE-BO) and Use of Bimetallic Catalyst in Second Stage ....................113 6.8 Reactions in Hydroprocessing of Aqueous Fraction of Bio-oil .........120 6.9 Low Temperature Hydrogenation of Whole Bio-oil .........................124
Page 12
xi
6.10 Conclusion .......................................................................................127
7. INTEGRATED HYDROPROCESSING AND ZEOLITE
UPGRADING OF BIO-OIL ................................................................................130
7.1 Introduction ........................................................................................130 7.2 H/Ceff Ratio ........................................................................................132 7.3 Integrated Hydroprocessing and Zeolite Upgrading ..........................133
7.4 Hydroprocessing of Bio-oil: Feed and Product Analysis ..................143 7.5 Zeolite Upgrading of Non-hydrogenated and Hydrogenated
Bio-oil-derived Feeds...............................................................................151 7.6 Process Economics.............................................................................156
7.7 Conclusion .........................................................................................158
8. CONCLUSIONS AND FUTURE WORK ..........................................................161
8.1 Conclusions ........................................................................................161 8.2 Future Work .......................................................................................166
BIBLIOGRAPHY ............................................................................................................168
Page 13
xii
LIST OF TABLES
Table Page
3-1 Typical physical properties of bio-oil and heavy fuel oil ............................................23
3-2 Viscosity of the oak wood bio-oil and its fractions .....................................................29
4-1 Viscosity, water content and weight average molecular weight changes in
oak wood bio-oil at 90 °C ..................................................................................................34
4-2 Composition of model bio-oil system 1 ......................................................................40
4-3 Composition of model bio-oil system 2 ......................................................................42
4-4 Molecular weight and are under peak data from GPC for DOE bio-oil, and
low and high molecular weight lignin from DOE bio-oil .................................................49
4-5 Composition of DOE bio-oil before and after microfiltration .....................................55
4-6 Impact of microfiltration on the total water content and water soluble and
insoluble content of DOE bio-oil .......................................................................................55
4-7 Molecular weight and concentration data for DOE bio-oil and its
nanofiltration permeates and retentates .............................................................................56
4-8 Initial viscosity and rate of viscosity increase for bio-oil and different
fraction from bio-oil ...........................................................................................................60
5-1 Hydrogenation of the aqueous fraction of bio-oil with initial carbon
concentration of 24900 mg L-1
(by TOC) in batch reactor, Catalyst: 3 gm
of 5 wt% Ru/C (wet basis), total P: 1000 psi ....................................................................71
5-2 Aqueous-phase reforming of H-WSBO (from OWBO) and 5 wt% sorbitol
solution with a 1 wt% Pt/Al2O3 catalyst. Reaction conditions: 265 C and 750
psi. The H-WSBO contains 1.5-2 wt% carbon and is prepared by hydrogenation
of the aqueous fraction of bio-oil at 175 C and 1000 psi with a 5 wt% Ru/C
catalyst for 3 h ....................................................................................................................75
5-3 Production of alkanes from H-WS-OWBO and sorbitol at 260 C and 750 psi
with a 4 wt% Pt/SiO2-Al2O3 catalyst. (The WSBO feed contains 1.5-2 wt% carbon
and are prepared by hydrogenation of the aqueous fraction of bio-oil at 175 C
and 1000 psi with a 5 wt% Ru/C catalyst for 3 h) .............................................................75
6-1 Non-isothermal hydroprocessing of vacuum pyrolysis bio-oil ...................................92
Page 14
xiii
6-2 Effect of temperature on reactant conversions for LTH of WS-PWBO ......................97
6-3 Reactant and product concentration for low temperature hydrogenation
of WS-PWBO at different temperatures ...........................................................................98
6-4 Effect of space velocity on conversion of reactants in LTH of WS-PWBO .............100
6-5 Reactant and product concentration for LTH of WS-PWBO at
different space velocities..................................................................................................101
6-6 Product yield and selectivity in 2-stage hydrogenation of WS-PWBO
over Ru/C catalyst in both the stages. Pressure: 750 psi for both the stages,
first stage catalyst: 5wt% Ru/C, temperature: 125 °C, second stage catalyst:
5 wt% Ru/C .....................................................................................................................105
6-7 Product yield and selectivity in 2-stage hydrogenation of WS-PWBO.
First stage catalyst: 5wt% Ru/C, temperature: 125 °C, second stage catalyst:
5 wt% Pt/C, WHSV for both the stages: 3 hour-1
............................................................109
6-8 Composition of the two-stage water soluble pine wood bio-oil
(WS-PWBO) hydrogenation products. Feed: ~13 wt% WS-PWBO
solution in water. Hydrogenation reaction conditions: first over 5wt%
Ru/C catalyst (125 °C) then over 5 wt% Pt/C catalyst; P: 1450 psi,
WHSV: 3 hour-1
...............................................................................................................110
6-9 Composition of the water soluble fraction of DOE bio-oil. The feed
is made by mixing DOE-BO and water in 1:4 weight ratio .............................................114
6-10 Product composition of the single stage hydrogenation of WS-DOE-BO
on 5 wt% Ru/C at 125 °C, 1450 psi, and 3 hour-1
. Feed: ~13 wt% WS-DOE-BO
solution in water ..............................................................................................................116
6-11 Feed and product composition for 2-stage hydrogenation of WS-DOE-BO.
Feed: ~13 wt% WS-DOE-BO solution in water. P: 1450 psi, WHSV: 3 h-1
..................118
6-12 Composition of DOE-BO feed low temperature hydrogenated
DOE-BO. Hydrogenation carried out over 5 wt% Ru/C catalyst, 125 °C,
1450 psi, 1.6 hour-1
..........................................................................................................125
6-13 Molecular weight and concentration for DOE bio-oil and hydrogenated
products. Hydrogenation was carried out over 5 wt% Ru/C catalyst, 1450 psi,
1.6 hour-1
..........................................................................................................................127
Page 15
xiv
7-1 Carbon yields (%) for HZSM-5 upgrading of biomass-derived feedstocks.
Catalyst: HZSM-5 (SiO2/Al2O3 = 30), Reaction temperature = 873 K, Helium
carrier gas flow rate: 204 cm3 min
-1 ................................................................................137
7-2 Homogeneous coke yield for different feedstocks ....................................................138
7-3 Theoretical toluene and propylene yields and percentage of theoretical
toluene yield for different feedstocks ..............................................................................138
7-4 Composition of WS-PWBO feed ..............................................................................146
7-5 Composition of the WS-PWBO hydrogenation products. Low
temperature hydrogenation reaction conditions: over 5 wt% Ru/C catalyst ;
T: 125 °C; P: 750 psi; WHSV: 3 hour-1
, high temperature hydrogenation
reaction conditions: first over 5wt% Ru/C catalyst (125 °C) then over 5 wt%
Pt/C catalyst (250 °C); P: 1450 psi, WHSV: 3 hour-1
......................................................150
7-6 Overall carbon yield for the integrated catalytic process for the
conversion of pyrolysis oils and the aqueous fraction of pyrolysis oil ............................153
7-7 Effect of temperature on the product carbon yields (%) for zeolite
Upgrading of HTH-WS-PWBO on HZSM-5. WHSV: 11.7 hour-1
, Helium
carrier gas flow rate: 204 cm3 min
-1, HTH-WS-PWBO was obtained
by 2-stage hydrogenation of WS-PWBO. Hydrogenation reaction conditions,
1st stage: 5 wt% Ru/C catalyst, 125 °C, 1450 psi, WHSV: 3 hour
-1, 2
nd stage:
5 wt% Pt/C catalyst, 250 °C, 1450 psi, WHSV: 3 hour-1
................................................156
Page 16
xv
LIST OF FIGURES
Figure Page
2-1 Schematic of the single stage flow reactor system used for the hydrogenation ..........14
2-2 Schematic of the bio-oil microfiltration process .........................................................21
3-1 Bio-oil fractions classification .....................................................................................23
3-2 Extraction of oak wood bio-oil in water ......................................................................26
3-3 Identification of the major components of water soluble fraction of oak
wood bio-oil .......................................................................................................................27
3-4 Gel permeation chromatographs of DOE bio-oil, water soluble DOE
bio-oil (WS-DOE-BO) and water insoluble DOE bio-oil (WI-DOE-BO) .................. 31
4-1 Viscosity of pine wood bio-oil versus incubation time at 90 °C .................................36
4-2 Viscosity of Water Insoluble – Pine Wood Bio-oil versus incubation time
at 90 °C .............................................................................................................................37
4-3 Viscosity of Water Soluble – Pine Wood Bio-oil versus incubation time
at 90 °C ..............................................................................................................................38
4-4 Viscosity of Hydrogenated WS-PWBO versus incubation time at 90 °C ...................39
4-5 Viscosity of Bio-oil Model System -1 versus incubation time at 90 °C .....................41
4-6 Viscosity of Bio-oil Model System - 2 versus incubation time at 90 °C ....................42
4-7 Viscosity of DOE bio-oil versus incubation time at shear rate 10 s-1
..........................44
4-8 GPC analysis results of DOE-BO ................................................................................44
4-9 Viscosity of LMW lignin at 40ºC. Hours is the incubation time at 90 °C ...................47
4-10 GPC analysis result of LMW lignin fraction of DOE-BO ........................................47
4-11 GPC analysis result of HMW lignin fraction incubated at 90 °C for 0 hr,
24 hr, 48 hr, and 72 hr ........................................................................................................48
Page 17
xvi
4-12 Weight average molecular weight for DOE bio-oil, low molecular
weight lignin and high molecular weight lignin from DOE bio-oil against
the incubation (at 90°C) time .............................................................................................48
4-13 Microscopic image of DOE bio-oil feed at different magnification
levels: a=20X and b=50X .................................................................................................52
4-14 Microscopic images of membrane permeate of DOE bio-oil. A: 0.5 µm,
20X, B: 0.5 µm, 50X, C: 0.8 µm, 20X, and D: 0.8 µm, 50X ............................................53
4-15 Ash content of DOE bio-oil feed, 0.5 µm permeate and 0.8 µm permeate ...............53
4-16 GPC data for DOE bio-oil feed and permeates and retentates from 5 nm
and 10 nm filters ................................................................................................................57
4-17 Accelerated stability viscosity data for DOE bio-oil and permeates and
retentates from nanofiltration .............................................................................................58
4-18 Accelerated stability GPC data for DOE bio-oil and its permeates and
retentates from nanofiltration .............................................................................................59
5-1 Aqueous phase processing of sorbitol .........................................................................65
5-2 Block diagram of the aqueous phase processing of bio-oil .........................................66
5-3 Alkane distribution for aqueous-phase reforming of WSBO and 5 wt%
sorbitol solution at 265 C and 750 psi with 1 wt% Pt/Al2O3 catalyst. Feed
and reaction key (see Table 5-2) .......................................................................................76
5-4 Process flow diagram for aqueous phase reforming of bio-oil ....................................78
5-5 Alkane distribution for the liquid phase dehydration/hydrogenation of
H-WS-OWBO and 5 wt% sorbitol solution at 260 C and 750 psi with 4 wt%
Pt/SiO2-Al2O3 catalyst. Feed and reaction key (see Table 5-3) ........................................81
5-6 Alkane distribution for the liquid phase dehydration/hydrogenation of
H-WS-OWBO at 260 C and 750 psi with 4 wt% Pt/SiO2-Al2O3 catalyst.
Feed and reaction key (see Table 5-3) ...............................................................................81
5-7 Process flow diagram for the aqueous phase dehydration/hydrogenation of bio-oil ..84
5-8 Theoretical and actual alkane selectivities for the production of alkanes
from the aqueous fraction of the bio-oil. Legend (refer Table 5-3) ...................................86
Page 18
xvii
6-1 Reactivity of feed components during homogeneous reactions in
aqueous fraction of pine wood bio-oil, P: 750 psi, feed flow rate: 0.04
ml min-1, temperature is in °C ...........................................................................................95
6-2 Product distribution from the hydrogenation of WS-PWBO over Ru/C
catalyst at 125 °C, 750 psi and at the WHSV of 3.0 h-1
.......................................... 106
6-3 Product yield and selectivity in 2-stage hydrogenation of aqueous fraction
of pine wood bio-oil over Ru/C and Pt/C catalyst. A: Ru/C-Pt/C, 125-220 °C,
1450 psi, B: Ru/C-Pt/C, 125-220 °C, 750 psi, C: Ru/C-Pt/C, 125-250 °C,
750 psi, D: Ru/C-Pt/C, 125-250 °C, 1450 psi, E: Ru/C-Pt/C, 125-275 °C,
1450 psi. All the experiments are carried out at the space velocity of 3 hour-1
...............111
6-4 Product selectivity distribution with 2nd
stage temperature in Hydrogenation
of PW-WSBO. First Stage: 125 °C, 5 wt% Ru/C catalyst, second Stage: 5 wt%
Pt/C catalyst. P: 1450 psi for both stages, WHSV: 3 hour-1
for both stages ....................112
6-5 Molecular weight distribution for the DOE bio-oil feed and low
temperature hydrogenation products. Hydrogenation carried out over 5
wt% Ru/C catalyst, 1450 psi, 1.6 hour-1
................................................................. 126
7-1 Carbon yield of olefins and aromatic hydrocarbons from the conversion
of biomass derived feedstocks over HZSM-5 catalyst as a function of the
hydrogen to carbon effective ratio (H/Ceff) of the feed. Theoretical yield is
calculated for toluene (23). Key: WSBO is the water soluble fraction of the
pine wood bio-oil, LTH-WSBO is WSBO hydrogenated over Ru/C (125 °C,
750 psi, 3 hour-1
), HTH-WSBO is WSBO hydrogenated first over Ru/C
(125 °C, 1450 psi, 3 hour-1
), then over Pt/C (250 °C, 1450 psi, 3 hour-1
).
DOE-BO is DOE bio-oil and LTH-DOE-BO is DOE-BO hydrogenated
over Ru/C (125 °C, 1450 psi, 1.6 hour-1
) ................................................................ 136
7-2 Reaction schematic for the integrated hydroprocessing and zeolite
upgrading of pyrolysis oil. Solid arrows: pyrolysis oil is directly passed
over zeolite catalyst, long-dashed arrows: pyrolysis oil is hydrogenated
over Ru/C at 125 °C (398 K) and then passed over zeolite catalyst,
short-dashed arrows: pyrolysis oil is first hydrogenated over Ru/C at
125 °C (398 K), then over Pt/C at 250 °C (523 K) and then passed over
zeolite catalyst. .................................................................................................................140
7-3 Production of olefins, aromatic hydrocarbons, diols, and gasoline range
alcohols from the integrated catalytic processing of pyrolysis oil ...................................143
Page 19
xviii
7-4 Feed and product carbon distribution (in %C) for the hydrogenation of
WS-PWBO and for the zeolite upgrading. (A) WS-PWBO feed, (B) Product
distribution from single stage hydrogenation of WS-PWBO over Ru/C at
125 °C, 750 psi, 3 hour-1
, (C) Product distribution from 2-Stage hydrogenation
of WS-PWBO, first over Ru/C at 125 °C, 1450 psi, 3 hour-1
, then over Pt/C at
250 °C, 1450 psi, 3 hour-1
................................................................................................145
7-5 Carbon yields for the conversion of bio-oil derived feedstocks over
HZSM-5 at 600 °C. Key: WSBO is the water soluble fraction of the pine
wood bio-oil, LTH-WSBO is WSBO hydrogenated over Ru/C (125 °C, 750
psi, 3 hour-1
), HTH-WSBO is WSBO hydrogenated first over Ru/C (125 °C,
1450 psi, 3 hour-1
), then over Pt/C (250 °C, 1450 psi, 3 hour-1
). DOE-BO is
DOE bio-oil and LTH-DOE-BO is DOE bio-oil hydrogenated over Ru/C
(125 °C, 1450 psi, 1.6 hour-1
). The category others encompasses phenol,
alkyl phenols, naphthol and alkyl naphthols ....................................................................152
7-6 Annual economic potential for the integrated hydroprocessing and zeolite
upgrading of pyrolysis oil as a function of H/Ceff ratio of feed to zeolite catalyst ..........158
Page 20
1
CHAPTER 1
INTRODUCTION AND OBJECTIVES
1.1 Introduction
There is a growing need to develop the processes to produce renewable fuels and
chemicals due to the economical, political, and environmental concerns associated with
fossil fuels.(1, 2)
The only economically sustainable source of renewable carbon is the
carbon fixed in biomass by photosynthesis.(3)
Lignocellulosic biomass is an excellent
renewable feedstock because it is both abundant and inexpensive.(3-6)
Currently no
industrial process exists to economically convert lignocellulosic biomass to renewable
fuels and chemicals. Several routes are being studied to convert lignocellulosic biomass
to fuels and chemicals including fast pyrolysis(7-10)
, gasification(11, 12)
, catalytic fast
pyrolysis(13, 14)
, and aqueous phase processing(15-17)
.
One of the most promising methods for the conversion of biomass into liquid
fuels is fast pyrolysis. In fast pyrolysis, bio-oil (or pyrolysis oil) is produced by rapidly
heating biomass to intermediate temperatures (450-600 °C) in the absence of any external
oxygen followed by rapid quenching of the resulting vapors. Bio-oil can be produced in
weight yields as high as 75 wt% of the original dry biomass(18)
and bio-oils typically
contain 60-75% of the initial energy of the biomass(1, 10)
. The other products obtained
from the fast pyrolysis of biomass are char (10-20 wt% of biomass) and non-condensable
gases (10-25 wt% of biomass). A wide variety of feedstock can be used to produce bio-
oil, including wood, corn stover, agricultural waste, switch grass, and forest waste.
Page 21
2
Another advantage of fast pyrolysis technology is that it can be economical at a small
scale (50 to 100 tons per day of biomass) hence avoiding the significant cost penalty of
biomass transport.(19, 20)
Biomass has low energy density due its low bulk density (~ 0.7
kg m-3
). Pyrolysis oil has same heating value has biomass (16 to 18 MJ kg-1
), but has
higher energy density than biomass due to its higher bulk density (~ 1.2 kg m-3
).
Bio-oil is a complex mixture of more than 300 compounds resulting from the
depolymerization of biomass building blocks, cellulose; hemi-cellulose; and lignin.(10)
Typical oxygen content of bio-oil is about 40-50%, resulting in low calorific value of
around 16-18 MJ kg-1
. It is also acidic in nature with pH of about 2.5. Bio-oil is highly
viscous and its viscosity increases upon storage. The moisture content of bio-oil is about
25-35 wt%. Bio-oil typically contains micron sized char particles. Bio-oil is insoluble
with petroleum based fuels. Due to these reasons bio-oil is a low quality fuel and cannot
be used directly in a diesel or gasoline combustion engine. In this study we first develop
techniques for the physical and chemical characterization of bio-oil. This will help us in
developing the bio-oil stabilization approach as well as in designing cost-effective bio-oil
conversion (to fuels and valuable chemicals) processes. As shown in this thesis, bio-oil
can be upgraded to fuels and chemicals that fit seamlessly in our current fuels and
chemicals infrastructure. In a typical biomass fast pyrolysis process based biorefinery the
bio-oil produced from various small scale pyrolysis units can be transported to a common
upgrading facility. The bio-oil may be needed to be stored in such a facility. It is hence
essential to answer the storage stability problems of bio-oil.
Page 22
3
We will study the instability of bio-oil and identify the factors responsible for it
and to determine how bio-oil instability problems can be mitigated. The stability will be
accessed by the accelerated stability method, where bio-oil is stored at 90 °C and its
viscosity is measured over time at 40 °C. The rate of viscosity increase correlates with the
bio-oil stability. Following are the factors believed to be contributing towards the
unstable nature of bio-oil(21)
:
Presence of char
Presence of acids
Presence of high molecular weight lignin oligomers
Polymerization reactions within various bio-oil functionalities
Char particles can aggregate over time in the bio-oil. The hydrophobic
components of the bio-oil can also agglomerate with the char. Char particles can also act
as catalyst or nucleation sites for the polymerization reactions between various bio-oil
functionalities.(22, 23)
Acids present in the bio-oil can also catalyze condensation
polymerization reactions within bio-oil resulting in an increase in viscosity of bio-oil
upon storage. The bio-oil components can also polymerize over time in the absence of
any catalyst resulting in viscosity increase. The lignin oligomers present in the bio-oil can
have molecular weight up to 10,000 and can contribute substantially towards the bio-oil
instability. The oligomers are found to contain various reactive functional groups as well
as free radicals and hence are highly susceptible to further polymerization.(24)
In this
study we have systematically evaluated the effects of various parameters discussed above
on bio-oil instability. Char removal by microfiltration was done in Prof. David Ford’s lab
Page 23
4
at UMass-Amherst. The viscosity measurements were done at Prof. Surita Bhatia’s lab at
UMass-Amherst.
The majority of the past bio-oil upgrading efforts to date have revolved around
catalytic hydrotreating and zeolite upgrading. These methods suffer from several
drawbacks such as catalyst coking and low yields to valuable products. Hence it is
imperative to develop alternative bio-oil upgrading technologies. Aqueous Phase
Processing (APP) is a promising method to convert biomass based oxygenates to fuels
such as hydrogen and alkanes. It is shown in the literature that hydrogen and alkanes can
be produced with high yield from aqueous solutions of pure oxygenates such as glucose
and sorbitol.(15, 16, 25-28)
The aqueous solutions of pure oxygenates are not feasible
feedstocks with the industrial point of view. Bio-oil is cheaply available and a large
fraction of it is water soluble. Hence the aqueous fraction of the bio-oil can be an
excellent feedstock to be treated by APP to produce hydrogen and alkanes. Our results
show that we can produce hydrogen from the aqueous fraction of the bio-oil at moderate
selectivity and conversion up to 60%. Alkane can be produced from the aqueous fraction
of the bio-oil at high selectivity (up to 97%) and moderate conversion (up to 60%).(29)
Aqueous fraction of the bio-oil can potentially be used to produce valuable chemicals
including polyols such as ethylene glycol, propylene glycol and butanediols.
Hydroprocessing can also be used to produce fuels and chemicals from bio-oil.
The majority of the past bio-oil hydroprocessing efforts have revolved around using
conventional sulfided CoMo and NiMo based catalysts.(30, 31)
The current
Page 24
5
hydroprocessing processes suffer from drawbacks such as high hydrogen consumption,
catalyst deactivation, reactor plugging, and use of sulfided catalysts. Zeolite upgrading
has also been studied extensively for bio-oil upgrading to aromatic hydrocarbons and
olefins but suffer from drawbacks such has high coke yield and low valuable product
yields.(32, 33)
The past bio-oil upgrading processes are discussed later in detail in Sections
6.2 and 7.1.We want to combine the advantages of hydroprocessing and zeolite
upgrading and eliminate the drawbacks. In this study we will develop the
hydroprocessing and zeolite upgrading based processes to convert bio-oil to tangible
fuels and chemicals. I will specifically study the hydrogenation of water soluble fraction
of bio-oil over noble metal catalyst. Effect of operating parameters such as temperature,
space velocity, and pressure are studied in detail to determine the optimum reaction
conditions required to maximize the carbon yield to valuable products. Zeolite upgrading
of bio-oil and its aqueous fraction will be studied and will be integrated with the
hydroprocessing to maximize the aromatics and olefins yield from bio-oil. Some
economic considerations will also be presented.
1.2 Objectives
The objective of this thesis is to develop realistic catalytic processes for the
conversion of bio-oil into fuels and chemicals. In order to develop these catalytic
processes, we first need to understand what bio-oil is, which requires the development of
techniques to characterize the bio-oil. We also need to understand what makes bio-oil
unstable and how the bio-oil can be stabilized. This thesis has five main objectives
including:
Page 25
6
1. Physical and chemical characterization of bio-oil.
2. Investigation of the factors responsible for the instability of bio-oil. The factors that
will be studied are char, acids, and high molecular weight lignin. Various bio-oil
stabilization approaches will also be investigated.
3. Conversion of aqueous fraction of bio-oil to hydrogen and alkanes by aqueous phase
processing.
4. Study the single and two stage hydroprocessing of aqueous fraction of bio-oil and
whole bio-oil. Study the effect of operating conditions including temperature, pressure,
and space velocity to maximize the yield of desired products.
5. Study the integration of hydroprocessing and zeolite upgrading to produce aromatics
and olefins from bio-oil with high yields.
Page 26
7
CHAPTER 2
MATERIALS AND METHODS
2.1 Bio-oil
Three different kinds of bio-oils were used in this study. The oak wood bio-oil
(OWBO) was obtained from the Renewable Oil International (ROI). It was produced
using ROI’s proprietary fast pyrolysis process where they use auger reactor to pyrolyze
the biomass.(34, 35)
OWBO was used for bio-oil characterization data described in Chapter
3 and for the low temperature hydrogenation (LTH) studies in batch reactor (Chapter 5),
as well as for the production of hydrogen and alkanes (Chapter 5). The 2nd
kind of bio-oil
used in our studies is Pine Wood Bio-oil (PWBO). It was obtained from Mississippi State
University. PWBO was used for the bio-oil stability studies (Chapter 4), for the low
temperature hydrogenation studies in flow reactor (Chapter 6), for the 2-stage
hydrogenation in flow reactor (Chapter 6), and its aqueous fraction was used for the
integrated hydroprocessing and zeolite upgrading studies (Chapter 7). The 3rd
kind of bio-
oil used in our studies was supplied by the US Department of Energy and was
manufactured by National Renewable Energy Laboratory, Golden, Colorado using the
Thermochemical Process Development Unit from white oak pellets. It is called DOE-BO
in this thesis. We used the aqueous fraction of DOE-BO for some of the 2-stage
hydrogenation studies in the flow reactor (Chapter 6), and for the whole bio-oil studies in
the integrated hydroprocessing and zeolite upgrading (Chapter 7). All of the bio-oils were
stored in the refrigerator to minimize ageing.
Page 27
8
2.2 Elemental Analysis, Ash Content, Viscometry, Accelerated Stability Testing,
Water Analysis, TAN Measurement, Catalyst Characterization and TOC
Analysis
Elemental analysis (C, H and O) of the bio-oil and its various fractions was done
at either Schwarzkopf Microanalytical Laboratory, Woodside, NY or at Galbraith
Laboratories, Knoxville, TN. Ash content of the bio-oil samples was found by heating
about 1 gm of sample in a muffle furnace in the presence of air at 600-750 °C for 6 hours.
The temperature was raised in stages so as to prevent the excessive boiling of bio-oil. The
amount of ash remained was measured at the end of the run. The viscosity of the OWBO
and its various fractions was measured in a capillary glass viscometer (from Cannon
Instrument Company). Viscosity measurement of the water insoluble bio-oil (WIBO) was
carried out in a TA instrument, AR2000 using a concentric cylinders geometry. All the
viscosity measurements were done at 25 C. Viscosity measurements for the accelerated
stability tests were carried out by Prof. Bhatia’s group at University of Massachusetts,
Amherst. For the accelerated stability test, bio-oil is stored in an oven at 90 °C. Samples
of this bio-oil are taken at various times. The bio-oil is allowed to cool down and the
viscosity is measured at 40 °C at different shear rates. The data is reported in the form of
a viscosity vs. incubation time graph. For viscous bio-oil samples, ARES G2 viscometer
with 40 mm parallel plate geometry was used with a solvent trap. For diluted samples,
rheometer AR2000 with concentric cylinder geometry was used. All the measurements
followed the standard procedure, equilibrium for 10 minutes at desired temperature and
then steady state flow test at shear rates 0.001-10 s-1
. Water content of the bio-oil was
Page 28
9
determined using a Mettler-Toledo volumetric Karl-Fischer titrator V20. Total Acid
Number (TAN) of the bio-oil was determined by titrating bio-oil solution in methanol
with KOH solution in methanol of known concentration. Catalysts were characterized by
hydrogen chemisorption in a Quantachrome Autosorb 1C. The liquid samples were
analyzed for the carbon content by a Shimadzu 5000A Total Organic Carbon (TOC)
analyzer. The aqueous samples were further diluted by distilled water to the
concentration below 1000 ppm carbon for the TOC analysis. The TOC analyzer was
standardized by sorbitol or potassium hydrogen phthalate solutions of known carbon
concentrations.
2.3 Thermogravimetric Analysis
Thermogravimetric analysis (TGA) experiments were carried out with a SDT
Q600 TGA system (TA Instruments). Ultra-high-purity helium (Airgas Company) was
used as the sweep gas with a flow rate of 100 cm3 min
-1. Approximately 15 mg of sample
was loaded into an aluminum pan. An aluminum cap was placed on the sample crucible
to avoid any vaporization of sample prior to starting the temperature ramp. The
temperature of the sample was programmed from room temperature to 700 °C at 1.5 °C
min-1
, followed by an isothermal period of 30 min at 700 °C.
2.4 Gel Permeation Chromatography
Gel Permeation Chromatography (GPC) experiments were carried out on a
Shimadzu HPLC system with an UV detector (frequency 254 nm). Varian MesoPore
Page 29
10
column (Part No. 1113-6325) was used with stabilized tetrahydrofuran (THF) as mobile
phase flowing at 0.5 cm3 min
-1. Samples for GPC were prepared by dissolving bio-oil in
THF at 1 wt% concentration. The bio-oil solution in THF was then filtered with 0.45 µm
filter and used for GPC. The GPC column was standardized using polystyrene molecular
weight standards in the range of 162 to 38640 Da. Hence the molecular weight of bio-oil
as determined by GPC will be polystyrene equivalent molecular weight.
2.5 Bio-oil Extraction and Pre-treatment
Bio-oil was mixed with distilled water to separate into two phases: an aqueous
rich phase (WSBO: water soluble fraction of bio-oil) and an organic rich phase (WIBO:
water insoluble fraction of bio-oil). The mixture was then centrifuged in a Marathon 2100
centrifuge (Fisher Scientific) at 10,000 rpm for 30 minutes to ensure the phase separation.
The two phases, aqueous (top) and non-aqueous (bottom), were then separated by
decanting. The weight of the aqueous faction was measured to determine the amount of
bio-oil that dissolved in water. It was assumed that no externally added water would go
into WIBO during the extraction process. Bio-oil and water were mixed in 1:4 weight
ratio to get an aqueous solution with about 12-13 wt% water soluble bio-oil in water,
which is about 4-5 wt% carbon in water. This aqueous solution was used in the batch as
well as flow hydrogenation (single stage and 2-stage) experiments. The product of batch
hydrogenation was further diluted to about 2 wt% carbon in water. This solution was then
used as the feed for further aqueous phase processing experiments. Concentrated WSBO
solution was used in some of the 2-stage hydrogenation studies and it was made by
mixing bio-oil and water in 1:1 weight ratio. The resulting WSBO solution is about 38%
Page 30
11
WSBO in water. The WSBO and WIBO phases of a particular bio-oil was named
according to abbreviations used for those bio-oils. For example, water soluble fraction of
oak wood bio-oil (OWBO) is called WS-OWBO, whereas water insoluble fraction of
OWBO is called WI-OWBO. Similarly, water soluble fraction of DOE bio-oil (DOE-BO)
is called WS-DOE-BO and so on.
2.6 Low Temperature Hydrogenation (LTH) of the Aqueous Fraction of Bio-oil
2.6.1 Batch Reactor
The low temperature hydrogenation was carried out in batch as well as flow
reactor. In the case of batch reactor, about 80 ml of the aqueous fraction of the bio-oil
(with about 5 wt% carbon) was loaded in the reactor along with 3-4 gm (50 wt% moisture
content) of 5 wt% Ru / activated C catalyst (Strem Chemicals, Product No. 44-4059). The
reactor was then purged at least 4-5 times with helium gas to get rid of the air present in
the reaction vessel. The reactor was then purged with hydrogen at least 4-5 times to
replace all the helium with hydrogen. The reactor pressure was set to 700 psi by adding
hydrogen and the heating and stirring were started. Once the temperature reached the
desired value, the reactor pressure was increased to 1000 psi total by adding more
hydrogen. Additional hydrogen was added to the reactor during the course of reaction to
compensate for the hydrogen consumption. The total pressure was maintained at 1000
psi. Amount of hydrogen consumed during the reaction was calculated from the decrease
in pressure. Liquid samples were withdrawn during the run from the liquid sampling
tube. The liquid samples were filtered before analysis to remove the catalyst particles.
Page 31
12
Typical operating temperature and pressure were 175 °C and 1000 psi respectively. The
product and feed compositions were measured with a Shimadzu Gas Chromatograph
(GC) (model 2010) and a High Performance Liquid Chromatograph (HPLC). Flame
ionization detector (FID) was used on the GC to quantify all the reactants and products
except sugars, sugar alcohol and levoglucosan. The reactants and products were also
verified by GCMS. Restek Rtx-VMS (Catalog No. 19915) column was used with
constant column linear velocity of 31.3 cm s-1
. Ultra high purity helium was used as the
carrier gas. Injector and detector were both held at 240 C. The GC oven was
programmed with following temperature regime: Hold at 35 C for 5 min, ramp to 240
C at 10 C min-1
and hold at 240 C for 5 min. On HPLC, RI detector (held at 30 C)
was used to quantify sugars, sugar alcohol and levoglucosan in the feed and product of
batch hydrogenation. Bio-Rad’s Aminex HPX-87H column (Catalog No. 125-0140) was
used with distilled water as the mobile phase with the flow rate of 0.5 to 1 ml min-1
. The
column oven temperature was held constant at 30 C.
2.6.2 Flow Reactor
A gas and liquid down-flow reactor was built to study the hydrogenation of the
bio-oil. Typically a ¼” diameter and 1 foot long stainless steel tube was loaded with the 5
wt% Ru/C catalyst. Both the sides were plugged with glass wool to ensure that catalyst
bed stays at its place. No voids were left in the reactor tube to avoid any homogeneous
reactions. An empty reactor tube was used to study the homogeneous reactions. An High
Performance Liquid Chromatography (HPLC) pump (Eldex Lab Model 1SM) was used
Page 32
13
to pump the aqueous fraction of the bio-oil. A mass flow controller was used to maintain
the flow rate of hydrogen at 150 ml min-1
. The catalyst was reduced in-situ in flowing
hydrogen prior to the reaction with following temperature regime: Room temperature to
260 °C at 30 °C h-1
and then hold at 260 °C for 2 h. The Ru/C catalyst came in the wet
form, and was dried at 100 °C for 4 hour in an oven before loading in the reactor. The
liquid and gas phase products flow to a gas-liquid (G-L) separator. The gaseous products
continue to flow to a back pressure regulator which is used to maintain the pressure of the
entire reaction system. The gaseous products are collected in a gas bag and analyzed by
Gas Chromatograph-Flame Ionization Detector (GC-FID) and GC-Thermal Conductivity
Detector (GC-TCD). The G-L separator is drained periodically and the liquid sample is
analyzed offline by TOC analysis and by GC-FID, and HPLC as described in Section
2.6.1. The schematic of the reactor is shown in Figure 2-1. The steady state is achieved in
the reactor within 4-6 h and at least 3 samples were collected to ensure that the steady
state is achieved. The feed line can be heated to up to 60 °C if required.
Page 33
14
Figure 2-1 Schematic of the single stage flow reactor system used for the hydrogenation
2.7 Aqueous Phase Processing
The batch hydrogenated aqueous fraction of the bio-oil was diluted by the
addition of distilled water to about 2 wt% carbon in water. This diluted product was used
as the feed for the further liquid phase processing. The hydrogenation of the aqueous
fraction of bio-oil was carried out at 175 °C and 1000 psi total pressure for 3 hours in a
batch reactor as described earlier. A ¼” or ½” stainless steel tube was packed with the
reforming or dehydration/hydrogenation catalyst with glass wool plugs on both the sides.
Page 34
15
The catalyst used for reforming was 1 wt% Pt/Al2O3, and was obtained from the UOP
research center (Product No. 4761-137). The dehydration/hydrogenation catalyst was 4
wt% Pt/SiO2-Al2O3 and was prepared by the insipient wetness method. The appropriate
amount of the solution of tetraammineplatinum (II) nitrate (Strem Chemicals, Product
No. 78-2010) in distilled water was added drop wise to the silica-alumina powder (SiO2
to Al2O3 ratio = 4, Davison SIAL 3125) with continuous mixing. The wet catalyst was
then dried in an oven at 80 C for 7-8 h. The catalyst was then calcined in air flowing at
300 ml min-1
. The temperature regime for calcining was: room temperature to 260 C in 3
h, then hold at 260 C for 2 h. Both the catalysts (Pt/Al2O3 and Pt/SiO2-Al2O3) were
reduced in the flow reactor with hydrogen flowing from the bottom at 200 ml min-1
. The
temperature regime used for reduction of Pt/SiO2-Al2O3 catalyst was: room temperature
to 450 C at 50 C h-1
, then hold at 450 °C for 2 h. The temperature regime used for
reducing Pt/Al2O3 catalyst was: room temperature to 260 C at 30 C h-1
, then hold at 260
C for 2 h.
The reactor tube was heated by a Lindberg (type 54032) furnace. The liquid feed
was fed to the reactor from the bottom (i.e. up-flow mode) with the help of a JASCO
PU980 HPLC pump. A gas-liquid separator was employed after the reactor tube. Helium
was supplied from top as the carrier gas at the flow rates from 30 ml min-1
to 60 ml min-1
.
The gaseous products from the reactor (and helium carrier gas) flow through a back
pressure regulator, used to maintain the pressure of the reaction system. External
hydrogen, required for catalyst reduction or for the reaction was supplied from the bottom
Page 35
16
of the reactor (flow rate: ~100 ml min-1
) and no carrier gas was used in such a case. The
gaseous products were further analyzed by two online gas chromatographs (HP 5890
series II). Permanent gases in the gaseous product (CO2 and H2) were analyzed by a
Thermal Conductivity Detector (TCD). Alltech HAYESEP DB 100/120 packed column
(Part no. 2836PC) was used with the oven temperature held constant at 75 C. The TCD
and the injection port were held at 160 C and 120 C respectively. The column flow rate
was 1 ml min-1
with helium carrier gas. Alkanes in the gaseous product were analyzed on
a FID with Alltech AT-Q capillary column (Part no. 13950). Helium was used as the
carrier gas with the column flow rate of 1 ml min-1
. The injection port and the detector
were both held at 200 C. Following GC oven temperature regime was used: Hold at 40
C for 6 min, ramp to 180 C at 5 C min-1
and hold at 180 C for 25 min. Carbon
selectivity to a particular alkane was calculated by dividing the carbon moles in that
particular alkane by total carbon moles in all of the alkanes. For a particular catalyst
loaded in the reactor, liquid feed was started at time t = 0. Steady state was usually
reached within 8 hours. At least 3 gas samples were analyzed to ensure the steady state.
Liquid product accumulated in the gas-liquid separator was drained then. Liquid product
was analyzed for the carbon content. Reactions parameters were then changed for further
studies. Time on stream for a particular catalyst from the start of reaction (t = 0) was
noted for each sample and was denoted by Time On Stream (TOS) for that catalyst.
Page 36
17
2.8 Two Stage Hydrogenation of Water Soluble Bio-oil
For the two stage hydrogenation a 2nd
tubular reactor (30 cm length, 6.35 mm
outer diameter) was added in series after the first (low temperature) hydrogenation
reactor with all of the other reaction system remaining the same as single stage
operation. Dry 5 wt% Pt/C (Strem Chemicals Product No. 78-1509) was as the catalyst
used in this reactor and the catalyst was reduced in-situ prior to the reaction with the
same temperature regime as that used for Ru/C catalyst. Pt/C catalyst was also dried in an
oven at 100 °C for 4 hours before loading in the reactor. Same amount of catalyst was
loaded in both the reactors. Pressure was 1450 psi typically foe both reactors and the low
temperature hydrogenation step was operated at 125 °C. Various temperatures were
studied for the 2nd
high temperature stage. While operating with 2 reactors, the first
reactor was heated using a heating tape and the second reactor was heated using the
tubular furnace. A type K thermocouple was placed next to the reactor wall and reactor
temperature was controlled at 125 °C using an Omega temperature controller. The
products were analyzed by TOC, GC-FID, and HPLC as described in previous sections.
2.9 Zeolite Upgrading of Bio-oil, Water Soluble Bio-oil and Hydrogenated Water
Soluble Bio-oil
The zeolite upgrading was done using H-ZSM-5 catalyst obtained from Zeolyst
(CBV 3024E, SiO2/Al2O3 = 30). All the pure compounds used in the zeolite upgrading
were > 99% pure (from Fisher Scientific) and were used without further purification.
Prior to loading in the reactor, the ZSM-5 catalyst was sieved to 425-800 µm size. A
Page 37
18
quartz tube (1.27 cm outer diameter) was packed with a quartz wool plug. Quartz beads
(700 mg, 250-425 µm particle size) were placed on the quartz wool plug to act as a
catalyst bed support. The sieved ZSM-5 catalyst (26 mg typically) was then loaded in the
reactor. The catalyst was then calcined in situ in flowing air (60 ml min-1
, dehumidified
by passing through a drierite tube) at 600 °C for 6 hours. The reactor temperature was
measured using a type K thermocouple inserted into the catalyst bed. Reactor tube was
heated using a Lindberg tubular furnace and temperature was controlled using an Omega
temperature controller. Once the calcination was complete, helium carrier gas flow was
started over the catalyst at 204 ml min-1
. The catalyst was maintained at reaction
temperature. All the experiments were carried out at atmospheric pressure and no
significant pressure drop was observed across the catalyst bed. The liquid feed was then
started at 2.7 ml hour-1
for WSBO, low temperature hydrogenated WSBO and high
temperature hydrogenated WSBO which corresponds to the WHSV of 11.7 hour-1
on the
bio-oil content basis (excluding the added water). The liquid feed rate of 0.34 ml hour-1
(0.06 ml hour-1
for furan) was used for DOE-BO and low temperature hydrogenated
DOE-BO, which corresponds to the WHSV of 11.7 hour-1
(1.97 hour-1
for furan). Liquid
was pumped using a syringe pump (KD Scientific, Model No. 780100). For pure
compounds (except furan), 12.5 wt% solution in water was used as feed. This is to keep
the partial pressure of water the same for pure compounds and WSBO (and its
hydrogenated products). Pure furan was used as feed as it is water insoluble.
The reactor effluent is carried by the helium carrier gas to an ice-water cooled
condenser where heavy products are condensed. The effluent gas was then collected in a
Page 38
19
gas bag. The heavy products in the condenser were collected by washing the condenser
with 10 cm3 of ethanol. Liquid product was analyzed by an Agilent 7890A GC-FID
system with an Agilent capillary column (Catalog No. 19091J-413). Helium was used as
carrier gas with the FID detector maintained at 250 °C. Following column temperature
regime was used: hold at 40 °C for 5 min, ramp to 250 °C at 20 °C min-1
, and hold at 250
°C for 20 min. The gaseous product was analyzed using a Shimadzu 2014 GC system.
Restek Rtx-VMS capillary column (Catalog No. 19915) was used to quantify aromatic
hydrocarbons (with FID detector) and HAYSEP D packed column from Supelco was
used to analyze CO and CO2 (with TCD detector). Both FID and TCD detectors were
maintained at 240 °C. Helium was used as the carrier gas. Following column temperature
regime was used with both the columns: hold at 35 °C for 5 min, ramp to 140 °C at 5 °C
min-1
, ramp to 230 °C at 50 °C min-1
and hold at 230 °C for 8.2 min. The coke yield was
measured by burning the coke and measuring the amount of CO2 produced. After the
reaction is complete, dry air (60 cm3 min
-1) was flown over the spent catalyst (600 °C) for
2 hours to burn off the coke formed during the reaction. The resulting effluent gas was
then passed in series through a copper converter (to convert CO to CO2), a moisture trap
and a CO2 trap. Copper converter (Sigma Aldrich, Part No. 417971) contained 13 wt%
CuO on alumina catalyst and was operated at 250 °C. The coke yield was determined
from the difference in the mass of the fresh and spent CO2 adsorbent.
2.10 Bio-oil Microfiltration and Nanofiltration
Membralox® TI-70 microfiltration membranes with nominal pore sizes of 0.5 µm
and 0.8 µm were obtained from Pall Fluid Dynamics, Deland FL. These tubular
Page 39
20
membranes were 25 cm in length with an outer diameter of 10mm and an inner diameter
of 7 mm. Each membrane consists of a filtering layer which is about 10–15 µm thick.
The filtering layer is supported by two layers; an under layer with an approximate pore
size of 10 µm and the macroporous support layer.(36, 37)
The total surface area available
for filtration was 98.55 cm2. The microfiltration experiments were conducted by placing
the membrane in a stainless steel housing (part # S700-00141) also obtained from PALL
Fluid Dynamics. Rubber O-rings, metal and Teflon gaskets and stainless steel screws
were used at both ends to secure the membrane inside the holder. The DOE bio-oil was
used for these studies. Methanol, sodium hydroxide and acetic acid all of purity > 99%
(from Fischer Scientific) were used for cleaning the membrane. Figure 2-2 shows the
schematic of the microfiltration permeation setup. The fluid was pumped into the tube
side of the membrane using a positive displacement gear pump obtained from Cole
Parmer. The pressure differential across the membrane was measured using a pressure
gauge at the inlet side of the module. Since the outlet was at atmospheric pressure the
gauge reading directly provided the pressure difference for the permeation experiment.
Stainless steel tubing of 1/4 in. diameter was used at the inlet and the outlet tubing
diameter was reduced to 1/8 in. A needle valve was used at the outlet to control the trans-
membrane pressure. All experiments were conducted in the cross-flow mode to reduce
the fouling effects. The retentate flow was kept at nearly 90% of the total feed flow for
both water and bio-oil permeation experiments. The retentate was collected and recycled
back to the feed tank. The water permeation experiments were conducted at room
temperature. However, due to the high viscosity of bio-oil, microfiltration of bio-oil was
carried out at elevated temperatures near 40 °C; more precisely, temperature was
Page 40
21
maintained within in the range of 38–45 °C during the course of an experiment. For this
purpose the bio-oil feed tank was placed on a heating mantle with a magnetic stirrer. The
feed and retentate temperatures were monitored by using thermocouples placed at the two
ends. To maintain the temperature across the module a heating tape covered with an
insulation tape was wrapped around the tubing and the membrane housing. The same
experimental set-up was used for bio-oil nanofiltration. The membranes with an
additional 5 nm or 10 nm pore size filtering layer were used.
Figure 2-2 Schematic of the bio-oil microfiltration process
Page 41
22
CHAPTER 3
CHARACTERIZATION OF BIO-OIL
3.1 Introduction
It is important to characterize the bio-oil that is used in the studies as every bio-oil
has different composition depending on its biomass source and the pyrolysis conditions
used. We have used various characterization techniques to characterize the bio-oil.
Physical characterization was done by the viscosity and solubility measurements. GC-MS
was used to identify the components. GC-MS, GC-FID and HPLC were used for the
quantification of the components.
A large part of bio-oil literature is devoted to its characterization. Typical bio-oil
properties are shown in Table 3-1 with comparison to heavy fuel oil.(7)
Bio-oil has low
heating value due to its high oxygen and moisture content. Bio-oil has acidic pH. It is
thermally unstable and leaves up to 50 wt% residue upon distillation. Peacocke et al.
gives a detailed documentation of the physical properties of the bio-oil.(38)
Chemically
bio-oil is a complex mixture of various components. Not all of the bio-oil constituents are
identifiable by common analytical techniques such as GC and HPLC. Typical important
fractions of bio-oil are shown in Figure 3-1.(10)
Only about 30-40% of the bio-oil is said
to be quantifiable by GC.(10, 39)
Another 15% can be identified by HPLC.(10)
Bio-oil
contains high molecular weight lignin up to 30-35 wt% which is difficult to analyze by
GC.
Page 42
23
Table 3-1 Typical physical properties of bio-oil and heavy fuel oil*
Physical Property Bio-oil Heavy fuel oil
Moisture content (wt%) 15-30 0.1
pH 2.5 -
Specific gravity (gm ml-1
) 1.2 0.94
Elemental composition (wt%)
Carbon
Hydrogen
Oxygen
Nitrogen
Ash (wt%)
HHV (MJ/kg)
54-58
5.5-7.0
35-40
0-0.2
0-0.2
16-19
85
11
1.0
0.3
0.1
40
Viscosity (cP) at 50 °C 40-100 180
Solids (wt%)
Distillation residue (wt%)
0.2-1.0
up to 50
1
1
*Data taken from reference (7)
Figure 3-1 Bio-oil fractions classification. Data taken from reference (10)
The solubility of bio-oil in various solvents varies. It is almost completely
miscible with solvents such as methanol, iso-propanol and acetone. Sipila et al. describes
a bio-oil characterization technique where they extract three different bio-oils in water.(40)
Page 43
24
The aqueous fraction is then extracted in diethyl ether. The water solubility of various
bio-oils was found to be in the range of 60-80 wt%, whereas ether solubility was in the
range of 40-60 wt%. The ether insoluble fraction mainly consisted of polysaccharides
that are present in the water soluble fraction.
3.2 Experimental
The experimental methods and materials used for this work are described in
Sections 2.1, 2.2, 2.4, and 2.5.
3.3 Elemental Analysis
Elemental analysis of the OWBO was found to be 47.0 wt% carbon, 8.2 wt%
hydrogen and the rest oxygen. Nitrogen was not detected. The oxygen content of 44.8
wt% is higher as compared to other bio-oils. Typical bio-oil oxygen content is in the
range of 35 to 40 wt%.(41)
In addition to carbon, oxygen and hydrogen, nitrogen (0 to 0.2
wt%) can be present in the bio-oil.(7)
Mineral components of the biomass (including
potassium, sodium, calcium and magnesium) also end up in the bio-oil in trace
quantities.(10)
Typical ash content of bio-oils is 0-0.2 wt%.(7)
The ash content of OWBO
was 0.3 wt%.
3.4 Solubility Studies and Chemical Composition
Upgrading of the bio-oil without using any solvent is preferred if possible.
However, this route has many problems such as high viscosity and thermal instability of
Page 44
25
bio-oil, clogging of reactors, considerable coking, and catalyst deactivation due to
coking. Bio-oil can be dissolved in a suitable solvent and then treated for upgrading to
help ease these problems. The oak wood bio-oil (OWBO) used in this study was found to
be almost completely miscible in methanol, iso-propanol and acetone with small amounts
of solid residue. About 14 wt% of the bio-oil was found to be soluble in toluene, which is
a gasoline like solvent. Solubility of this bio-oil in diesel fuel was about 4 wt%. The
solubility were measured by mixing bio-oil and solvent in a 1:1 w/w ratio at room
temperature and the two layers formed were separated by decanting after centrifugation.
Toluene and diesel fuel fractions were found to be consisting of guaiacol and its
derivatives. Low solubility of bio-oil in toluene and diesel fuel signifies its
incompatibility with conventional liquid transportation fuels. An ideal solvent for
hydroprocessing of the bio-oil should dissolve a considerable fraction of bio-oil and
should be inert to hydrogenation. Alcohols such as methanol and iso-propanol are not
inert to the hydrogenation. Whereas gasoline or diesel fuel range saturated liquid alkane
are relatively unreactive during hydrogenation, but are incompatible with the bio-oil.
Two phases form, when OWBO is mixed with water at water to bio-oil weight
ratio of greater than 1 to 4. About 60 to 65 wt% of the OWBO is soluble in water
irrespective of the amount of water added. The two phases can be separated by
centrifuging and then decanting. Water is inert for hydrogenation. Furthermore, a
significant fraction of the bio-oil is water soluble, making water an ideal solvent for the
hydroprocessing of bio-oil. The elemental balance for mixing OWBO with water is
shown in Figure 3-2 for water to bio-oil weight mixture of 1:1. As can be seen in this
Page 45
26
figure the WS-OWBO has higher oxygen content than the WI-OWBO. About 62 wt% of
the original bio-oil is in the aqueous phase. This also includes water that was present in
the bio-oil. Our findings are similar to those of Sipila et al., where 60 wt% of the bio-oil
(made from mixed maple and oak wood) was found to be water soluble.(40)
Figure 3-2 Extraction of oak wood bio-oil in water
The WSBO was analyzed with GC-MS, GC-FID, HPLC and TOC as shown in
Figure 3-3. The major components of the aqueous fraction are levoglucosan > sugars
(glucose + xylose) > acetic acid > hydroxyacetone > furfural + 2-furanone > guaiacols >
hydroxyacetaldehyde. We were only able to identify 60% of the carbon in the aqueous
fraction of the bio-oil with our methods used in this study. This did however help us in
understanding some of the bio-oil conversion reactions.
Page 46
27
Figure 3-3 Identification of the major components of water soluble fraction of oak wood
bio-oil. The aqueous fraction was made by mixing 9 gm of oak wood bio-oil with 80 gm
water.
The rest of the carbon is probably present in the form of compounds like formic
acid, various furans, and higher molecular weight sugars (e.g. cellobioses and trioses).
The column used in HPLC can separate sugar, sugar alcohols and anhydrosugars. This
column cannot separate various sugars from each other. A broad peak was observed for
sugars in HPLC. Various sugars may be present including glucose, xylose, fructose,
mannose and galactose. Piskorz et al. have identified hydroxyacetaldehyde up to 10 wt%
in the bio-oil.(42)
We found that only 1.5% of the carbon in WSBO was from
hydroxyacetaldehyde. Formic acid could not be observed in our solution due to the large
amounts of water we used and hence is not quantified here. High molecular weight
degradation products of pentoses, hexoses are also present in the bio-oil(10)
and were not
detected by our analytical methods. Cellobiosan is known to be present in the bio-oil in a
significant amount.(40, 43)
Luo et al. have identified phenolic compounds (phenol and its
alkyl derivatives) up to 20 wt% in the bio-oil made from P. indicus.(44)
Phenol and its
6.51.4
8.81.5
18.2
18.84.8
40
Hydroxyacetone
Hydroxyacetaldehyde
Acetic Acid
Guaiacols
Sugars
Levoglucosan
Furfural + 2-Furanone
Unidentified
Page 47
28
alkyl derivatives were also not detected in significant amounts in the bio-oil we used for
this study.
The composition of the bio-oil, the storage conditions and storage time are the
factors affecting the bio-oil phase separation. Some bio-oils can phase separate during the
storage without the addition of external water. The extent of separation of bio-oil in the
two phases can also depend on the method of addition of water to it.(40)
The oak wood
bio-oil used in our studies phase separates upon addition of small amount of water. The
minimum water to bio-oil ratio required for phase separation was 1:4 (weight ratio). The
amount of bio-oil extracted in water was independent of the amount of water added as
long as water to bio-oil ratio was above 1:4. This ensures that concentrated aqueous
solutions of water soluble bio-oil can be used in our process. However, dilute WSBO
solutions were used in our studies primarily because of the lack of large amounts of bio-
oil.
The composition of pine wood bio-oil (PWBO), DOE bio-oil and their water
soluble fractions will be presented in the later part of the thesis wherever relevant.
3.5 Viscosity Measurements
The various bio-oil fractions have a wide range of viscosities, which are probably
due to both intramolecular and intermolecular interactions. Bio-oils are also known to
undergo viscosity changes during ageing and bio-oil upgrading.(21, 30)
Table 3-2 shows the
viscosity of bio-oil, bio-oil mixtures and bio-oil fractions prior to upgrading. The oak
Page 48
29
wood bio-oil used in our studies was found to have the viscosity of 153 cP at 25 C.
Typical viscosity values of the bio-oil reported in the literature depicts an order of
magnitude variation. According to Bridgwater et al. the viscosity of bio-oils ranges from
30 to 200 cP at 40 C.(9)
The viscosity can be as high as 1000 cP at 40 C depending on
the feedstock and process conditions.(7)
The viscosity of the bio-oil decreases
exponentially upon addition of small amount of solvents. As shown in Table 3-2 addition
of 20 wt% of methanol to bio-oil results in an order of magnitude decrease in the
viscosity.
Table 3-2 Viscosity of the oak wood bio-oil and
its fractions
Viscositya (cP)
Oak Wood Bio-oil (OWBO) 153
80wt% OWBO in methanol 17.1
50wt% OWBO in methanol 2.93
20wt% OWBO in methanol 1.01
Water insoluble OWBOb 50000
80wt% water insoluble
OWBO in methanol
95.1
50wt% water insoluble
OWBO in methanol
5.1
20wt% water insoluble
OWBO in methanol
1.04
Water soluble OWBO
solutionc
1.65
aAll the viscosity measurements are done in a capillary glass
viscometer (except for water insoluble bio-oil) at 25 C b
TA instrument AR2000 used with concentric cylinders geometry
cSolution was 50 wt% water soluble oak wood bio-oil in water
Page 49
30
The water insoluble bio-oil from OWBO is highly viscous sticky brown liquid
with the viscosity of more than 50000 cP. Its viscosity also decreases exponentially upon
addition of methanol. The phenolic compounds originating from lignin are present in the
bio-oil as both monomeric and oligomeric compounds.(10)
These phenolic compounds are
present in significantly higher concentrations in the WIBO than in the WSBO. These high
molecular weight oligomers can form a network due to intermolecular interactions
resulting in high viscosity of the bio-oil. A rheological study of bio-oil obtained from the
soft wood bark residue indicates the existence of self-aggregating intermolecular
interactions forming long-range network structures.(45)
These interactions will be stronger
in the water insoluble bio-oil due to its concentrated nature, explaining the very high
viscosity observed for it. Addition of methanol to bio-oil or WIBO results in disrupting of
the intermolecular network due to solvation, significantly reducing the viscosity.
Some of the bio-oils that we used were further characterized for their instability
by accelerated stability test followed by measurement of viscosity and molecular weight
distribution by GPC. That characterization will be presented in Chapter 4.
3.6 Gel Permeation Chromatography
Only a fraction of carbon in bio-oil is detectable using analysis techniques such as
gas chromatography and liquid chromatography. The GC and HPLC undetectable carbon
in bio-oil is present in the form of lignin and sugar oligomers. Gel permeation
chromatography (GPC) can be used to determine the molecular weight distribution of
bio-oil. Figure 3-4 depicts the GPC chromatographs of DOE bio-oil and its aqueous and
Page 50
31
organic (water insoluble) fractions. It can be seen that bio-oil contains oligomers with
molecular weight up to 6000. The concentration of oligomers is higher in water insoluble
fraction as these oligomers are mostly derived from lignin and hence are water insoluble.
Some of the highly functionalized oligomers can be water soluble and hence water
soluble bio-oil also shows the presence of oligomers with molecular weight up to 1000,
although at considerably less concentration than bio-oil and water insoluble bio-oil.
Figure 3-4 Gel permeation chromatographs of DOE bio-oil, water soluble DOE bio-
oil (WS-DOE-BO) and water insolubel DOE bio-oil (WI-DOE-BO)
3.7 Conclusion
Bio-oil is a complex mixture of oxygenated hydrocarbons of various
functionalities including aldehydes, ketones, acids, sugars and anhydro-sugars. Only
about 35-40% carbon in bio-oil is detectable by GC and HPLC and is present in C2 to C6
0.0E+0
5.0E+5
1.0E+6
1.5E+6
2.0E+6
2.5E+6
3.0E+6
1 10 100 1000 10000 100000
Inte
nsi
ty (
mV
)
Molecular Weight (Da)
DOE-BO WI-DOE-BO WS-DOE-BO
Page 51
32
oxygenated hydrocarbons. Bio-oil is highly soluble in water. With water being ideal
solvent for hydroprocessing, water soluble bio-oil would be an ideal candidate for
hydroprocessing to produce valuable fuels and chemicals. Only about 10-15% carbon is
detectable in water insoluble bio-oil and is present mostly in the form of guaiacols and its
derivatives. The rest of the carbon as ensured by gel permeation chromatography is
present in the form of high molecular weight oligomers. Hence along with GC and
HLPL, GPC should be a core bio-oil analysis technique as it enables us to see the GC and
HPLC undetectable carbon in bio-oil. The aqueous fraction of bio-oil also contain high
molecular weight oligomers with molecular weight up to 1000, but at low concentration
compared to that in bio-oil and in water insoluble bio-oil.
Bio-oil contains a wide variety of compounds and it would be challenging
although crucial to convert it to valuable fuels and/or chemicals with high selectivity so
as to reduce downstream processing costs such as separation cost. Another important
finding is that the water soluble bio-oil and water insoluble bio-oil have significant
physical and chemical differences. Hence different processing techniques might be
required to convert water soluble and water insoluble fractions of bio-oil to tangible fuels
and chemicals.
Page 52
33
CHAPTER 4
STABILIZATION OF BIO-OIL
4.1 Introduction
Bio-oil stability is of importance for its transport, storage and further processing.
Bio-oil is a complex mixture of compounds which is not at equilibrium due to the rapid
quenching in pyrolysis process. Due to this, the mixture changes chemically and
physically towards the equilibrium during the storage.(21)
Different theories have been proposed to explain the causes of the instability of
bio-oils. Proposed mechanisms include agglomeration of char and reactions of
unsaturated or reactive chemicals, such as polymerization, esterification, acetalization,
oxidization, dimerization, etc.(46-48)
The minerals can also concentrate in the chars and
catalyze the aging reactions.(21, 22, 49)
Char particles also may attract low polarity
molecules on to their surface and work as condensation nuclei.(22, 23)
Czernik et al.
reported the evidence of esterification and etherification as the mechanisms for
condensation of bio-oils.(7)
Diebold proposed that the acids could work as catalysts by
accelerating the polymerization reactions within bio-oil compound.(21, 49)
Fratini et al.
reported that the condensation and polymerization of lignin in bio-oils could cause
viscosity increase and phase separation.(50)
The change in viscosity of bio-oil over time can be a direct measure of bio-oil
stability. The viscosity of the bio-oil increase over time and this can be related to the
Page 53
34
molecular weight increase if volatiles are not allowed to escape during the storage.(49)
Thus viscosity indirectly is a measure of polymerization reactions taking place in bio-oil.
Water content of the bio-oil also typically increases with time due to the formation of
water in condensation polymerization reactions that occur within bio-oil. The rate of
viscosity increase is proportional to the storage temperature of bio-oil. Typical bio-oil
stability studies are hence done at elevated temperatures such as 60-90 °C. Czernik et al.
incubated the oak wood bio-oil at 90 °C and measured its viscosity, water content and
apparent weight average molecular weight (Mw) with time.(51)
The data is tabulated in
Table 4-1. The authors also show that there exists a linear correspondence between
weight average molecular weight and viscosity of bio-oil.
Table 4-1 Viscosity, water content and weight average molecular weight changes in oak wood
bio-oil at 90 °C
Time (days)
at 90 °C
Water Content
(wt%)
Time (h)
at 90 °C
Viscosity (cP)
at 40 °C
Mw
0
7
16.2
16.2
0
1
144
152
530
560
17
28
56
84
16.6
17.3
17.5
17.7
2
4.5
8
15
167
210
286
326
600
690
790
860
Data taken from reference (51)
Diebold has compiled the viscosity versus time data for four different kinds of
bio-oil in his report.(21)
He plotted the rate of viscosity increase versus the inverse of
storage temperature and found a linear Arrhenius like correlation. This indicates towards
the chemical reactions as the reason for the viscosity increase in bio-oils. Following are
the major reactions that can occur within the bio-oil:(21)
Page 54
35
Organic acids + alcohols → esters + water.
Organic acids + olefins → esters.
Aldehydes + water → hydrates.
Aldehydes + alcohols → hemiacetals + acetals + water.
Aldehydes → oligomers + resins.
Aldehydes + phenolics → resins + water.
Unsaturated compounds → polyolefins.
Not much literature is available on the actual chemical changes taking place within the
bio-oil. Diebold reports that the amount of hydroxyacetaldehyde, propenal (acrolein), 2-
methoxy-4-propenylphenol, and 5-methylfurfural in bio-oil quickly decreases during
ageing at 90 °C.(21)
In this study, we treated the bio-oils using filtration, water extraction, solvent
extraction and hydrogenation to test the effects of chars, acids, unsaturated chemicals,
and lignin on the rate of viscosity increase in pyrolysis oils.
4.2 Material and Methods
The experimental procedure and materials used in this study are described in
Sections 2.1, 2.2, 2.10, and 2.11.
Page 55
36
4.3 Stability Analysis of Bio-oil and its Fractions
To establish the base case for the stability of bio-oil, pine wood bio-oil (PWBO)
was incubated in a tightly sealed container in an oven at 90 °C. Samples were withdrawn
at various times and the viscosity was measured at 40 °C at the shear rates of 1 s-1
and 10
s-1
. The results of this study are shown in the Figure 4-1. The viscosity of the bio-oil
increases upon incubation at 90 °C. The viscosity increase with the incubation time is
exponential in nature. The viscosity increase can be more prominently observed at low
shear rate than high. The data for viscosity increase at the shear rate of 10 s-1
can be fitted
with a straight line as shown in Figure 4-1. The initial viscosity of the PWBO is about
0.078 Pa-s (78 cP). The rate of viscosity increase for incubation time less than 250 h is
about 0.0026 Pa-s h-1
, which is about 3 % h-1
. We saw an order of magnitude increase in
viscosity within 250 h. The reason for the viscosity increase can be the polymerization
reactions taking place in the bio-oil when stored at high temperature. The polymerization
may or may not be catalyzed by char and/or acids in bio-oil.
Figure 4-1 Viscosity of pine wood bio-oil versus incubation time at 90 °C.
0
0.2
0.4
0.6
0.8
0 50 100 150 200 250
Vis
co
sit
y (
Pa
.s)
Time (Hours)
Page 56
37
The stability of aqueous and non-aqueous phases of the PWBO was also studied.
The accelerated stability data for the Water Insoluble PWBO (WI-PWBO) is shown in
Figure 4-2. The WI-PWBO was incubated at 90 °C only for about 32 h. The initial
viscosity of the water insoluble fraction is about 1.4 Pa-s which is about 20 times of the
viscosity of whole bio-oil. The WI-PWBO shows an exponential rise in viscosity when
incubated at high temperature. Averaging over the two shear rates, there is about 25%
increase in viscosity of WI-PWBO over the incubation time of 32 h.
Figure 4-2 Viscosity of Water Insoluble – Pine Wood Bio-oil versus incubation time at
90 °C.
The accelerated stability test data for the aqueous fraction of the PWBO (WS-
PWBO) is shown in Figure 4-3. The aqueous fraction was made by mixing 75 gm of
PWBO with 60 gm of water and the two layers are separated by decanting after
centrifugation. The resulting aqueous fraction was about 39.5 wt% WS-PWBO in water.
The viscosity increase upon incubation at 90°C is apparent for WS-PWBO only at low
shear rate of 1 s-1
as seen in Figure 4-3. The viscosity of WS-PWBO almost doubles in
about a day upon incubation. The viscosity rise is linear for the time period studied as
1.4
1.5
1.6
1.7
1.8
1.9
2
0 10 20 30 40
Vis
co
sit
y (
Pa
.s)
Time (Hours)
Page 57
38
opposed to PWBO and WI-PWBO which show an exponential rise in viscosity as seen
earlier. The aqueous fraction of the bio-oil do not contain any char particles as all the
char particles tend to go in water insoluble part upon centrifugation. This implies that the
polymerization reactions that cause the viscosity increase in various bio-oil fractions can
proceed even in the absence of the char particle. The rate of viscosity increase is lower
for the WS-PWBO as compared to that for PWBO and WI-PWBO. This can be due the
diluted nature of the WS-PWBO.
Figure 4-3 Viscosity of water soluble pine wood bio-oil versus incubation time at 90 °C.
The aqueous fraction of the Pine wood bio-oil (WS-PWBO) discussed in above
study was hydrogenated in the Parr batch reactor at 125 °C and 1000 psi for 4 hours with
5 wt% Ru/C catalyst. Upon hydrogenation all the thermally unstable functionalities
(aldehydes, ketones, sugars) in the WS-PWBO are converted to corresponding alcohols.
Acetic acid is resilient to the hydrogenation at the reaction conditions we used. The
Unhydrogenated Aqueous Fraction of PWBO (39.6%)
vs. Time
y = 3E-05x + 0.002
R2 = 0.7471
y = 0.0002x + 0.0047
R2 = 0.9903
0
0.002
0.004
0.006
0.008
0.01
0.012
0.014
0 10 20 30
Time (Hours)
Vis
co
sit
y (
Pa.s
)
1 1/s
10 1/s
Linear (10 1/s)
Linear (1 1/s)
Page 58
39
hydrogenated WS-PWBO was then subjected to the accelerated stability tests and the
results are depicted in Figure 4-4. The viscosity of the hydrogenated aqueous fraction of
the bio-oil does not increase upon incubation at 90 °C. The viscosity is constant at high
shear rate and shows a decrease at low shear rate as seen in Figure 4-4. This behavior can
be attributed to the stable, non-reactive nature of the chemicals present in the
hydrogenated WS-PWBO. Since we eliminate all the reactive functionalities from the
WS-PWBO by hydrogenation, the polymerization reactions that cause the viscosity to
increase upon incubation are suppressed. Hence low temperature hydrogenation treatment
can be used to stabilize the aqueous fraction of the bio-oil.
Figure 4-4 Viscosity of hydrogenated water soluble pine wood bio-oil versus incubation
time at 90 °C.
Hydrogenated Aqueous Fraction of PWBO (39.6%) vs.
Time
y = -4E-06x + 0.0026
R2 = 0.1934
0
0.002
0.004
0.006
0.008
0.01
0 10 20 30
Time (Hours)
Vis
co
sit
y (
Pa.s
)
1 1/s
10 1/s
Linear (10 1/s)
Page 59
40
4.4 Stability Analysis of the Model Bio-oil Systems
It is evident that the chemical changes taking place in the bio-oil and its various
fractions during the high temperature incubation, are responsible for the increase in their
viscosities. It would be of great importance to track and identify these changes to better
understand the mechanism of bio-oil ageing. Bio-oil being a complex mixture of more
than 300 compounds, it is difficult to track all the chemical changes taking place in it
during the accelerated stability testing. Hence we have decided to study the stability of
model bio-oil systems. The model bio-oil is based on the composition of the aqueous
fraction of the bio-oil (see Figure 3-3). Hence the model system resembles the aqueous
fraction of the bio-oil rather than entire bio-oil. The first model system we studied
consisted of glucose, acetic acid, hydroxyacetone, formic acid, furfural, guaiacol,
catechol and water. Hydroxyacetaldehyde and levoglucosan were not added to the model
bio-oil as they are very expensive and hence cannot be bought in large quantities. The
exact composition is depicted in Table 4-2.
Table 4-2 Composition of model bio-oil system 1
Compound Wt%
Glucose 15.0
Formic acid 2.5
Acetic acid 7.5
Hydroxyacetone 7.5
Furfural 2.5
Guaiacol 2.5
Catechol 1.5
Water 61.0
Page 60
41
The accelerated stability test data for the Bio-oil Model System 1 is shown in
Figure 4-5. The viscosity increases upon incubation at high temperature and this increase
in more evident for the low shear measurement. The viscosity shows linear increase over
the time period studied with the rate of about 0.001 centi Pa-s h-1
. This model bio-oil
system contains 39 wt% of organics. Hence the rate of viscosity increase can be directly
compared to that for 39.6 wt% WSBO solution discussed in previous section. The rate of
viscosity increase is only 1/20th
of that for water soluble fraction of bio-oil.
Figure 4-5 Viscosity of bio-oil model system -1 versus incubation time at 90 °C.
One of the hypotheses is that the acids present in the bio-oil facilitate the
polymerization reactions within its components at high temperature. To study this, model
bio-oil system – 2 was made without any acetic acid and formic acid. The exact
composition is depicted in Table 4-3. The accelerated stability data for this system is
y = 0.001x + 0.543R² = 0.995
y = 4E-05x + 0.302R² = 0.718
0
0.1
0.2
0.3
0.4
0.5
0.6
0.7
0.8
0.9
1
0 50 100 150 200 250 300
Vis
cosi
ty (ce
nti
Pa.
s)
Time (hours)1 1/s 10 1/s Linear (1 1/s) Linear (10 1/s)
Page 61
42
shown in Figure 4-6. A linear rise in viscosity is seen over the incubation time period.
The rate of viscosity increase is double of that for Bio-oil model system - 1. This implies
that acids do not play role in the stability of the model bio-oil system. It will be
imperative to study the role of acids on stability of bio-oil and aqueous fraction of bio-oil.
We also tracked the chemical changes in the model bio-oil but no solid conclusion could
be reached from the data.
Table 4-3 Composition of model bio-oil system 2
Compound Wt%
Glucose 16.7
Hydroxyacetone 8.3
Furfural 2.8
Guaiacol 2.8
Catechol 1.7
Water 67.7
Figure 4-6 Viscosity of bio-oil model system - 2 versus incubation time at 90 °C.
y = 0.002x + 0.545
R² = 0.991
y = 3E-05x + 0.250
R² = 0.109
0
0.1
0.2
0.3
0.4
0.5
0.6
0.7
0.8
0.9
0 10 20 30 40 50 60 70 80 90 100
Vis
co
sity
(cen
tiP
a.s
)
Time (hours)1 1/s 10 1/s Linear (1 1/s) Linear (10 1/s)
Page 62
43
4.5 Effects of lignin on the bio-oil viscosity
Pyrolytic lignin occupies about 20-40 wt% of the bio-oil and has many reactive
functional sites.(48, 52, 53)
On extraction with water most of the large molecular weight
lignin species stay in the water insoluble bio-oil (WIBO) phase while the smaller lignin
units can go to the water soluble phase. Lignin is a complex polymer with aromatic
backbone. Since WIBO has significantly high viscosity and instability, the oligomeric
lignin in the bio-oil could be the major viscosity and instability contributor in bio-oil.
Fratini et al. investigated the structural changes in bio-oils upon aging and verified that
the lignin oligomers polymerize during storage.(50)
To investigate the contribution of
lignin towards instability of bio-oils, DOE-BO was used since we ran out of PWBO. The
DOE-BO had a much lower initial viscosity (0.0638 Pa·s, Figure 4-7) than the PWBO
(0.1165 Pa·s, Figure 4-1). The rate of viscosity increase for the DOE-BO was also lower
than the rate of viscosity increase for the PWBO (0.0007 ± 0.0001 Pa·s hr-1
compared to
0.0017 ± 0.0003 Pa·s hr-1
). The GPC results show that there is increase in the molecular
weight DOE bio-oil during the incubation at 90 °C as shown in Figure 4-8. There was
also phase separation in the DOE-BO after 144 hours of incubation. Phase separation
occurs due the formation of water from condensation polymerization reactions. As seen
in this figure, oligomers with wide molecular weight distribution are present in the DOE
bio-oil. The oligomers molecular weight ranges from about 200 to up to 10000. Since the
dependence of viscosity on molecular weight is exponential, It is possible that oligomers
with high molecular weight (say > 2500) contribute more towards the absolute viscosity
of bio-oil and also towards the viscosity increase upon incubation more than the
Page 63
44
oligomers with low molecular weight. To test this we separated the lignin fraction of
DOE bio-oil in low and high molecular weight lignins.
Figure 4-7 Viscosity of DOE bio-oil versus incubation time at shear rate 10 s
-1. The
samples were incubated at 90 ºC and the viscosity was measured at 40ºC.
Figure 4-8 GPC analysis results of DOE-BO. Phase separation occurs after 144 hours,
GPC results at this time point are for the bottom phase.
0.0E+0
5.0E+5
1.0E+6
1.5E+6
2.0E+6
2.5E+6
1 10 100 1000 10000 100000
Inte
nsi
ty (m
V)
Molecular Weight (Da)
DOE-BO 0 hr at 90 °C
DOE-BO 24 hr at 90 °C
DOE-BO 144 hr at 90 °C -organic fraction
Page 64
45
The lignin fraction (water insoluble bio-oil) was separated from the bio-oil by
extraction bio-oil with water and decanting out the water soluble fraction. The water to
bio-oil weight ratio of 5:1 was used for extraction. According to the procedure used by
Oasmaa et al., dichloromethane can be used to extract low molecular weight (LMW)
lignin from the water insoluble fraction of bio-oil.(52-54)
Dichloromethane is evaporated to
recover LMW lignin. The dichloromethane insoluble fraction of water insoluble bio-oil is
called high molecular weight (HMW) lignin. We used the same procedure to separate
WI-DOE-BO in LMW and HMW lignins. We then subjected the LMW and HMW lignin
to accelerated stability testing through GPC analysis. Viscosity was measured for
accelerated stability samples of LMW lignin but not for HMW lignin samples. Viscosity
measurements and GPC analysis suggest that the LMW lignin continued to polymerize
during incubation (Figures 4-9 and 4-10). The LMW lignin predominantly has oligomers
with molecular weight up to 3000 Da. The HMW lignin also continues to polymerize
during incubation (Figure 4-11). HMW lignin contains oligomers with molecular weight
up to 10000 Da. The weight average molecular weight of DOE bio-oil and LMW and
HMW lignin from DOE bio-oil are plotted in Figure 4-12. The rate of increase of
molecular weight with incubation time is highest for the HMW lignin followed by DOE
bio-oil and is lowest for the LMW lignin. The weight average molecular weight data
along with the area under curve for the highest molecular weight peak in GPC (absolute
areas as well as area normalized to 0 hr incubation samples) are tabulated in Table 4-4.
The molecular weight increased by 23.6% over 24 hour incubation at 90 °C for DOE bio-
oil and HMW lignin. The rate of molecular weight increase is significantly lower for
Page 65
46
LWM lignin with only a 14.5% increase in molecular weight over the same time period.
Also the rate of change of area under the highest molecular weight peak in GPC is in the
order: HMW lignin > DOE bio-oil > LMW lignin. This is in agreement with the viscosity
increase that was observed (Figure 4-12). The viscosity of incubated sample increases
due to two reasons: increase in average molecular weight of sample due to self-
polymerization reactions, and increase in the concentration of high molecular weight
oligomers. The concentration of high molecular weight oligomers increase due the
condensation of two low molecular weight oligomers forming a high molecular weight
oligomer. For the LMW lignin the increase in the area under the highest molecular
weight peak in GPC is only about 10% even after 58 hr of incubation and this is because
not enough lower molecular oligomers are available in this sample that can polymerize
and increase the area under the highest molecular weight peak in GPC significantly.
Hence in LMW lignin only the increase in molecular weight of oligomers is responsible
for the viscosity increase. The rate of viscosity increase is hence lower for LMW lignin
compared to that for HMW lignin. In HMW lignin the rate of molecular weight increase
as well as concentration (or under the peak) increase slows down after the first day of
incubation.
Page 66
47
Figure 4-9 Viscosity of LMW lignin at 40 °C. The lines are guides for the eye.
Hours is the incubation time at 90 °C.
Figure 4-10 GPC analysis LMW lignin fraction of DOE-BO incubated at 90 °C.
1
10
100
0.1 1 10
Vis
co
sit
y (
Pa.s
)
Shear rate (1/s)
0 hour
24 hours
58 hours
0
500000
1000000
1500000
2000000
2500000
1 10 100 1000 10000 100000
Inte
ns
ity (
mV
)
Molecular Weight
0 hour
24 hours
58 hours
Page 67
48
Figure 4-11 GPC analysis of HMW lignin fraction of DOE-BO incubated at 90 °C.
Figure 4-12 Weight average molecular weight for DOE bio-oil, low molecular weight
lignin and high molecular weight lignin from DOE bio-oil against the incubation (at 90
°C.) time.
0
500000
1000000
1500000
2000000
2500000
3000000
1 10 100 1000 10000 100000
Molecular Weight
Inte
ns
ity
(m
V)
0 Hour
24 Hours
48 Hours
72 Hours Incubation time
0
1000
2000
3000
4000
0 24 48 72 96 120 144 168
We
igh
t A
ve
rag
e M
ole
cula
r W
eig
ht
Incubation Time (Hours)
DOE bio-oil LMW lignin HMW lignin
Page 68
49
Table 4-4 Molecular weight and area under the peak data from GPC for DOE bio-oil,
and low and high molecular weight lignin from DOE bio-oil.
DOE bio-oil LMW lignin HMW lignin
Incubation
Time (hr) Incubation Time (hr) Incubation Time (hr)
0 24 0 24 58 0 24 48 72
Mw of
highest mol.
wt. peak*
2003 2477 920 1054 1221 2244 2774 3088 3401
% Change in
mol. wt. over
0 hr sample
- 23.6 - 14.5 32.7 - 23.6 37.6 51.6
Area under
GPC curve
for highest
mol. wt.
peak (million
units)
3278 4110 3086 3351 3378 6709 9567 10757 12212
Area under
curve
normalized
to 0 hr
sample
100 125.4 100 108.6 109.5 100 142.6 160.3 182.0
* Mw is weight average molecular weight
These results imply that the high molecular weight lignin in bio-oil can mainly be
responsible for the increase in the viscosity of bio-oil upon storage. In order to improve
bio-oil stability, one can either take steps to prevent polymerization during aging, or to
eliminate the presence of lignin derived oligomers prior to storage and aging. Separation
of lignin prior to storage using processes such as ultrafiltration, extraction, and refining
have been widely explored in the paper industry.(55, 56)
There is much scope for the
improvement of upstream pyrolysis process especially the bio-oil vapor condensation
system. A selective condensation system can be developed where the high molecular
Page 69
50
weight lignin is condensed out separately than the rest of the bio-oil. Such a bio-oil would
exhibit better stability.
4.6 Bio-oil Microfiltration
The char particles as discussed earlier can cause problems with respect to bio-oil
stability as well as char can clog the downstream bio-oil upgrading reactors. Hence it is
desirable to remove the char from bio-oil. Bio-oil was subjected to microfiltration using
membranes with pore diameter less than a micron to remove the fine char particles that
get entrained in bio-oil. Figures 4-13 and 4-14 show the microscopic images of bio-oil
feed, 0.5 µm permeate and 0.8 µm permeate at magnification levels 20X and 50X. The
microscopic analysis was conducted within 5 days of carrying out the microfiltration. The
feed image shows the presence of a large number of char particles of varying sizes with
some particles larger than 25 µm. Some of the particles appear to be agglomerates of
smaller particles. Similar aggregation of char particles in the bio-oil have been previously
reported by Tzanetakis et al.(57)
They found that char particles, being hydrophobic in
nature, tend to bind to the organic phase in the bio-oil, which then agglomerate to form
larger structures. The permeate images from the 0.5 µm membrane show that while the
majority of the char particle have been removed by microfiltration we still observe some
micron size particles especially at higher magnification. Since the tubular Membralox
membrane have a pore size distribution, with some pores larger than the nominal pore
size, the presence of a few particles in this size range is not surprising. The 0.8 µm
membrane permeate shows similar microfiltration characteristics as observed in the 0.5
µm permeate. Based on microscopic images it is evident that the microfiltration using
Page 70
51
both pore size membranes has successfully removed the majority of the char particles,
with only a small fraction of the smaller size char particles retained in the permeate. Ash
characterization experiments were carried out within 7 days after the microfiltration. Fig.
6 shows the ash weight percent of the feed and the filtered bio-oil. The feed has nearly
0.1 wt% ash. The weight percent of ash in bio-oil can be as high as 0.2%(8, 58)
, therefore,
our bio-oil sample has a moderate level of ash content. The ash content after
microfiltration is reduced by approximately 60%, to about 0.03 wt% (Figure 4-15). Both
pore size membranes achieve similar levels of ash reduction after filtration. The residual
bio-oil ash in permeate can be attributed to the small amount of micron level char
particles observed in the microscopic images of the permeate streams and also perhaps to
the presence of inorganic compounds dissolved in the liquid-phase that cannot be
removed by a microfiltration process.
Page 71
52
Figure 4-13 Microscopic image of DOE bio-oil feed at different magnification levels:
a=20X and b=50X.
Page 72
53
Figure 4-14 Microscopic images of membrane permeate of DOE bio-oil. A: 0.5 µm,
20X, B: 0.5 µm, 50X, C: 0.8 µm, 20X, and D: 0.8 µm, 50X.
Figure 4-15 Ash content of DOE bio-oil feed, 0.5 µm permeate and 0.8 µm permeate.
A
B
C
D
Page 73
54
Six months after the microfiltration was carried out, samples of the feed and
permeate streams were removed from refrigerated storage and subjected to the GC and
water extraction experiments to probe for possible chemical differences. The time lapse is
notable because bio-oil is known to undergo significant physico-chemical changes,
commonly referred to as ageing, over time scales of months under ambient conditions.
The GC data are given in Table 4-5. The weight percents are based on the total bio-oil.
There is no significant difference in the concentration of the key components in the
unfiltered and microfiltered bio-oil with the exception of hydroxyacetaldehyde, for which
the concentration is more than two times higher in the filtered samples as compared to the
feed. At this time we do not have an explanation for this exception. Microfiltration also
does not seem to have any significant impact on the composition of bio-oil in terms of the
water and water-soluble content as observed in Table 4-6. There is a slight decrease in the
water-insoluble fraction, on the order of one or two percent, after filtration; this may be
attributed to the removal of the solid chars which are themselves water insoluble (char
content is typically on the order of one percent by weight). It should be noted that the
typical water-soluble content of fresh bio-oil is well above 50%, so the corresponding
percentages in Table 4-6 are much lower than expected. This may be attributed to the
aging process, which is known to increase the concentration of the water-insoluble
fraction over time.(50)
In one case, for the 0.8 µm membrane permeate, the water-soluble
fraction was also measured very soon after the permeation experiment (6 months before
the measurements used to generate the data reported in Table 4-6), the water-soluble
fraction was 55% at that time, as compared to 27.2%. Although such time-dependent data
are not available for the other samples, it is likely that similar aging phenomena occurred
Page 74
55
in all of them. Interestingly, the microfiltration process itself had little influence on the
aging, with unfiltered feed and filtered permeate samples having similar water content
and water-soluble fraction at the same point in time.
Table 4-5 Composition of DOE bio-oil before and after microfiltration.
Compound Weight Percent
Unfiltered 0.8 µm permeate 0.5 µm permeate
Hydroxyacetaldehyde 3.16 8.21 7.70
Acetic acid 8.66 9.59 9.11
Hydroxyacetone 1.13 1.45 1.33
1-Hydroxybutanone 0.40 0.44 0.40
Furfural 0.47 0.47 0.42
2-Furanone 0.33 0.32 0.33
Levoglucosan 11.95 10.22 10.38
Table 4-6 Impact of microfiltration on the total water content and water soluble and
insoluble content of DOE bio-oil.
Weight Percent
Unfiltered 0.8 µm permeate 0.5 µm permeate
Water 28.1 25.8 26.3
Water soluble fraction 25.6 26.1 27.2
Water insoluble fraction 74.4 73.9 72.8
4.7 Bio-oil Nanofiltration
In Section 4.5 we saw that the high molecular weight lignin has higher rate of
viscosity increase than the bio-oil. Solvent extraction of the high molecular weight lignin
from bio-oil may not be economical at an industrial scale. Hence the idea was to remove
the very high molecular weight oligomers from the bio-oil using nanofiltration
technology. We filtered bio-oil using membranes with nominal pore sizes of 5 nm and 10
Page 75
56
nm. The GPC chromatographs for the feed, retentate and permeate are shown in Figure 4-
16. It can be seen that the nanofiltration affects the bio-oil composition over the
molecular weight range > 120 Da. The permeates have lower concentrations than feed,
which has lower concentration than retentates. Table 4-7 depicts the weight average
molecular weight and normalized concentration (of the highest molecular weight peak in
GPC) data for DOE bio-oil feed and the 5 nm and 10 nm permeates and retentates. The
nanofiltration by 10 nm filter does not affect the weight average molecular weight of bio-
oil. The concentration of the highest molecular weight peak in permeate is only about 6%
less than in the feed and 6.7% more in the retentate than in the feed. Since molecular
weight and concentration of oligomers are the main factors in determining the bio-oil
viscosity and possibly to its instability, the nanofiltration by 10 nm membrane is not
expected to improve the bio-oil properties substantially. In the case of 5 nm permeate
there is a noteworthy drop (2003.3 to 1859.6) in the weight average molecular weight as
well as in the normalized concentration (100 to 69.9), implying that it can be used to
improve the bio-oil stability.
Table 4-7 Molecular weight and concentration data for DOE bio-oil and its nanofiltration
permeates and retentates.
DOE-Bio-
oil
10 nm
permeate
10 nm
retentate
5 nm
permeate
5 nm
retentate
Weight average
molecular weight
for the last peak in
GPC
2003.3 1995.6 1999.2 1859.6 2005.5
Normalized
concentration of
last peak in GPC
100 94.0 106.7 69.9 118.4
Page 76
57
Figure 4-16 GPC data for DOE bio-oil feed and permeates and retentates from 5 nm and
10 nm filters.
The permeates and retentates obtained after the filtration were subjected to the
accelerated stability testing. The viscosity and GPC weight average molecular weight
data of the accelerated stability testing are depicted in Figures 4-17 and 4-18 respectively.
The viscosity data here for the DOE bio-oil feed was gathered about six months before
the permeates and retentates data were gathered. The feed was significantly more stable
six months ago than at the time when these experiments were carried out. During the
microfiltration and nanofiltration experiments the feed was repeatedly heated to filtration
temperature (~ 45 °C) and cooled down again at the end of the experiments. This might
0
50000
100000
150000
200000
250000
300000
350000
400000
1 10 100 1000 10000 100000
Inte
nsi
ty
Molecular Weight (Da)
0.5wt DOE-BO Feed 0.5wt DOE-BO permeate 10nm0.5wt DOE-BO retentate 10nm 0.5wt DOE-BO permeate 5nm0.5wt DOE-BO retentate 5nm
Page 77
58
have accelerated the degradation of feed resulting in the molecular weight and viscosity
increase. We do not have viscosity and molecular weight data available for this degraded
feed which should be compared with the permeate and retentate data and not the original
feed. Due to this reason, even the permeate viscosity is higher than the DOE bio-oil feed
viscosity in Figure 4-17 which should not be the case. The 10 nm permeate, 10 nm
retentate, and 5 nm permeate viscosities can be compared to each other. It can be seen
that the 10 nm permeate has a slightly lower rate of viscosity increase than 10 nm
retentate, implying that some stabilization has occurred due to nanofiltration, although
not significant. The viscosity of 5 nm permeate increases at substantially lower rate that
10 nm permeate and retentate. Nanofiltration hence is a promising bio-oil stabilization
method. The stabilization in 5 nm permeate is due to the reduction in the average
molecular weight of bio-oil and the reduction in the concentration of oligomers.
Figure 4-17 Accelerated stability viscosity data for DOE bio-oil and permeates and
retentates from nanofiltration.
0
0.1
0.2
0.3
0.4
0.5
0.6
0.7
0.8
0 2 4 6 8
Vis
cosi
ty (P
a-s
)
Incubation time (days)
10 nm permeate 10 nm retentate 5 nm permeate DOE bio-oil
Page 78
59
Figure 4-18 Accelerated stability GPC data for DOE bio-oil and its permeates and
retentates from nanofiltration.
4.8 Conclusion
The general conclusion from this study is that in its original form bio-oil is
unstable, that is its viscosity and molecular weight increases upon storage. The self-
polymerization reactions within the bio-oil components are the reason for the increase in
the molecular weight, which results in the increase in viscosity. The rate of viscosity
increase is higher for the water insoluble fraction of bio-oil (WIBO) than that for bio-oil
than that for the water soluble fraction of bio-oil (see Table 4.8). The WIBO contains a
1600
1800
2000
2200
2400
2600
2800
3000
0 1 2 3 4 5 6 7 8
Wei
ght
Avg
. Mo
l. W
t. o
f las
t p
eak
(Da)
Incubation Time (days)
5 nm perm 10 nm perm 10 nm ret DOE bio-oil
Page 79
60
high concentration of high molecular weight lignin oligomers, implying that these
oligomers are largely responsible for the bio-oil instability.
Table 4-8 Initial viscosity and rate of viscosity increase for bio-oil and different fraction
from bio-oil.
Sample Initial
Viscosity* at
40 °C (Pa-s)
Rate of Viscosity
Increase† (Pa-s h
-1)
Pine wood bio-oil 0.117 1.7010-3
Water insoluble pine wood bio-oil 1.46 1.1610-2
Water soluble pine wood bio-oil 1.8510-3
310-5
Hydrogenated water soluble pine
wood bio-oil
2.7210-3
0
DOE bio-oil 0.064 710-4
LMW lignin from DOE-BO 1.44 0.22
HMW lignin from DOE-BO 66.3 N/A‡
* at shear rate of 10 s
-1.
† rate of viscosity increase when incubated at 90 °C. A linear equation is fit to the
viscosity data to get the rate of viscosity increase. ‡
HMW lignin solidified during the incubation.
For the aqueous fraction of the bio-oil (WSBO), low temperature hydrogenation
can be used for the stabilization. Low temperature hydrogenation converts the reactive
aldehyde, ketone, and carbohydrate functionalities to corresponding alcohols, which are
thermally stable. The hydrogenation hence prevents any further polymerization in the
WSBO. The viscosity of hydrogenated WSBO was found to be stable during the
incubation at 90 °C. Bio-oil model compound studies indicated that the acids do not
affect the rate of viscosity increase in model systems.
Page 80
61
Char is postulated to catalyze the polymerization reactions within the bio-oil or it
can also act as nucleation sites for the forming of second phase during the storage of bio-
oil. We were able to remove char particles above 1 µm in size from fast pyrolysis bio-oil
by microfiltration using ceramic membranes. Microfiltration had little impact on the
composition of the bio-oil. The microfiltration did not improve the stability of bio-oil.
Ash content of the bio-oil can be reduced by microfiltration as the majority of the ash is
trapped in char, which is removed upon microfiltration. Never the less, microfiltration of
bio-oil is beneficial for the further processing of bio-oil such as hydrogenation and zeolite
upgrading. Future work should focus on developing the pilot and industrial scale
microfiltration processes for the bio-oil.
The high rate of viscosity increase of water insoluble bio-oil shows that the high
molecular weight oligomers are mainly responsible for the instability of bio-oil. The
water insoluble bio-oil was further separated into low molecular weight (LMW) lignin
and high molecular weight (HMW) lignin by extraction with dichloromethane. The
HMW lignin was found to be significantly more unstable than LWM lignin and the whole
bio-oil with respect to average molecular weight increase and increase in the
concentration of high molecular weight species. Hence it can be concluded that the HMW
lignin is the major contributor to the bio-oil instability. The future work for this reason
should be focused on the selective removal of HMW lignin from bio-oil. The
dichloromethane extraction method may not be feasible at the industrial level. Upstream
modifications in the pyrolysis vapors condensation system such that HMW lignin is
condensed separately from rest of the bio-oil needs to studied. Nanofiltration of bio-oil
Page 81
62
with 5 nm pore size membrane was found to stabilize bio-oil to some extent. The
stabilization is by reduction in the average molecular weight of bio-oil and in the
concentration of high molecular weight oligomers. More work needs to be done to
understand the effects of bio-oil nanofiltration on its stability and chemical composition.
The economic feasibility of the nanofiltration also needs to be evaluated.
Page 82
63
Chapter 5
AQUEOUS PHASE PROCESSING OF WATER SOLUBLE BIO-OIL
5.1 Introduction
The existing bio-oil upgrading processes suffer from various drawbacks such as
coking of the catalyst, low yield to desired products, and use of sulfided catalysts. The
existing bio-oil upgrading processes are discussed in detail in Sections 6.2 and 7.1. It is
hence necessary to find the alternate efficient bio-oil processing technologies. We process
the aqueous fraction of oak wood bio-oil (water soluble oak wood bio-oil or WS-OWBO)
by Aqueous Phase Processing (APP). Aqueous phase processing, developed by Dumesic
and co-workers, involves the selective conversion of sugars and polyols to hydrogen and
targeted alkanes.(15, 25)
The major advantage of this approach is that targeted products can
be selectively produced by controlling the chemistry that occurs in the aqueous phase.
Other advantages of aqueous phase processing include: (1) liquid fuels can be made that
can be used with gasoline and diesel engines, (2) high thermal efficiencies because the
process occurs in the liquid phase, (3) no energetically-intense distillation steps, and (4)
have high rates of production per reactor volume. Liquid-phase catalytic processing of
biomass-derived compounds offers unique opportunities for achieving high yields of
specific, and well-defined, liquid fuels from biomass.
Hydrogen is an important reactant in a majority of refinery processes to
make liquid fuels and biofuels.(59)
Hydrogen can be produced in our process by aqueous-
phase reforming (APR) which is a part of APP. APR involves C-C bond cleavage (to
Page 83
64
produce CO) followed by the water gas shift reaction over supported metal catalysts.(15)
The overall reaction for APR of sorbitol is shown in Equation (5-1). Side reactions such
as methanation and dehydration/hydrogenation take place to produce C1 to C6 alkanes as
by-products.
C6H14O6 + 6H2O → 6CO2 + 13H2 (5-1)
Alkanes ranging from C1 to C6 can be produced more selectively by aqueous phase
dehydration/hydrogenation (APDH), also a subset of APP. This involves passing the
aqueous solution of oxygenated hydrocarbon over a bi-functional catalyst containing
metal and acidic sites such as Pt supported on SiO2-Al2O3. Hydrogen can be either
produced in-situ on metal sites according to the Equation (5-1) or supplied externally.
The alkanes are produced by dehydration reactions on solid acid sites to produce
dehydrated products, and hydrogenation reactions on metal sites as shown in Equation (5-
2). If the alkane and hydrogen production reactions are balanced then alkanes can be
directly produced from a sugar with CO2 and H2O as the byproducts as shown in
Equation (5-3). Smaller alkanes are obtained as by-products due to the C-C bond cleaving
reactions.
C6H14O6 + 6H2 → C6H14 + 6H2O (5-2)
(19/13) C6H14O6 → (36/13) CO2 + C6H12 + (42/13) H2O (5-3)
Page 84
65
Figure 5-1 shows the reactions taking place during APP of sorbitol. The majority of the
previous APP work was done with pure compounds such as ethylene glycol, glycerol and
sorbitol.(15, 25-27)
A substantial fraction of bio-oil is water soluble as discussed in Chapter
3 the aqueous fraction of the bio-oil consists of various oxygenated hydrocarbons. Hence
the aqueous fraction of the bio-oil can be an excellent feedstock for the APP to produce
hydrogen and alkanes. We thus proposed a new route for production of renewable liquid
fuels from biomass by combining fast pyrolysis with aqueous phase processing.
Figure 5-1 Aqueous phase processing of sorbitol (from reference (25))
5.2 Experimental
The material and methods for this chapter are described in Sections 2.1, 2.5, 2.6.1,
and 2.7. Only oak wood bio-oil has been used for gathering the data presented in this
chapter. Hence abbreviation WSBO is used sometimes to describe water soluble oak
wood bio-oil (WS-OWBO) in this chapter.
O OH
OHOH
HO(Acid)
Dehydration
OH
OH
OH
OH
OH
OH
Reforming
(metal)
C-C cleavage,
water gas shift
CO2, H2
H2
Hydrogenation
(metal)
OH
OH
OH OH
OH
Repeated
Dehydration
Hydrogenation
Reformingn-hexane
Methanation
(metal)
CH4, C2H6,
C3H8, etc.
C-C
cleavage
(metal)
Page 85
66
5.3. Proposed Process, Reaction System and Theoretical Yields
The proposed process for the aqueous phase processing of bio-oil is depicted in
the form of a simplified block diagram in Figure 5-2. The bio-oil is first phase separated
in water soluble and water insoluble fractions. The water soluble fraction is then
subjected to low temperature hydrogenation on Ru/C catalyst. Methane is formed as by-
product in this step. The hydrogenated WSBO can then be fed to either APR (Pt/Al2O3
catalyst) or APDH (Pt/SiO2-Al2O3 catalyst) reactor. In APR, H2 and CO2 are obtained as
major products with light alkanes as by-products. From APDH reactor, C1-C6 alkanes
and CO2 are obtained as major products. Hydrogen can be supplied externally to APDH
reactor. In that case C1-C6 alkanes are major products with CO2 being a by-product.
Figure 5-2 Block diagram of the aqueous phase processing of bio-oil
L-L
Exctactor
Low
Temperature Hydrogenation
Aqueous
Phase Reforming
Water
Bio-oil
Water Insoluble Bio-oil
Water Soluble
Bio-oil
Hydrogenated
WSBO
Aqueous
Effluent
H2, CO2 and
light alkanes
Hydrogen
Methane
Aqueous Phase
Dehydration-Hydrogenation
Aqueous
Effluent
C1-C6 alkanes
and CO2
Hydrogen
(optional)
Page 86
67
From the elemental analysis data, the WS-OWBO can be represented by a
molecular formula C2H5.4O2.05 with an arbitrary molecular weight of about 62. The
amount of hydrogen in water soluble bio-oil increases during the hydrogenation step and
depends on the hydrogen consumption in this step. About 25% of the carbon is converted
to CH4 in the hydrogenation step under the conditions of 175 °C and 1000 psi in batch
reactor. Clearly, reducing the amount of methane formed in the hydrogenation step is of
critical importance in obtaining commercially relevant yields. Methane can form by the
hydrogenation of CO produced upon decarbonylation of bio-oil compounds. A mole of
water is also formed when a mole of CH4 is obtained from hydrogenation of CO. The
hydrogen consumption in this step is about 0.06 gm /gm WS-OWBO for reaction
temperature and time of 175 °C and 3 h respectively. For 0.06 gm H2 consumed per
gram of WSBO, the hydrogenated WS-OWBO (H-WS-OWBO) can be represented by a
molecular formula C1.5H6.1O1.55 with the molecular weight of 48.9 (see Equation 5-4).
C2H5.4O2.05 + 1.87 H2 C1.5H6.1O1.55 + 0.5 CH4 + 0.5 H2O (5-4)
WS-OWBO H-WS-OWBO
Hydrogen is produced by Equation (5-5) from the H-WS-OWBO and water by
aqueous-phase reforming. The hydrogen can react with the bio-oil to produce alkanes
(pentane is shown as an example) as shown in Equation (5-6) (No carbon-carbon bond
forming reactions are taking place in Equation (5-6)). Addition of Equation (5-5) and (5-
6) so that the hydrogen produced in Equation (5-5) is consumed in Equation (5-6) gives
Equation (5-7). From Equation (5-5) it can be seen that the theoretical highest yield of
Page 87
68
hydrogen is 0.184 gm hydrogen per gm of H-WS-OWBO or 0.145 gm hydrogen per gm
of WSBO (non-hydrogenated). The net hydrogen production accounting for hydrogen
consumption in hydrogenation step is 0.085 gm hydrogen per gm WS-OWBO. The
selectivity of alkanes produced from the water soluble bio-oil depends upon its
composition. However if we assume that pentane is the major product, the theoretical
highest yield of pentane that can be produced from hydrogenated WS-OWBO is 0.326
gm per gm of WS-OWBO (Equation 5-7).
C1.5H6.1O1.55 + 1.45 H2O 1.5 CO2 + 4.5 H2 (5-5)
C1.5H6.1O1.55 + 0.3 H2 1.55 H2O + (1.5/5) C5H12 (5-6)
16 C1.5H6.1O1.55 1.5 CO2 + 21.8 H2O + 4.5 C5H12 (5-7)
In our experiments we were only able to obtain 0.031 gm H2 per gm of WS-
OWBO. This is only about 21% of the maximum possible yield (0.145 gm). This yield
could be increased by recycling the un-reacted product and decreasing the amount of
methane we produce in the low-temperature hydrogenation step. The hydrogen
production in reforming step is less than the hydrogen consumption in the hydrogenation
step. Better reforming catalysts are required to increase the hydrogen production. If
higher hydrogen production is achieved the excess hydrogen produced can be used for
the low temperature hydrogenation reaction and to hydrogenate the WIBO. The water
insoluble fraction of the bio-oil can be hydrotreated with the hydrogen produced from the
aqueous fraction of the bio-oil to produce aromatic fuel. WIBO also has the potential to
Page 88
69
replace phenol in phenol-formaldehyde resins.(7)
WIBO can also be converted to aromatic
gasoline through catalytic cracking on zeolite.(60)
5.4 Low Temperature Hydrogenation (LTH) of the Aqueous Faction of Bio-oil in
Batch Reactor
The aqueous fraction of bio-oil contains thermally unstable compounds (e.g.
glucose, levoglucosan) that decompose when heated to high temperature. These
compounds must be converted into thermally stable compounds prior to APP.(15, 25)
If
they are not converted to thermally stable compounds then they can cause deactivation of
the catalyst by coke formation. The thermally unstable compounds can be converted to
thermally stable compounds by a low temperature aqueous phase hydrogenation. In the
low temperature hydrogenation, compounds such as hydroxyacetaldehyde,
hydroxyacetone, and furfural are converted to corresponding alcohols such as ethylene
glycol, propylene glycol and tetrahydrofurfuryl alcohol respectively. The challenge with
the low temperature aqueous phase hydrogenation step is to selectively hydrogenate
targeted C=O bonds and not break the C-C or C-O bonds. Cleavage of C-C and C-O
bonds results in formation of lighter products including undesired methane. The aqueous
phase hydrogenation was studied in a batch as well as in a flow reactor in this study.
Batch hydrogenation of the aqueous fraction of bio-oil was done in the
temperature range of 125-175 °C with a 5 wt% Ru/Carbon catalyst. The hydrogen uptake
of this catalyst was 33.2 μmol H atoms/gm dry catalyst, which corresponds to surface to
bulk Ru ratio of 6.7%. Table 5-1 depicts the data gathered for batch hydrogenation where
Page 89
70
temperature is increased in steps from 125 C to 150 C to 175 C. Ethylene glycol,
propylene glycol, butanediols, tetrahydrofurfuryl alcohol, -butyrolactone and 1,2-
cyclohexanediol all reach their respective maximum concentrations within 2.5 hours at
125 C. All the hydroxyacetone is also consumed during this same period. Acetic acid
does not react at the reaction conditions used.
Page 90
71
Table 5-1 Hydrogenation of the aqueous fraction of bio-oil with initial carbon concentration of 24900 mg L-1
(by TOC) in batch reactor,
Catalyst: 3 gm of 5 wt% Ru/C (wet basis), total pressure: 1000 psi.
a1,2 and 1,4-butanediol,
b tetrahydrofurfuryl alcohol,
c contains guaiacol and methyl guaiacol, N.A. = not analyzed.
Temperature (C) 25 125 125 125 125 150 150 150 175 175
Method Minutes 0 30 60 150 210 270 320 360 400 455 Concentration (mmole C L
-1)
GC-FID Hydroxyacetone 135.5 55.7 24.5 0.0 0.0 0.0 0.0 0.0 0.0 0.0 GC-FID Hydroxyacetaldeh
yde 28.1 0.0 0.0 0.0 0.0 0.0 0.0 0.0 0.0 0.0
GC-FID Ethylene Glycol 0.0 90.6 172.3 212.2 216.9 198.9 191.6 204.6 222.6 210.9 GC-FID Propylene Glycol 0.0 25.4 113.1 159.0 164.1 154.9 163.0 172.5 186.6 182.7 GC-FID Butanediols
a 0.0 13.3 36.6 52.7 55.5 51.8 59.1 63.0 64.3 61.1
GC-FID THFAb 0.0 9.9 12.5 15.7 14.9 13.5 11.4 13.3 12.0 15.0
GC-FID -Butyrolactone 0.0 24.7 31.7 30.4 29.4 30.5 30.3 30.7 30.8 29.8 GC-FID Guaiacols
c 30.8 28.8 0.0 0.0 0.0 0.0 0.0 0.0 0.0 0.0
HPLC Sugars 377.4 242.5 232.6 N.A. 174.7 140.4 125.9 117.7 80.4 67.3 HPLC Sorbitol 0.0 0.0 0.0 N.A. 56.6 89.8 117.1 141.2 186.7 204.7 HPLC Levoglucosan 390.6 274.8 271.4 N.A. 276.7 235.8 216.0 212.9 150.7 132.0 GC-FID Acetic Acid 182.2 126.1 192.6 170.9 167.1 186.0 196.3 201.1 206.8 210.2 Total mmole-C L
-1
identified 1144 891.8 1087 N. A. 1155 1101 1110 1157 1141 1114
% C identified in
liquid 55.2 50.5 59.8 N. A. 63.8 59.6 61.8 61.7 64.6 63.8
% C in liquid by
TOC 100.0 85.1 87.6 86.1 87.3 89.2 86.7 N.A. 85.1 84.2
H2 Consumption
(gm/gm WSBO) 0 0.007 0.016 0.024 0.034 0.038 0.048 0.061 0.070 0.091
Page 91
72
Sugars and levoglucosan do not undergo complete conversion at 125 C.
Levoglucosan has a very slow rate of hydrogenation at 125 C. Initially levoglucosan
concentration decreases rapidly from 390.6 mmol-C L-1
to about 275 mmol-C L-1
at
125°C. However, it then stays the same for 3 h. The levoglucosan concentration does
decrease when the temperature is increased further. This implies that the high reaction
temperature is required for the hydrogenation of levoglucosan. Levoglucosan is
converted to sorbitol in two steps, hydrolysis of levoglucosan to glucose, followed by
hydrogenation of glucose to sorbitol.(43)
The first reaction is an acid catalyzed reaction,
whereas the second reaction is catalyzed by a hydrogenation catalyst, in this case Ru/C.
In the absence of any externally added acid in the reaction mixture, it is possible that the
first reaction is catalyzed by acids that are present in the aqueous fraction of bio-oil.
Disappearance of the sugars follows a similar but less obvious trend as levoglucosan. At
125 C, sugars (377 mmol-C L-1
to 175 mmol-C L-1
) disappear twice as fast as
levoglucosan (390 mmol C L-1
to 275 mmol-C L-1
) does in 3.5 hours. This implies that
the first step (levoglucosan to glucose) is the slower one and hence the rate limiting step
in the conversion of levoglucosan to sorbitol. Increasing the acidity of the feed could
therefore help expedite the conversion of levoglucosan to sorbitol.(43)
It is desirable to minimize carbon loss from liquid in the form of methane in LTH
step. About 25% carbon is converted to methane at 175 C, whereas at 125 C, only
about 10% carbon is converted to methane. However, sugars and levoglucosan are not
completely converted to corresponding alcohols at 125 C for shorter reaction time (< 3.5
h). Thus, there requires some optimization of reaction temperature and time. At high
Page 92
73
temperature, shorter reaction times (just sufficient to convert all the reactants to desired
products), should be used to keep carbon loss to methane low. At low temperature, longer
reaction time may be required to convert the reactants to respective alcohols. Hydrogen
consumption during the LTH step increases with the temperature and is tabulated in
Table 5-1.
Hydrogen consumption is about 0.034 gm/gm WS-OWBO at 125 C and doubles
for every 25 C rise in the temperature. Hydrogen consumption at the end of the run was
found to be 0.12 gm/gm WS-OWBO. Hydrogen consumption should be minimized by
using as low temperature as possible. At low temperature unwanted reactions, such as
saturation of aromatic rings, which consume a considerable amount of hydrogen, are
suppressed. The hydrogen consumption at low temperature (125 C) is comparable to that
reported by Elliott for the two stage hydroprocessing process, where 0.034 gm H2 is
consumed per gm of bio-oil.(30)
We selected Ruthenium on activated carbon catalyst for LTH as it is known to
exhibit high activity and stability for similar hydrogenation reactions in the aqueous
phase.(61-63)
The temperature and reaction time both influence the products that are
formed. Strong acid (e.g. H2SO4, HCl) can be added to the reaction mixture to increase
the rate of acid catalyzed hydrolysis of levoglucosan to glucose. Helle et al. showed that
increasing the concentration of sulfuric acid increases the rate of hydrolysis of
levoglucosan in water at 110 C.(43)
Page 93
74
The hydrogen consumption in LTH step is up to 0.12 gm/gm WS-OWBO at 175
°C (Table 5-1). At high hydrogenation temperature large amounts of undesired methane
is produced. This results in significant increase in hydrogen consumption during this
step. Methane formation also results in reduced hydrogen production in APR.
Theoretically, a maximum of 0.15 gm of hydrogen can be produced per gm of WS-
OWBO. We have studied the LTH in down-flow reactor in details and those results are
discussed in Chapter 6. We were able to reduce the carbon loss to the gas phase and
hydrogenate all the bio-oil functionalities at the same time. Reactions taking place during
the LTH are identified in Chapter 6.
5.5 Aqueous Phase Reforming of the Aqueous Fraction of Bio-oil
We produced hydrogen from the aqueous fraction of the oak wood bio-oil by
passing it over 1 wt% Pt/Al2O3 catalyst as shown in Table 5-2 and Figure 5-3. The
Pt/Al2O3 catalyst had a hydrogen uptake of 40.6 μmol H/gm catalyst which corresponds
to a surface to bulk metal ratio of 79.2%. The concentration of the WSBO in water was 4-
5 wt% which corresponds to 1.5-2 wt% carbon in water. The concentration varied
depending on the pretreatment of the bio-oil. Prior to each run the exact carbon content of
the feed was measured with TOC. The liquid phase carbon content was measured by
TOC analysis of the feed and liquid products. The gas phase contained C1 to C6 alkanes,
CO2 and H2 for all products tested.
Page 94
75
Table 5-2 Aqueous-phase reforming of H-WSBO (from OWBO) and 5 wt% sorbitol solution with a 1 wt%
Pt/Al2O3 catalyst. Reaction conditions: 265 C and 750 psi. The H-WSBO contains 1.5-2 wt% carbon and is
prepared by hydrogenation of the aqueous fraction of bio-oil at 175 C and 1000 psi with a 5 wt% Ru/C
catalyst for 3 h.
Run Code Pre-treatment
on WSBO
WHSV
(h-1)a
Hours
Catalyst
on
Stream
H2
Selectivityb
(%)
Alkane
Selectivityc
(%)
% Carbon
in gas
phase
effluentd
% Carbon
in liquid
phase
effluent
H-WSBO-A
H-WSBO-B
Hydrogenation
Hydrogenation
0.73
0.13
75
20
60
50
21
35
21
41
73
43
WSBO-C
Sorbitol
None
None
0.73
0.73
10
34
36
64
30
16
32e
44f
26
51
a WHSV = flow rate of the aqueous fraction of bio-oil (gm h
-1)
divided by grams of catalyst in the reactor.
b H2 Selectivity = (molecules H2 produced / C atoms in gas phase) (1/Reforming Ratio) 100, Reforming
Ratio (RR) is the ratio of molecules of H2 produced to C atoms in gas phase assuming that all the water
soluble bio-oil goes to H2 and CO2 only, for hydrogenated water soluble bio-oil RR is 3, RR for sorbitol is
13/6. c Alkane selectivity = (total moles of carbon atoms in alkane products) / (total moles of carbon atoms in the
feed) 100. d Gas phase contains C1 to C6 alkanes, CO2 and H2.
e Decreases to 23% with the catalyst on stream for 22 h.
f Decreases to 38% with the catalyst on stream for 48 h.
Table 5-3 Production of alkanes from H-WS-OWBO and sorbitol at 260 C and 750 psi with a 4 wt%
Pt/SiO2-Al2O3 catalyst. (The WSBO feed contains 1.5-2 wt% carbon and are prepared by hydrogenation of
the aqueous fraction of bio-oil at 175 C and 1000 psi with a 5 wt% Ru/C catalyst for 3 h).
Run Code Feed WHSVa
(h-1)
Hours
Catalyst
on
Stream
Alkane
Selectivityb
(%)
% Carbon
in Gas
Phase
Effluentc
% Carbon
in Liquid
Phase
Effluent
H-WSBO-D H-WSBO 0.96 48 45 35d 38
H-WSBO-E H-WSBO 0.20 25 42 40-50 43
H-WSBO-D-H2 H-WSBO + H2 0.96 80 77 18 59
H-WSBO-E-H2 H-WSBO + H2 0.20 55 85 56 37
H-WSBO-HCl H-WSBO + HCl 0.20 200 55-60 40-45 47
H-WSBO-HCl-
H2
H-WSBO + HCl
+ H2
0.20 215 97 55-60 32
Sorbitol Sorbitol 0.96 24 42 72 19
a WHSV = flow rate of the aqueous fraction of bio-oil (gm h
-1)
divided by grams of catalyst in the reactor.
b Alkane selectivity = (total moles of carbon atoms in alkane products) / (total moles of carbon atoms in the
feed) 100. c Gas phase contains C1 to C6 alkanes and CO2.
d Decreases to 30% with the catalyst on stream for 60 h.
The carbon conversion to gas phase products was just above 20% for the
hydrogenated aqueous fraction of bio-oil (H-WSBO-A) at WHSV of 0.73 h-1
. The H2 and
alkane selectivities were 60% and 21% respectively. This indicates that at low conversion
high hydrogen selectivity can be obtained from the aqueous fraction of bio-oil. At similar
Page 95
76
conditions sorbitol showed the carbon conversion of 44% and H2 and alkane selectivity
of 64% and 16% respectively. Decreasing the WHSV to 0.13 h-1
for the H-WSBO (run
code H-WSBO-B in Table 5.2) increases the gas phase conversion to 41%. At this higher
conversion the hydrogen selectivity decreases to 50%. Thus the hydrogen and alkane
selectivities are a function of the gas phase conversion. When H-WSBO-B data is
compared to sorbitol (both have similar conversion), it can be concluded that aqueous
fraction of the bio-oil is less active than sorbitol. The alkane selectivity for the WSBO
and sorbitol are significantly different as shown in Figure 5-3. The WSBO more
selectively produces the heavier alkanes as compared to the sorbitol.
Figure 5-3 Alkane distribution for aqueous-phase reforming of WSBO and 5 wt%
sorbitol solution at 265 C and 750 psi with 1 wt% Pt/Al2O3 catalyst. Feed and reaction
key (see Table 5-2 ) ( ) H-WSBO-A, ( ) H-WSBO-B, ( ), ( ) Sorbitol, ( ) WSBO-
C.
Our results are similar to that of Cortright et al. who produced hydrogen from 1
wt% sorbitol solution at 265 C and 800 psi with a 3 wt% Pt/Al2O3.(15)
Carbon
0
10
20
30
40
50
1 2 3 4 5 6
Carb
on
alk
an
e s
ele
cti
vit
y (%
)
Alkane Carbon Number
Page 96
77
conversion to gas phase, CO2 selectivity and hydrogen selectivity of 90%, 68% and 46%
respectively, were reported. The difference between our runs and that of Cortright et al. is
that our catalyst had significantly fewer surface sites (40.6 μmol H/gm catalyst of
hydrogen uptake vs. 105 μmol gm-1
catalyst of CO uptake). Also the sorbitol space
velocity used by Cortright et al. is 0.008 gm sorbitol per gram catalyst as compared to our
0.0365 gm sorbitol per gram catalyst. To compare our catalyst to that of Cortright et al.,
we fed our reactor with 5 wt% sorbitol in water with same operating conditions.
Conversion to gas phase, CO2 selectivity and hydrogen selectivity for sorbitol were 44%,
84% and 64% respectively. We see low activity for sorbitol due the low catalyst
concentration we used. Reforming of a non-hydrogenated aqueous fraction of the bio-oil
(WSBO-C) was also studied at WHSV of 0.73 h-1
. The gas phase conversion decreased
from 32% at 10 h to 23% at 22 h. The hydrogen selectivity of only 36% was observed
with non-hydrogenated water soluble bio-oil, demonstrating the necessity of the
hydrogenation step.
A process flow diagram that shows how bio-oil could be converted into liquid
fuels and chemicals is shown in Figure 5-4 with mass balances for the different reaction
assuming that 100% of the theoretical yield and 25% carbon loss to methane. In the first
step in this process the bio-oil is mixed with water (1:1 weight mixture) and separated
into a water soluble fraction (WSBO) and a water insoluble bio-oil (WIBO).
Approximately 62 wt% of the initial bio-oil goes into the WSBO and 38 wt% of the
initial bio-oil goes into the WIBO. The WSBO is then sent to a low temperature
hydrogenation unit where the hydrogen consumption is up to 0.12 gm/gm bio-oil. In
Page 97
78
Figure 5-4, hydrogen consumption of 0.06 gm/gm non-hydrogenated WS-OWBO is
shown. The purpose of this unit is to stabilize the bio-oils. The hydrogenated WS-
OWBO is then sent to an aqueous-phase reformer where hydrogen is produced. The
maximum amount of hydrogen that can be produced from 100 kg h-1
of bio-oil is 9 kg h-1
.
In the process, 66 kg h-1
CO2 and 8 kg h-1
of methane will also form. The hydrogen
consumption is 3.7 kg h-1
in hydrogenation step. The net hydrogen production for this
process is 5.3 kg h-1
. After the hydrogenation step, the polyols can be separated out if
desired. The unreacted bio-oil can be re-concentrated and recycled back to the reactor.
Figure 5-4 Process flow diagram for aqueous phase reforming of bio-oil.
In our experiments, hydrogen is produced from the aqueous fraction of the bio-oil
with high selectivity (50-60%). The major challenge is that the bio-oils have low activity.
L-L
Extractor
Bio-oil
(100 kg/h)
Low Temp.
Hydrogenation
Non-hydrogenated
WSBO (aq. phase) (62.2 kg/h WSBO & 100 kg/h Water)
Water
(100 kg/h)
Aqueous
Phase Reformer
WIBO
Hydrocracker
Water Insoluble
Bio-oil (37.2 kg/h)
Liquid Fuel
Hydrogen (9 kg/h),
CO2 (66 kg/h) and C1-C6 Alkanes
WSBO
purge
WSBO Separation
System
Polyols
(optional)
Separation
System
WSBO
Recycle
Hydrogen
(3.7 kg/h + excess)
Hydrogen
Methane (8 kg/h) +
excess Hydrogen
Water
Hydrogen
Recycle
Page 98
79
This could be due to poisoning of the catalyst surface by acids or other impurities. Lower
hydrogen selectivity is observed for bio-oil (50%) as compared to sorbitol (64%) at
similar conversions. Bio-oil exhibits low reforming activity though with moderate
hydrogen selectivity. The moderate hydrogen selectivity can be attributed to the presence
of smaller oxygenated hydrocarbons in the aqueous fraction of bio-oil. Smaller
oxygenates present in bio-oil are converted to diols such as ethylene glycol and propylene
glycol upon hydrogenation. These diols can produce hydrogen in high yield as compared
to larger polyols such as sorbitol. These polyols also have higher rates of reaction than
sorbitol.(15, 26)
Even though it contains diols, the aqueous fraction shows lower hydrogen
selectivity as compared to sorbitol. This can be due the presence of unreacted bio-oil
components and other unidentified compounds in the aqueous fraction.
Theoretically about 0.085 gm hydrogen can be produced from a gram of non-
hydrogenated WS-OWBO when about 25% of the carbon is converted to methane in
hydrogenation step. We were able to produce 0.031 gm of hydrogen from a gram of non-
hydrogenated WS-OWBO while consuming 0.06 gm hydrogen in the hydrogenation step.
The low hydrogen production is due to two reasons (a) high carbon loss and hence the
hydrogen loss to gas phase during hydrogenation and (b) low activity of bio-oil in
reforming. About 0.032 gm hydrogen per gm non-hydrogenated WSBO is lost in the
form of methane during hydrogenation at 175 °C. To reduce the carbon loss, optimization
of reaction temperature and time is necessary as discussed earlier. Catalyst with low
decarbonylation activity is desired for the hydrogenation step. For reforming, catalyst
with high activity for bio-oil is desired. The low reforming activity seen for Pt/Al2O3
Page 99
80
catalyst can also be due to various impurities in bio-oil. Effects of the bio-oil impurities
(e.g. alkali salts of organic acids) on the reforming process needs to be studied. Bi-
metallic catalysts are known to be highly active for the reforming of ethylene glycol(26)
and can potentially be used for reforming of aqueous fraction of bio-oil.
5.6 Aqueous Phase Dehydration/Hydrogenation of the Aqueous Fraction of Bio-oil
Alkanes can be produced from the aqueous fraction of the bio-oil by aqueous-
phase dehydration/hydrogenation with a bi-functional catalyst.(25)
Platinum supported on
silica-alumina is the catalyst used in these studies. The reactions that occur on Pt include
hydrogenation; reforming and water gas shift reactions. The acidic silica-alumina
catalyzes dehydration reactions. The data gathered with 4wt% Pt/Al2O3-SiO2 catalyst are
depicted in Table 5-3 and in Figures 5-5 and 5-6. This data was collected on the
hydrogenated WSBO with hydrogen as a co-feed and without hydrogen as a co-feed. The
concentration of WSBO in water was 4-5 wt% which corresponds to 1.5-2 wt% carbon in
water.
Page 100
81
Figure 5-5 Alkane distribution for the liquid phase dehydration/hydrogenation of H-WS-
OWBO and 5 wt% sorbitol solution at 260 C and 750 psi with 4 wt% Pt/SiO2-Al2O3
catalyst. Feed and reaction key (see Table 5-3): ( ) H-WSBO-D, ( ) H-WSBO-E, ( )
H-WSBO-HCl, ( ) Sorbitol.
Figure 5-6 Alkane distribution for the liquid phase dehydration/hydrogenation of H-WS-
OWBO at 260 C and 750 psi with 4 wt% Pt/SiO2-Al2O3 catalyst. Feed and reaction key
(see Table 5-3): ( ) H-WSBO-D-H2, ( ) H-WSBO-E-H2, ( ) H-WSBO-HCl-H2.
0
5
10
15
20
25
30
35
1 2 3 4 5 6
Carb
on
alk
an
e s
ele
cti
vit
y (%
)
Alkane carbon number
0
10
20
30
40
50
1 2 3 4 5 6
Carb
on
alk
an
e s
ele
cti
vit
y (%
)
Alkane carbon number
Page 101
82
The H-WSBO was tested at two different space velocities (H-WSBO-D and H-
WSBO-E) without adding hydrogen as a feed. The carbon conversion to gas phase
products increased from 35% to 40-50% when the WHSV decreased from 0.96 h-1
to 0.2
h-1
. The alkane carbon selectivity was 45% for H-WSBO-D with hexane and pentane
being the most abundant alkanes (see Figure 5-5). A similar (42%) alkane selectivity is
observed at both the space velocities. However, the alkane distribution shifts towards
lower alkanes at higher conversions (see Figure 5-5). At similar operating conditions to
the H-WSBO, sorbitol had a carbon conversion of 72% with the alkane selectivity of
42%. The sorbitol shows a similar distribution of C1-C6 alkanes as the WSBO. For
sorbitol (72% conversion) and H-WSBO-E (up to 50% conversion), similar alkane
selectivity (42%) is observed. Bio-oil clearly is less active than pure sorbitol for alkane
production, but comparable alkane selectivities can be achieved. Huber et al. reported
95% conversion with 60% alkane selectivity for the sorbitol with the same temperature,
pressure, catalyst and the WHSV of 1.3 h-1
.(25)
Our catalyst is less active for
dehydration/hydrogenation as compared to that of Huber et al. As the time of on stream
increases from 48 h to 60 h the conversion decreases from 35% to 30% indicating
catalyst deactivation.
Hydrogen was supplied externally to improve the carbon selectivity towards
alkanes (H-WSBO-D-H2 and H-WSBO-E-H2). The alkane selectivity increases when
hydrogen is added from 42-45% to 77-85%. This is due to the suppression of hydrogen
producing reforming reactions in the presence of external hydrogen. Catalyst deactivation
can be the reason for the low conversion observed as the H-WSBO-D-H2 data was
Page 102
83
gathered on the same catalyst after the collection of H-WSBO-D data. At low WHSV
(0.2 h-1
) carbon conversion was 56% with 85% alkane selectivity when the hydrogen was
supplied externally (H-WSBO-E-H2). When hydrogen is supplied externally, very high
hexane and pentane selectivities are observed with almost complete suppression of
methane formation (Figure 5-6). Moreover, the hexane and pentane carbon selectivity
does decrease with increasing conversion.
The alkane selectivity is a function of relative rates of dehydration and
hydrogenation reactions. Hydrochloric acid was added to the reaction mixture to increase
the rate of dehydration reactions. HCl was added to the aqueous fraction of bio-oil before
the hydrogenation step to a HCl concentration of 1 wt%. The product was then subjected
to the aqueous phase dehydration/hydrogenation. The gas phase carbon conversion did
not increase when HCl was added. However, the alkanes carbon selectivity increased
with and without hydrogen being co-fed to the reactor (see H-WSBO-HCl-H2 and H-
WSBO-HCl). Low methane selectivity and a fairly even distribution of C2 to C6 alkanes
is observed in case of the acidified feed (see Figures 5-5 and 5-6). Up to 97% selectivity
alkanes was observed when HCl was added to the feed and hydrogen was supplied
externally. HCl addition especially suppresses the methane formation. However it also
increase the selectivity to propane. Hydrochloric acid might catalyze the retro-aldol
condensation reactions of sorbitol producing C3 alcohols and hence increasing the
propane selectivity.
Page 103
84
The process flow diagram for the production of alkanes from the aqueous fraction
of the bio-oil is shown in Figure 5-7. The amount of alkanes produced is shown with
100% carbon conversion to alkanes. The process is essentially the same as that for APR,
except that the APR reactor is replaced by the APDH reactor. Theoretically when
hydrogen is not supplied externally, about 18.0 to 20.4 kg h-1
of C1 to C6 alkanes mixture
can be produced from 100 kg h-1
of bio-oil (62.2 kg h-1
WS-OWBO). At the same time,
3.5 to 16.0 kg h-1
of CO2 and 8 kg h-1
of CH4 will be produced. The composition of the
alkane mixture produced depends on the composition of WSBO. Hydrogen can be
supplied externally to the APDH reactor to increase the carbon selectivity towards
alkanes.
Figure 5-7 Process flow diagram for the aqueous phase dehydration/hydrogenation of
bio-oil.
Aq. Phase of Bio-oil
(62.2 kg/h WSBO + 100 kg/h Water )
Low Temp.
Hydrogenation
Aqueous Phase
Dehydration/Hydrogenation
C1 to C6 Alkanes
(18 to 20.4 kg/h and CO2 (3.5 to 16 kg/h), depending on BO
composition
WSBO
Purge
WSBO Separation
System
Polyols
(optional)
Separation
System
WSBO
RecycleHydrogen
(3.7 kg/h + excess)
Hydrogen
(optional)
Hydrogen
Recycle
Water
Methane (8 kg/h) +
excess Hydrogen
Page 104
85
In our experiments, alkanes are produced at modest yields from the aqueous
fraction of bio-oil over a bi-functional catalyst. Conversion for bio-oil is almost half of
that for sorbitol. From Figure 5-7 it can be seen that, 0.289 to 0.328 gm alkanes can be
produced per gram of WS-OWBO. We were able to produce up to 0.139 gm alkanes per
gram of WS-OWBO, which is 42-48% of the theoretical yield. The alkane selectivity and
the heavier alkane distribution are better for the bio-oil than the sorbitol. The alkane
selectivity can be altered by supplying hydrogen externally or by adding a strong acid to
the feed. External hydrogen suppresses the C-C bond breaking reactions that produce CO
and CH4 as the by-products. The near absence of methane when hydrogen is supplied
externally implies that the methane is a result of C-C bond breaking reactions and not of
dehydration/hydrogenation reactions of bio-oil component containing a single carbon
atom (e.g. methanol). The strong acid can act as dehydration catalyst and hence can
expedite the dehydration reactions resulting in higher alkanes selectivity.
The theoretical selectivities for the individual alkanes from WSBO and H-WSBO
can be calculated from the composition shown in Figure 5-8. These theoretical
selectivities assume that no carbon-carbon bond cleavage occurs in aqueous-phase
dehydration hydrogenation. This provides an upper limit for alkane production by APDH.
In Figure 5-8 the theoretical selectivities are compared with the actual selectivities
observed for H-WSBO-E-H2. Theoretically no methane should be produced from the H-
WSBO but in actuality up to 16% methane selectivity is observed for H-WSBO (see
Figure 5-5). This implies the presence of C-C bond cleaving reactions during APDH. The
actual ethane selectivity is lower than the theoretical value, implying that C2 compounds
Page 105
86
are involved in the production of methane. Butane and pentane selectivities are higher
than what is expected theoretically, implying that other than the respective C4 and C5
compounds, these alkanes are also produced from the C6 compounds.
Figure 5-8 Theoretical and actual alkane selectivities for the production of alkanes from
the aqueous fraction of the bio-oil. Legend (refer Table 5-3): ( ) WSBO - theoretical,
( ) H-WSBO - theoretical, ( ) H-WSBO-E-H2 (experimental).
In this study, only smaller alkanes (C1 to C6) are produced from the aqueous
fraction of the bio-oil. These alkanes are less valuable as fuel. The aqueous fraction of the
bio-oil can essentially be used to produce larger gasoline range alkanes by carrying out
some C-C bond formation reactions (e.g. aldol condensation) within it followed by
APDH.(16, 17)
Presence of various aldehydes and ketones makes the bio-oil aqueous
fraction an excellent candidate for such a reactions.
0
20
40
60
80
1 2 3 4 5 6
Carb
on
alk
nae s
ele
cti
vit
y (%
)
Alkane Carbon Number
Page 106
87
5.7 Conclusion
The general conclusion from this study is that hydrogen and alkanes can be
produced from the aqueous fraction of bio-oil by aqueous phase processing. Thus,
previous work on aqueous phase processing of model biomass compounds12,13,33
can be
applied to processing of feedstocks derived from lignocellulosic biomass. This thus offers
a new concept for the conversion of lignocellulosic biomass into fuels and chemicals. The
first step in this process is to add water to the bio-oil and separate it into aqueous and
organic phases. The aqueous phase is then sent to a low temperature hydrogenation unit
where thermally unstable functionalities are hydrogenated to thermally stable
compounds. In this hydrogenation step aldehydes are converted to alcohols, sugars to
sugar alcohols, and aromatics are hydrogenated. Undesired methane is also formed from
this reaction. A key need in this low temperature step is to reduce the amount of
hydrogen that is consumed.
Hydrogen is produced at a hydrogen selectivity of 60% from the water soluble
part of bio-oil. This selectivity is comparable to that observed for pure sorbitol at similar
conversions. This makes bio-oil a feasible feedstock for the production of hydrogen. We
have demonstrated here the feasibility to produce hydrogen from the water soluble bio-
oil, but future research is needed to determine how the carbon conversion to gas phase
can be increased maintaining the high selectivity. Concerns about catalyst stability must
also be answered to efficiently use aqueous phase processing.
Page 107
88
Alkanes are produced from the water soluble bio-oil by aqueous-phase
dehydration/hydrogenation with a bifunctional catalyst. An alkane selectivity of 77% is
obtained when hydrogen is co-fed with the bio-oil. Alternatively, an alkane selectivity of
45% is obtained when hydrogen is produced insitu from the bio-oil itself. The C5 plus C6
carbon selectivity ranges from 35 to 76% depending on the process conditions.
The advantage of this bio-oil processing approach is that we process the aqueous
phase of the bio-oil differently than the organic phase. The aqueous phase is significantly
different in composition than the organic phase. This will allow us to design catalysts that
are well suited for conversion of both the aqueous and organic phases. We believe that in
the future this will allow us to achieve higher overall yields for conversion of bio-oils
into liquid fuels and chemicals. It would be advantageous to separate smaller molecules
from the bio-oil prior to hydrotreating especially since these molecules form lighter gases
during hydrotreating. These smaller molecules could then be sold as chemicals or
reformed to hydrogen. Bio-oil composition changes depending on the feedstock. We
envision that our process can handle any type of bio-oil. All the small aldehyde and
ketonic functionalities in the aqueous fraction will be converted to corresponding polyols.
These small polyols are excellent feedstock for the production of hydrogen and alkane.
Bio-oil with high ash content can be a challenge to process as he Na, K, Ca and Mg salts
in the ash can land up in the aqueous fraction and can de-activate the APP catalyst. For
these reactions to become an industrial process the overall yield must be increased.
Catalyst deactivation problems must be overcome and more active catalyst must be
developed. However, in spite of these current difficulties it is highly likely that more
Page 108
89
efficient catalytic processes will be developed for the conversion of pyrolysis oils through
understanding the chemistry of this process and developing new generations of catalysts.
Page 109
90
Chapter 6
HYDROPROCESSING OF BIO-OIL
6.1 Introduction
Pyrolysis oils needs to be deoxygenated to a mixture of organic molecules that are
more compatible with current fuels and chemicals infrastructure.(30)
The batch reactor
hydrogenation studies described in Chapter 5 suggest that the aqueous fraction of the bio-
oil (WSBO) can be an excellent feedstock to produce small oxygenated gasoline
additives as well as valuable C2 to C6 diols. The challenge with WSBO hydrogenation is
minimizing the hydrogen consumption and carbon loss to the gaseous products while
achieving high selectivity to desired products. The low temperature hydrogenation (LTH)
of the aqueous fraction of the bio-oil was further studied in detail in a trickle-bed reactor
with both gas and liquid flowing in downward direction. For the hydrogenation reactions
the trickle-bed reactor is expected to perform better due to the high hydrogen
concentration in it as compared to batch reactor. In a batch reactor without a gas sparging
impeller, hydrogen concentration is limited by its solubility in solvent. Hydrogen
solubility in water is low.(64)
Hence the flow reactor is expected to perform better than
batch reactor. The main objective in LTH step is to reduce the carbon loss to gas phase
while hydrogenating all the bio-oil functionalities. We were able to reduce all the WSBO
functionalities except carboxylic acids to corresponding alcohols by LTH. The LTH
product contains a significant amount of sorbitol, coming from the hydrogenation of
glucose and levoglucosan. A high temperature hydrogenation (200-275 °C) step with
Pt/C catalyst was added in series after low temperature hydrogenation to convert sorbitol
Page 110
91
to the desired products. We could convert about half the carbon in the water soluble pine
wood bio-oil to gasoline range oxygenated additives, and C2 to C6 diols. Whole bio-oil
was also hydrotreated. The next section summarizes the past bio-oil hydroprocessing
efforts.
6.2 Bio-oil Hydroprocessing: State of the Art
Several approaches toward the bio-oil upgrading are currently being studied
including hydrotreating of bio-oils(30, 65, 66)
, zeolite conversion of bio-oils(32, 33, 60, 67)
,
aqueous phase processing of bio-oils(29)
, and bio-oil model compounds hydrogenation
studies(68-70)
. However, none of these approaches are utilized commercially today
primarily because they produce low yields of fungible products. The majority of the past
bio-oil hydrotreating efforts have revolved around using γ-Al2O3 supported sulfided
CoMo and NiMo catalysts. Elliott and Baker hydrotreated poplar wood bio-oil over
sulfided CoMo catalyst at 355 °C and 2000 psi.(65)
Only about 23 wt% bio-oil was
converted to the deoxygenated product. Single stage hydrotreating of bio-oil over
sulfided CoMo at temperatures over 310 °C resulted in heavy tar and coke plugging the
reactor system.(30)
A two stage hydrogenation process was hence developed. In the first
stage, bio-oil was first stabilized by passing over Ni or sulfided CoMo catalyst at 2060
psi and temperatures in the range of 250-310 °C. The stabilized bio-oil was then
hydrotreated over sulfided CoMo catalyst at 353 °C and 2060 psi to produce a
deoxygenated liquid product containing 44% of the original bio-oil carbon. This process
suffers from drawbacks such as: need to use sulfided catalysts which can contaminate the
end product, severe reaction conditions, hydrothermal instability of γ-Al2O3 support, and
Page 111
92
need to use low space velocities. Hydrogen consumption was about 8 g H2/100 g carbon
in feed. A relatively low LHSV of 0.07 volume of oil / volume of catalyst / h was used in
the second step. A single stage non-isothermal bio-oil hydroprocessing over CoMo
catalyst was also developed in the same group. The temperature at the reactor inlet was
250-260 °C and the temperature at the reactor outlet was 370-400 °C with the pressure of
2000 psi. The results for two different space velocities for hardwood vacuum pyrolysis
bio-oil are shown in Table 6-1. The non-isothermal hydroprocessing works well only at
low space velocities as seen in the Table 6-1. At low space velocity (0.13 vol oil/vol
cat/h), hydrogen consumption is high and a large amount of carbon is lost to the gas
phase. Several problems such as reactor plugging due to coking, difficulty in closing
material balance, and accumulation of highly viscous tar-like material in the reactor were
faced during these studies. Low temperature (< 100 °C) hydrogenation of the whole bio-
oil was studied by Scholze on various metal based catalysts including Pd, Ni and Cu. Any
hydrogenation above 80 °C resulted in phase separation in product. Also it was not
established if hydrogenation increased the stability of bio-oil or not.(71)
Table 6-1 Non-isothermal hydroprocessing of vacuum pyrolysis bio-oil*
LHSV (vol oil / vol catalyst / h) 0.28 0.13
Inlet temperature (°C) 262 258
Outlet temperature (°C) 371 400
Pressure (psi) 2000 2000
H2 consumption (L/L oil)
(L/L bio-oil)
379 711
Oxygen in product (wt%) 9.0 0.8
Carbon conversion to gas (%) 23.9 35.5
Oil product yield (L/L feed) 0.29 0.42
* data taken from reference (30)
Page 112
93
Bio-oil hydrodeoxygenation with conventional hydrotreating catalysts suffers
with coking and catalyst deactivation problems. The hydrogen consumption is high and
the process requires the use of severe operating conditions. The CoMo, NiMo based
catalysts require presence of sulfur to maintain activity. Since the biomass based
feedstock do not contain a considerable amount of sulfur it is best to avoid any external
addition of sulfur to keep the process clean. Also the conventional CoMo, NiMo catalysts
are supported typically on γ-alumina, which is unstable at high temperature in the
presence of water. In fact Maggi and Delmon report that guaiacol and catechol form coke
during hydrodeoxygenation on the catalyst support rather than on metal. Any compound
with two or more oxygen atoms attached to benzene ring was found be the source of
coke. They also found that activated carbon is better support with respect to selectivity
than γ-alumina albeit with low activity.(68)
The drawbacks of the sulfided CoMo/Al2O3
catalyst can be avoided by using supported noble metal catalyst. Elliott have studied the
two step hydrotreating of bio-oils from different sources.(30)
First step was on Pd/C
catalyst at 310-360 °C and 2060 psi followed by a second hydrocracking step on
conventional sulfided catalysts at 405 °C and 1500 psi. However, coking of catalyst and
plugging of reactor system was observed for the first hydrogenation step.
6.3 Experimental
The materials and methods for this study is described in Sections 2.1, 2.4, 2.5,
2.6.2, and 2.8. Pine wood bio-oil and DOE bio-oil were used in these studies.
Page 113
94
6.4 Homogeneous Reactions
Bio-oil is thermally unstable due to the presence of reactive functionalities such as
aldehydes, ketones, acids, and sugars. Several chemical and physical changes occur in
bio-oil when it is stored for long time or when it is heated. These changes are due the
polymerization reactions occurring within various bio-oil components resulting in
increase in viscosity and average molecular weight of bio-oil as described in Chapter 4.
Water content of the bio-oil also increases upon storage and heating due the condensation
polymerization reactions.
First we studied the homogeneous reaction of the aqueous fraction of bio-oil by
hydrogenating it in the absence of any catalyst. The results are depicted in Figure 6-1.
The homogeneous reactions are clearly present at 125 °C. Hydroxyacetaldehyde and
sugars are especially reactive and we see a drop of more than 20% in their concentrations.
No major products are observed indicating coke formation or polymerization reactions.
At 150 °C, a 40% drop in the concentration is observed for Hydroxyacetaldehyde and
sugars. Levoglucosan is highly reactive at 150 °C with about 90% disappearing due to
homogeneous reactions. Acetic acid, hydroxyacetone, and phenolic compounds are quite
stable with respect to homogeneous reactions up to 150 °C. Some of the sugars or
levoglucosan might have converted to 5-HMF as we see increase in its concentration at
150 °C. The reactor plugged while running at 150 °C within 24 hours. Black tar like
material was found in the reactor tube after the reaction, indicating coking. Due to the
presence of homogeneous reactions all the catalytic experiments were done without any
Page 114
95
void space in the reactor. The effect of temperature experiments does have a void space
in reactor as these experiments were carried out before studying the homogeneous
reactions in bio-oil.
Figure 6-1 Reactivity of feed components during homogeneous reactions in aqueous
fraction of pine wood bio-oil, P: 750 psi, feed flow rate: 0.04 ml min-1
, temperature is in
°C.
Hydroxyacetaldehyde is stable to temperatures up to 350 °C.(72)
Hence its
observed disappearance during the homogeneous reactions at 125-150 °C can only be due
to its reactions with other bio-oil components, possibly with sugars or lignin oligomers.
Levoglucosan is also stable to temperatures up to 600 °C.(73)
Its disappearance can be due
to its reactions with other bio-oil components or it can also get converted to glucose by
hydrolysis at 150 °C as aqueous fraction of the bio-oil is an acidic medium. Glucose can
further react with lignin oligomers that can be present in WSBO. Xiang et al. have shown
that glucose can decompose by reacting with acid soluble lignin in dilute-acid hydrolysis
0.0
100.0
200.0
300.0
400.0
500.0
600.0
mm
ol-
C/L
Feed T = 125 T = 150
Page 115
96
environment at 200 °C.(74)
These reactions can possibly proceed even at temperature as
low as 125 °C.
6.5 Single Stage Hydrogenation of Water Soluble Pine Wood Bio-oil
6.5.1 Effect of Temperature
The Low Temperature Hydrogenation (LTH) step stabilizes the bio-oil by
hydrogenating the carbonyl groups in it. In Section 5.4 we discussed the LTH data in a
batch reactor. During the LTH, a fraction of carbon in WSBO is lost to the gas phase,
predominantly in the form of methane. It is thus imperative to use lowest possible
temperature so as to minimize the carbon loss to gas phase. We studied the effect of
temperature in the range of 75-175 °C on the conversion of various components of the
aqueous fraction of PWBO. The data obtained are depicted in Table 6-2. These
experiments were done with void space (about 50%) in the reactor as this data is
collected before studying the extent of homogeneous reactions in LTH of WS-PWBO. At
75 °C, only 2-furanone, furfural and 5-HMF show a significant activity towards
hydrogenation. Only 4% conversion of total reactants is observed at 75 °C. At 100 °C,
hydroxyacetaldehyde and 3-methyl-1,2-cyclopentadione start disappearing.
Hydroxyacetone, phenol, guaiacol, catechol, levoglucosan, and sugars start reacting at
125 °C. About 90% conversion is observed for all the major reactants at 150 °C except
acetic acid and phenol. Acetic acid is resilient to hydrogenation at temperatures below
175 °C. At 175 °C, reactor plugging was observed. The reactants and products
concentration in feed and products of this experiment are shown in Table 6-3.
Page 116
97
Table 6-2 Effect of temperature on reactant conversions for LTH of WS-PWBO
Compound Conversion (%)
T: 75 °C 100 °C 125 °C 150 °C 175 °C
Hydroxyacetaldehyde 0 38 93 100 100
Acetic acid 0 0 16 13 10
Hydroxyacetone 0 0 58 96 100
2-Furanone
89 88 72 74 97
Phenol 2 1 37 39 33
3-Methyl-1,2-cyclopentadione 14 46 100 100 100
Guaiacol 6 13 100 100 100
Catechol 4 12 56 87 95
Furfural 71 73 100 100 100
5-Hydroxymethylfurfural 59 73 89 100 100
Levoglucosan 3 8 53 100 100
Sugars 11 14 N/A 97 99
Total 4 16 57 89 90
Catalyst: 5wt% Ru/C, WHSV: 3 h-1
, P: 750 psi, H2 flow rate: 150 ml min-1
, feed: ~13wt%
WS-PWBO solution in water
Page 117
98
Table 6-3 Reactant and product concentration for low temperature hydrogenation of WS-
PWBO at different temperatures Compound Product Concentration (mmol-C L-1)
Feed Temperature (°C)
75 100 125 150 175
Reactants
Hydroxyacetaldehyde 376.2 386.2 233.2 24.9 0.0 0.0
Acetic acid 191.9 205.2 203.9 161.9 166.6 172.1
Hydroxyacetone 160.9 196.4 203.8 67.4 5.8 0.0
2-Furanone
34.1 3.7 4.1 11.6 8.9 1.1
Phenol 2.2 2.2 2.2 1.4 1.4 1.5
3-Methyl-1,2-Cyclopentadione 43.4 37.2 23.3 0.0 0.0 0.0
Guaiacol 9.4 8.8 9.1 8.3 0.0 4.0
Catechol 247.1 237.4 218.2 108.1 33.1 13.5
Furfural 17.78 5.2 4.9 0.0 0.0 0.0
5-Hydroxymethylfurfural 57.4 23.6 15.6 6.4 0.0 0.0
Levoglucosan 602.4 582.5 553.2 280.8 0.0 0.0
Sugars 171.9 153.8 148.7 163.3 4.8 0.9
Products
Methanol 15.1 34.0 40.6 23.1 22.1 16.0
Ethanol 0.0 3.1 3.6 8.9 10.1 10.8
1-Propanol 0.0 3.9 2.2 4.0 6.8 8.7
1-Butanol 0.0 0.0 0.0 2.6 3.2 4.3
1-Pentanol 0.0 0.0 0.0 0.0 0.0 2.7
Ethylene glycol 0.0 139.8 287.0 275.5 185.6 128.9
Cyclopentanol 0.0 0.0 0.0 2.0 5.6 7.7
Propylene glycol 0.0 4.4 6.1 96.5 153.8 139.5
Cyclohexanol 0.0 0.0 0.0 3.5 37.3 38.1
1,2-Butanediol 0.0 0.0 0.0 23.1 49.2 30.0
Tetrahydrofurfuryl alcohol 0.0 10.0 11.2 10.8 18.0 23.6
1,4-Butanediol 0.0 2.8 11.5 33.6 27.8 17.7
γ-Butyrolactone 0.0 54.2 57.3 55.0 72.7 60.5
γ-Valerolactone 0.0 0.0 0.0 4.1 7.0 8.7
Glycerol 0.0 13.4 16.7 10.0 11.6 5.4
1,2-Cyclohexanediol 0.0 0.0 0.0 2.6 32.0 33.0
Hydroxymethyl-γ-butyrolactone 0.0 22.1 22.7 29.2 27.7 17.0
Sorbitol 0.0 48.8 37.7 36.0 67.2 12.1
Total C identified 1929.7 2178.6 2116.7 1453.9 958.2 757.7
Carbon content by TOC 2633.3 2519.6 2539.0 2451.5 1971.2 1680.9
%C lost to gas phase - 4 4 7 25 36
Catalyst: 5wt% Ru/C, WHSV: 3 h-1, P: 750 psi, H2 flow rate: 150 ml min-1, feed: ~13wt% WS-PWBO solution in water
Page 118
99
The major products from the LTH of WS-PWBO are ethylene glycol, propylene glycol,
butanediols and γ-butyrolactone as shown in Table 6-3. The products concentration
maximizes at 125 °C. More propylene glycol is observed at 150 °C but the ethylene
glycol starts undergoing secondary reactions at that temperature. A large amount of
carbon (25.2%) is lost to gas phase (mostly methane and ethane) at 150 °C. For the
process to be economically attractive this carbon loss needs to be minimized. The carbon
loss to gaseous compounds is moderate (7%) at 125 °C with all the bio-oil components
showing reasonable hydrogenation activity. Ethylene glycol concentration is also a
maximum at 125 °C. Due to all these reasons we chose 125 °C as the optimum
temperature for any further LTH experiments. The experiments depicted in Tables 6-2
and 6-3 are carried out at comparatively high space velocity of 3 h-1
. In the next section
we show that almost 100% conversion of all the reactants except acetic acid is achievable
at 125 °C with lower space velocities. Also the catalyst was very stable with no signs of
deactivation or coking. We studied the catalyst stability for 5 wt% Ru/C catalyst with
WS-PWBO feed at WHSV of 1.5 h-1
for 78 hours. No catalyst activity loss was observed
over the studied time period.
6.5.2 Effect of Space Velocity
The effect of space velocity on the LTH of WS-PWBO was studied at 125 °C and
the data are shown in Table 6-4 and 6-5. The experiments were carried out at 125 °C as
that was the optimum temperature for LTH as discussed in the previous section. At a
space velocity of 6.0 h-1
, only guaiacol, furfural and 5-HMF are completely converted.
Note that the concentrations of guaiacol and furfural in the feed were very low (Table 6-
Page 119
100
5). Hydroxyacetaldehyde and hydroxyacetone show near complete conversion. The
concentration of ethylene glycol in the product at WHSV of 3 h-1
is more than the
concentration of hydroxyacetaldehyde in the feed. This implies that ethylene glycol is
also formed some other feed component than hydroxyacetaldehyde. Sugars can produce
ethylene glycol by hydrogenolysis.(75)
The conversion 2-furanone shows a reverse than
expected trend implying that it may be formed during LTH from some other bio-oil
components. All of the components show 90% or more conversion at the lowest space
velocity of 0.75 h-1
except for acetic acid and 2-furanone. Acetic acid hydrogenation
requires high temperatures and pressures.(76)
Elliott and Hart obtained 96% conversion for
acetic acid on Ru/C catalyst at 250 °C and 2000 psi with only 4% selectivity to ethanol.
Maximum ethanol selectivity of 34% was seen at the acetic acid conversion of 60%.(70)
Table 6-4 Effect of space velocity on conversion of reactants in LTH of WS-PWBO
Compound Conversion (%)
WHSV: 0.75 h-
1
1.5 h-1 3.0 h-1
6.0 h-1
Hydroxyacetaldehyde 100.0 100.0 100.0 96.8
Acetic acid 12.6 9.8 16.8 13.3
Hydroxyacetone 100.0 100.0 100.0 92.8
2-Furanone
25.9 27.8 42.6 57.4
Phenol 100.0 100.0 100.0 92.4
3-Methyl-1,2-cyclopentadione 100.0 100.0 100.0 96.0
Guaiacol 100.0 100.0 100.0 100.0
Catechol 100.0 100.0 100.0 68.6
Furfural 100.0 100.0 100.0 100.0
5-Hydroxymethylfurfural 100.0 100.0 100.0 100.0
Levoglucosan 91.2 76.7 47.6 32.1
Sugars 89.3 54.5 65.3 0.7
Total 85.0 78.1 70.7 56.6
Catalyst: 5wt% Ru/C, T: 125 °C, P: 750 psi, H2 flow rate: 150 ml min-1
, feed: ~13wt%
WS-PWBO solution in water
Page 120
101
Table 6-5 Reactant and product concentration for LTH of WS-PWBO at different space
velocities
Compound Concentration (mmol-C L-1)
Feed Product
0.75 h-1 1.5 h-1 3.0 h-1 6.0 h-1
Reactants
Hydroxyacetaldehyde 427.6 0.0 0.0 0.0 13.8
Acetic acid 244.1 213.4 220.2 203.2 211.7
Hydroxyacetone 199.3 0.0 0.0 0.0 14.3
2-Furanone
37.6 27.9 27.2 21.6 16.0
Phenol 2.5 0.0 0.0 0.0 0.2
3-Methyl-1,2-cyclopentadione 45.7 0.0 0.0 0.0 1.8
Guaiacol 10.3 0.0 0.0 0.0 0.0
Catechol 249.8 0.0 0.0 0.0 78.4
Furfural 20.9 0.0 0.0 0.0 0.0
5-Hydroxymethylfurfural 63.9 0.0 0.0 0.0 0.0
Levoglucosan 652.5 57.7 152.2 341.8 443.1
Sugars 124.4 13.4 56.7 43.1 123.6
Products
Methanol 24.4 70.2 49.0 49.1 49.9
Ethanol 0.0 47.8 18.2 19.7 16.8
1-Propanol 7.9 37.1 8.3 9.7 8.0
1-Butanol 0.0 13.1 4.6 4.4 3.9
1-Pentanol 0.0 4.1 0.0 0.0 0.0
Ethylene glycol 0.0 450.6 413.2 498.0 495.7
Cyclopentanol 0.0 18.0 15.5 9.5 12.2
Propylene glycol 0.0 246.7 240.5 236.1 231.5
Cyclohexanol 0.0 120.0 122.2 124.6 74.2
1,2-Butanediol 0.0 56.4 74.0 32.1 23.5
Tetrahydrofurfuryl alcohol 0.0 29.8 18.8 1.0 2.7
1,4-Butanediol 0.0 32.8 48.8 54.2 52.5
γ-Butyrolactone 0.0 81.9 99.1 103.0 83.5
γ-Valerolactone 0.0 9.5 8.6 9.6 3.0
Glycerol 0.0 45.6 19.4 30.5 28.0
1,2-Cyclohexanediol 0.0 102.8 106.9 N/A 104.8
Hydroxymethyl-γ-butyrolactone 0.0 19.7 66.0 70.1 69.3
Sorbitol 43.8 497.4 602.4 386.9 186.2
Total C identified
(Reactants + Products)
2154.7 2195.9 2369.9 2355.4 2307.5
Carbon content by TOC 3879.3 3356.2 3634.7 3590.3 3669.3
%C lost to gas phase - 13.5 6.3 7.5 5.4 Catalyst: 5wt% Ru/C, T: 125 °C, P: 750 psi, H2 flow rate: 150 ml min
-1, feed: ~13wt% WS-PWBO solution
in water
Page 121
102
The product distribution in the LTH of the aqueous fraction of pine wood bio-oil
at different space velocities is shown in Table 6-5. The concentration of various products
maximizes at different space velocities. The monohydric alcohols (includes methanol,
ethanol, 1-propanol, 1-butanol and 1-pentanol, cyclopentanol) concentration is highest at
0.75 h-1
. The concentration of diols such as ethylene glycol and butanediols maximizes at
3 h-1
. This implies that the monohydric alcohols mentioned above are formed from the
secondary reactions of diols. At lower space velocity ethylene glycol seems to undergo
secondary reactions. The possible secondary products are methane and ethanol.
Hydroxyacetaldehyde in the feed is converted to ethylene glycol upon hydrogenation.
Hydroxyacetaldehyde concentration in the feed is 427.6 mmol-C L-1
. Maximum ethylene
glycol concentration observed is 498.0 mmol-C L-1
. This means that ethylene glycol is
also produced from some other compound than hydroxyacetaldehyde. Ethylene glycol
can be produced from sorbitol or glucose by hydrogenolysis.(77-79)
Propylene glycol is
produced by the hydrogenation of hydroxyacetone. Feed concentration of
hydroxyacetone is 199.3 mmol-C L-1
, whereas maximum concentration of propylene
glycol observed is 246.7 mmol-C L-1
. This gives an idea that all of the propylene glycol is
produced from the hydroxyacetone. Propylene glycol and glycerol can be produced from
sorbitol by hydrogenolysis.(77-79)
A small amount of glycerol is seen in the product. Some
propylene glycol may have been produced from sorbitol by hydrolysis but we cannot
determine that based on the numbers we have as some propylene glycol may react further
under the reaction conditions. Cyclohexanol and 1,2-cyclohexanediol are formed by the
hydrogenation of guaiacol and catechol. This is different than what Elliott and Hart
observed. They hydrogenated guaiacol over Ru/C catalyst at temperatures from 150-250
Page 122
103
°C and obtained 2-methoxycyclohexanol (at 150 °C and 200 °C) and Cyclohexanol (at
250 °C) as major products.(70)
Gamma-butyrolactone (γ-GBL) seems to have another
source than 2-furanone as significantly more γ-GBL is produced than stoichiometrically
possible from 2-furanone. This extra source of γ-GBL is unknown. The sorbitol
concentration reaches a maximum at WHSV of 1.5 h-1
. Sorbitol undergoes secondary
reactions at the space velocity of 0.75 h-1
with methane being the primary product. A
significant amount of hexane is observed in the gas phase products but we are not sure of
the identification of this peak in GC-FID.
At low space velocity (0.75 h-1
), 13.5% carbon is lost to the gas phase with
methane being the major gas phase product. At the space velocities of 1.5 to 6 h-1
, the
carbon loss to gas phase products is essentially the same at around 6%. The amount of
carbon identified in gas phase by GC at low space velocities (0.75 and 1.5 h-1
) is more
than what we found in gas phase by TOC analysis. This can be due to the calibration or
product identification error in GC-FID.
6.6 Two-stage Hydrogenation of Water Soluble Pine Wood Bio-oil
The overall goal of the hydrogenation process is to produce valuable fuels and
chemicals from the aqueous fraction of bio-oil. We divided the products obtained from
the WSBO hydroprocessing in 10 different groups, C1 to C4 alkanes and other gas phase
products, gasoline cut 1, gasoline cut 2, C2 to C6 diols, lactones, acetic acid, sorbitol,
Page 123
104
other compounds, levoglucosan, and unidentified (see footnote of Table 6-6 for the list of
components of each product group). Gasoline cut 1, gasoline cut 2, and C2 to C6 diols
are considered as the valuable products. Gasoline cut 1 consists of monohydric alcohols
boiling in the temperature range of 65-99 °C. Gasoline cut 2 consists of monohydric
alcohols boiling in the temperature range of 115-175 °C. Figure 6-2 shows the product
selectivity for the hydrogenation of WS-PWBO over Ru/C catalyst at 125 °C, 750 psi and
at the WHSV of 3.0 h-1
. We achieved our best yield to the desired products at these
reaction conditions. It can be seen in Figure 6-2 that less than 30% of the carbon in the
feed is converted to gasoline cut 1, gasoline cut 2, and C2-C6 diols in the single stage
process. The product of single stage hydrogenation of WS-PWBO still contains a
considerable amount of sorbitol and levoglucosan. In order to improve the process
economics it would be vital to convert these compounds to valuable products. A second
high temperature hydrogenation stage is thus added after the low temperature stage to
maximize the yield of valuable products from bio-oil. Two different catalysts were
studied in the high temperature stage, 5wt% Ru/C and 5 wt% Pt/C. The first stage was
operated at 125 °C with 5wt% Ru/C catalyst. Table 6-6 depicts the results for 2-stage
hydrogenation of WSBO with Ru/C catalyst in both the stages. The single stage data is
also shown in the last column of Table 6-6 for the comparison.
Page 124
105
Table 6-6 Product yield and selectivity in 2-stage hydrogenation of WS-PWBO over Ru/C
catalyst in both the stages. Pressure: 750 psi for both the stages, first stage catalyst: 5wt% Ru/C,
temperature: 125 °C, second stage catalyst: 5 wt% Ru/C
Second Stage T (°C) 200 220 250 250 Single Stage
WHSV (hour-1
) 3 3 3 6 3
Product Group Carbon Yield (%)
C1-C4 alkanes &
other gas phase
products
24.3 27.2 57.5 18.2 7.5
Gasoline cut 1 6.1 5.5 11.9 4.8 2.0
Gasoline cut 2 5.6 6.6 9.0 6.2 6.3
C2 to C6 diols 12.2 15.4 3.8 17.0 21.1
Lactones 1.5 3.5 0.4 4.1 2.9
Acetic acid 4.2 4.2 1.1 4.4 5.2
Sorbitol 9.4 4.1 0 6.4 10.0
Other chemicals 2.2 3.1 1.8 2.9 1.9
Levoglucosan 0 0 0 0 8.8
Unidentified 34.5 30.4 14.5 36.0 34.3
Individual compounds in different product groups are as follows,
1. C1-C4 alkanes & other gas phase compounds: methane, ethane, propane, butane and other gas
phase compounds which have not been identified.
2. Gasoline cut 1 (boiling range: 65-99 °C): pentane, hexane, methanol, ethanol, 1-propanol,
tetrahydrofuran, 2-butanol, and 2-methyltetrahydrofuran.
3. Gasoline cut 2 (boiling range: 115-175 °C): 1,2-cyclohexanediol, 2,5-dimethyltetrahydrofuran,
1-butanol, 2-pentanol, 1-pentanol, cyclopentanol, 2-hexanol, 3-methylcyclopentanol,
cyclohexanol, 3-methylcyclohexanol, and 4-methylcyclohexanol.
4. C2 to C6 diols: 2,3-butanediol, propylene glycol, ethylene glycol, 1,2-hexanediol, 1,4-
hexanediol, 1,4-butanediol, and 1,4-pentanediol.
5. Lactones: γ-butyrolactone and γ-valerolactone
6. Other chemicals: tetrahydrofurfuryl alcohol, 1,2,6-hexanetriol, 1,2,3-butanetriol, and glycerol
Page 125
106
Figure 6-2 Product distribution from the hydrogenation of WS-PWBO over Ru/C
catalyst at 125 °C, 750 psi and at the WHSV of 3.0 h-1
.
As seen in Table 6-6, addition of a second stage with Ru/C catalyst results in
reduction in the total yield of valuable products. All of the levoglucosan disappeared even
at the lowest temperature used (200 °C). In the hydrogenation process, levoglucosan is
first converted to glucose by hydrolysis and then glucose is further converted to sorbitol
by hydrogenation. The levoglucosan disappearance is not accompanied by corresponding
increase in sorbitol concentration, implying that sorbitol is further converted to secondary
products. Sorbitol can undergo hydrogenolysis under the reaction conditions used,
resulting in products such as ethylene glycol, propylene glycol, butanediols, and glycerol.
No such products are observed, implying sorbitol is directly reformed to gaseous
products or the products obtained from sorbitol are further reformed to gaseous products.
Methane is the predominant component in the gaseous products. About a quarter of
carbon in the WSBO is lost to the gas phase upon 2-stage hydrogenation over Ru/C
7.52.0
6.3
21.1
2.95.2
10.0
1.9
34.3
8.8
C1 to C4 alkanes & other gas phase productsGasoline cut 1
Gasoline cut 2
C2 to C6 diols
Lactones
Acetic acid
Sorbitol
Other compounds
Unidentified
Levoglucosan
Page 126
107
catalyst at temperatures in the range of 200-225 °C. The carbon loss to gas phase
increases to 57.5% at 250 °C and 750 psi pressure. Carbon loss to the gas phase can be
reduced by operating at high space velocities. Carbon loss of only 18.2% was observed at
250 °C, 750 psi at the space velocity of 6 hour-1
. However only 28.0% carbon yield is
observed to gasoline cut 1, gasoline cut 2, and C2-C6 diols combined at these reaction
conditions, lower than the single stage process (29.5% carbon yield to valuable products).
Hence Ru/C is not a good catalyst for the high temperature hydrogenation of water
soluble bio-oil components.
To overcome the drawbacks associated with Ru/C, we studied the 2nd
stage of our
process on 5 wt% Pt/C catalyst. The rate of C-C bond cleavage reactions on Pt is seven
times less than that on Ru.(80)
It was also shown in our group that Pt catalysts have high
C-O hydrogenation and low C-C bond cleavage activity in hydrodeoxygenation of
sorbitol.(75)
Maris and Davis showed that Pt can catalyze glycerol hydrogenolysis to
propylene glycol more selectively that Ru. Ru mainly produced ethylene glycol and
methane due to its high activity for C-C bond cleavage.(81)
The results for 2-stage
hydrogenation are depicted in Table 6-7 and Figure 6-3 and in more detail in Table 6.8.
The first hydrogenation stage was always carried out on Ru/C catalyst at 125 °C and 3
hour-1
. Figure 6-3 A-B depicts the product distribution at 220 °C at two different
pressures. All of the levoglucosan is converted on Pt/C at 220 °C. Sorbitol being the
major product from levoglucosan, its concentration increases in the hydrogenated
product. Sorbitol also undergoes hydrogenolysis reactions at these operating conditions
producing monohydric alcohols and diols. A significant amount of sorbitol is still present
Page 127
108
in the product. The carbon yield to valuable products (gasoline cut 1 & 2, and C2 to C6
diols) has been improved to 35.4% (at 750 psi) upon second hydrogenation as compared
to for the single stage process (Table 6.7, last column). The advantage of high pressure is
a low carbon loss (8.9% at 1450 psi as compared to 15.9% at 750 psi) to gas phase
products. A significant amount of sorbitol still remains in the liquid phase products. This
sorbitol needs to be converted to valuable products to improve the process economics.
The remaining sorbitol can be converted to valuable products by increasing the second
stage temperature to 250 °C. At low pressure (750 psi) and 250 °C, about a quarter of the
carbon is lost to gas phase with 41.2% total carbon yield to gasoline cut 1, gasoline cut 2,
and C2 to C6 diols. (Figure 6-3C). All of the sorbitol has reacted at 250 °C. Carbon loss
to gas phase can be reduced by operating the reactors at high pressure. At 1450 psi,
carbon loss to gas phase products was found to be 11.7%. The carbon yield to desired
products of 45.8% was achieved at these reaction conditions. Although there is only a
4.6% difference between the desired product yield at 750 psi and 1450 psi at 250 °C, the
product distribution is significantly different (compare Figures 6-3C and 6-3D). At 750
psi, carbon yield to C2-C6 diols is 17.4%. At the same time yields of gasoline cut 1 and
gasoline cut 2 are 13.2% and 10.6% respectively. Thus a significant amount of carbon is
converted to gasoline cut 1 and 2 in the case of low pressure due to secondary
hydrogenation reactions of C2-C6 diols to corresponding monohydric alcohols. On the
other hand, 28.9% of the carbon is converted to C2-C6 diols at 1450 psi with only 8.8%
and 8.1% carbon yields to gasoline cut 1 and 2 respectively. Hence the product spectrum
can be manipulated by tuning the system total pressure so as to maximize yield to the
desired products. Further increase in second stage temperature to 275 °C resulted in the
Page 128
109
conversion of 32.4% carbon to gas phase products (Figure 6-3E). Yields of gasoline cut 2
and C2-C6 diols decreased at 275 °C due to secondary hydrogenation reactions
producing more of gasoline cut 1 and C1-C4 alkanes.
Table 6-7 Product yield and selectivity in 2-stage hydrogenation of WS-PWBO.
First stage catalyst: 5wt% Ru/C, temperature: 125 °C, second stage catalyst: 5 wt% Pt/C, WHSV for both
the stages: 3 hour-1
Second Stage
Temperature (°C)
220 220 250 250 275 Single
Stage
Pressure (psi) 1450 750 750 1450 1450 750
Product Group Carbon Yield (%)
C1-C4 alkanes &
other gas phase products
8.9 15.9 24.3 11.7 32.4 7.5
Gasoline cut 1 4.6 8.4 13.2 8.8 11.9 2.0
Gasoline cut 2 6.9 7.4 10.6 8.1 7.1 6.3
C2 to C6 diols 22.2 19.6 17.4 28.9 17.0 21.1
Lactones 5.1 3.4 2.7 4.2 3.8 2.9
Acetic acid 3.3 3.0 1.5 2.6 1.5 5.2
Sorbitol 14.8 12.7 0 0.5 0 10.0
Other chemicals 2.8 2.8 2.9 4.3 4.1 1.9
Levoglucosan 0 0 0 0 0 8.8
Unidentified 31.4 26.7 27.4 30.8 22.2 34.3
Page 129
110
Table 6-8 Composition of the two-stage water soluble pine wood bio-oil (WS-PWBO)
hydrogenation products. Feed: ~13 wt% WS-PWBO solution in water. Hydrogenation
reaction conditions: first over 5wt% Ru/C catalyst (125 °C) then over 5 wt% Pt/C
catalyst; P: 1450 psi, WHSV: 3 hour-1
Concentration
(mmol carbon L-1
)
Pressure (psi) 1450 750 750 1450 1450
2nd
stage Temperature (°C) 220 220 250 250 275
Compound
Pentane 4.5 15.9 19.8 14.5 18.0
Hexane 30.8 129.0 131.0 115.4 121.2
Acetic acid* 133.3 120.5 59.4 104.9 56.8
Levoglucosan* 0 4.4 0 0 0
Sugars* 4.4 6.6 4.4 6.5 4.1
Methanol 48.4 53.3 66.8 56.8 80.1
Ethanol 31.6 45.4 133.7 47.9 115.5
1-Propanol 18.7 34.1 80.2 42.5 59.8
Tetrahydrofuran 6.0 9.0 21.4 6.1 9.8
2-Butanol 7.6 8.6 13.1 15.0 17.9
2-Methyltetrahydrofuran 15.5 17.0 23.3 21.5 22.0
2,5-
Dimethyltetrahydrofuran 14.4 18.9 25.6 19.7 17.0
1-Butanol 8.2 14.5 31.7 11.7 19.8
2-Pentanol 3.1 6.6 13.5 4.4 5.9
1-Pentanol 5.2 4.7 26.9 8.4 15.7
Ethylene glycol 414.8 355.5 192.2 465.1 189.6
Cyclopentanol 18.9 22.9 48.7 23.0 27.0
2-Hexanol 4.0 5.3 24.3 7.9 10.1
Propylene glycol 267.9 250.9 279.3 400.8 275.6
2,3-Butanediol 27.4 35.9 44.8 34.9 31.0
Cyclohexanol 51.9 75.8 77.0 51.3 41.1
1,2-Butanediol 83.0 75.3 100.6 137.4 111.1
Tetrahydrofurfuryl alcohol 18.8 40.4 94.8 72.7 132.9
1,4-Butanediol 58.3 41.5 34.4 68.6 33.9
γ-Butyrolactone 119.6 80.8 92.8 110.6 111.4
γ-Valerolactone 11.8 11.9 15.8 12.5 13.8
Glycerol 41.9 42.7 0.0 48.8 1.8
1,2-Cyclohexanediol 114.4 91.0 72.3 107.7 62.7
4-Hydroxymethyl-γ-
butyrolactone 74.2 43.6 0.0 47.0 25.2
Sorbitol 591.8 510.6 0.0 21.8 0.0
3-Methylcyclopentanol 20.2 23.7 43.8 33.9 36.5
1,2,3-Butanetriol 23.7 10.2 15.9 29.2 27.1
1,4-Pentanediol 15.7 19.4 30.6 23.3 19.2
3-methylcyclohexanol 22.1 18.8 34.7 34.3 32.4
Page 130
111
4-methylcyclohexanol 14.9 14.8 24.3 20.5 15.8
1,2-Hexanediol 21.4 7.8 16.1 27.7 19.3
1,2,6-Hexanetriol 15.5 12.4 0 14.2 0
Total carbon identified 2355.4 2158.2 1781.2 2171.5 1673.9
Total carbon in liquid as
measured by TOC 3616.1 3223.8 2881.1 3405.4 2570.3
%C identified by GC and
HPLC 65.1 66.9 61.8 63.4 65.1
% C to gas phase 9.7 19.5 28.1 15.0 35.8
* Acetic acid, levoglucosan, and sugars concentrations in feed are 144.8 mmol-C L-1
,
489.2 mmol-C L-1
, and 159.3 mmol-C L-1
respectively.
Figure 6-3 Product yield and selectivity in 2-stage hydrogenation of aqueous fraction of
pine wood bio-oil over Ru/C and Pt/C catalyst. A: Ru/C-Pt/C, 125-220 °C, 1450 psi, B:
Ru/C-Pt/C, 125-220 °C, 750 psi, C: Ru/C-Pt/C, 125-250 °C, 750 psi, D: Ru/C-Pt/C, 125-
250 °C, 1450 psi, E: Ru/C-Pt/C, 125-275 °C, 1450 psi. All the experiments are carried
out at the space velocity of 3 hour-1
.
The effect of the second stage temperature on the yield of desired product groups
is shown in Figure 6-4. The optimum temperature for maximizing the desired product
yield is ca. 250 °C. The C2-C6 diols yield decreases above 250 °C due to their further
15.9
8.4
7.4
19.6
3.43.0
12.7
2.8
26.7
B
24.3
13.2
10.617.4
2.71.5
2.9
27.4
C
8.9 4.6
6.9
22.2
5.13.3
14.8
2.8
31.4
A C1-C4 alkanes & other gas phase products
Gasoline cut 1 (Boiling range: 338-372 K)
Gasoline cut 2 (Boiling range: 388-448 K)
C2 to C6 diols
Lactones
Acetic acid
Sorbitol
Other chemicals
Unidentified
32.4
11.9
7.1
17.0
3.8
1.5
4.1
22.2
E
11.7
8.8
8.1
28.94.22.6
0.5
4.3
30.8
D
Page 131
112
hydrogenation reactions to produce gasoline cut 1 alcohols and C1-C4 gas phase alkanes.
The C1-C4 alkanes and other gas phase products show an exponential rise in yield with
temperature.
Figure 6-4 Product selectivity distribution with 2
nd stage temperature in hydrogenation of
PW-WSBO. First Stage: 125 °C, 5 wt% Ru/C catalyst, second Stage: 5 wt% Pt/C
catalyst. P: 1450 psi for both stages, WHSV: 3 hour-1
for both stages. Lines are guide to
the eyes.
0.0
5.0
10.0
15.0
20.0
25.0
30.0
35.0
210 220 230 240 250 260 270 280
%C
Yie
ld
2nd Stage Temperature (°C)
C1-C4 alkanes & other gas phase products Gasoline cut 1
Gasoline cut 2 C2-C6 diols
Page 132
113
6.7 Hydroprocessing of Aqueous Fraction of DOE Bio-oil (WS-DOE-BO) and Use of
Bimetallic Catalyst in Second Stage
The two stage hydrogenation process for the aqueous fraction of bio-oil described
above can be used to produce oxygenated gasoline additives and valuable diols. It would
be crucial to know if the same process (catalyst, reaction conditions etc.) can be used for
different bio-oils. To test this, we subjected the water soluble DOE bio-oil to the single
stage hydrogenation on Ru/C as well as to the 2-stage hydrogenation on Ru/C followed
by Pt/C catalyst. The representative composition the WS-DOE-BO feed used in this study
is shown in Table 6-9. The composition of WS-DOE-BO looks very similar to that of
WS-PWBO except that the acetic acid concentration in WS-DOE-BO is almost 4 times
than that in WS-PWBO. The extent of unidentifiable carbon in WS-DOE-BO is also less
than that for WS-PWBO.
Page 133
114
Table 6-9 Composition of the water soluble fraction of DOE bio-oil. The feed is made by
mixing DOE-BO and water in 1:4 weight ratio.
Compounds Concentration
(mmolC L-1
)
Methanol 30.0
Ethanol 0.0
1-Propanol 0.0
Hydroxyacetaldehyde 374.2
Acetic Acid 811.2
Hydroxyacetone 139.6
Propanoic Acid 45.0
Hexanoic Acid 42.1
1-Hydroxy-2-butanone 48.7
Furfural 19.0
2-Cyclopenten-1-one 29.5
γ-Butyrolactone 17.8
2(5H)-furanone 38.5
Phenol 0.6
3-Methyl-1,2-cyclopentadione 0.0
5-Hydroxymethylfurfural 42.6
Levoglucosan 1142.6
Sugars 247.8
Sorbitol 113.2
Total 3142.4
mmol C L-1
by TOC 4044.0
%C identified by GC and HPLC 77.7
Table 6-10 depicts the product composition of the single stage hydrogenation of
WS-DOE-BO on 5 wt% Ru/C catalyst at 125 °C and 1450 psi. The product distribution is
very similar to that for WS-PWBO (compare entries for WHSV of 3.0 h-1
in Table 6-5)
with ethylene glycol and propylene glycol as major products. Levoglucosan and sugars
are partially converted similar to WS-PWBO but the conversion is lower in WS-DOE-
BO. Levoglucosan conversion of 65.3% was observed for water soluble pine wood bio-
oil. Whereas, for the water soluble DOE bio-oil levoglucosan conversion of only 36.0%
was obtained at the same reaction conditions. For the WS-DOE-BO the increase in
Page 134
115
sorbitol concentration is less than the decrease in levoglucosan and sugar concentration,
implying that sorbitol has undergone further hydrogenolysis to produce ethylene glycol,
propylene glycol etc. This is not the case for water soluble pine wood bio-oil where a
corresponding (to levoglucosan and sugar concentration decrease) increase in the sorbitol
concentration was observed (Table 6-5, WHSV: 3.0 h-1
). The high hydrogenolysis
activity for sorbitol in WS-DOE-BO can be due the high acetic acid concentration in the
feed. Acetic acid can catalyze the retro-aldol condensation reactions of sorbitol producing
C2 to C4 products which get hydrogenated to corresponding alcohols.
Page 135
116
Table 6-10 Product composition of the single stage hydrogenation of WS-DOE-BO on 5
wt% Ru/C at 125 °C, 1450 psi, and 3 hour-1
. Feed: ~13 wt% WS-DOE-BO solution in
water.
Product Concentration
(mmol-C L-1
)
Methanol 57.5
Ethanol 12.0
2-Propanol 0.0
1-Propanol 11.0
2-Butanol 14.7
Acetic Acid 1001.8
1-Butanol 0.0
2-Pentanol 0.0
Propanoic Acid 50.4
1-Pentanol 0.0
Ethylene Glycol 462.6
Cyclopentanol 36.0
Propylene glycol 222.9
3-methylcyclopentanol 7.6
2,3-Butanediol 12.6
Cyclohexanol 70.3
1,2-Butanediol 21.1
Tetrahydrofurfuryl alcohol 18.5
1,4-Butanediol 29.0
γ-Butyrolactone 77.1
1,2-Cyclohexanediol 95.4
Levoglucosan 731.3
Glucose 126.5
Sorbitol 77.2
Total (mmolC L-1
) 3196.6
Carbon in feed by TOC
(mmol L-1
)
4044.02
Carbon in product by TOC
(mmolC L-1
)
3646.2
%C to gas phase 9.8
%C identified by GC and HPLC 87.7
The single stage hydrogenation product of WS-DOE-BO was hydrogenated over
5 wt% Pt/C catalyst to completely convert the unreacted sugars, levoglucosan, and
sorbitol to valuable alcohols and diols. The results are depicted in Table 6.11. The major
Page 136
117
products are ethanol, ethylene glycol, propylene glycol, and methanol (all with
concentration > 100 mmol carbon per liter). The product selectivity is significantly
different for WS-DOE-BO and WS-PWBO (compare Tables 6-11 and 6-8). A notably
higher concentration of monohydric alcohols was obtained for the WS-DOE-BO feed as
compared to that for WS-PWBO feed. All of the levoglucosan, sorbitol, and sugars were
converted. A significant drop in ethylene glycol and propylene glycol and a significant
increase in ethanol and n-propanol concentration were observed. This indicates that the
C2 to C6 diols are undergoing further C-O bond hydrogenolysis reaction to produce
corresponding alcohols. This difference between the behavior of water soluble pine wood
bio-oil and water soluble DOE bio-oil can be due to the high concentration of acetic acid
which can catalyze the dehydration reactions in C2 to C6 diols, hence expediting the C-O
bond hydrogenolysis reactions. Miyazawa et al. has shown that the rate of propylene
glycol formation over Ru/C catalyst from glycerol (i.e. C-O bond hydrogenolysis) is
enhanced by the presence of amberlyst resin.(82, 83)
This indicates that the acids can
catalyze the dehydration reaction in polyols such as glycerol (or in our case sorbitol) and
hence enhance the C-O bond hydrogenolysis rate. The higher C-O bond cleavage rates in
the WS-DOE-BO also resulted in high carbon loss to gas phase products, mainly in the
form of C1 to C6 alkanes. The carbon loss to gas phase of 45.2% was observed for WS-
DOE-BO as compared to 15.0% for WS-PWBO at the same reaction conditions.
Page 137
118
Table 6-11 Feed and product composition for 2-stage hydrogenation of WS-DOE-
BO. Feed: ~13 wt% WS-DOE-BO solution in water. P: 1450 psi, WHSV: 3 h-1
Compound
Concentration (mmol-C L-1
)
Feed Ru/C, 125 °C
- Pt/C, 250 °C
Ru/C, 125 °C – PtRe on
Ceria-Zirconia, 250 °C
Reactants
Methanol 28.2 111.7 99.3
1-Propanol 8.0 78.8 205.7
Hydroxyacetaldehyde 326.0 0.0 0.0
Acetic Acid 723.2 273.1 0.0
Hydroxyacetone 123.6 0.0 0.0
Propanoic acid 39.0 16.1 0.0
Hexanoic acid 0.0 0.0 0.0
1-Hydroxy-2-butanone 39.8 0.0 0.0
Furfural 15.9 0.0 0.0
2-Cyclopenten-1-one 22.2 0.0 0.0
γ-Butyrolactone 14.7 17.0 15.2
2(5H)-Furanone 28.2 0.0 0.0
Phenol 0.4 0.0 0.0
3-Methyl-1,2-
cyclopentadione 21.7 0.0 0.0
5-Hydroxymethyl-
furfural 28.1 0.0 0.0
Levoglucosan 988.1 0.0 0.0
Sugars 207.4 0.0 0.0
Sorbitol 0.0 0.0 0.0
Products
Ethanol 0 249.6 703.9
2-Propanol 0 8.8 50.7
2-Butanol 0 5.6 27.1
1-Butanol 0 23.4 59.9
2-Pentanol 0 3.9 11.4
1-Pentanol 0 0.0 9.8
Ethylene glycol 0 210.3 0
Cyclopentanol 0 22.8 44.3
Propylene glycol 0 161.3 14.7
3-Methylcyclopentanol 0 30.7 20.8
2,3-Butanediol 0 19.6 20.8
Cyclohexanol 0 50.3 82.9
1,2-Butanediol 0 48.3 9.0
Tetrahydrofurfuryl
alcohol 0 82.3 12.9
1,4-Butanediol 0 16.0 9.9
γ-Butyrolactone 0 17.0 15.2
1,2-Cyclohexanediol 0 49.9 41.9
Page 138
119
Sorbitol 0 0.0 0.0
Total (mmol-C L-1
) 3150.1 1479.1 1446.4
Carbon in feed by TOC
(mmol L-1
)
4044.02
3489.6 3642.4
Carbon in product by
TOC (mmol-C L-1
)
3646.2
1913.2
2206.5
%C to gas phase 9.8 45.2 39.4
%C identified by GC
and HPLC 86.4 77.3 65.6
The Pt/C catalyst is active for hydrogenating all the major bio-oil functionalities
to corresponding alcohols except carboxylic acids. It is desirable to completely reduce the
acids in the aqueous fraction of the bio-oil with the economic standpoint of further
processing of the hydrogenated product. Acetic acid hydrogenation proceeds through the
acetyl (CH3-CO-) intermediate. Acetyl intermediate is formed by the activation and the
cleavage of C-OH bond of acetic acid. Pallassanna and Neurock showed that group VIII
metals like Pt and Pd exhibit lower activation barriers for hydrogenation, but they tend to
display poor activity for acetic C–O bond dissociation (hydrogenolysis).(84)
They also
showed that C-OH activation is more favored on metals to the left in periodic table such
as Rhenium. They found by theoretical calculations that bimetallic PdRe catalyst exhibit
higher activity for acetic acid hydrogenation to ethanol compared to monometallic Pd
catalyst. Hence with same context we tested the PtRe catalyst supported on ceria-zirconia
in the 2nd
stage of the hydrogenation process. The results are shown in Table 6-11. A
100% acetic acid conversion was observed with the PtRe bimetallic catalyst. All of the
levoglucosan, sugars, and sorbitol were also consumed. However, the product selectivity
is significantly different than that for the monometallic Pt catalyst. The major products
are ethanol (703.0 mmol-C L-1
), 1-propanol (205.7 mmol-C L-1
), methanol (99.3 mmol-C
Page 139
120
L-1
), cyclohexanol (82.9 mmol-C L-1
), and 1-butanol (59.9 mmol-C L-1
). The PtRe
bimetallic catalyst produced large amount of monohydric alcohols due to its ability to
selectively activate the C-O bonds in compounds such as ethylene glycol and propylene
glycol. No ethylene glycol was observed in the products and a very little propylene glycol
was observed. The carbon loss to the gas phase for PtRe catalyst was 39.4%. The
bimetallic catalyst hence can be a very good choice if you want to selectively produce
gasoline cut 1 compounds (C2 to C4 monohydric alcohols) from the aqueous fraction of
bio-oil. It also completely reduces the acetic acid and propanoic acid, hence simplifying
the further processing of hydrogenated water soluble bio-oil.
6.8 Reactions in Hydroprocessing of Aqueous Fraction of Bio-oil
Based on the reactants present in WSBO and products obtained, the major
reactions happening during the hydroprocessing of water soluble bio-oil are identified
below,
Hydrogenation of bio-oil components: These reactions take place in the low
temperature hydrogenation step. The carbonyl functional groups in the bio-oil
components are hydrogenated to corresponding alcohols. In guaiacol, methoxy
functional group (-OCH3) is hydrogenated to –OH group. Catechol undergoes ring
hydrogenation to produce 1,2-cyclohexanediol which gets converted to cyclohexanol
with elimination of a hydroxyl group. The reactions identified are listed below,
Page 140
121
OH
O
CH3
OH
OH
CH3H2
OH
O
OH
OH
H2
Hydroxyacetone Propylene glycol Hydroxyacetaldehyde Ethylene Glycol
O
O
H2
OOH
O
O
H2
OO
2(5H)-Furanone γ-Butyrolactone Furfural Tetrahydrofurfuryl alcohol
CH3
O
OH
H2
OH
OHOH
OHH2 H2
OH
Guaiacol Catechol 1,2-Cyclohexanediol Cyclohexanol
O
O H2
OH
3-Methyl-1,2-cyclopentadione Cyclopentanol
Hydrolysis followed by hydrogenation: These reactions take place in the low
temperature hydrogenation stage. Levoglucosan in the bio-oil is converted to
sorbitol in two steps. First is the hydrolysis of levoglucosan to glucose. This step
is catalyzed by acids. Since we do not add any acid externally in our reaction
Page 141
122
medium, this step is likely catalyzed by acetic acid in the WSBO feed. In the
second step glucose is hydrogenated to sorbitol over metal catalyst.
O
OH
OH
OH
O
OH2
O
OHOH
OH
OH
OH
H2 OHOH
OH
OH
OHOH
H+ metal
Levoglucosan Glucose Sorbitol
Hydrogenolysis: In hydrogenolysis reaction as shown in the reaction scheme
below, the larger polyols such as sorbitol undergo C-C bond cleavage reactions
over metal in the presence of hydrogen to produce smaller polyols such as
ethylene glycol, propylene glycol, and glycerol. The C-C bond cleavage reactions
can be catalyzed solely by metals such as Ru and Pt but rates of these reactions
increase in acidic and basic medium. This is because acids and bases can catalyze
the retro-aldol condensation reactions. These reactions are very prominent in our
process in 2nd
hydrogenation step at high temperature. Although, there is an
indication of hydrogenolysis reaction in the LTH step at low space velocities.
OH
OH
OH
OH
OH
OH
OH
OH
OH
OH
OH
OH
CH3
H2
OHOH
OH
OH
OH OH
Page 142
123
Secondary hydrogenation reactions: These reactions occur in LTH as well as in
HTH step. Secondary hydrogenation reactions are C-O bond cleavage reactions,
where monohydric alcohols are produced from the diols. These reactions are
catalyzed by metals and are expedited by presence of acids as we saw in case of
WS-DOE-BO as feed.
OH
OH
OH OH
OH
Glycerol Propylene glycol
OH
OH
OH
OH
OH
OH
Ethylene glycol Ethanol Propylene glycol n-Propanol
OH
OH
OH
OH
H2OH
1,2 & 1,4-Butanediol 1-Butanol
In addition to these reactions, further hydrogenation of monohydric alcohols
produce corresponding alkanes. CO is produced from decarbonylation of aldehydes. CO
can further react with hydrogen to produce CH4. CO2 is produced from decarboxylation
of carboxylic acids.
Page 143
124
6.9 Low Temperature Hydrogenation of Whole Bio-oil
As described previously in this chapter, the aqueous fraction of the bio-oil
contains mainly C2 to C6 oxygenated hydrocarbons and they can be converted to
valuable gasoline additives and C2 to C6 diols by hydroprocessing over noble metal
catalysts. The aqueous fraction contains only about half the energy of the bio-oil. The
organic fraction of the bio-oil mainly contains lignin derived oligomers with ether
linkages. It would be preferable to hydrotreat the entire bio-oil instead of just the aqueous
fraction. Hence we subjected the DOE bio-oil to low temperature hydroprocessing over 5
wt% Ru/C catalyst at 1450 psi and temperatures in the range of 75 °C to 125 °C. The
microfiltered (0.8 µm membrane) DOE bio-oil was used as feed. None of the bio-oil
components showed significant reactivity up to the temperature up to 100 °C. The data
for DOE-BO hydrogenation over Ru/C catalyst at 125 °C, 1450 psi at the space velocity
of 1.6 hour-1
is tabulated in Table 6-12. As seen in this table, different conversions are
obtained for different feed components but no corresponding hydrogenation products
were detected except for a small amount of sorbitol. Hence the disappearance in the
reactants is most likely due to the homogeneous reactions that occur when bio-oil is
heated to the hydrogenation reaction temperature. The same reactants that can be
successfully hydrogenated when present in the aqueous fraction cannot be hydrogenated
when present in the whole bio-oil. This indicates that the lignin-derived oligomers in the
bio-oil might be permanently occupying and essentially deactivating the active catalytic
sites.
Page 144
125
Table 6-12 Composition of DOE-BO feed low temperature hydrogenated DOE-BO.
Hydrogenation carried out over 5 wt% Ru/C catalyst, 125 °C, 1450 psi, 1.6 hour-1
Compound
mmol carbon min-1
%
Conversion DOE-BO
Feed
Hydrogenated
DOE-BO
Methanol 3.5010-3
3.4710-3
-
Methyl acetate
Hydroxyacetaldehyde 1.6610
-3
0.116
3.1710-3
0
-
100
Acetic acid 0.109 0.127 0
Hydroxyacetone 2.1110-2
2.7510-2
0
Furfural 8.1410-3
5.6010-3
31.2
2-Furanone 6.5010-3
5.0710-3
31.4
3-Methyl-1,2-
cyclopentadione 5.6510
-3 0 100
Phenol 1.3810-3
4.4510-3
0
1-Hydroxy-2-butanone 6.7210-3
0 100
2-Cyclopenten-1-one
γ-Butyrolactone 4.0110
-3
2.9110-3
0
5.0710-3
100
0
5-Hydroxymethylfurfural 8.3310-3
0 100
Levoglucosan 0.113 9.4910-2
16.4
Sugars 2.2710-2
1.7310-2
24.0
Sorbitol 0 2.2010-3
-
Total carbon identified 0.432 0.262
Total carbon as determined
by elemental analysis
1.294 1.269
%C to gas phase products - 1.9
Since we could not gain much understanding from the gas chromatography data,
we did the GPC analysis of all the hydrogenation samples. The data are depicted in
Figure 6-5. The GPC curves for the hydrogenated products have shifted to right as
compared to the feed, meaning there are polymerization reactions going on within bio-oil
components when it is subjected to high temperature for hydrogenation. The weight
average molecular weight data for the last peak in GPC curve and normalized area under
curve (which is proportional to concentration of species with that molecular weight) for
Page 145
126
these samples are tabulated in Table 6-13. The weight of average molecular weight of
DOE bio-oil does not increase upon hydrogenation at 75 °C, however there is a
substantial increase in the molecular weight when bio-oil is hydrogenated at 100 and 125
°C. The normalized concentration of high molecular weight oligomers also increase
during hydrogenation and its temperature dependence is exponential. Hence we conclude
that bio-oil is undergoing the self-polymerization reactions even in the reducing
environment of hydrogenation. It might be beneficial to dilute the bio-oil using a solvent
to minimize these self-polymerization reactions during the hydroprocessing.
Figure 6-5 Molecular weight distribution for the DOE bio-oil feed and low
temperature hydrogenation products. Hydrogenation carried out over 5 wt% Ru/C
catalyst, 1450 psi, 1.6 hour-1
. Temperature shown in the figure is in °C.
0
100000
200000
300000
400000
500000
600000
700000
1 10 100 1000 10000 100000
DOE-BO Hydrogenated DOE-BO 75 Hydrogenated DOE-BO 100 Hydrogenated DOE-BO 125
Page 146
127
Table 6-13 Molecular weight and concentration for DOE bio-oil and hydrogenated
products. Hydrogenation was carried out over 5 wt% Ru/C catalyst, 1450 psi, 1.6
hour-1
.
DOE
bio-oil
Hydrogenated DOE bio-oil
Hydrogenation temperature (°C)
75 100 125
Weight average molecular
weight for the last peak in GPC 1996.4 1992.0 2098.4 2274.11
Normalized concentration of
last peak in GPC 100 107.1 116.4 132.2
6.10 Conclusion
The general conclusion from this study is that oxygenated gasoline additives and
valuable C2 to C6 diols can be produced with high carbon yield from the aqueous
fraction of the bio-oil (WSBO) in a 2-stage hydrogenation process. The aqueous fraction
of the bio-oil contains C2 to C6 oxygenated hydrocarbons with various functionalities
including aldehydes, ketones, acids, and carbohydrates. These functionalities are
thermally unstable; hence a direct high temperature hydrogenation of bio-oil or WSBO is
not feasible. The first hydrogenation step converts the aldehydes, ketones, and sugars to
corresponding alcohols. The alcohols are thermally stable and can be treated at high
temperature subsequently. The goal of the first step is to achieve complete hydrogenation
of thermally unstable compounds while minimizing the carbon loss to gas phase.
Ruthenium was found to be the most suitable catalyst for the low temperature
hydrogenation step. Ruthenium is highly active for the C-C bond cleavage reactions and
hence the minimum possible temperature should be used in the low temperature
hydrogenation step. The optimum temperature was found to be 125 °C, where all the
WSBO functionalities show a significant hydrogenation activity with only 7% carbon
Page 147
128
loss the gas phase products. The carbon loss the gas phase increased exponentially with
temperatures above 125 °C, with 25% carbon going to gas phase at 150 °C. Similarly the
optimum space velocity was found to be around 1.5 to 3 hour-1
. Acetic acid is resilient to
hydrogenation at the low temperatures used in the first step. The major products obtained
are ethylene glycol, propylene glycol, and sorbitol.
The low temperature hydrogenation products contain a substantial amount of
sorbitol which is a hydrogenation product of levoglucosan and glucose. A second high
temperature stage was added to convert sorbitol to valuable products including diols and
monohydric alcohols. Platinum was found to be the suitable catalyst. Up to 46% carbon
of the WSBO was successfully converted to gasoline cut 1, gasoline cut 2, and C2 to C6
diols. The product distribution after 2-stage hydrogenation can be controlled using the
pressure and 2nd
stage temperature. If desired, high yields of gasoline cut 1 and gasoline
cut 2 can be obtained by operating at low total pressure or at high second stage
temperature (e.g. 275 °C). High pressure is preferable in the 2-stage process to minimize
the carbon loss to gas phase.
A sizeable difference between the product yields from two different aqueous
fractions (WS-PWBO and WS-DOE-BO) was observed. WS-DOE-BO produced more
monohydric alcohols compared to the WS-PWBO. This is due to the high acetic acid
content of the WS-DOE-BO. Acetic acid can catalyze the secondary dehydration
reactions in C2 to C6 diols, resulting in formation of corresponding monohydric alcohols
by C-O bond cleavage. The bio-oil properties can hence affect the optimum reaction
Page 148
129
conditions required to maximize the yield of desired products. In addition to Pt, we also
tested the bimetallic PtRe catalyst in the 2nd
hydrogenation step for WS-DOE-BO. PtRe
catalyst completely hydrogenated acetic acid as opposed to Pt catalyst, which is
beneficial for the further processing of the hydrogenated product. PtRe was found to have
high C-O bond cleavage activity and hence gasoline-range monohydric alcohols were
obtained as major products. The whole DOE bio-oil was also subjected to the low
temperature hydrogenation over Ru/C catalyst at temperatures in the range of 75 to 125
°C. A quantifiable reactant disappearance was observed only at 125 °C but no
corresponding hydrogenation products were observed. The average molecular weight of
bio-oil increased upon hydrogenation due to bio-oil self-polymerization. It is possible that
the lignin monomers present in the bio-oil are occupying the catalyst sites and the
disappearance of reactants is only because of the homogenous thermal polymerization
reactions.
To achieve the maximum yield to desired products from two-stage
hydroprocessing of bio-oil, the catalyst in the first step should have high hydrogenation
activity and low C-C bond cleavage activity, the catalyst in the second stage should have
moderate C-C and C-O bond cleavage activity. The bio-oils with high water solubility
and low acid content are desired.
Page 149
130
CHAPTER 7
INTEGRATED HYDROPROCESSING AND ZEOLITE
UPGRADING OF BIO-OIL
7.1 Introduction
As seen in the last chapter, past bio-oil hydrotreating efforts suffer several
drawbacks. Another widely studied bio-oil upgrading route is the zeolite upgrading.
Various researchers have studied the conversion of oxygenated hydrocarbons to
aromatics and olefins over ZSM-5 catalyst. The most common example is the methanol
to gasoline and methanol to olefins processes.(85)
Chen et al. produced hydrocarbons from
glucose, xylose, and furfural over HZSM-5 catalyst at 510 °C. Gayubo et al. have
extensively studied the conversion of various aldehydes, ketones, phenols, acids, and
alcohols and mixtures thereof over HZSM-5 catalyst to hydrocarbons.(86-88)
Severe
catalyst coking was observed. Recently Dumesic and co-workers demonstrated that
aromatics can be produced from the mixture of monofunctional oxygenates including C5-
C6 aldehyde, acids, and ketones over HZSM-5 catalyst at 400 °C.(17)
Pyrolysis oil zeolite
upgrading efforts have also revolved around using HZSM-5 catalyst. Adjaye and Bakhshi
converted maple wood pyrolysis oil to organic product containing mainly aromatic
hydrocarbons with 37% carbon yield in presence of hydrogen donor solvent tetralin.(32, 33)
Similarly Chantal et al. observed the hydrocarbon yield of 17 wt% of bio-oil over HZSM-
5 catalyst.(89)
Studies have been performed to upgrade pyrolysis oil vapors over HZSM-5
even before the condensation. Milne et al. observed the yield of 18% at 475 °C in a
quartz reactor.(90)
The low hydrocarbon yield is due to the presence of functionalities such
Page 150
131
as aldehydes and ketones in bio-oil, which are known to form large amounts of coke on
HZSM-5 catalyst.(87)
A distinct strategy for bio-oil deoxygenation into high yield commodity chemicals
including C2 to C6 monohydric alcohols and diols, C6 to C8 aromatic hydrocarbons, and
C2 to C4 olefins with over 60% overall carbon yields was developed. Our approach
involves hydroprocessing of the bio-oils over supported metal catalysts followed by
conversion over zeolite catalysts. It is not possible to completely hydrodeoxygenate the
pyrolysis oil in a packed bed reactor without frequent catalyst regeneration due to coke
formation on the catalyst surface. Furthermore, complete hydrodeoxygenation requires
large amounts of expensive hydrogen. In our process drawbacks associated with the prior
bio-oil hydrogenation processes are overcome by operating at moderate temperatures (≤
250 °C) where no catalyst coking or reactor plugging was observed. Furthermore, our
process can produce products without the high hydrogen requirements. Employing a
zeolite upgrading step at the end has an advantage that a fluidized bed reactor can be
used, where the coked catalyst can be regenerated by burning off the coke and recycled
back to the reactor. This study demonstrates how pyrolysis oil could practically be
upgraded through catalytic processes into commodity chemicals.
The integrated catalytic process described here can be tuned to produce different
targeted distributions of organic small molecules that fit seamlessly into the existing
petrochemical infrastructure. The products can be tuned to change with different market
conditions. The C6 to C8 aromatic hydrocarbons can be high-octane gasoline additives or
Page 151
132
feedstocks to the chemical and polymer industries.(91)
The C2 to C4 olefins can also be
used directly for polymer synthesis, or can be modified to form other products including
alkylated aromatics(92, 93)
and longer linear alpha olefins(94)
. The gasoline range alcohols
can be high-octane gasoline additives. The C2 to C6 diols can serve as feedstocks for the
chemical and polymer industries. The chemical industry relies on seven primary building
blocks that are all derived from petroleum based processes including: benzene, toluene,
xylene, ethylene, propylene, 1,3-butadiene, and methanol.(95)
Five of these seven
petrochemical feedstocks can be produced using the process described here, opening the
door to a chemical industry based on renewable biomass feedstock.
7.2 H/Ceff Ratio
The hydrogen content of a particular feedstock can be expressed in terms of its
hydrogen to carbon atomic effective ratio (H/Ceff ratio), as defined in Equation 7-1. The
H/Ceff ratio is equal to the atoms of hydrogen minus twice the atoms of oxygen divided
by the number of atoms of carbon in a feedstock.
Cmoles
OmolesHmolesCH eff
2/ (7-1)
The H/Ceff ratios for DOE-BO and low temperature hydrogenated DOE-
BO were calculated based on the elemental analysis done at Galbraith Laboratories,
Knoxville, Tennessee. The exact elemental composition cannot be determined for water
soluble fraction of pine wood bio-oil (WSBO) (and its hydrogenated products) as it
Page 152
133
contains a large amount of water, the amount of which could not be determined
accurately. Hence the H/Ceff ratio for WSBO, low temperature hydrogenated WSBO and
high temperature hydrogenated WSBO was estimated using their composition determined
by GC-FID and HPLC. A small error in the H/Ceff ratio calculation will be introduced
due to the unidentified carbon in WSBO and its hydrogenated products.
Lignocellulosic biomass and carbohydrate based feedstocks have H/Ceff ratios
between 0 and 0.5. In contrast, petroleum based feedstocks have H/Ceff ratios from 1.0 to
2.0. Thus, biomass based feedstocks are hydrogen deficient due the presence of oxygen.
For example, the bio-oil used in this study has an H/Ceff ratio of 0.06. During the
conversion of biomass to chemicals, oxygen can be removed as a combination of CO,
CO2 and H2O. If all the hydrogen comes from the biomass itself then oxygen will be
removed as a combination of CO, CO2 and H2O. Whereas, if external hydrogen is used in
these processes then more oxygen will be removed as H2O. The exact ratio of CO, CO2
and H2O can be determined from the reaction stoichiometry between the feeds and the
products. Thus, the addition of external hydrogen can increase the carbon yield of
commodity chemicals produced from pyrolysis oils. This demonstrates how the biomass
refining industry could be tied to the hydrogen economy.
7.3 Integrated Hydroprocessing and Zeolite Upgrading
In this study we converted eleven different biomass derived feedstocks, with a
range of different functionalities over a ZSM-5 catalyst. This catalyst has the proper pore
structure and active sites to effectively convert biomass derived molecules into aromatic
Page 153
134
hydrocarbons and olefins.(13, 86, 96)
Figure 7-1 depicts that the aromatic and olefin yield
increases with the H/Ceff ratio of the feedstock (details in Table 7-1) and this relationship
is applicable to a wide variety of biomass derived feedstocks. The theoretical yield, also
shown in Figure 7-1, increases with the H/Ceff ratio as well. The increase in the aromatic
and olefin yield with increasing H/Ceff ratio is due to two different phenomena, an
increase in the thermal stability of the feedstock and an increase in the intrinsic amount of
hydrogen in the feedstock. Increasing the H/Ceff ratio improves the thermal stability of
the biomass-derived molecules by hydrogenating the functionalities (primarily aldehydes
and ketones) that otherwise thermally decompose to char as shown in Table 7-2. For
example, in thermogravimetric studies glucose produces 23.1 wt% coke when heated to
700 °C under helium atmosphere (Table 7-2). Sorbitol, a glucose derivative in which the
aldehyde functionality has been hydrogenated to an alcohol, is significantly more
thermally stable and produces only 6.1 wt% coke. Increasing the H/Ceff ratio also
increases the intrinsic hydrogen content of the biomass derived feedstock, which allows
higher theoretical yield of aromatic hydrocarbons and olefins from these feedstocks, as
less carbon is used for the deoxygenation (Table 7-3). In zeolite upgrading of an
oxygenated hydrocarbon C6-C8 aromatic hydrocarbons, C2-C4 olefins, CO, and water
are the major products. Oxygen is removed from the feed in the form of CO or H2O. In
aromatics, toluene is the major component, whereas in olefins, propylene is the major
component produced. Equations 7-2 and 7-3 show the overall stoichiometry for the
conversion of glucose to toluene and propylene respectively.
C6H12O6 → (12/22) C7H8 + (26/22) CO + (84/22) H2O (7-2)
Page 154
135
C6H12O6 → C3H6 + 3CO + 3H2O (7-3)
Hence the theoretical carbon yield of toluene and propylene from glucose is
63.6% and 50.0% respectively. Similarly the stoichiometry for the conversion ethylene
glycol over zeolite catalyst is shown in Equations 7-4 and 7-5.
C2H6O2 → (6/22) C7H8 + (2/22) CO + (42/22) H2O (7-4)
C2H6O2 → 0.5 C3H6 + 0.5 CO + 1.5 H2O (7-5)
The theoretical carbon yields of toluene and propylene from ethylene glycol are
95.5% and 75.0% respectively. Based on the elemental composition of DOE-BO, low
temperature hydrogenated DOE-BO and the measured compositions of WSBO and its
hydrogenated products, similar maximum theoretical yield equations can be written.
Table 7-3 depicts the theoretical yields to toluene and propylene from various oxygenated
hydrocarbons of interest in this study. The table also depicts the observed aromatic +
olefin yield as a percentage of theoretical toluene yield.
Page 155
136
Figure 7-1 Carbon yield of olefins and aromatic hydrocarbons from the conversion of
biomass derived feedstocks over HZSM-5 catalyst as a function of the hydrogen to
carbon effective ratio (H/Ceff) of the feed. Legend: ( ) experimental yield, ( ) theoretical
yield. Theoretical yield is calculated for toluene. Key: WSBO is the water soluble
fraction of the pine wood bio-oil, LTH-WSBO is WSBO hydrogenated over Ru/C (125
°C, 750 psi, 3 hour-1
), HTH-WSBO is WSBO hydrogenated first over Ru/C (125 °C,
1450 psi, 3 hour-1
), then over Pt/C (250 °C, 1450 psi, 3 hour-1
). DOE-BO is DOE bio-oil
and LTH-DOE-BO is DOE-BO hydrogenated over Ru/C (125 °C, 1450 psi, 1.6 hour-1
).
0
20
40
60
80
100
0 0.25 0.5 0.75 1 1.25 1.5 1.75 2 2.25
Aro
mati
cs +
Ole
fin
s C
arb
on
Yie
ld (%
)
H/Ceff
Methanol
Tetrahydrofuran
HTH-WSBO
LTH-WSBO
Glycerol
Furan
Sorbitol
LTH-DOE-BO
WSBO
DOE-BO
G
G = Glucose
Page 156
137
Table 7-1 Carbon yields (%) for HZSM-5 upgrading of biomass-derived feedstocks. Catalyst: HZSM-5 (SiO2/Al2O3 = 30), Reaction
temperature = 600 °C, Helium carrier gas flow rate: 204 cm3 min
-1. WS-PWBO is water soluble fraction of the pine wood bio-oil,
LTH-WS-PWBO is low temperature hydrogenated WSBO, HTH-WS-PWBO is high temperature hydrogenated WSBO,
LTH-DOE-BO is low temperature hydrogenated DOE-BO, THF is tetrahydrofuran.
Carbon Yield (%) or Carbon Selectivity (%)
Feed → WS-
PWBO
LTH-
WS-
PWBO
HTH-
WS-
PWBO
DOE-
BO
LTH-
DOE-
BO
Glucose Sorbitol Furan Glycerol THF
Methanol
wt% 12.5 12.5 12.5 100 100 12.5 12.5 100 12.5 12.5 12.5
WHSV*
(hour-1
)
11.7 11.7 11.7 11.7 11.7 11.7 11.7 1.97 11.7 11.7 11.7
H/Ceff ratio 0.14 0.71 1.20 0.06 0.09 0 0.33 0.50 0.66 1.50 2.00
CO 17.9 8.1 6.8 13.5 22.6 18.1 28.3 17.2 12.9 1.5 1.8
CO2 5.8 6.9 5.7 4.8 4.4 5.2 5.8 3.5 8.4 0.9 2.0
Coke 32.3 18.9 14.8 49.5 35.3 32.6 14.2 34.8 9.4 5.7 2.3
Olefins 18.5 32.7 50.6 11.2 18.4 14.3 24.4 17.7 28.1 51.5 55.5
Carbon Selectivity (%)
Ethylene 41.6 31.8 32.0 51.8 52.7 39.9 45.1 54.2 55.5 12.2 42.2
Propylene 45.9 55.4 53.8 36.6 35.9 45.5 43.0 41.2 34.5 76.1 41.8
Butylene 12.4 12.8 14.2 11.6 11.4 14.7 11.9 4.5 10.0 11.7 16.0
Aromatics 8.2 23.3 21.5 9.8 14.8 12.2 14.0 26.7 17.9 24.6 24.7
Carbon Selectivity (%)
Benzene 26.8 17.6 27.0 17.3 16.9 23.8 25.7 37.1 18.4 33.7 5.7
Toluene 46.3 45.5 49.3 40.8 37.2 41.8 44.3 37.1 49.2 44.7 21.1
Xylenes 20.7 31.3 19.1 23.5 38.5 23.0 20.0 10.5 25.1 16.7 66.8
Ethylbenzene 1.2 2.6 2.3 2.0 3.4 3.3 2.9 0.0 2.2 1.6 2.0
Styrene 2.4 1.7 1.4 4.1 2.7 4.1 2.1 5.6 2.2 1.2 2.0
Indene 1.2 1.3 0.5 8.2 0.0 2.5 3.6 7.5 2.8 1.6 1.6
Naphthalene 1.2 0.0 0.5 4.1 1.4 1.6 1.4 2.2 0.0 0.4 0.8
Total
identified
carbon (%)
82.7 89.9 99.4 88.8 95.5 82.4 86.7 99.9 85.7 84.2 86.3
* WHSV for WSBO, LTH-WS-PWBO, and HTH-WS-PWBO is on the water soluble bio-oil content basis, excluding the water that is
added externally in the feed.
Page 157
138
Table 7-2 Homogeneous coke yield for different feedstocks
Feed H/Ceff
ratio
Coke (%wt)
Glucose 0 23.1
DOE-BO 0.06 19.0
LTH-DOE-BO 0.09 13.6
WS-PWBO 0.14 12.8
Sorbitol 0.33 6.1
Furan 0.50 0
Glycerol 0.67 0.4
LTH-WS-PWBO 0.71 2.8
HTH-WS-PWBO 1.20 0.2
Tetrahydrofuran 1.50 0
Methanol 2.00 0
Table 7-3 Theoretical toluene and propylene yields and percentage of theoretical toluene
yield for different feedstocks
Feed H/Ceff
ratio
Theoretical carbon
yield (%)
Experimental
aromatic +
olefin carbon
yield (%)
Percentage of
theoretical
toluene yield* Toluene Propylene
Glucose 0 63.6 50.0 26.6 41.8
DOE-BO 0.06 65.6 51.6 21.0 32.0
LTH-DOE-BO 0.09 66.5 52.3 33.2 49.9
WS-PWBO 0.14 68.1 53.5 26.7 39.1
Sorbitol 0.33 74.2 58.3 38.3 51.6
Furan 0.50 79.5 62.5 44.4 55.8
Glycerol 0.67 84.8 66.7 45.8 54.0
LTH-WS-PWBO
Ethylene glycol
0.71
1.00
86.3
95.5
67.8
75.0
56.0
-
64.9
-
HTH-WS-PWBO
Propylene glycol
1.20
1.33
100
100
80.1
83.3
72.3
-
72.3
-
Tetrahydrofuran 1.50 100 87.5 75.9 75.9
Methanol
Ethanol
1-Propanol
2.00
2.00
2.00
100
100
100
100
100
100
80.2
-
-
80.2
-
-
*Percentage of theoretical toluene yield is calculated by dividing the experimental
aromatic + olefin carbon yield (%) by theoretical carbon yield to toluene (%).
Page 158
139
In the same respect as glucose to sorbitol, bio-oil and its aqueous fraction can be
stabilized by hydroprocessing and at the same time an increase in intrinsic hydrogen
content results in higher aromatic and olefin yields. Figure 7-2 shows a generic reaction
scheme for the conversion of bio-oil (or the water soluble fraction of bio-oil) by
hydroprocessing and zeolite upgrading to various products. The thermally unstable
carbonyl functionalities in bio-oil directly go to coke on zeolite catalyst, bypassing the
desired commodity chemicals including aromatic hydrocarbons, olefins, and alcohols.
The carbonyl functionalities are converted to thermally stable corresponding alcohols
upon hydrogenation and the coke yield decreases in zeolite upgrading. A second
hydrogenation step further increases the H/Ceff ratio of feed resulting in even lower coke
yields in zeolite upgrading.
Page 159
140
Figure 7-2 Reaction schematic for the integrated hydroprocessing and zeolite upgrading
of pyrolysis oil. Solid arrows: pyrolysis oil is directly passed over zeolite catalyst, long-
dashed arrows: pyrolysis oil is hydrogenated over Ru/C at 125 °C (398 K) and then
passed over zeolite catalyst, short-dashed arrows: pyrolysis oil is first hydrogenated over
Ru/C at 125 °C (398 K), then over Pt/C at 250 °C (523 K) and then passed over zeolite
catalyst. Width of the vertical arrows represents the product carbon yield from a
particular field. In addition to the product streams shown in the figure, oxygen is removed
at the zeolite stage as a mixture of CO, CO2, and H2O. Boosting the hydrogen content of
the zeolite feed (left to right) increases the thermal stability of the feed resulting in
reduction in amount of coke and increase in the yields of aromatic hydrocarbons and
olefins. Addition of hydrogen also raises the proportion of oxygen lost as water relative
to CO and CO2, and thereby further raises the proportion of carbon incorporated into
marketable compounds.
Page 160
141
Figure 7-3 shows different process options we used in this study for the
conversion of pyrolysis oil. The crude pyrolysis oil can be subjected directly to our
process or it can first be phase separated into an aqueous and an organic phase by
addition of water. Thus we have five different options including: Option 1a: direct
conversion of pyrolysis oils over a zeolite catalyst, Option 1b: low temperature
hydrogenation of pyrolysis oil followed by the conversion over a zeolite catalyst, Option
2a conversion of aqueous phase of bio-oil over a zeolite catalyst, Option 2b: low
temperature hydrogenation of the aqueous phase of bio-oil followed by conversion with a
zeolite catalyst, and Option 2c: low and high temperature hydrogenation of the aqueous
phase of bio-oil followed by zeolite conversion. The organic phase of the bio-oil mainly
contains high molecular weight lignin derived phenolic oligomers.(24)
These lignin
oligomers can be used to make phenol-formaldehyde resins(97)
or as a low cost feedstock
for the base catalyzed depolymerization processes(98-100)
to produce phenolic chemicals or
aromatic fuel.(101-103)
To exploit the advantages of hydroprocessing and zeolite upgrading
for the upgrading of pyrolysis oil we opted to study three different processing steps that
can be operated in series: a low temperature hydrogenation step using a Ru based
catalyst, a higher temperature hydrogenation step using a Pt based catalyst following the
Ru based step and a zeolite conversion step. The Ru catalyst was chosen based on
previous experimental and theoretical studies on aqueous phase acetic acid hydrogenation
over monometallic catalysts.(104)
The conclusion from this study was that Ru was the
most active and selective monometallic catalysts for aqueous phase acetic acid
hydrogenation at low temperatures. Pt was chosen as the catalyst for the high temperature
hydrogenation because previous studies for hydrodeoxygenation of sorbitol have
Page 161
142
indicated that Pt catalysts have high C-O hydrogenation and low C-C bond cleavage
activity.(75)
Pt also has seven times less C-C bond cleavage activity as compared to Ru.(80)
We explored these conversion options with two different pyrolysis oil feeds: crude bio-oil
obtained from the U.S. Department of Energy’s National Renewable Energy Laboratory
(DOE-BO), and the water soluble fraction of a pine wood bio-oil (WS-PWBO). WS-
PWBO sample was made by mixing pine wood bio-oil and water in 1:4 weight ratio. For
the DOE bio-oil sample, we compared the outcomes of zeolite upgrading with and
without preceding low temperature hydrogenation. For the WS-PWBO sample, we
examined these two protocols as well as the third, incorporating a high temperature
hydrogenation step between the low temperature hydrogenation and zeolite upgrading
steps.
Page 162
143
Figure 7-3 Production of olefins, aromatic hydrocarbons, diols, and gasoline range
alcohols from the integrated catalytic processing of pyrolysis oil.
7.4 Hydroprocessing of Bio-oil: Feed and Product Analysis
Gas chromatography (GC) and high performance liquid chromatography (HPLC)
of the DOE bio-oil (Table 6-12) identified hydroxyacetaldehyde (9.0% of the total bio-oil
carbon content), levoglucosan (8.8% of total bio-oil carbon), acetic acid (8.4% of total
bio-oil carbon), sugars (1.8% of total bio-oil carbon) and hydroxyacetone (1.6% of total
bio-oil carbon) as major components. Only 1/3rd
of the carbon content quantified by
elemental analysis could be identified using these techniques. The remaining 2/3rd
of the
Bio-oil
Water
Water Insoluble
Bio-oil
L-L
Extractor
Water Soluble Bio-oil
HZSM-5
873 K
Option
2a
Option 2b
Option 2c
Light Alkanes
(to steam reformer
or to fuel furnace)
Light Alkanes
(to steam reformer
or to fuel furnace)
High Temperature
Hydrogenated Water
Soluble Bio-oil
AromaticsLight olefins, COx
Water
OH
O
OH
O
O
O
O
OH
OH
OH
O
O
OH
O
O
OH
OH
OH
OH
CH3
OH
OH
OOH
OH
OHOH
OO
OH
Fast
Pyrolysis
Reactor
Biomass
H2
H2
COx
Char
to further processing
Option
1b
Option 2
Pt/C
493-
523 K
Option
1a
Option 1
Ru/C
398 K
Low Temperature
Hydrogenated Water
Soluble Bio-oil
OH
OH
OH
OH
CH3
O
OH
OH
OH
O
OHOH
OH
OH
OHOH
High Temperature
Hydrogenation
Low Temperature
Hydrogenation
Zeolite
Upgrading
Page 163
144
carbon can be attributed to non-quantified compounds present in small quantities and GC
and HPLC undetectable lignin and sugar oligomers. Gel permeation chromatography
(GPC) (Figure 6-4) of DOE bio-oil confirmed the presence of oligomers ranging in
molecular weight from 300 to 7000 Da. Analysis of the WS-PWBO by GC and HPLC
identified the compounds comprising 56.5% of the total carbon content (Figure 7-4A and
Table 7-4). The most abundant functionalities in the WSBO include carbonyl compounds
(24.7% of total WS-PWBO carbon), carbohydrates (20% of total WS-PWBO carbon,
includes sugars and levoglucosan), and phenolics (7.9% of total WSBO carbon). The
WS-PWBO has an H/Ceff ratio of 0.14. The unidentified carbon in the WS-PWBO is
most likely present as undetectable lignin and sugar oligomers.
Page 164
145
Figure 7-4 Feed and product carbon distribution (in %C) for the hydrogenation of WS-
PWBO and for the zeolite upgrading. (A) WS-PWBO feed, (B) Product distribution from
single stage hydrogenation of WS-PWBO over Ru/C at 125 °C, 750 psi, 3 hour-1
, (C)
Product distribution from 2-Stage hydrogenation of WS-PWBO, first over Ru/C at 125
°C, 1450 psi, 3 hour-1
, then over Pt/C at 250 °C, 1450 psi, 3 hour-1
.
Individual compounds in different product groups are as follows,
1. C1-C4 alkanes & other gas phase compounds: methane, ethane, propane, butane and
other gas phase compounds which have not been identified.
2. Gasoline cut 1 (boiling range: 65-99 °C): pentane, hexane, methanol, ethanol, 1-
propanol, tetrahydrofuran, 2-butanol, and 2-methyltetrahydrofuran.
3. Gasoline cut 2 (boiling range: 115-175 °C): 1,2-cyclohexanediol, 2,5-
dimethyltetrahydrofuran, 1-butanol, 2-pentanol, 1-pentanol, cyclopentanol, 2-hexanol, 3-
methylcyclopentanol, cyclohexanol, 3-methylcyclohexanol, and 4-methylcyclohexanol.
4. C2 to C6 diols: 2,3-butanediol, propylene glycol, ethylene glycol, 1,2-hexanediol, 1,4-
hexanediol, 1,4-butanediol, and 1,4-pentanediol.
5. Lactones: γ-butyrolactone and γ-valerolactone
6. Other chemicals: tetrahydrofurfuryl alcohol, 1,2,6-hexanetriol, 1,2,3-butanetriol, and
glycerol
11.0
7.4
6.30.6
3.27.9
3.216.8
43.5
AAldehydes
Ketones
Acids
Alcohols
Furanics
Phenolics
Sugars
Levoglucosan
Unidentified
7.5
2.0
6.3
21.1
2.9
5.210.0
1.9
34.3
8.8B
C1 to C4 alkanes & other
gas phase productsGasoline cut 1
Gasoline cut 2
C2 to C6 diols
Lactones
Acetic acid
Sorbitol
Other compounds
Unidentified
Levoglucosan
11.7
8.8
8.1
28.94.22.6
0.5
4.3
30.8
C
Page 165
146
Table 7-4 Composition of WS-PWBO feed*
Compound mmol
carbon L-1
Classification
Hydroxyacetaldehyde 427.6 Aldehyde
Acetic acid 244.1 Acid
Hydroxyacetone 199.3 Ketone
2-Furanone 37.6 Ketone
Phenol 2.5 Phenolic
3-Methyl-1,2-
cyclopentadione
45.7 Ketone
Guaiacol 10.3 Phenolic
Catechol 249.8 Phenolic
1-Hydroxy-2-butanone 20.2 Ketone
Furfural 20.9 Aldehyde
2-Cyclopenten-1-one 21.9 Ketone
5-Hydroxymethylfurfural 63.9 Aldehyde
4-Methylcatechol 47.5 Phenolic
Levoglucosan 652.5 Sugar
Sugars 124.4 Sugar
Methanol 24.4 Alcohol
Total carbon identified 2192.6
Total carbon as measured
by TOC
3879.4
*made by mixing 7 gm pine wood bio-oil with 28 gm water. The WS-PWBO has 3879.4
mmol carbon L-1
, hence the carbon concentration of each component is given in mmol
carbon L-1
for that compound in WS-PWBO. Fraction carbon contribution of each
compound can be found by dividing mmol carbon L-1
for that compound by 3879.4 mmol
carbon L-1
.
We next examined the composition of the product stream from low temperature
hydrogenation of the DOE-BO. The H/Ceff ratio rose from 0.06 to 0.09 with about 0.9 g
hydrogen consumed per 100 g carbon in the feed during this step. The water content of
the bio-oil also increased from 24.8 wt% to 27 wt% during the low temperature
hydrogenation step. At the same time, the proportion of carbon content identifiable by
GC and HPLC went down (Table 6-12), perhaps as a result of homogeneous thermal
polymerization reactions among the bio-oil components. The GPC analysis of the
hydrogenated DOE bio-oil (Figure 6-4) shows higher concentrations of oligomers with
Page 166
147
molecular weights greater than 400 Da compared to the feed. The amount of thermal
coke formed from DOE bio-oil is reduced from 19.0 wt% to 13.6% upon low temperature
hydrogenation (Table 7-2). This implies that the product of low temperature
hydrogenation of DOE-BO is more thermally stable than the feed.
In the case of the water soluble fraction of the pine wood bio-oil (WS-PWBO),
the H/Ceff ratio increased from 0.14 to 0.71 after low temperature hydrogenation, and rose
further to 1.20 upon high temperature hydrogenation. Low temperature hydrogenation
was carried out 125 °C as it was found to be the lowest temperature at which all the
pyrolysis oil functionalities started showing significant activity towards hydrogenation.
The compositions of the low temperature hydrogenated WS-PWBO and high temperature
hydrogenated WS-PWBO based on chromatographic analysis are shown in Figure 7-4 B-
C and in more detail in Table 7-5. In the low temperature hydrogenation we were able to
convert 29.4% of the WSBO feed carbon to gasoline cut 1, gasoline cut 2, and C2 to C6
diols (Figure 7-4B), which can be marketed as products in their own right. Gasoline cut 1
comprises mainly of small (up to 3 carbon atoms) monohydric alcohols boiling in the
temperature range of 65-100 °C. Gasoline cut 2 mainly contains C4 to C6 monohydric
alcohols boiling in the temperature range of 115-174 °C. The C2 to C6 diols boil above
178 °C with ethylene glycol and propylene glycol being the major components. These
product groups can easily be separated by distillation. Gasoline cut 1 and gasoline cut 2
can be added to gasoline as renewable high octane additives. Glycols can be further
purified and sold. The thermal stability of the WS-PWBO increases significantly after
hydrogenation, with a homogeneous thermal coke yield decreasing from 12.8 wt% for the
Page 167
148
WS-PWBO to 2.8 wt% for the WS-PWBO after a low temperature hydrogenation. The
hydrogen consumption for the low temperature hydrogenation process was 4.8 g H2/100
g carbon in the feed.
However, the product distribution still contains significant amounts of hydrogen
deficient compounds such as acetic acid (H/Ceff ratio = 0), levoglucosan (H/Ceff ratio = 0),
and sorbitol (H/Ceff ratio = 0.33). By feeding this stream through a high temperature
hydrogenation reactor at 250 °C and 1450 psi, the total carbon yield of gasoline cut 1,
gasoline cut 2, and C2 to C6 diols increased to 45.8% (Figure 7-4C and Table 7-5). In
this process the product distribution can be customized by modifying the reaction
condition, for example, if there is a larger market for gasoline cut 1, its yield can be
increased by operating the second stage at higher temperatures or lower space velocities.
At higher temperatures, C2 to C6 diols undergo further C-O and C-C bond cleavage
reactions producing small monohydric alcohols. High temperature hydrogenation was
carried out at 250 °C so as to achieve high sorbitol and levoglucosan conversion. In the
high temperature hydrogenation step a 100% levoglucosan conversion and a 95% sorbitol
conversion was obtained. An increase in carbon yield to the desired product groups of
gasoline cut 1, gasoline cut 2, and C2 to C6 diols was observed corresponding to the 80%
of the levoglucosan and sorbitol carbon. Sorbitol can be converted over a supported Pt
catalyst to a mixture of alcohols and polyols through reactions including hydrogenation,
dehydration, decarbonylation, and retro-aldol condensation. While sorbitol is
significantly more thermally stable than glucose it still has a low overall H/Ceff ratio of
0.33 in comparison to the H/Ceff ratios of the possible products from hydrogenolysis of
Page 168
149
sorbitol, including propylene glycol (H/Ceff ratio = 1.33), propanol (H/Ceff ratio = 2), and
butanediols (H/Ceff ratio = 1.5). The net hydrogen consumption for the combined low and
high temperature hydrogenation process was 8.1 g H2/100 g carbon in the feed. The WS-
PWBO had high thermal stability after the high temperature hydrogenation with the
homogeneous thermal coke yield decreasing from 12.8 wt% for the WS-PWBO to 0.2
wt% after high temperature hydrogenation. High pressure hydrogen is necessary in the
high temperature step to minimize carbon loss to less valuable C1 to C4 alkanes.(25, 75)
Page 169
150
Table 7-5 Composition of the WS-PWBO hydrogenation products. Low temperature
hydrogenation reaction conditions: over 5 wt% Ru/C catalyst ; T: 125 °C; P: 750 psi;
WHSV: 3 hour-1
, high temperature hydrogenation reaction conditions: first over 5wt%
Ru/C catalyst (125 °C) then over 5 wt% Pt/C catalyst (250 °C); P: 1450 psi, WHSV: 3
hour-1
Compound
mmol carbon L-1
LTH-WS-
PWBO*
HTH-WS-
PWBO†
Pentane 0 14.5
Hexane 0 115.4
Acetic acid 203.2 104.9
Levoglucosan 341.8 0
Sugars 43.1 6.5
Methanol 49.1 56.8
Ethanol 19.7 47.9
1-Propanol 9.7 42.5
Tetrahydrofuran 0 6.1
2-Butanol 0 15.0
2-Methyltetrahydrofuran 0 21.5
2,5-Dimethyltetrahydrofuran 0 19.7
1-Butanol 4.4 11.7
2-Pentanol 0 4.4
1-Pentanol 0 8.4
Ethylene glycol 498.0 465.1
Cyclopentanol 9.5 23.0
2-Hexanol 0 7.9
Propylene glycol 236.1 400.8
2,3-Butanediol 0 34.9
Cyclohexanol 124.6 51.3
1,2-Butanediol 32.1 137.4
Tetrahydrofurfuryl alcohol 1.0 72.7
1,4-Butanediol 54.2 68.6
γ-Butyrolactone 103.0 110.6
γ-Valerolactone 9.6 12.5
Glycerol 0 48.8
1,2-Cyclohexanediol 106.9 107.7
4-Hydroxymethyl-γ-
butyrolactone
70.1 47.0
Sorbitol 386.9 21.8
3-Methylcyclopentanol 0 33.9
1,2,3-Butanetriol 0 29.2
1,4-Pentanediol 0 23.3
3-methylcyclohexanol 0 34.3
4-methylcyclohexanol 0 20.5
1,2-Hexanediol 0 27.7
Page 170
151
1,2,6-Hexanetriol 0 14.2
Total carbon identified 2355.4 2171.5
Total carbon in liquid as
measured by TOC
3590.3 3405.4
*low temperature hydrogenation product of WS-PWBO, †high temperature
hydrogenation product of WS-PWBO, see footnote of Table 7-4 for concentration units
7.5 Zeolite Upgrading of Non-hydrogenated and Hydrogenated Bio-oil-derived
Feeds
The hydrogenated feeds were then added to the zeolite step (step yields in Figure
7-5 and overall yields in Table 7-6). Only 20% of the DOE bio-oil carbon was converted
to olefins and aromatics if fed directly to the zeolite without any hydrotreatment, with
50% of the carbon forming coke. The remaining 30% of the carbon was converted to CO,
CO2, and unidentified oxygenates. Low temperature hydrogenation raises the yield of
olefins and aromatics after zeolite upgrading to 32.6% (Table 7-6). The low temperature
hydrogenation step only used a small amount of hydrogen but resulted in a significant
increase in the yield of desired products. The improvement in olefins and aromatics yield
from DOE-BO to LTH-DOE-BO is more than what we expected from the corresponding
H/Ceff increase. This can be due to the sizeable reduction in coke yield (35.3%) for LTH-
DOE-BO. It can also be noted in Table 7-1 that CO yield considerably increases from
DOE-BO (13.5% carbon) to LTH-DOE-BO (22.6% carbon). This behavior is similar to
what we observed for glucose (H/Ceff =0) and sorbitol (H/Ceff =0.33). Carbon monoxide
is produced by decarbonylation reactions, whereas coke is produced by homogeneous or
catalytic coking reactions. These reactions are competing parallel reactions. Glucose (or
Page 171
152
DOE-BO) is thermally unstable and hence has higher coking tendency as compared to
sorbitol (or LTH-DOE-BO), resulting in the coking reactions dominating the
decarbonylation reactions. Decarbonylation reactions are one of the two main routes for
deoxygenation of the feed molecule to produce olefins and aromatics (other route is
dehydration). Hence as the feed molecule is thermally stabilized the coking reactions
reduce, decarbonylation increases and olefins and aromatics yield increases as observed
from DOE-BO to LTH-DOE-BO.
Figure 7-5 Carbon yields for the conversion of bio-oil derived feedstocks over HZSM-5
at 873 K. Key: WSBO is the water soluble fraction of the pine wood bio-oil, LTH-WSBO
is WSBO hydrogenated over Ru/C (125 °C, 750 psi, 3 hour-1
), HTH-WSBO is WSBO
hydrogenated first over Ru/C (125 °C, 1450 psi, 3 hour-1
), then over Pt/C (250 °C, 1450
psi, 3 hour-1
). DOE-BO is DOE bio-oil and LTH-DOE-BO is DOE bio-oil hydrogenated
over Ru/C (125 °C, 1450 psi, 1.6 hour-1
). The category others encompasses phenol, alkyl
phenols, naphthol and alkyl naphthols.
0%
20%
40%
60%
80%
100%
WSBO LTH-WSBO HTH-WSBO DOE-BO LTH-DOE-BO
Carb
on
Yie
ld (
%)
Olef ins Aromatics CO CO₂ Coke Others
Page 172
153
Table 7-6 Overall carbon yield for the integrated catalytic process for the conversion of
pyrolysis oils and the aqueous fraction of pyrolysis oil.
Feed Process
Hydrogen
Consumption
(g/100 g carbon
in feed)
Final Products (% carbon yield) or Carbon Selectivity* (%)
C1-C6
Alkanes COx Aromatics Olefins Coke Unidentified
DOE-BO
None 0 18.3 9.8 11.2 49.5 11.2
Zeolite Carbon Selectivity (%)
Benzene: 17.3
Toluene: 40.8
Xylene: 23.5
EtBenz†: 2.0
Ethylene: 51.8
Propylene: 36.6
Butylene: 11.6
DOE-BO
0.9 2 26.5 14.4 18.2 34.6 4.3
Ru/H2 +
Zeolite
Carbon Selectivity (%)
Benzene: 16.9
Toluene: 37.2
Xylene: 38.5
EtBenz: 3.4
Ethylene: 52.2
Propylene: 35.9
Butylene: 11.4
WS-
PWBO
None 0 23.7 8.2 18.5 32.3 17.3
Zeolite Carbon Selectivity (%)
Benzene: 26.8
Toluene: 46.3
Xylene: 20.7
EtBenz: 1.2
Ethylene: 41.6
Propylene: 45.9
Butylene: 12.4
WS-
PWBO
Ru/H2 +
Zeolite
4.8 7.5 13.9 21.6 30.2 17.4 9.4
Carbon Selectivity (%)
Benzene: 17.6
Toluene: 45.5
Xylene: 31.3
EtBenz: 2.6
Ethylene: 31.8
Propylene: 55.4
Butylene: 12.8
WS-
PWBO
8.1 15.0 10.7 18.3 43.0 12.6 0.4
Ru/H2 +
Pt/H2 +
Zeolite
Carbon Selectivity (%)
Benzene: 27.0
Toluene: 49.3
Xylene: 19.1
EtBenz: 2.3
Ethylene: 32.0
Propylene: 53.8
Butylene: 14.2
* carbon selectivity values are reported for individual components benzene, toluene, xylene, ethylbenzene,
ethylene, propylene, and butylene. † EtBenz = Ethylbenzene
Page 173
154
Similar results were observed with the water soluble fraction of the pine wood
bio-oil (WS-PWBO). Direct zeolite upgrading of WS-PWBO affords 26.7% carbon yield
of olefins and aromatics. Low temperature hydrogenation prior to zeolite upgrading
raised the yield to 51.8%, while the high temperature hydrogenation leads to 61.3%
olefins and aromatics yield. The high temperature hydrogenation process converts 15.0%
carbon in WS-PWBO to light alkanes, twice that of low temperature hydrogenation
process. All these points are shown in Figure 7-1 along with the theoretical yield with
toluene as the major product. The difference between experimental and theoretical yields
is reduced with increasing H/Ceff ratio of the WS-PWBO feed indicating that the
hydrogen added is used primarily for increasing the olefin and aromatic yield from the
process. As seen in Table 7-3, the percentage of theoretical toluene yield for water
soluble fraction of the pine wood bio-oil (WS-PWBO) increased from 39.1% to 64.9%
upon low temperature hydrogenation, and increased further to 72.3% upon high
temperature hydrogenation.
The major products obtained in the zeolite upgrading of DOE-BO and WS-
PWBO are C2 to C4 olefins and C6 to C8 aromatic hydrocarbons. Under the reaction
conditions used in this study the olefins selectivity for the DOE bio-oil was 50% to
ethylene, 35% to propylene, with the balance being butylenes. The aromatic selectivity
for the DOE bio-oil decreased with toluene (37-40% selectivity) > xylenes (23.5-38.5%
selectivity) > benzene (17% selectivity). The olefin selectivity for the WS-PWBO was
different than the DOE bio-oil with an olefin selectivity of 55% to propylene, 32% to
ethylene, with the balance being butylenes. The aromatic selectivity for the WSBO
Page 174
155
decreased with toluene (45-50% selectivity) > xylenes (20-30% selectivity) > benzene
(17-27% selectivity). The ratios of these products can be tuned by adjusting both the
reaction conditions and catalytic process. For example, in the zeolite upgrading of high
temperature hydrogenated WSBO the aromatic hydrocarbons to olefin ratio increases
from 1:2.8 to 1:1.1 as the temperature is reduced from 650 °C to 400 °C (Table 7-7).
Olefins can also be converted to aromatics by recycling the olefins back to the zeolite
reactor. Several existing processes can also be used to convert olefins to aromatics
including olefin aromatization and alkylation of the aromatics using olefins.(105, 106)
These
results indicate that the olefin to aromatic ratio and the types of olefins and aromatics
produced can be adjusted according to the market demand using several approaches.
Page 175
156
Table 7-7 Effect of temperature on the product carbon yields (%) for zeolite upgrading of
HTH-WS-PWBO on HZSM-5. WHSV: 11.7 hour-1
, Helium carrier gas flow rate: 204 ml
min-1
, HTH-WS-PWBO was obtained by 2-stage hydrogenation of WS-PWBO.
Hydrogenation reaction conditions, 1st stage: 5 wt% Ru/C catalyst, 125 °C, 1450 psi,
WHSV: 3 hour-1
, 2nd
stage: 5 wt% Pt/C catalyst, 250 °C, 1450 psi, WHSV: 3 hour-1
.
Product Temperature (°C)
400 500 600 650
CO 2.2 6.5 6.8 10.5
CO2 1.3 4.0 5.7 6.6
Coke 27.5 20.2 14.8 13.8
Ethylene 10.9 12.7 16.2 19.0
Propylene 14.7 21.2 27.2 25.7
Butylene 4.6 6.6 7.2 6.1
Olefins 30.3 40.5 50.6 50.7
Benzene 2.7 3.4 5.8 6.5
Toluene 9.9 10.5 10.6 8.9
Xylene 10.9 6.7 4.1 2.6
Ethyl-
benzene
3.3 1.44 0.5
0.2
Styrene 0 0.1 0.3 0.2
Indene 0 0 0.1 0.1
Naphthalene 0 0 0.1 0.1
Aromatics 26.8 22.6 21.5 18.4
Total
identified
carbon (%)
88.1 93.4 99.4 99.9
7.6 Process Economics
The cost of hydrogen is important in determining how much hydroprocessing
should be done before deoxygenation with the zeolite catalyst. Figure 7-6 depicts the
economic potential of our integrated catalytic process as a function of H/Ceff ratio of the
feed to zeolite step for four different hydrogen costs. The economic potential of the
process is calculated by subtracting the cost of process feeds (biomass and hydrogen)
from the selling price of the products. Importantly, the economic potential only includes
Page 176
157
the costs of the raw material and does not include any other operating costs or capital
costs. The market price of hydrogen varies widely depending on location, mode of supply
and natural gas prices. The cheapest hydrogen is from large steam reformers and typically
costs $1.50 to $2.50 per kg.(107)
Whereas, the hydrogen shipped in tube trailers can cost as
much as $12 per kg.(108)
The optimum H/Ceff ratio, where the economic potential of the
process is highest, decreases with increasing hydrogen cost. For example, if hydrogen
cost is $2 per kg then the maximum economic potential occurs at an H/Ceff of 1.4.
Whereas, when the hydrogen cost is $4.20 per kg, the maximum economic potential
occurs when pyrolysis oil is fed directly to the zeolite catalyst without any hydrogenation.
Combining the hydrogenation steps with a zeolite conversion step reduces the overall
hydrogen requirements as compared to using hydrogen for a complete deoxygenation of
pyrolysis oil. A complete deoxygenation of pyrolysis oil by hydrodeoxygenation with a
100% carbon yield to their corresponding hydrocarbons (i.e. alkanes from C1-C6 non-
phenolic oxygenates and aromatics from phenolic compounds) requires 14 to 15 g H2/100
g carbon in the feed, if the catalyst coking problems are overcome. In comparison,
increasing the H/Ceff ratio of pyrolysis oil from 0 to 1.4 requires 11.7 g H2/100 g carbon
in the feed reducing the hydrogen requirements compared to complete
hydrodeoxygenation by 20%. Furthermore, during the hydrotreating process large
amounts of undesired methane is produced which also can significantly increase the
hydrogen requirements. Hydrogen required in these processes should preferably be
obtained from renewable sources such as by reforming of biomass derived feedstock.(15,
29, 109) Alternatively, hydrogen can be obtained from coal gasification or from water
Page 177
158
splitting driven by carbon-free energy sources such as solar, nuclear and wind energy, as
suggested by Agrawal et al.(110)
Figure 7-6 Annual economic potential for the integrated hydroprocessing and zeolite
upgrading of pyrolysis oil as a function of H/Ceff ratio of feed to zeolite catalyst. Data in
Figure 7-1 was used for calculating the economic potential values. The plant capacity was
assumed to be 100 ton hour-1
of biomass. Pyrolysis oil yield was assumed to be 70 wt%
of biomass. It was assumed that in the zeolite upgrading step all olefins produced are
converted to aromatics. July 2010 spot price of benzene of 2.60 $ gallon-1
was used as
aromatic hydrocarbon selling price. Biomass cost was assumed to be $50 per metric ton.
7.7 Conclusion
The study shows that the aromatic hydrocarbons and olefins can be produced with
high yields from the bio-oil and its aqueous fraction. The yield of aromatics and olefins
from the zeolite upgrading increases with increasing H/Ceff ratio of the feed. Bio-oil and
-60
-40
-20
0
20
40
60
80
100
120
0 0.3 0.6 0.9 1.2 1.5 1.8 2.1
Ec
on
om
ic p
ote
nti
al (
millio
n $
ye
ar-1
)
H/Ceff ratio of zeolite feed
EP1 (H₂ cost: 1 $/kg) EP2 (H₂ cost: 2 $/kg)
EP3 (H₂ cost: 3 $/kg) EP4 (H₂ cost: 4.2 $/kg)
Page 178
159
WSBO is hydrogen deficient and hence hydrogen needs to be added to these feeds to
achieve high yields of valuable products. There exists an optimum H/Ceff ratio for bio-oil
derived feeds where the economic potential of the process will be maximum. The
optimum H/Ceff ratio depends mainly on the cost of hydrogen.
Three classes of chemistry are needed for efficient conversion of biomass into
petrochemicals are: (1) pyrolysis of biomass into bio-oil using thermal decomposition
processes; (2) hydrotreatment of bio-oils using supported metal catalysts and hydrogen;
and (3) production of aromatics and olefins from the hydrotreated bio-oils with zeolite
catalysts. By optimizing these three processes a range of petrochemicals can be produced.
The goals of the reaction chemistry in the hydrogenation steps are to add hydrogen to the
biomass derived molecules with (1) controlled cleavage of C-C and C-O bonds, and (2)
complete hydrogenation of thermally unstable aldehyde, ketone, carboxyl, and sugar
functionalities to corresponding alcohols. Cleavage of C-C bond is desired such that
hydrogen deficient molecules like sorbitol are converted to hydrogen rich molecules such
as ethylene glycol and propylene glycol. Further C-C bond cleavage to lighter alkanes
(e.g. methane) is undesired. A controlled C-O bond cleavage is preferred when a further
increase in H/Ceff ratio is desired or when a high yield of gasoline cut 1 is desired. An
example of C-O bond cleavage reaction occurring in the hydrotreatment step is the
conversion of ethylene glycol to ethanol. A further C-O cleavage in ethanol is not desired
as it will produce undesired ethane.
Page 179
160
Zeolite catalysts convert the biomass feedstocks into aromatics and olefins which
can fit easily into the existing infrastructure. Increasing the yield of petrochemical
products from biomass therefore requires hydrogen. Thus there exists an optimum
solution for the economical maximum yield of petrochemical feedstocks products that is
dictated by the cost of hydrogen. It is expected that future advances in the field of metal
and zeolite catalysts combined with reaction engineering will allow us to design even
more efficient and economical processes to convert biomass resources to renewable
chemical industry feedstocks.
Page 180
161
CHAPTER 8
CONCLUSIONS AND FUTURE WORK
8.1 Conclusions
We have used a combination of characterization techniques to understand the
physical and chemical nature of bio-oils. Bio-oil was found to contain GC and HPLC
detectable C2 to C6 oxygenated hydrocarbon with various functionalities including
aldehydes, ketones, acids, and carbohydrates. The most abundant components of the bio-
oil were found to be levoglucosan, acetic acid, hydroxyacetaldehyde, and
hydroxyacetone. Only about 40% carbon in the bio-oil was detectable by GC and HPLC,
with the balance being GC and HPLC non-detectable oligomers. Using gel permeation
chromatography it was determined that the bio-oil also contained GC and HPLC
undetectable high molecular weight oligomers with molecular weights from 200 to up to
10000 Da. Bio-oil was found to be up to 62 wt% soluble in water, with water soluble
fraction mainly containing the C2 to C6 oxygenated hydrocarbons. Bio-oil phase
separated readily in water soluble (WSBO) and water insoluble (WIBO) phases upon
addition of water. Up to 60% carbon in the water soluble bio-oil can be detected by GC
and HPLC as opposed to about 40% in bio-oil and less than 20% in water insoluble bio-
oil.
The stability analysis of the bio-oil showed that the viscosity and molecular
weight of bio-oil and its fractions increases when incubated at 90 °C. The rate of
viscosity increase upon aging is higher for the water insoluble fraction of bio-oil (WIBO)
Page 181
162
than that for bio-oil than that for the water soluble fraction of bio-oil. The WIBO contains
a high concentration of high molecular weight lignin oligomers, implying that these
oligomers are largely responsible for the bio-oil instability. The aqueous fraction of the
bio-oil was completely stabilized by hydrogenation over Ru/C catalyst at 125 °C. Char
can be removed from the bio-oil by microfiltration using ceramic membranes with pore
sizes less than 1 µm. Removal of char does not affect the bio-oil stability but is desired as
char can cause difficulty in further processing of the bio-oil. The high molecular weight
(HMW) lignin was found to be the major contributor towards the absolute viscosity of
bio-oil as well as towards the increase in bio-oil viscosity during the incubation at 90 °C.
The viscosity increase in the bio-oil was due to two reasons: increase in the average
molecular weight and increase in the concentration of high molecular weight oligomers.
Nanofiltration by 5 nm membrane was found to reduce the rate of viscosity increase and
molecular weight increase in bio-oil.
We produced hydrogen and alkanes from the aqueous fraction of the bio-oil
(WSBO). The key step in that process is the low temperature hydrogenation (LTH) of
WSBO over Ru/C catalyst. The LTH step reduced the thermally unstable bio-oil
functionalities to corresponding alcohols, which are thermally stable. The challenge in
the LTH step is to minimize the carbon loss to gas phase products. Hydrogen was
produced with 60% selectivity whereas alkanes were produced with up to 97%
selectivity. WSBO is less active for reforming as compared to pure sorbitol. The alkane
selectivity obtained from water soluble bio-oil is towards the higher alkanes (C5 and C6
alkanes) as compared to pure sorbitol. Alkane selectivity can be increased by supplying
Page 182
163
hydrogen externally or by addition of strong acid such as HCl to the feed. The external
hydrogen suppresses the reforming reactions that are otherwise necessary to produce
hydrogen required in hydrogenation/dehydration. The addition of HCl in the feed
expedites the dehydration reaction resulting in higher alkanes yield.
Ideally pyrolysis oils needs to be deoxygenated to a mixture of organic molecules
that are more compatible with current fuels and chemicals infrastructure. Oxygenated
gasoline additives and valuable C2 to C6 diols can be produced with high carbon yield
from the aqueous fraction of the bio-oil (WSBO) in a 2-stage process. The goal of the
first step is to stabilize WSBO for high temperature processing by completely
hydrogenating the thermally unstable compounds while minimizing the carbon loss to gas
phase. The major products obtained are ethylene glycol, propylene glycol, and sorbitol.
The optimum temperature (where maximum product yield is observed) was found to be
125 °C with optimum space velocity of about 1.5 to 3 hour-1
. In the second stage, sorbitol
is converted over Pt/C catalyst to more diols and monohydric alcohols. Up to 46% carbon
of the WSBO was successfully converted to gasoline cut 1, gasoline cut 2, and C2 to C6
diols. The product selectivity can be controlled by manipulating pressure and temperature
of the second stage. The product selectivity is a function of feed composition. C2 to C6
diols were obtained as major product from WS-PWBO, whereas, monohydric alcohols
were the major products from WS-DOE-BO. The rate of C-O bond cleavage is higher in
WS-DOE-BO due to high acetic acid concentration as it can catalyze the dehydration
reactions. To achieve the maximum yield to desired products from two-stage
hydroprocessing of bio-oil, the catalyst in the first step should have high hydrogenation
Page 183
164
activity and low C-C bond cleavage activity, the catalyst in the second stage should have
moderate C-C and C-O bond cleavage activity. The bio-oils with high water solubility
and low acid content are desired.
In addition to water soluble bio-oil, we also hydrogenated whole bio-oil in single
stage over Ru/C catalyst. A quantifiable reactant disappearance was observed only at 125
°C but no corresponding hydrogenation products were observed. The average molecular
weight of bio-oil increased upon hydrogenation due to bio-oil self-polymerization. It is
possible that the lignin oligomers present in the bio-oil are occupying the catalyst sites
and the disappearance of reactants is only because of the homogenous thermal
polymerization reactions.
In addition to the production of alcohols and diols, we have also shown that
hydroprocessing can be combined with zeolite upgrading to produce aromatics and
olefins in high yields from WSBO and bio-oil. The yield of aromatics and olefins from
the zeolite upgrading increases with increasing H/Ceff ratio of the feed. The product
selectivity can be manipulated by changing the temperature of zeolite upgrading reactor.
Bio-oil and WSBO is hydrogen deficient and hence hydrogen needs to be added to these
feeds to achieve high yields of valuable products. Combing the hydroprocessing with
zeolite upgrading requires less hydrogen as compared to a complete hydrodeoxygenation
by hydrotreating. The increase in the olefins and aromatics yield after the addition of
hydrogen to the feed is due to two reasons:
1. Addition of hydrogen increases the thermal stability of feed resulting in less coke.
Page 184
165
Addition of hydrogen increases the intrinsic hydrogen content of feed resulting in less
CO and CO2.
2. Zeolite catalysts convert the biomass feedstocks into aromatics and olefins which can
fit easily into the existing chemicals infrastructure. Increasing the yield of petrochemical
products from biomass therefore requires hydrogen. Thus there exists an optimum
solution for the economical maximum yield of petrochemical feedstocks products that is
dictated by the cost of hydrogen. It is expected that future advances in the field of metal
and zeolite catalysts combined with reaction engineering will allow us to design even
more efficient and economical processes to convert biomass resources to renewable
chemical industry feedstocks.
This work has significant practical implications. Bio-oil to date has no market due
to the drawbacks associated with it. The aqueous phase processing of water soluble bio-
oil can be used to produce hydrogen and alkanes from bio-oil. The hydroprocessing and
zeolite upgrading can be used to produce a wide range of products including gasoline-
range alcohols, C2 to C6 diols, aromatics, and olefins. The processes that we have
developed are flexible such that the desired products can be produced depending on the
market demand. These processes can hence form a core of a biorefinery based on
catalytic fast pyrolysis of biomass. Five of the seven (benzene, toluene, xylene, ethylene,
propylene) chemical industry building blocks can be produced using the processes
described here, opening the door to a chemical industry based on renewable biomass
feedstock.
Page 185
166
8.2 Future Work
In this work we have shown that the high molecular weight lignin is mainly
responsible for the bio-oil instability. More work needs to be done on modifying the
pyrolysis process such that the concentration of HMW lignin in bio-oils is reduced. It is
possible that lignin is depolymerized during pyrolysis but it repolymerizes during the
char separation and condensation resulting in the formation of high molecular weight
oligomers. To eliminate HMW lignin it would be crucial to know if it is coming from
non-depolymerized lignin or from the repolymerization of depolymerized lignin. The bio-
oil vapors can possibly be selectively condensed such that HMW lignin is condensed
separately from other bio-oil components due to its high boiling point. This strategy
needs to be studied in detail.
In the bio-oil hydroprocessing, a completely different product distribution was
obtained for WS-PWBO and WS-DOE-BO. We attributed this to high acid content of the
DOE-BO. This phenomenon needs to be studied in detail. Bio-oil from various sources
such as hardwood, softwood, switch grass, and corn stover can be tested. Bimetallic PtRe
catalyst fared better towards hydrogenating acetic acid as compared to monometallic Pt
catalyst. The carbon loss to gas phase was also less for PtRe catalyst compared to Pt
catalyst. More bimetallic catalysts need to be tested in these processes. Other factors such
as ratio of Pt to Re in the bimetallic catalyst can also be studied.
Page 186
167
We were able to hydrogenate the components of the water soluble fraction of bio-
oil successfully. Whereas, in the case of low temperature hydrogenation of bio-oil we
observed that the reactants disappeared but did not detect any corresponding alcohols
products as discussed in Section 6.9. The average molecular weight of bio-oil increased
upon hydrogenation due to bio-oil self-polymerization. It is possible that the lignin
oligomers present in the bio-oil are occupying the catalyst active sites and the
disappearance of reactants is only because of the homogenous thermal polymerization
reactions. Bio-oil lignin oligomer model compound hydrogenation studies can be carried
out to study this in detail. These studies will also help in designing the processes for the
hydrogenation of whole bio-oil. Previous lignin model hydrodeoxygenation efforts have
revolved around simpler model compounds such as guaiacol, phenol, catechol, and
anisole over conventional CoMo-NiMo as well as on noble metal catalysts.(69, 70, 111-113)
These monomers are not realistic lignin model compounds as the water insoluble bio-oil
contains high molecular weight oligomers. Hence the hydrodeoxygenation of simple
oligomers like a trimer shown below should be studied in future.
Optimum reaction conditions (temperature, pressure), catalyst screening and catalyst
deactivation studies need to be done for hydrodeoxygenation of such model compounds.
Page 187
168
BIBLIOGRAPHY
1. G. W. Huber, S. Iborra, A. Corma, Chem. Rev. 106, 4044 (2006).
2. Y. Roman-Leshkov, C. J. Barrett, Z. Y. Liu, J. A. Dumesic, Nature 447, 982
(2007).
3. D. L. Klass, Biomass for renewable energy, fuels and chemicals. (Academic
Press, San Diego, 1998).
4. C. E. Wyman, Annu. Rev. Energy Env. 24, 189 (1999).
5. C. E. Wyman et al., Bioresour. Technol. 96, 1959 (2005).
6. R. D. Perlack et al., “Biomass as Feedstock for a Bioenergy and Bioproducts
Industry: The Technical Feasibility of a Billion-Ton Annual Supply” DOE/GO-
102995-2135 (Oak Ridge National Laboratory, 2005).
7. S. Czernik, A. V. Bridgwater, Energy Fuels 18, 590 (2004).
8. A. V. Bridgwater, G. V. C. Peacocke, Renewable Sustainable Energy Rev. 4, 1
(2000).
9. A. V. Bridgwater, D. Meier, D. Radlein, Org. Geochem. 30, 1479 (1999).
10. D. Mohan, C. U. Pittman, P. H. Steele, Energy Fuels 20, 848 (2006).
11. P. J. Dauenhauer, B. J. Dreyer, N. J. Degenstein, L. D. Schmidt, Angew. Chem.,
Int. Ed. 46, 5864 (2007).
12. M. J. A. Tijmensen, A. P. C. Faaij, C. N. Hamelinck, M. R. M. v. Hardeveld,
Biomass Bioenergy 23, 129 (2002).
13. T. R. Carlson, T. P. Vispute, G. W. Huber, ChemSusChem 1, 397 (2008).
14. T. R. Carlson, J. Jae, Y. C. Lin, G. A. Tompsett, G. W. Huber, J. of Catal. 270,
110 (2010).
15. R. D. Cortright, R. R. Davda, J. A. Dumesic, Nature 418, 964 (2002).
16. G. W. Huber, J. N. Chheda, C. J. Barrett, J. A. Dumesic, Science 308, 1446
(2005).
17. E. L. Kunkes et al., Science 322, 417 (2008).
Page 188
169
18. A. V. Bridgwater, Chem. Eng. J. 91, 87 (2003).
19. A. V. Bridgwater, M. L. Cottam, Energy Fuels 6, 113 (1992).
20. M. Wright, R. C. Brown, Biofuels, Bioprod. Bioref. 1, 191 (2007).
21. J. P. Diebold, “A Review of the Chemical and Physical Mechanisms of the
Storage Stability of Fast Pyrolysis Bio-Oils” NREL/SR-570-27613 (National
Renewable Energy Laboratory, 2000).
22. F. A. Agblevor, S. Besler, D. Montane, R. J. Evans, Abstracts of Papers of
American Chemical Society 209, 8 (1995).
23. D. Radlein, in The Fast Pyrolysis of Biomass: A Handbook, A. V. Bridgwater et
al., Eds. (CPL Press, Newbury, UK, 1999), pp. 164-188.
24. R. Bayerbach, D. Meier, J. Anal. Appl. Pyrolysis 85, 98 (2009).
25. G. W. Huber, R. D. Cortright, J. A. Dumesic, Angew. Chem., Int. Ed. 43, 1549
(2004).
26. G. W. Huber, J. W. Shabaker, S. T. Evans, J. A. Dumesic, Appl. Catal. B 62, 226
(2006).
27. R. R. Davda, J. W. Shabaker, G. W. Huber, R. D. Cortright, J. A. Dumesic, Appl.
Catal. B 56, 171 (2005).
28. G. W. Huber, J. A. Dumesic, Catal. Today 111, 119 (2006).
29. T. P. Vispute, G. W. Huber, Green Chem. 11, 1433 (2009).
30. D. C. Elliott, Energy Fuels 21, 1792 (2007).
31. S. P. Zhang, Y. J. Yan, J. W. Ren, T. C. Li, Energy Sources 25, 57 (2003).
32. J. D. Adjaye, N. N. Bakhshi, Fuel Process. Technol. 45, 161 (1995).
33. J. D. Adjaye, N. N. Bakhshi, Fuel Process. Technol. 45, 185 (1995).
34. P. Badger, U.S. Patent Application No. 11/480 914.
35. P. Badger, P. Fransham. U.S. Patent Application No. 11/480 915.
36. S. Elmaleh, W. Naceur, J. Mem. Sci. 66, 227 (1992).
Page 189
170
37. L. V. Cremades, E. Rodriguez-Grau, R. Mulero, J. A. Cusido, Water SA 33, 253
(2007).
38. G. V. C. Peacocke, P. A. Russel, J. D. Jenkins, A. V. Bridgwater, Biomass
Bioenergy 7, 169 (1994).
39. B. Scholze, D. Meier, Journal of Analytical and Applied Pyrolysis 60, 41 (2001).
40. K. Sipila, E. Kuoppala, L. Fagernas, A. Oasmaa, Biomass Bioenergy 14, 103
(1998).
41. A. Oasmaa, S. Czernik, Energy Fuels 13, 914 (1999).
42. J. Piskorz, D. S. Scott, D. Radlien, in Pyrolysis Oils from Biomass: Producing
Analyzing and Upgrading, E. J. Soltes, T. A. Milne, Eds. (American Chemical
Society, Washington DC, 1988), pp. 167-178.
43. S. Helle, N. M. Bennett, K. Lau, J. H. Matsui, S. J. B. Duff, Carbohydrate Res.
342, 2365 (2007).
44. Z. Y. Luo et al., Biomass Bioenergy 26, 455 (2004).
45. M. Garcia-Perez et al., Energy Fuels 20, 364 (2006).
46. M. E. Boucher, A. Chaala, H. Pakdel, C. Roy, Biomass Bioenergy 19, 351 (2000).
47. B. Scholze, D. Meier, Journal of Analytical and Applied Pyrolysis 60, 41 (20011).
48. S. T. Srinivas, A. K. Dalai, N. N. Bakhshi, Can. J. Chem. Eng. 78, 343 (2000).
49. J. P. Diebold, S. Czernik, Energy Fuels 11, 1081 (1997).
50. E. Fratini et al., Langmuir 22, 306 (2006).
51. S. Czernik, D. K. Johnson, S. Black, Biomass Bioenergy 7, 187 (1994).
52. A. Oasmaa, E. Kuoppala, Y. Solantausta, Energy Fuels 17, 433 (2003).
53. A. Oasmaa, E. Kuoppala, Energy Fuels 17, 1075 (2003).
54. A. Oasmaa, E. Kuoppala, S. Gust, Y. Solantausta, Energy Fuels 17, 1 (2003).
55. A. Holmqvist, O. Wallberg, A. S. Jonsson, Chem. Eng. Res. and Des. 83, 994
(2005).
56. A. S. Jonsson, A. K. Nordin, O. Wallberg, Chem. Eng. Res. Des. 86, 1271 (2008).
Page 190
171
57. T. Tzanetakis, N. Ashgriz, D. F. James, M. J. Thomson, Energy Fuels 22, 2725
(2008).
58. Q. Lu, W. Z. Li, X. F. Zhu, Energy Convers. Manage. 50, 1376 (2009).
59. T. A. Milne, C. C. Elam, R. J. Evans, “Hydrogen from Biomass: State of the Art
and Research Challenges” (Report No. IEA/H2/TR-02/001, International Energy
Agency, 2002).
60. R. K. Sharma, N. N. Bakhshi, Energy Fuels 7, 306 (1993).
61. P. Gallezot, N. Nicolaus, G. Flèche, P. Fuertes, A. Perrard, J. Catal. 180, 51
(1998).
62. J. Wisniak, R. Simon, Ind. Eng. Chem. Prod. Res. Dev. 18, 50 (1979).
63. Z. Zhang, J. E. Jackson, D. J. Miller, Appl. Catal., A 219, 89 (2001).
64. H. A. Pray, C. E. Schweichert, B. H. Minnich, Ind. Eng. Chem. 44, 1146 (1952).
65. D. C. Elliott, E. G. Baker, “Biomass Liquifaction Product Analysis and
Upgrading”, (Report No. 23130, NRCC, Sherbrooke, Quebec, Canada, 1983).
66. T. L. Marker et al., “Opportunities for Biorenewables in Petroleum Refineries”
(Final Report DE-FG36-05GO15085, UOP LLC, Des Plaines, IL, 2005);
http://www.osti.gov/bridge/servlets/purl/861458-Wv5uum/861458.pdf.
67. J. D. Adjaye, S. P. R. Katikaneni, N. N. Bakhshi, Fuel Process. Technol. 48, 115
(1996).
68. R. Maggi, B. Delmon, in Hydrotreatment and Hydroprocessing of Oil Fractions,
G. F. Froment, B. Delmon, P. Grange, Eds. (Elsevier Science B. V., 1997).
69. E. Furimsky, Appl. Catal. A 199, 147 (2000).
70. D. C. Elliott, T. R. Hart, Energy Fuels 23, 631 (2009).
71. B. Scholze, Long-term stability, catalytic upgrading, and application of pyrolysis
oilssImproving the properties of a potential substitute for fossil fuels, thesis,
University of Hamburg (2002).
72. D. Wang, D. Montane, E. Chornet, Appl. Catal., A 143, 245 (1996).
Page 191
172
73. P. R. Patwardhan, J. A. Satrio, R. C. Brown, B. H. Shanks, J. Anal. Appl.
Pyrolysis 86, 323 (2009).
74. Q. Xiang, Y. Y. Lee, R. W. Torget, Appl. Biochem. Biotechnol. 115, 1127 (04/01,
2004).
75. N. Li, G. W. Huber, J. Catal. 270, 48 (2010).
76. J. E. Carnahan, T. A. Ford, W. F. Gresham, W. E. Grigsby, G. F. Hager, J. Am.
Chem. Soc. 77, 766 (1955).
77. M. Schlaf, Dalton Trans., 4645 (2006).
78. D. K. Sohounloue, C. Montassier, J. Barbier, React. Kinet. Catal. Let. 22, 391
(1983).
79. S. P. Crabtree, R. C. Lawrence, M. W. Tuck, D. V. Tyres, Hydrocarbon Process.
85, 87 (2006).
80. R. R. Davda, J. W. Shabaker, G. W. Huber, R. D. Cortright, J. A. Dumesic, Appl.
Catal., B 43, 13 (2003).
81. E. P. Maris, R. J. Davis, J. Catal. 249 328 (2007).
82. T. Miyazawa, Y. Kusunoki, K. Kunimori, K. Tomishige, J. Catal. 240, 213
(2006).
83. T. Miyazawa, S. Koso, K. Kunimori, K. Tomishige, J. of Catal. 318, 244 (2007).
84. V. Pallassana, M. Neurock, J. Catal. 209, 289 (2002).
85. M. Stöcker, Microporous Mesoporous Mat. 29, 3 (1999).
86. A. G. Gayubo, A. T. Aguayo, A. Atutxa, R. Aguado, J. Bilbao, Ind. Eng. Chem.
Res. 43, 2610 (2004).
87. A. G. Gayubo et al., Ind. Eng. Chem. Res. 43, 2619 (2004).
88. A. G. Gayubo, A. T. Aguayo, A. Atutxa, B. Valle, J. Bilbao, J. Chem. Technol.
Biotechnol. 80, 1244 (2005).
89. P. Chantal, S. Kaliaguine, J. L. Grandmaison, A. Mahay, Appl. Catal. 10, 317
(1984).
Page 192
173
90. T. A. Milne, R. J. Evans, J. Filley, in Research in Thermochemical Biomass
Conversion A. V. Bridgwater, J. L. Kuester, Eds. (Elsevier Appl. Sci., London,
1988).
91. C. H. Bartholomew, R. J. Farrauto, Fundamentals of Industrial Catalytic
Processes. (Wiley, Hoboken, NJ, 2006).
92. J. T. F. Degnan, M. Smith, C. R. Venkat, Appl. Catal., A 221, 283 (2001).
93. C. Perego, P. Ingallina, Catal. Today 73, 3 (2002).
94. Alpha Olefins Applications Handbook G. R. Lappin, J. D. Sauer, Eds., (Marcel
Dekker, New York, NY, 1989).
95. H. H. Szmant, Organic Building Blocks of the Chemical Industry. (John Wiley,
New York, NY, 1989).
96. N. Y. Chen, J. T. F. Degnan, L. R. Koenig, Chemtech 16, 506 (1986).
97. T. A. Milne, F. Agblevor, M. Davis, S. Deutch, D. Johnson, in Developments in
Thermal Biomass Conversion, A. V. Bridgwater, D. G. B. Boocock, Eds. (Blackie
Academic and Professional, London, UK, 1997), pp. 409-424.
98. J. S. Shabtai, W. W. Zmierczak, E. Chornet, US Patent 5959167. (The University
of Utah Research Foundation, USA, 1999).
99. J. S. Shabtai, W. W. Zmierczak, E. Chornet, US Patent 6172272 B1. (The
University of Utah, USA, 2001).
100. J. E. Miller, L. Evans, A. Littlewolf, D. E. Trudell, Fuel 78, 1363 (1999).
101. C. Zhao, Y. Kou, A. A. Lemonidou, X. Li, J. A. Lercher, Angew. Chem., Int. Ed.
48, 3987 (2009).
102. S. Crossley, J. Faria, M. Shen, D. E. Resasco, Science 327, 68 (2010).
103. C. Zhao, Y. Kou, A. A. Lemonidou, X. B. Li, J. A. Lercher, Chem. Comm. 46,
412 (2010).
104. H. Olcay, L. Xu, Y. Xu, G. W. Huber, ChemCatChem, (2010).
105. M. Guisnet, N. S. Gnep, F. Alario, Appl. Catal., A 89, 1 (1992).
106. V. R. Choudhary, P. Devadas, S. Banerjee, A. K. Kinage, Microporous
Mesoporous Mat. 47, 253 (2001).
Page 193
174
107. C. E. G. Padro, V. Putsche, “Survey of the economics of hydrogen technologies”
NREL/TP-570-27079 (National Renewable Energy Laboratory, 1999).
108. National Research Council and National Academy of Engineering, “The
Hydrogen Economy: Opportunities, Costs, Barriers, and R&D Needs” (National
Academies Press, Washington DC, 2004).
109. G. W. Huber, J. W. Shabaker, J. A. Dumesic, Science 300, 2075 (2003).
110. R. Agrawal, N. R. Singh, F. H. Ribeiro, W. N. Delgass, Proc. Natl. Acad. Sci.
U.S.A. 104, 4828 (2007).
111. R. K. M. R. Kallury, T. T. Tidwell, D. G. B. Boocock, D. H. L. Chow, Can. J.
Chem. 62, 2540 (1984).
112. E. Laurent, B. Delmon, Appl. Catal. A 109, 77 (1994).
113. A. Gutierrez, R. K. Kaila, M. L. Honkela, R. Slioor, A. O. I. Krause, Catal. Today
147, 239 (2009).


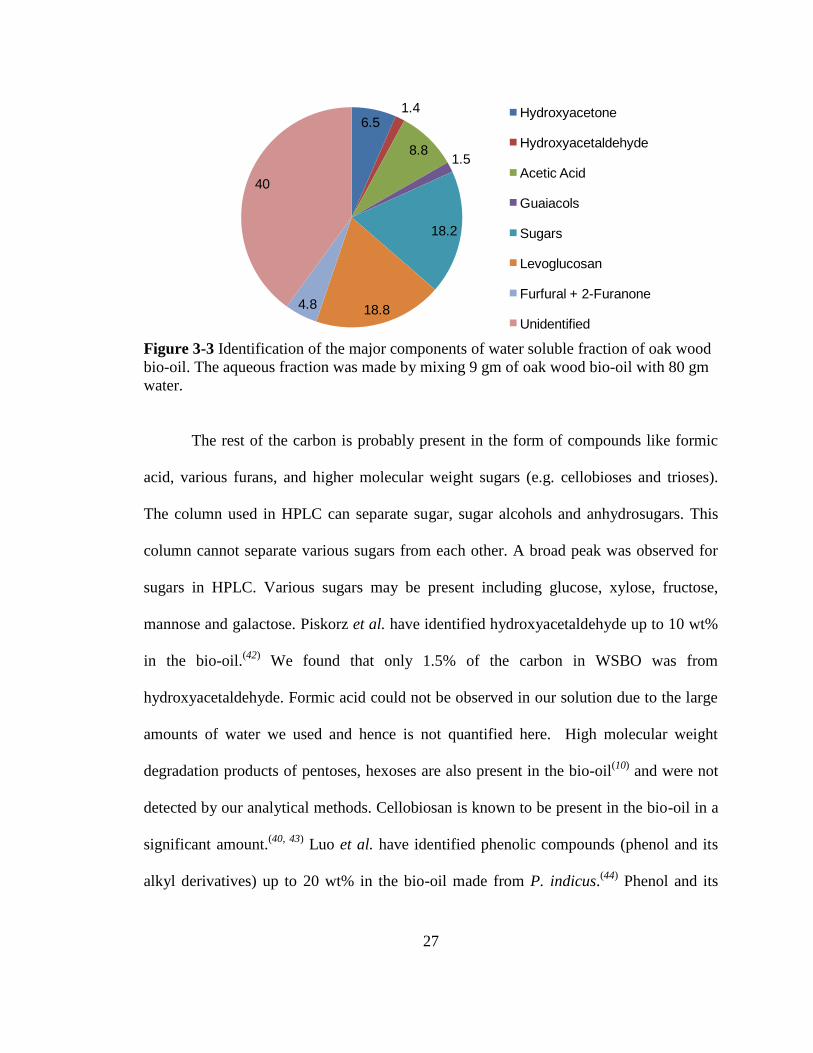


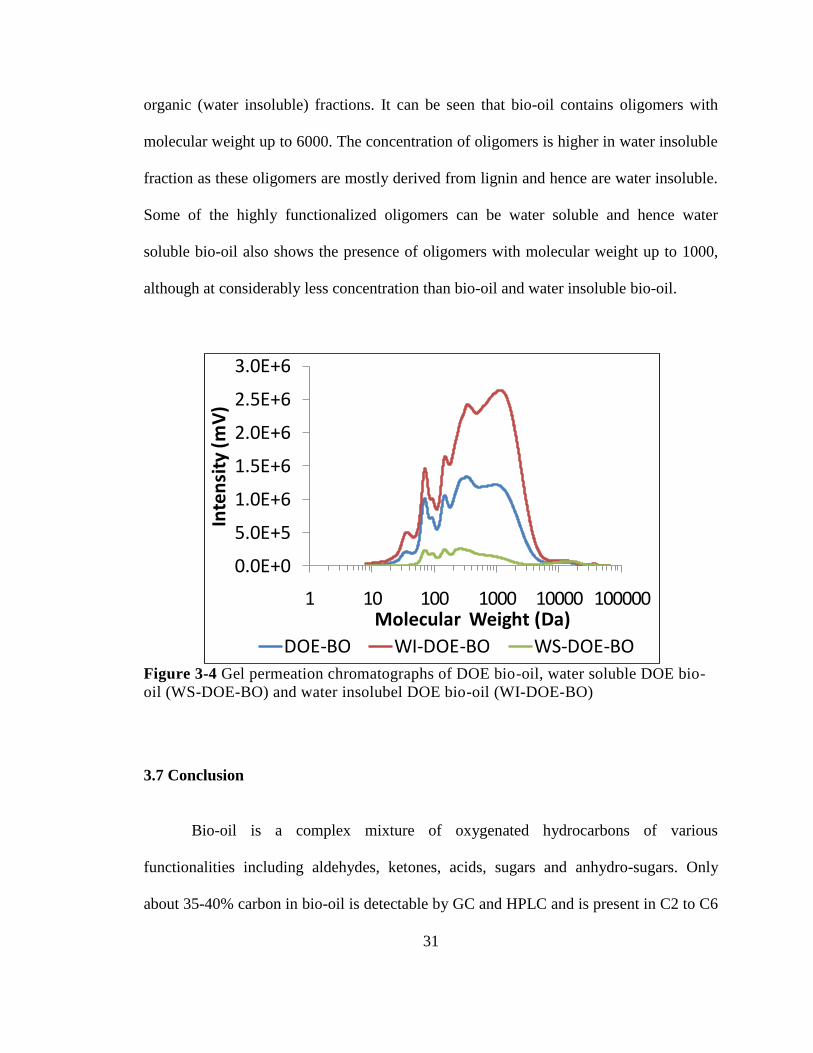


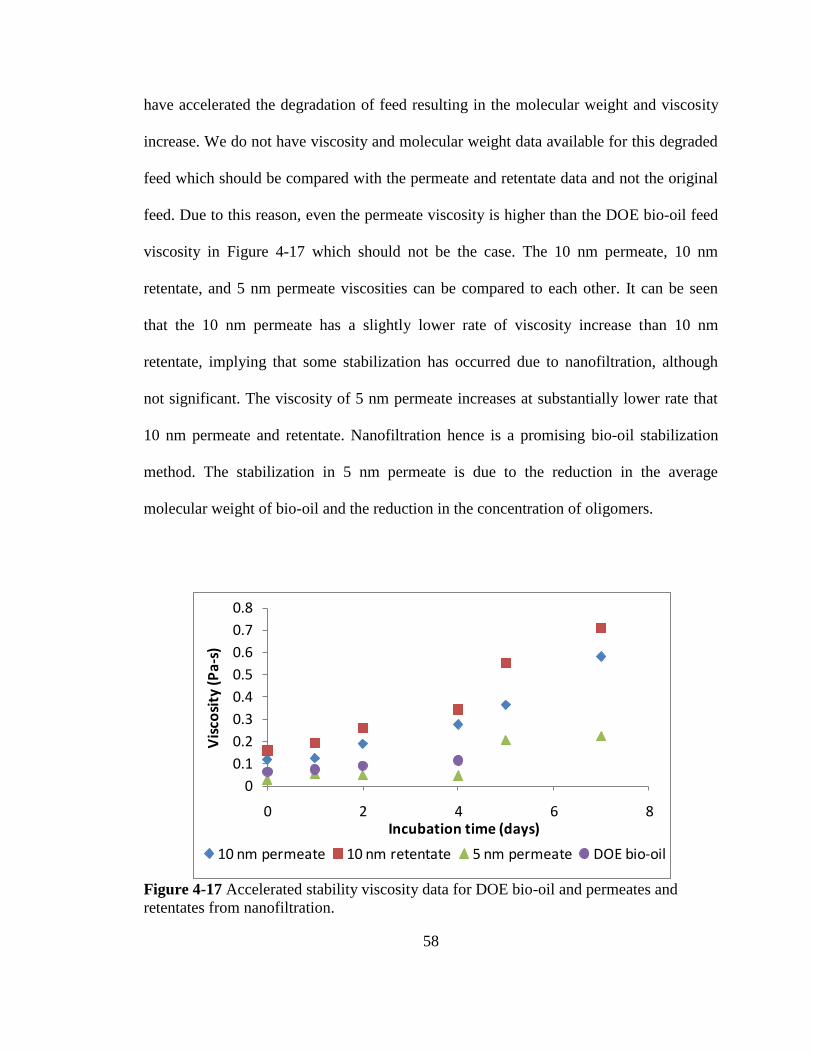


![Hydrotreating of fast pyrolysis oils from protein-rich ...cse.unl.edu/~reich/publications/fuel2013.pdfied the hydrotreating of wood pyrolysis oils over Pd, Pt, and Ru cat-alysts [13,14].](https://static.documents.pub/doc/80x56/5e7907518b5ae83dec4442a6/hydrotreating-of-fast-pyrolysis-oils-from-protein-rich-cseunledureichpublications.jpg)


