18
Pyse Verified-Bounce
Pyse Verified-Bounce
Pyse Verified Set of 4 matrices on which an internal scoring is done to rate the asset quality
• This criteria report evaluates various operational projects across different class of assets. This report covers greenfield or
existing plants, individual or portfolio assets.
• This criteria report serves as a key document for evaluating asset and project quality and focuses on matters specific to
the solar power sector. The evaluation of any transaction involves consideration of additional risks common to all project
finance debt.
• Pyse has identified four key rating factors, each of which plays a significant role in determining the rating outcome for a
given EV asset. These are discussed at various points in the criteria report and will be highlighted as and when used.
• Performance Check — This check ensures that the assets and operations are up to efficiency standards to give the promised returns.
• Credit Check — We perform a credit risk analysis of the off-taker to ensure that the customer who operates the asset pay their
bills on time.
• Operational Check — Resource's validation allows us to rate the quality of the manufacturer and the warranties/insurances
provided along with asset.
• Revenue Check — Pyse carefully vets all commercial contracts to ensure that the investments are securitized, and income is
regular.
Pyse Verified Criteria
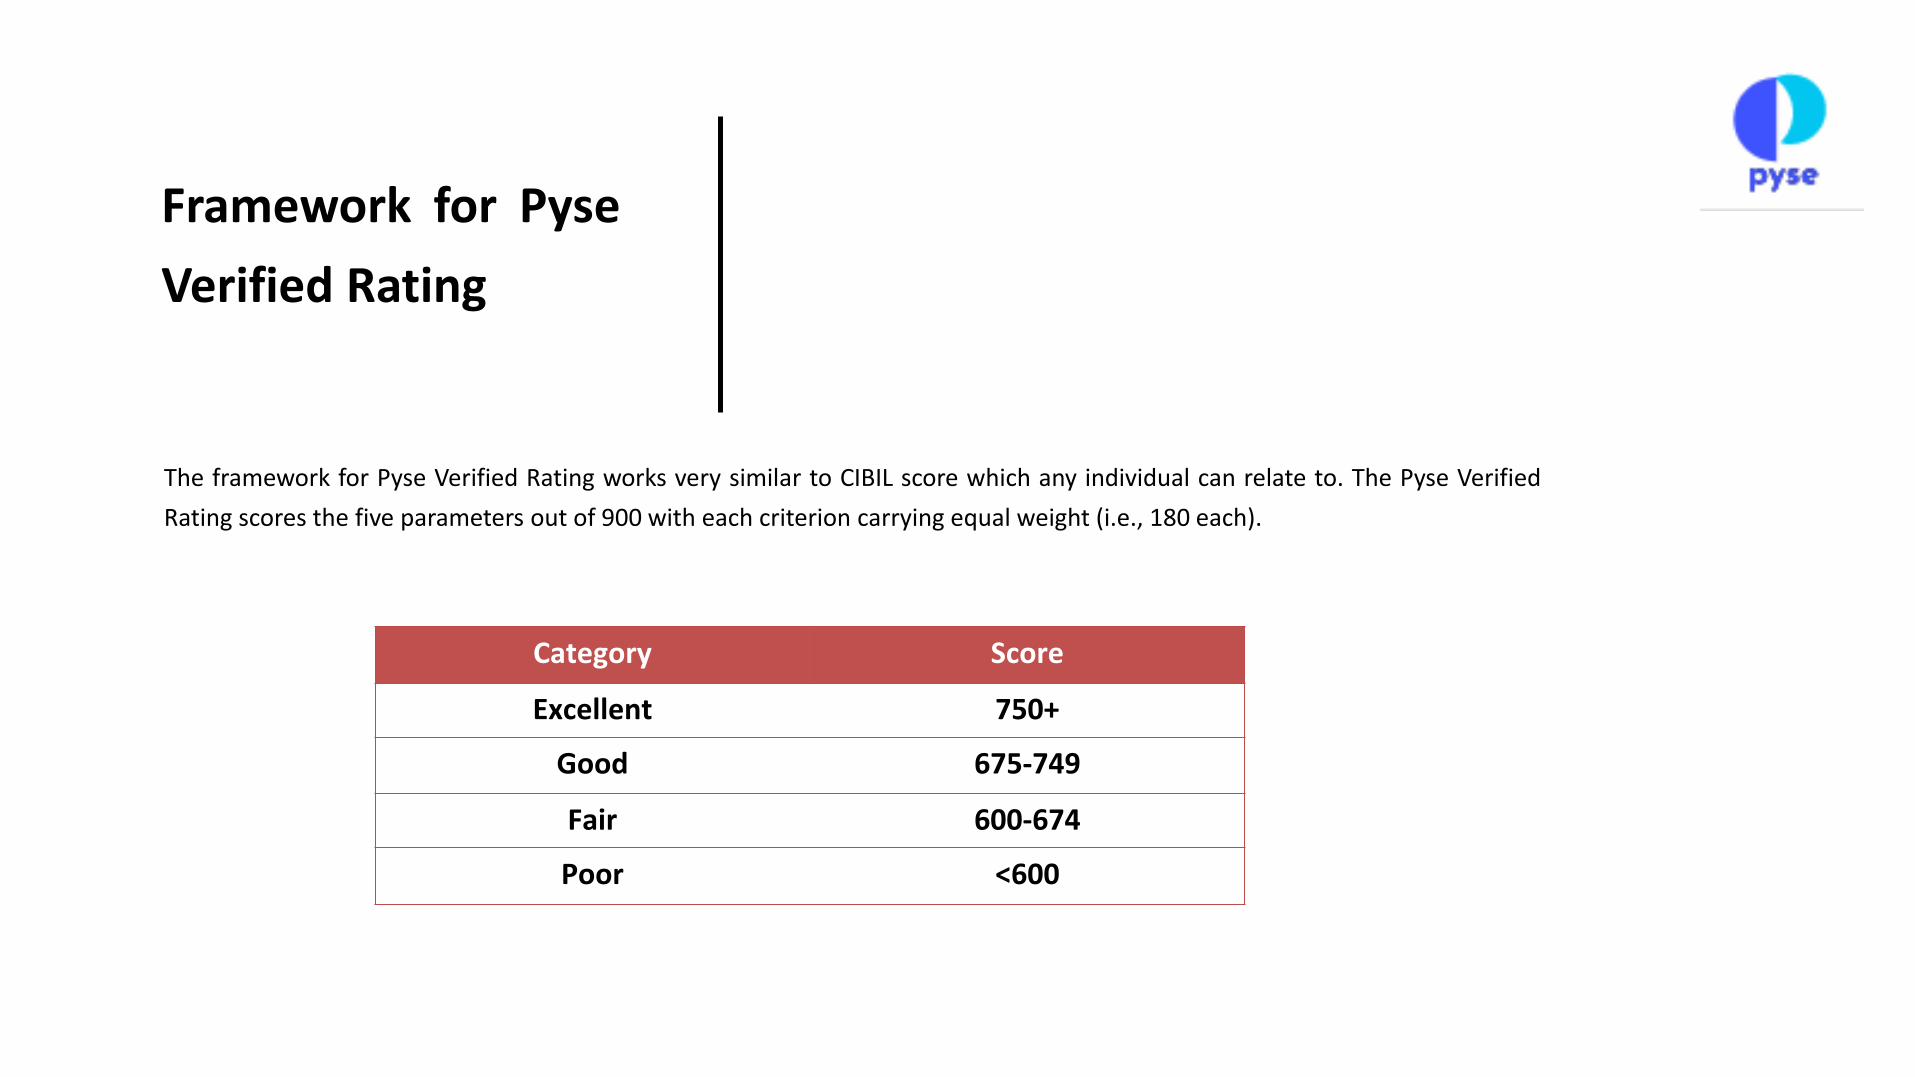
Framework for Pyse
Verified Rating
The framework for Pyse Verified Rating works very similar to CIBIL score which any individual can relate to. The Pyse Verified
Rating scores the five parameters out of 900 with each criterion carrying equal weight (i.e., 180 each).
Category Score
Excellent 750+
Good 675-749
Fair 600-674
Poor <600
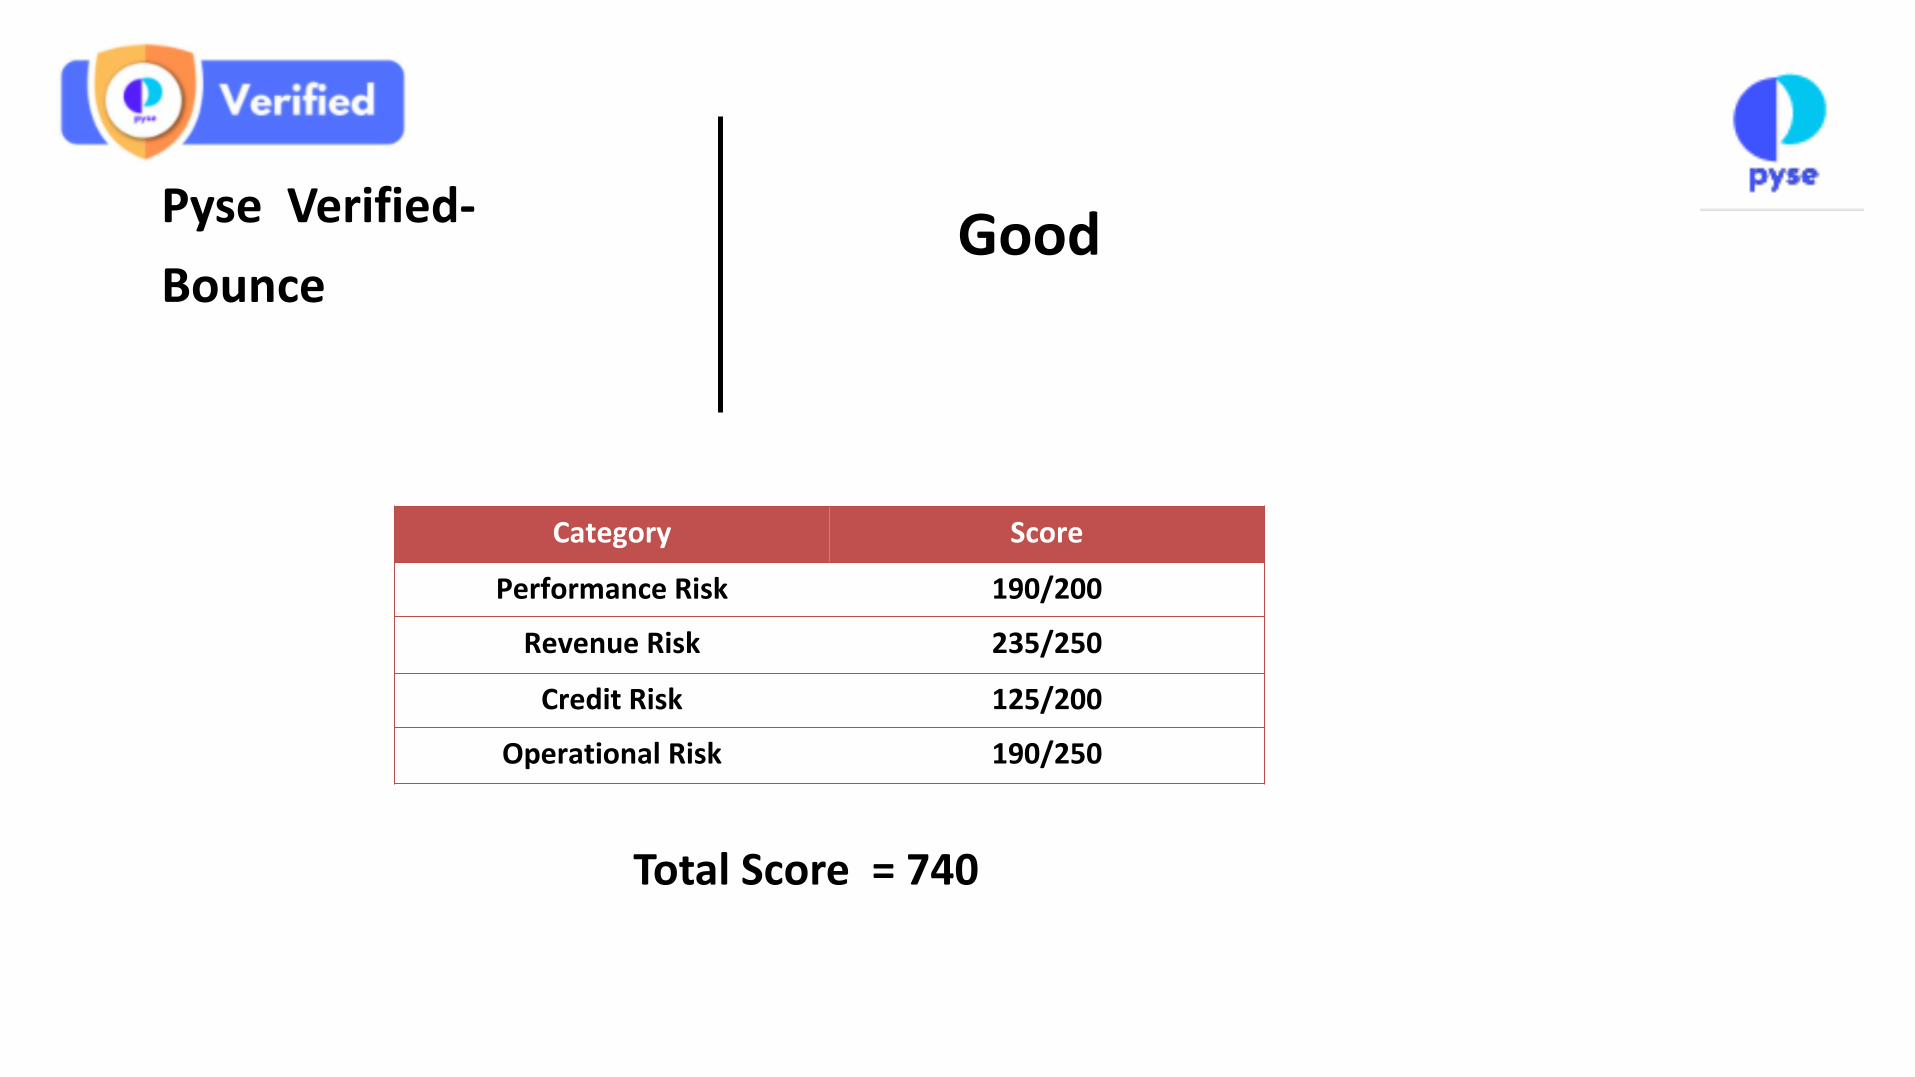
Pyse Verified-
Bounce
Category Score
Performance Risk 190/200
Revenue Risk 235/250
Credit Risk 125/200
Operational Risk 190/250
Total Score = 740
Good
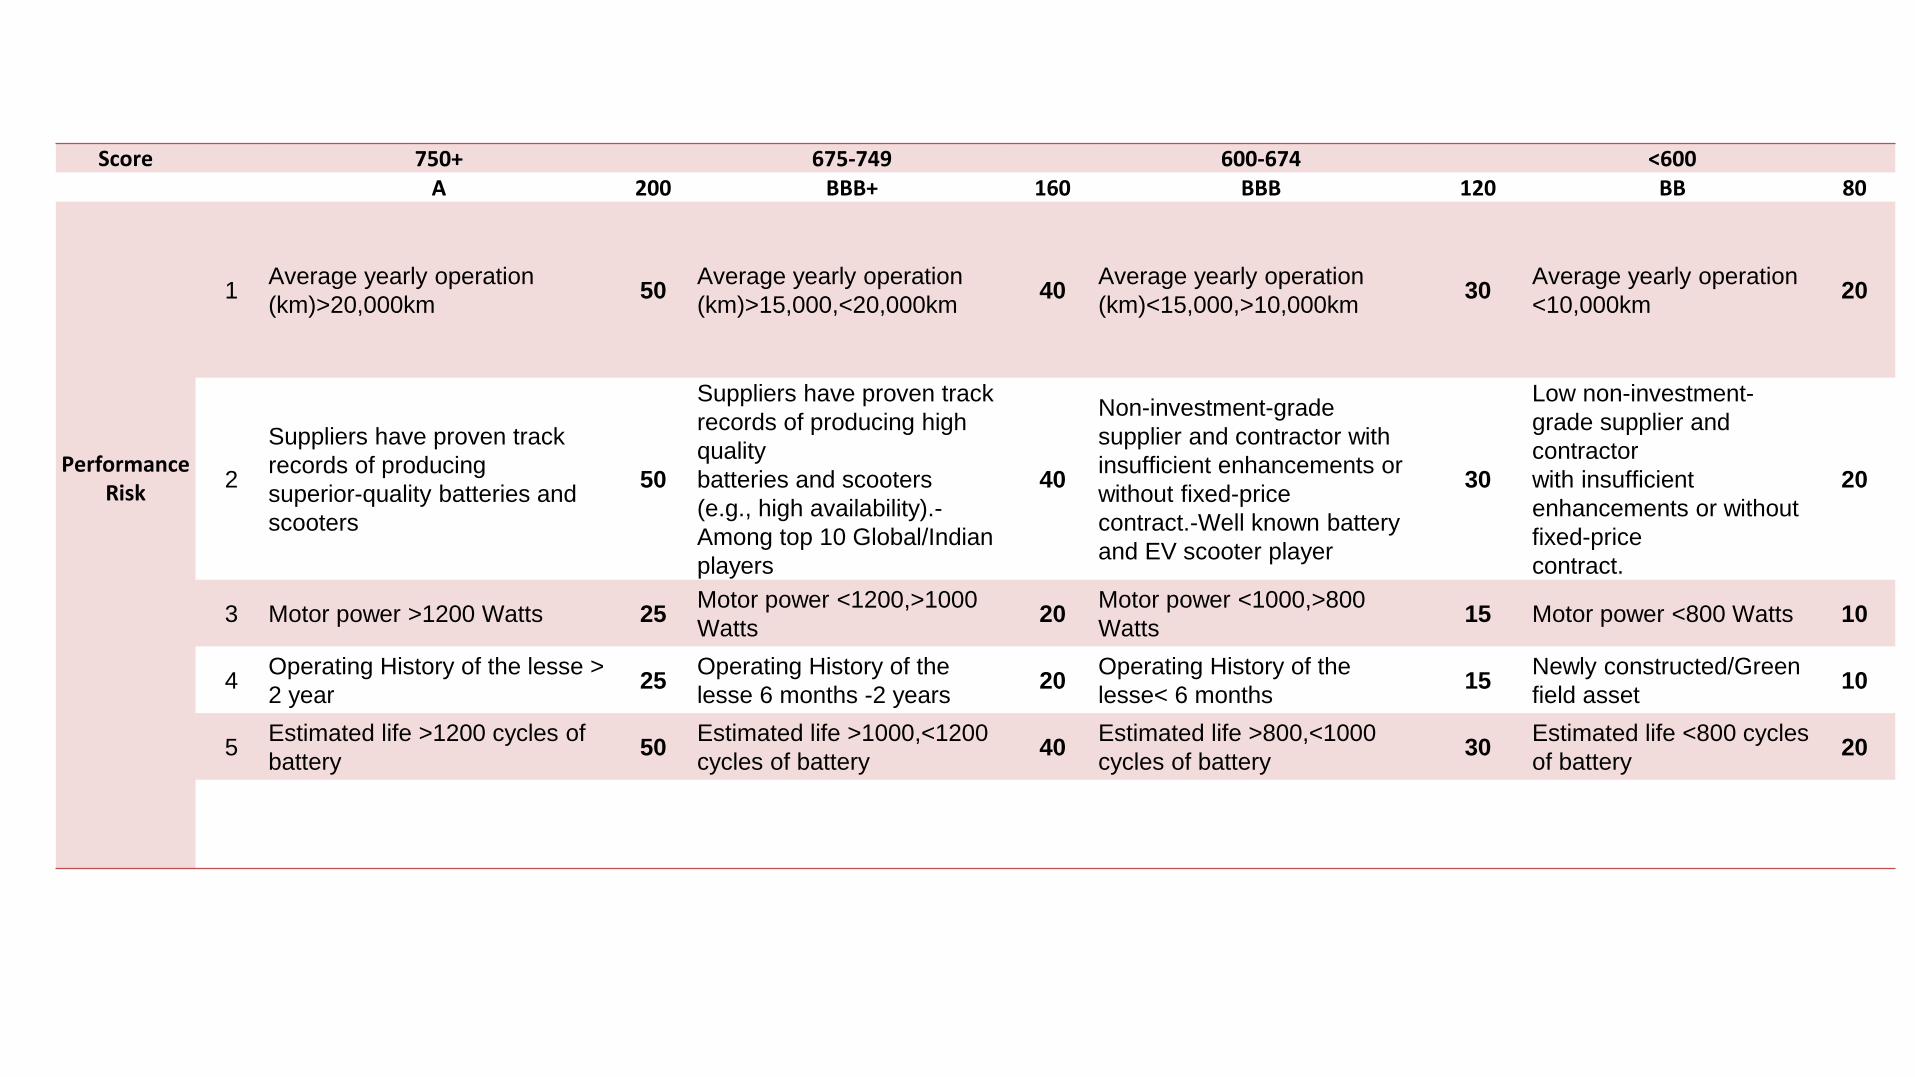
Score 750+ 675-749 600-674 <600A 200 BBB+ 160 BBB 120 BB 80
Performance Risk
1Average yearly operation
(km)>20,000km50
Average yearly operation
(km)>15,000,<20,000km40
Average yearly operation
(km)<15,000,>10,000km30
Average yearly operation
<10,000km20
2
Suppliers have proven track
records of producing
superior-quality batteries and
scooters
50
Suppliers have proven track
records of producing high
quality
batteries and scooters
(e.g., high availability).-
Among top 10 Global/Indian
players
40
Non-investment-grade
supplier and contractor with
insufficient enhancements or
without fixed-price
contract.-Well known battery
and EV scooter player
30
Low non-investment-
grade supplier and
contractor
with insufficient
enhancements or without
fixed-price
contract.
20
3 Motor power >1200 Watts 25Motor power <1200,>1000
Watts20
Motor power <1000,>800
Watts15 Motor power <800 Watts 10
4Operating History of the lesse >
2 year25
Operating History of the
lesse 6 months -2 years20
Operating History of the
lesse< 6 months15
Newly constructed/Green
field asset10
5Estimated life >1200 cycles of
battery50
Estimated life >1000,<1200
cycles of battery40
Estimated life >800,<1000
cycles of battery30
Estimated life <800 cycles
of battery20
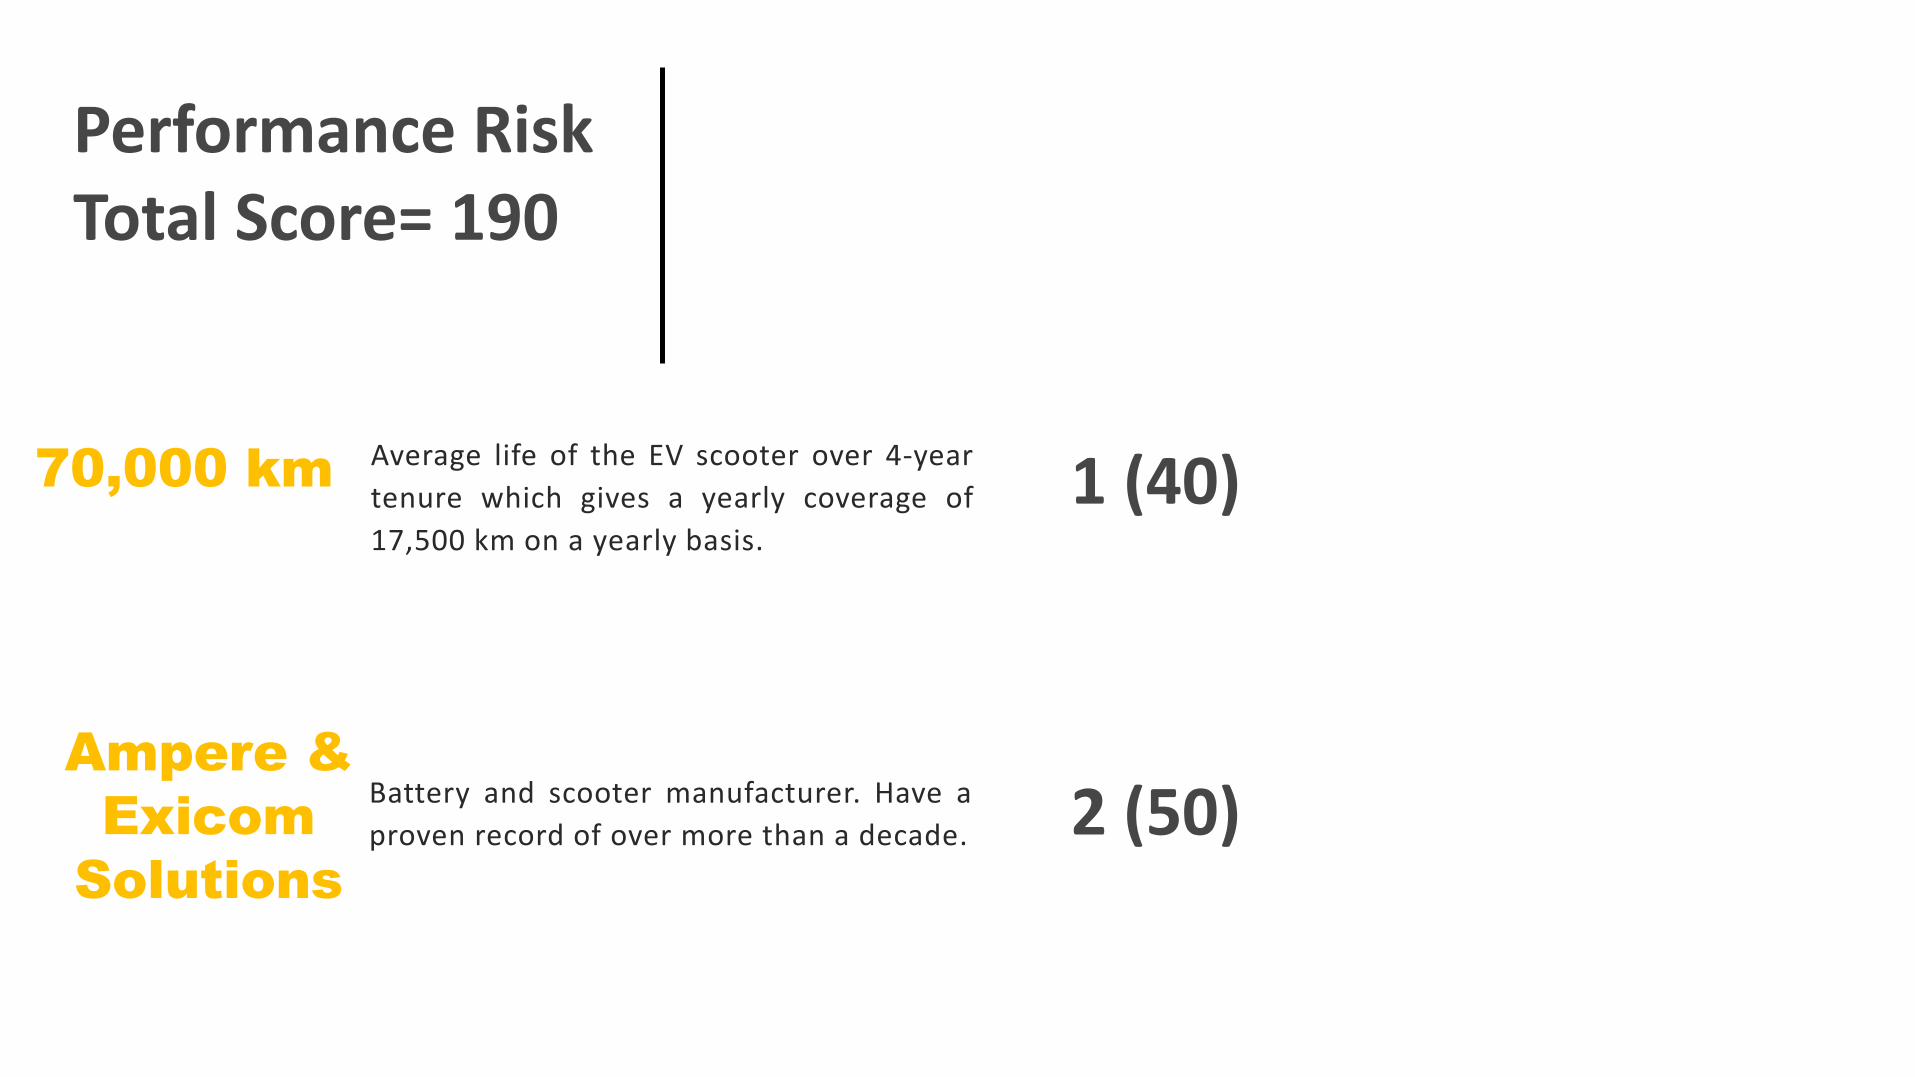
Performance RiskTotal Score= 190
70,000 km
Battery and scooter manufacturer. Have a
proven record of over more than a decade.
1 (40)
Ampere &
Exicom
Solutions
Average life of the EV scooter over 4-year
tenure which gives a yearly coverage of
17,500 km on a yearly basis.
2 (50)
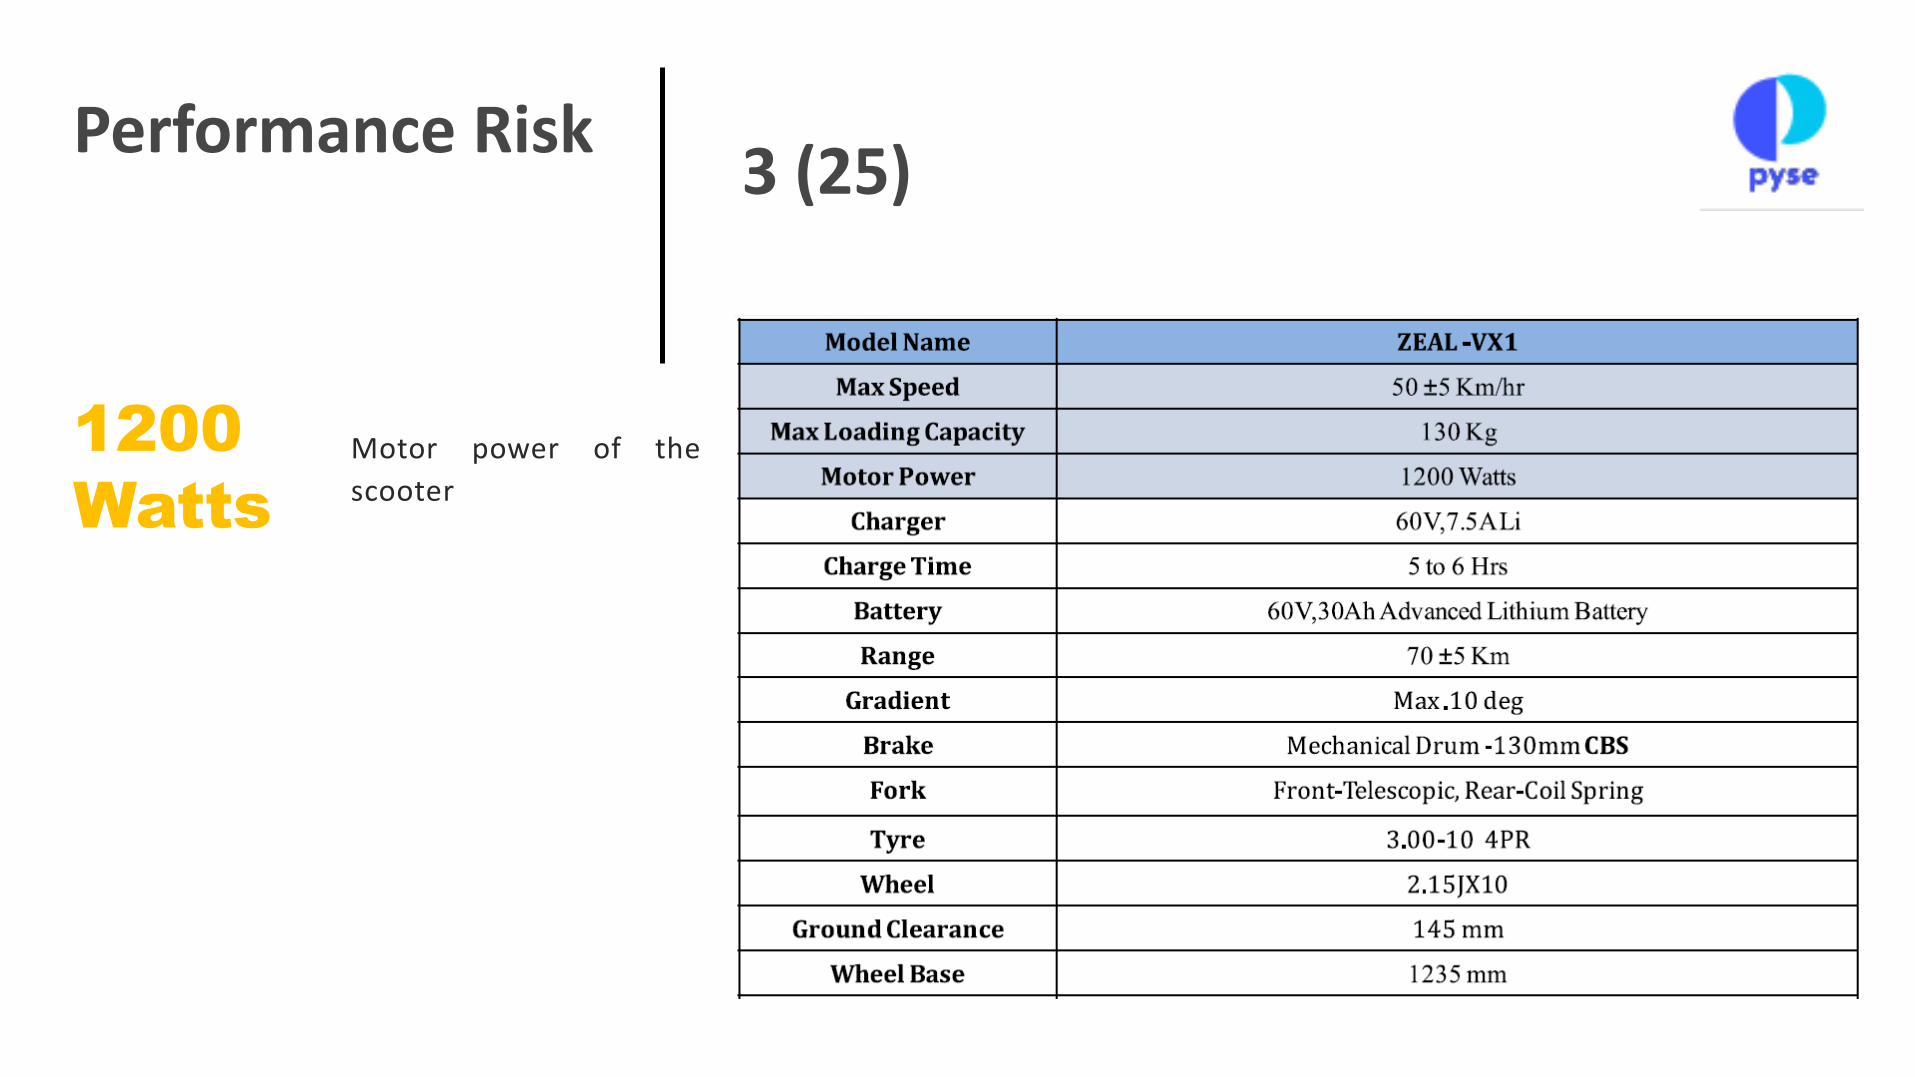
Performance Risk
1200
Watts
3 (25)
Motor power of the
scooter
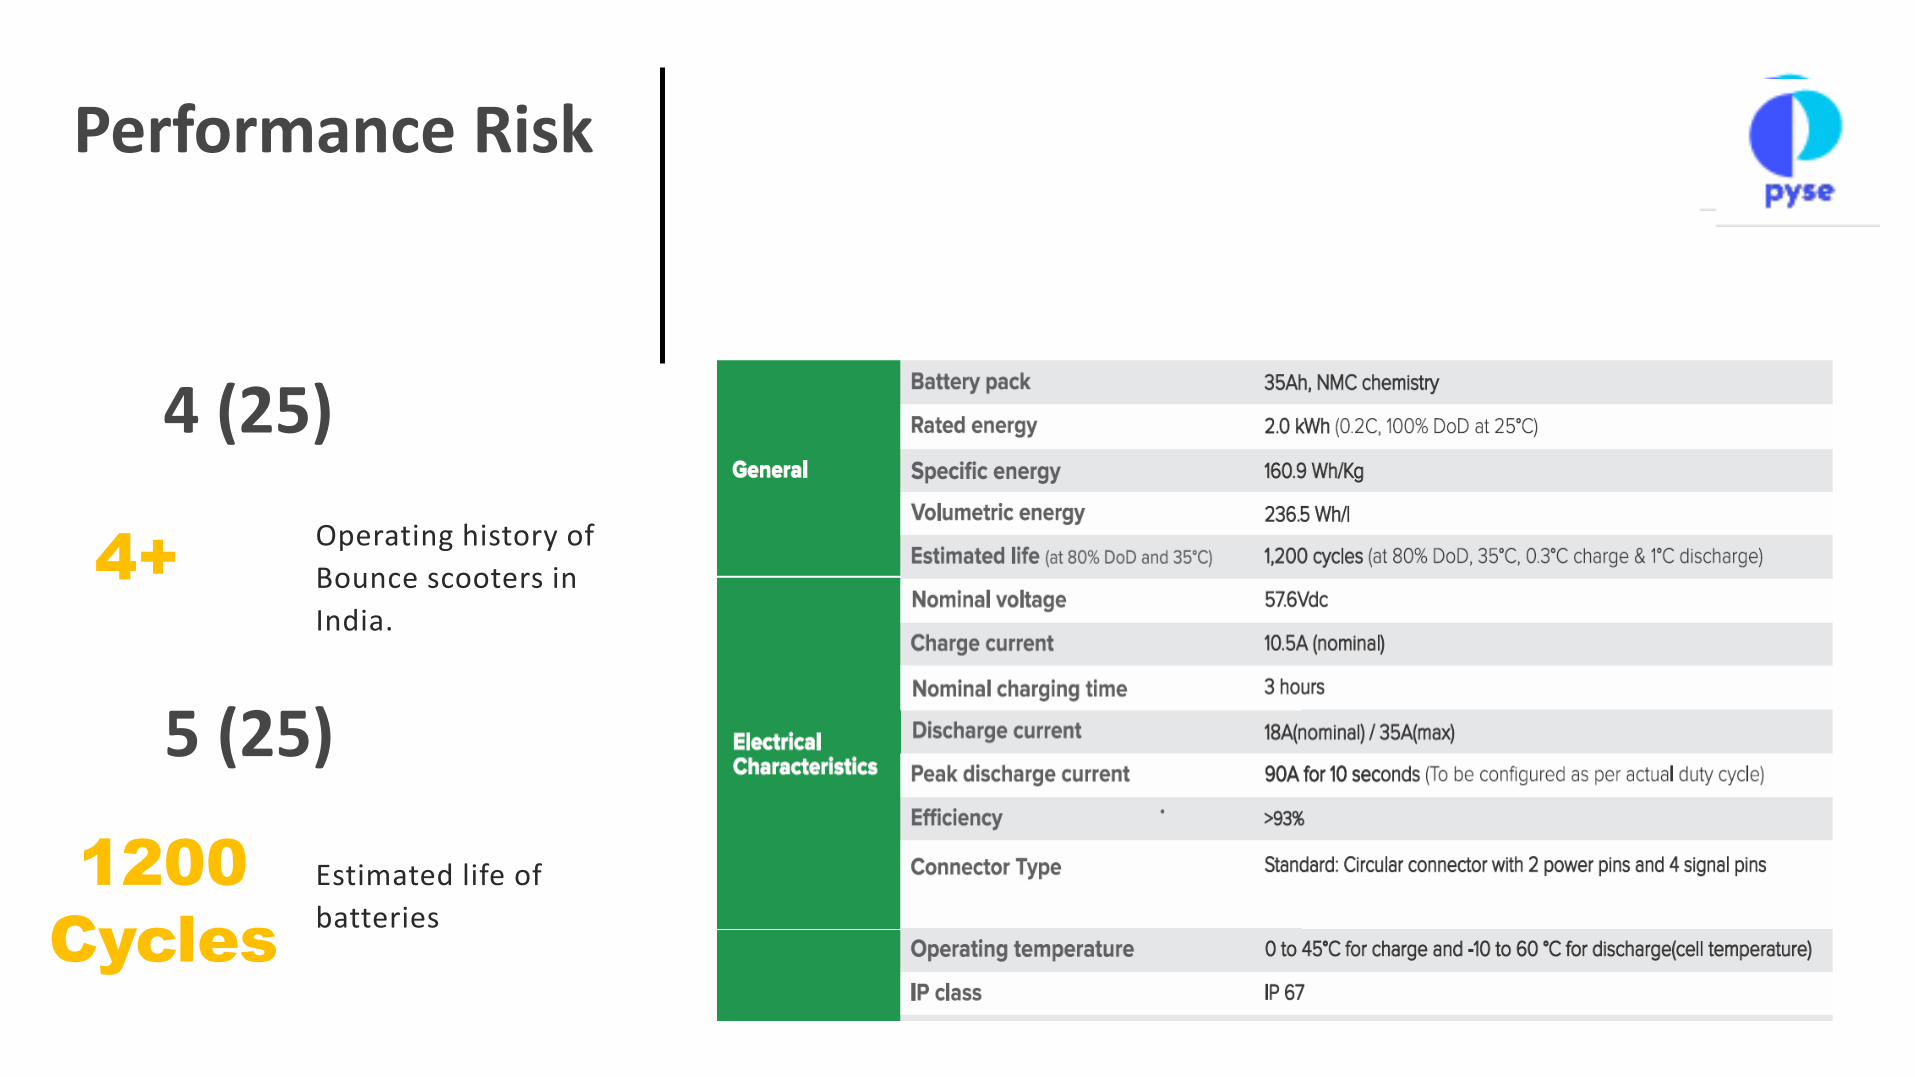
Performance Risk
Operating history of
Bounce scooters in
India.
4 (25)
1200
Cycles
5 (25)
4+
Estimated life of
batteries
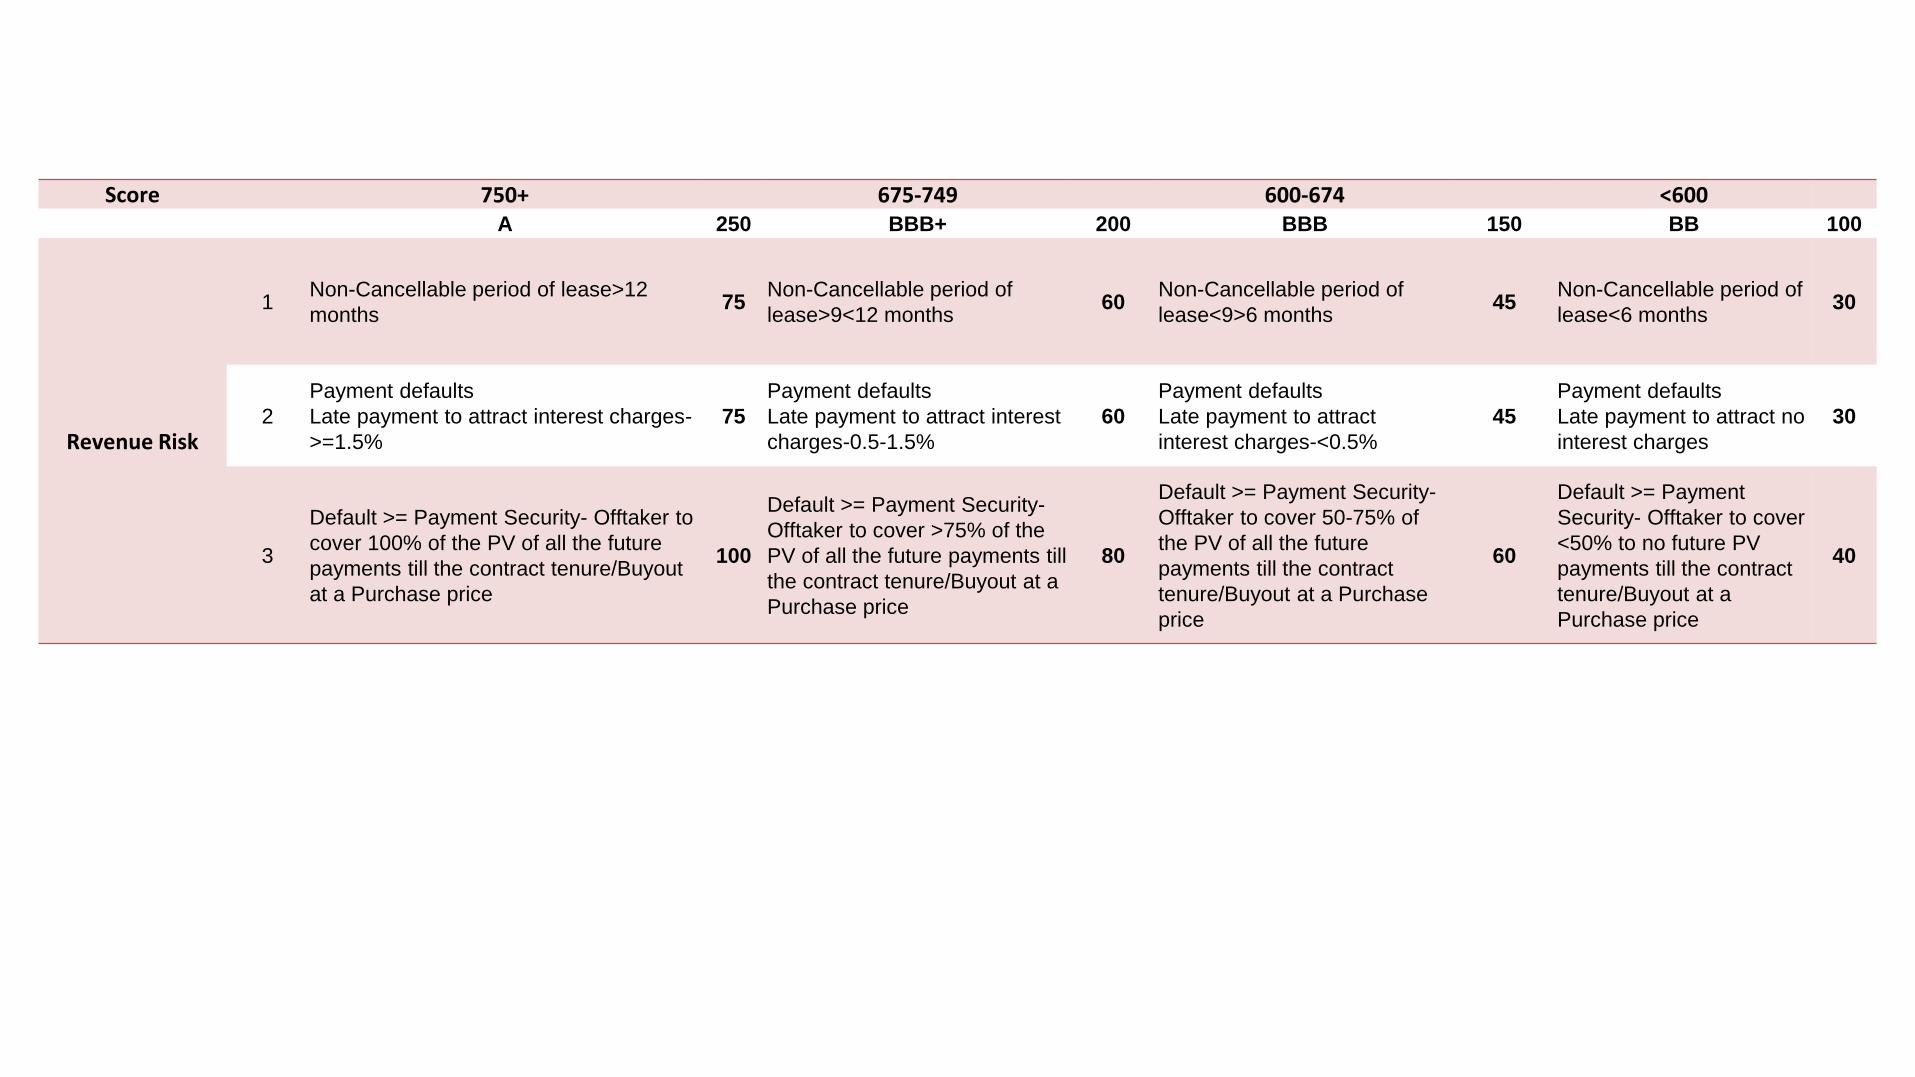
Score 750+ 675-749 600-674 <600A 250 BBB+ 200 BBB 150 BB 100
Revenue Risk
1Non-Cancellable period of lease>12
months75
Non-Cancellable period of
lease>9<12 months60
Non-Cancellable period of
lease<9>6 months45
Non-Cancellable period of
lease<6 months30
2
Payment defaults
Late payment to attract interest charges-
>=1.5%
75
Payment defaults
Late payment to attract interest
charges-0.5-1.5%
60
Payment defaults
Late payment to attract
interest charges-<0.5%
45
Payment defaults
Late payment to attract no
interest charges
30
3
Default >= Payment Security- Offtaker to
cover 100% of the PV of all the future
payments till the contract tenure/Buyout
at a Purchase price
100
Default >= Payment Security-
Offtaker to cover >75% of the
PV of all the future payments till
the contract tenure/Buyout at a
Purchase price
80
Default >= Payment Security-
Offtaker to cover 50-75% of
the PV of all the future
payments till the contract
tenure/Buyout at a Purchase
price
60
Default >= Payment
Security- Offtaker to cover
<50% to no future PV
payments till the contract
tenure/Buyout at a
Purchase price
40
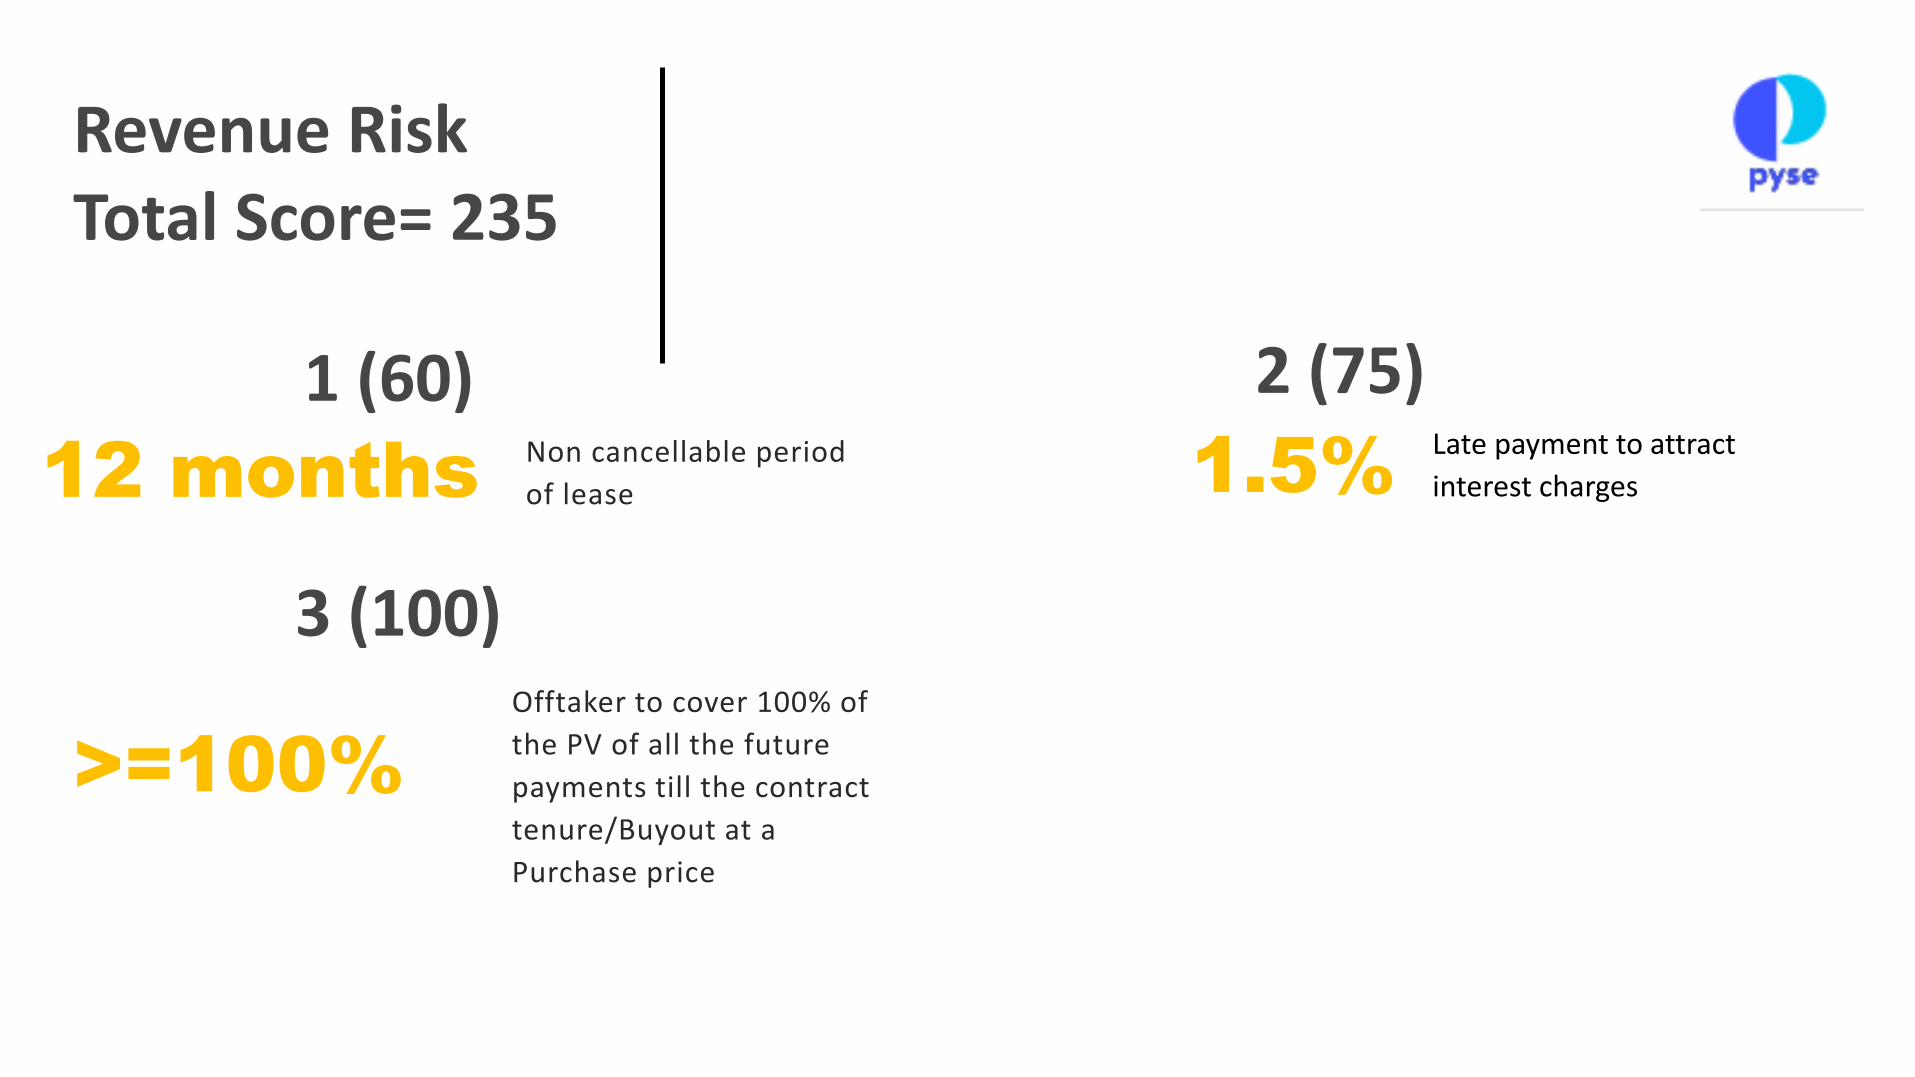
Revenue RiskTotal Score= 235
12 months
1 (60)Non cancellable period
of lease 1.5%
2 (75)Late payment to attract
interest charges
Offtaker to cover 100% of
the PV of all the future
payments till the contract
tenure/Buyout at a
Purchase price
>=100%
3 (100)
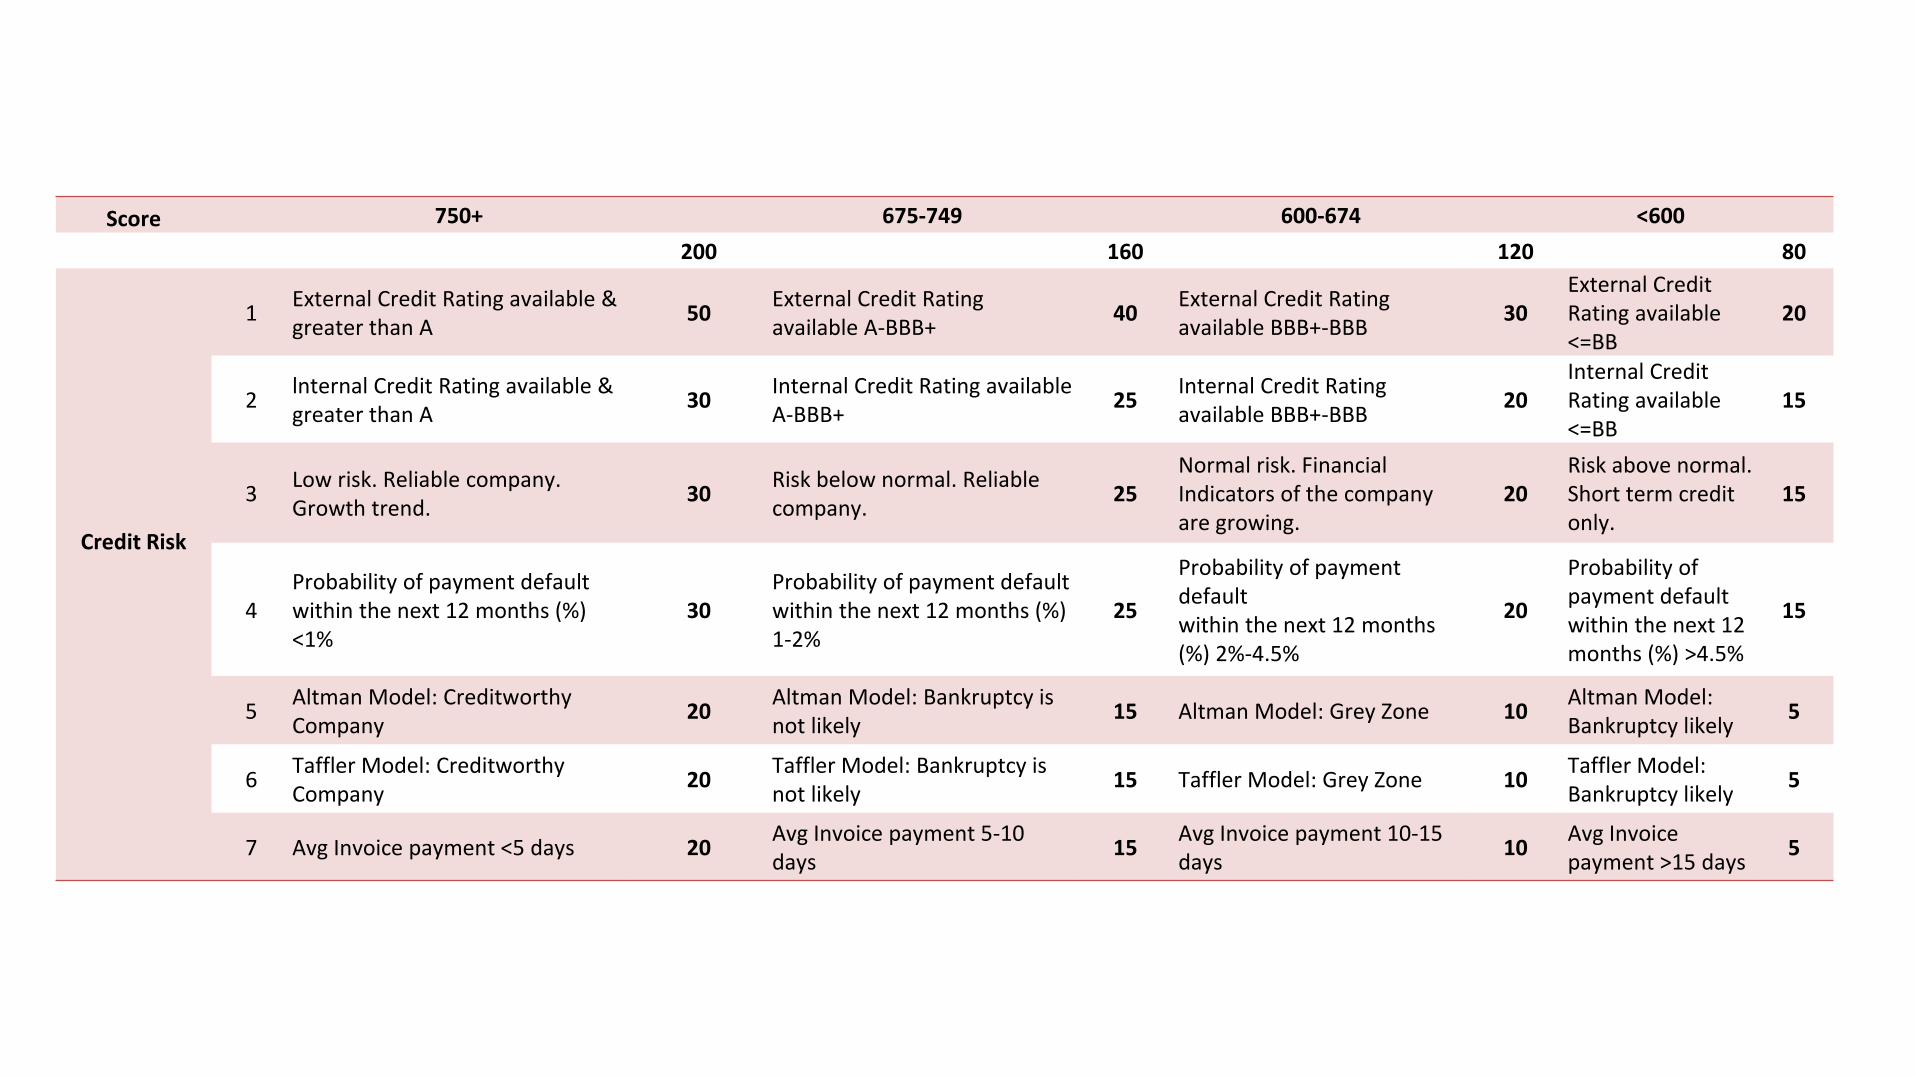
Score 750+ 675-749 600-674 <600
200 160 120 80
Credit Risk
1External Credit Rating available & greater than A
50External Credit Rating available A-BBB+
40External Credit Rating available BBB+-BBB
30External Credit Rating available <=BB
20
2lnternal Credit Rating available & greater than A
30Internal Credit Rating available A-BBB+
25Internal Credit Rating available BBB+-BBB
20Internal Credit Rating available <=BB
15
3Low risk. Reliable company. Growth trend.
30Risk below normal. Reliable company.
25Normal risk. Financial Indicators of the company are growing.
20Risk above normal. Short term credit only.
15
4Probability of payment default within the next 12 months (%) <1%
30Probability of payment default within the next 12 months (%) 1-2%
25
Probability of payment default within the next 12 months (%) 2%-4.5%
20
Probability of payment default within the next 12 months (%) >4.5%
15
5Altman Model: Creditworthy Company
20Altman Model: Bankruptcy is not likely
15 Altman Model: Grey Zone 10Altman Model: Bankruptcy likely
5
6Taffler Model: Creditworthy Company
20Taffler Model: Bankruptcy is not likely
15 Taffler Model: Grey Zone 10Taffler Model: Bankruptcy likely
5
7 Avg Invoice payment <5 days 20Avg Invoice payment 5-10 days
15Avg Invoice payment 10-15 days
10Avg Invoice payment >15 days
5
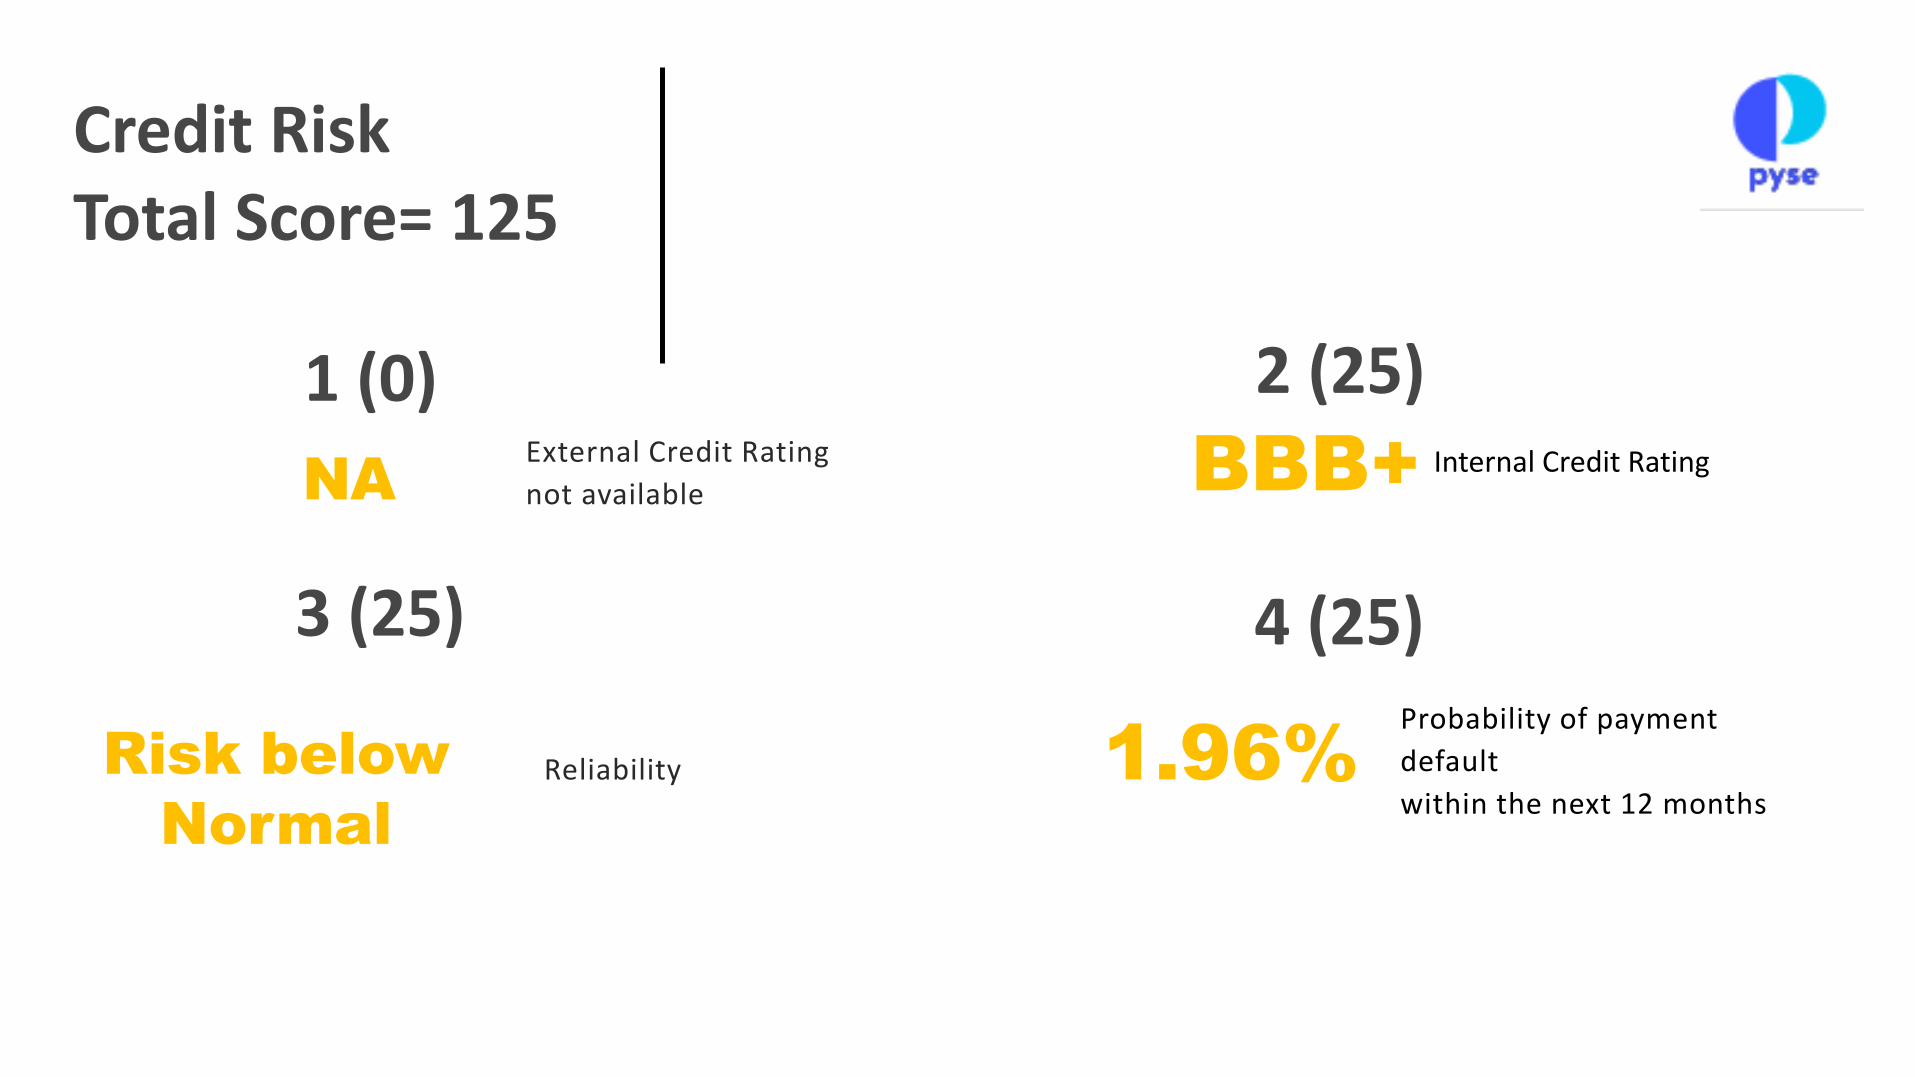
Credit RiskTotal Score= 125
NA
1 (0)External Credit Rating
not available BBB+
2 (25)Internal Credit Rating
ReliabilityRisk below
Normal
3 (25)
Probability of payment
default
within the next 12 months 1.96%
4 (25)
Credit Risk
Bankruptcy
is not likely
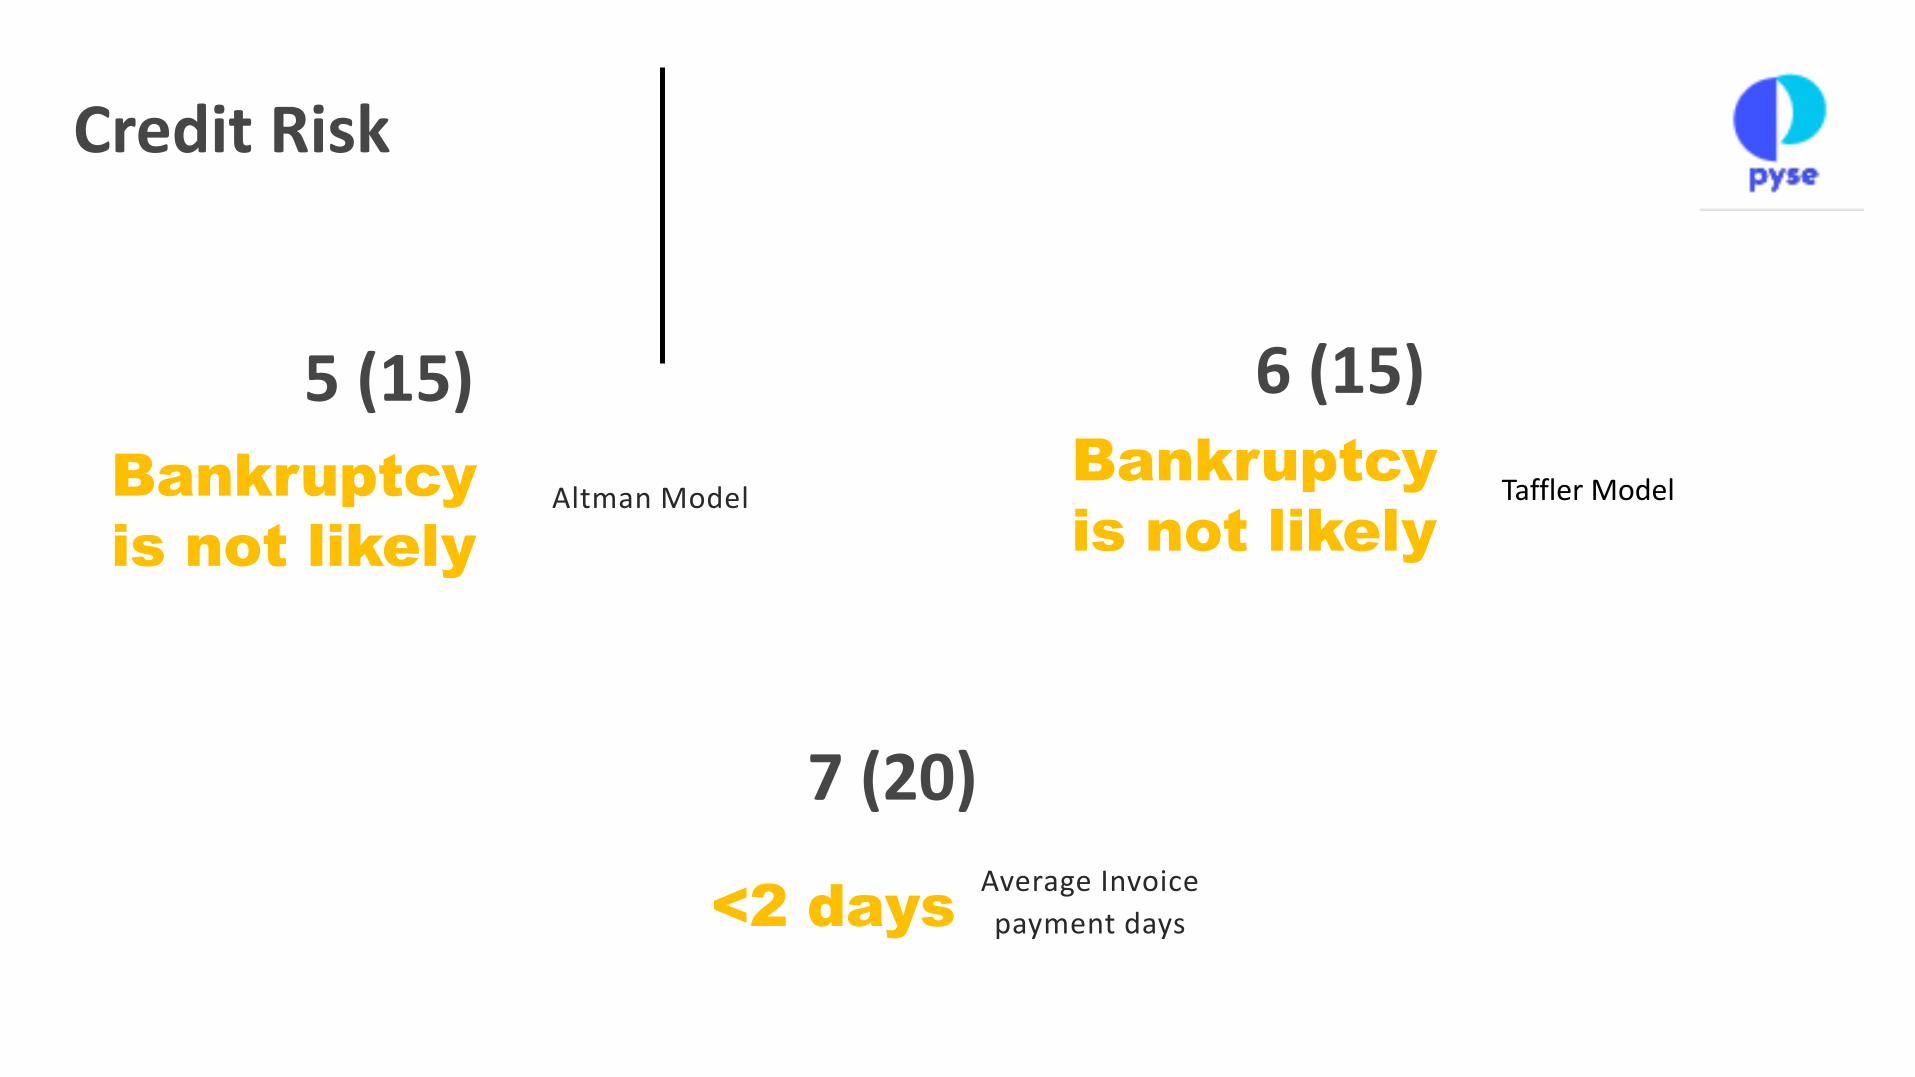
5 (15)
Altman Model
6 (15)
Taffler ModelBankruptcy
is not likely
Average Invoice
payment days
7 (20)
<2 days
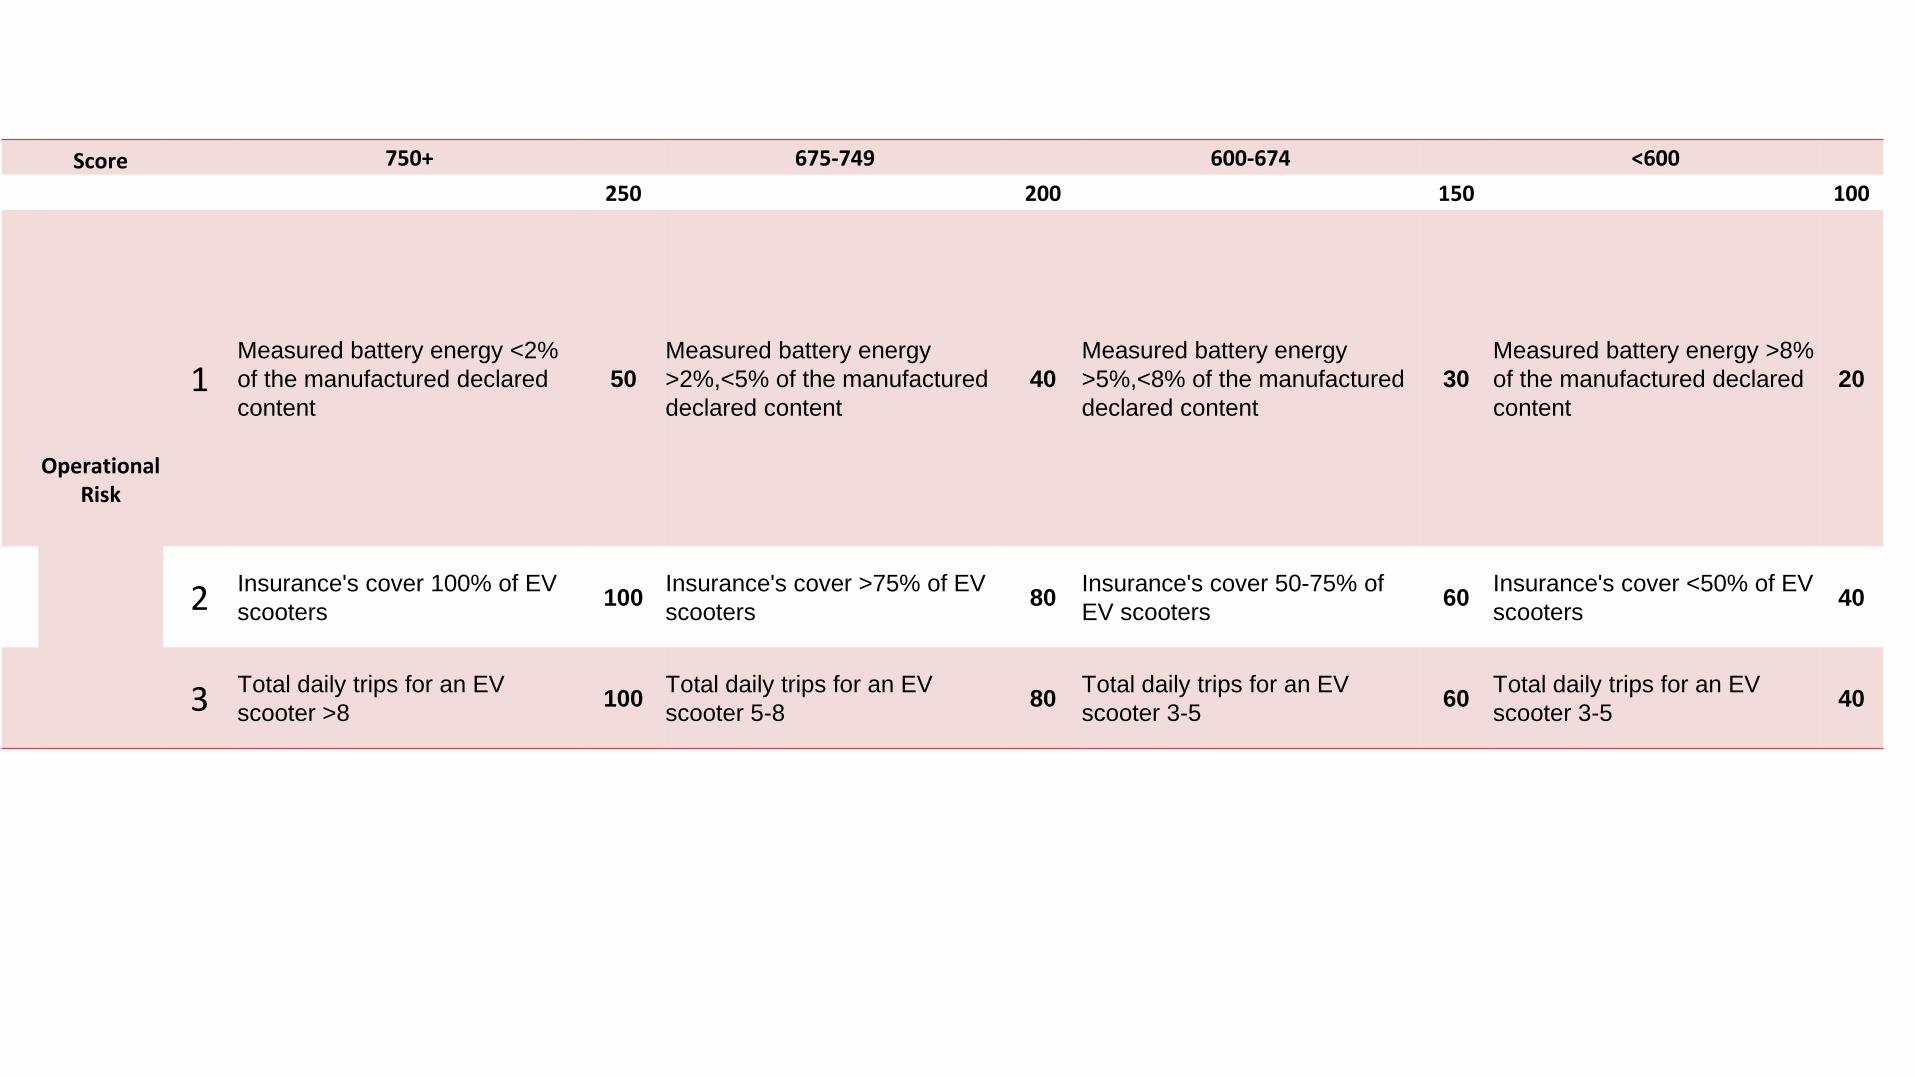
Score 750+ 675-749 600-674 <600
250 200 150 100
Operational Risk
1Measured battery energy <2%
of the manufactured declared
content
50
Measured battery energy
>2%,<5% of the manufactured
declared content
40
Measured battery energy
>5%,<8% of the manufactured
declared content
30
Measured battery energy >8%
of the manufactured declared
content
20
2 Insurance's cover 100% of EV
scooters100
Insurance's cover >75% of EV
scooters80
Insurance's cover 50-75% of
EV scooters60
Insurance's cover <50% of EV
scooters40
3 Total daily trips for an EV
scooter >8100
Total daily trips for an EV
scooter 5-880
Total daily trips for an EV
scooter 3-560
Total daily trips for an EV
scooter 3-540
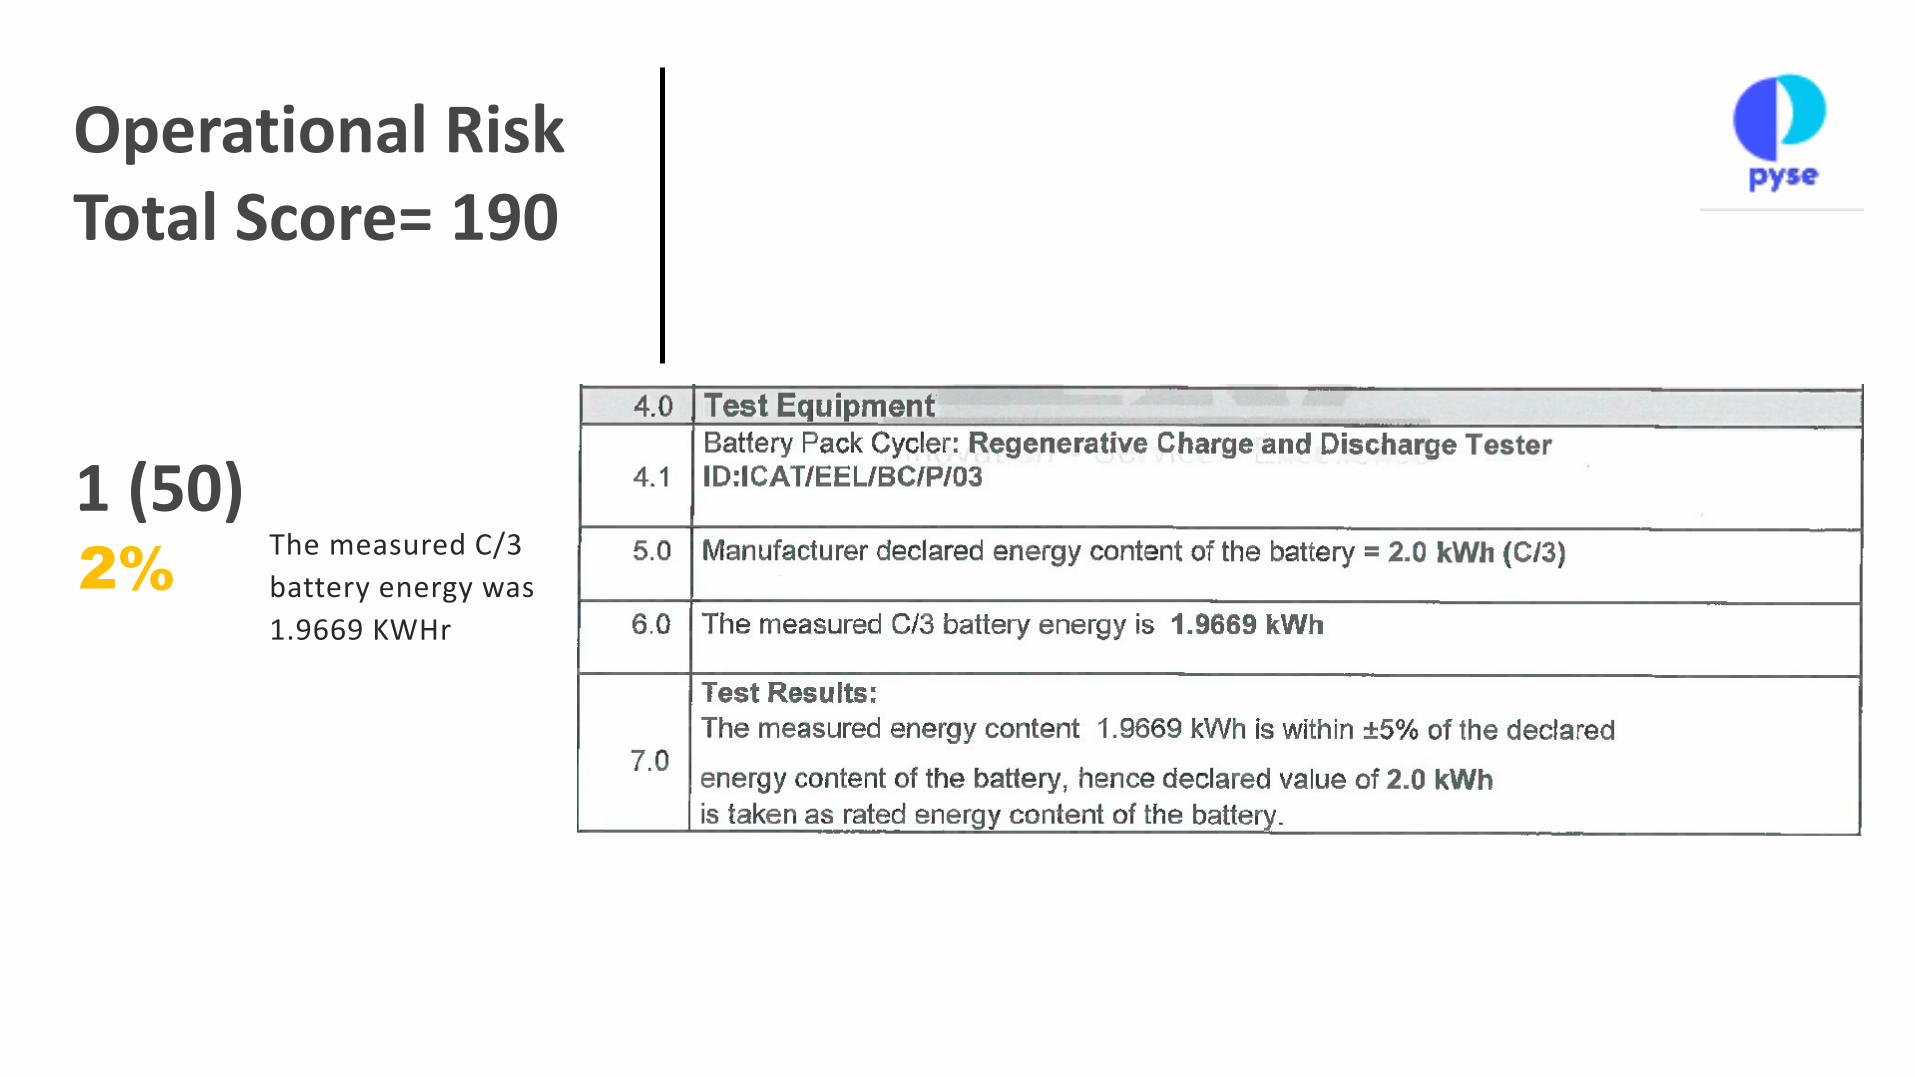
Operational RiskTotal Score= 190
2%
1 (50)The measured C/3
battery energy was
1.9669 KWHr
Operational Risk
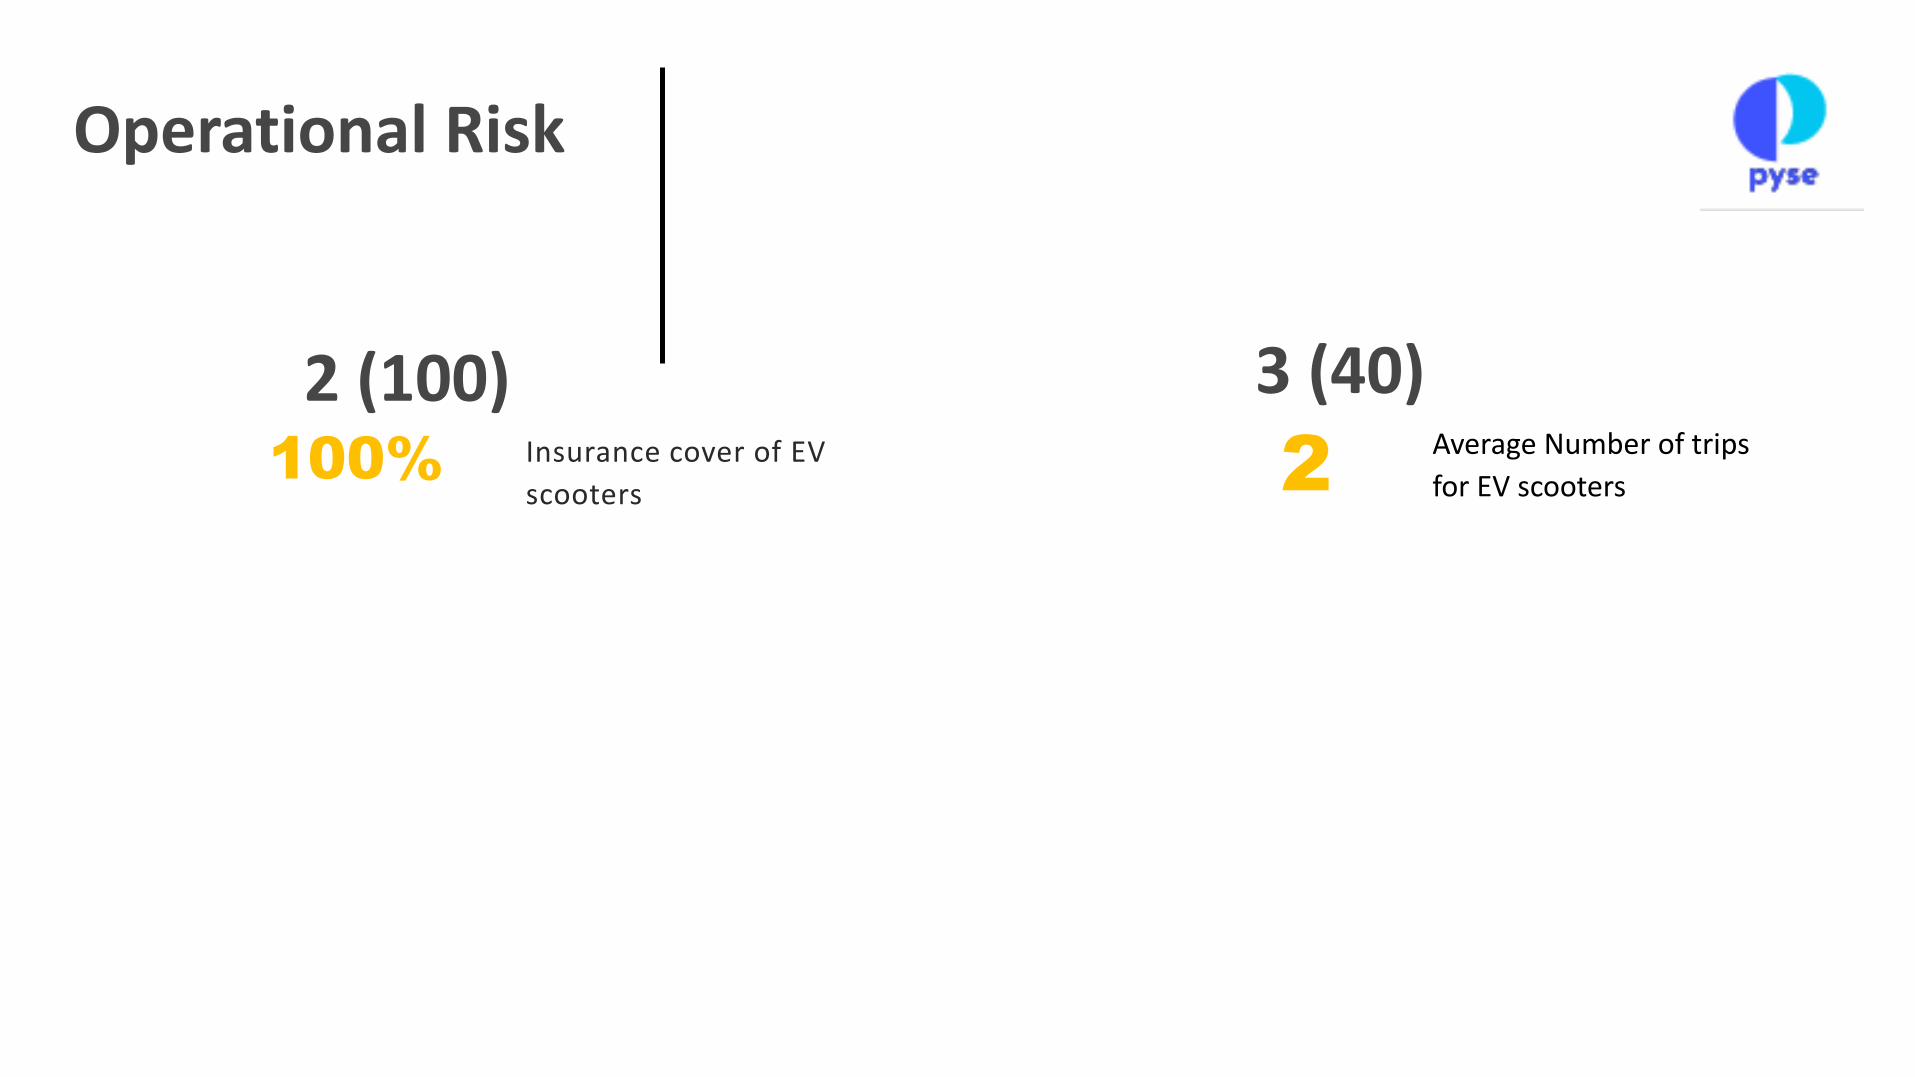
100%
2 (100)Insurance cover of EV
scooters 2
3 (40)Average Number of trips
for EV scooters

Thank you


