22
May 2014 Q1 2014 Investors Presentation FINANCIAL & BUSINESS RESULTS
| Date post: | 22-Mar-2016 |
| Category: |
Documents |
| Upload: | afi-development |
| View: | 215 times |
| Download: | 0 times |

May 2014
Q1 2014 Investors Presentation
FINANCIAL & BUSINESS RESULTS
This document does not constitute or form part of and should not be construed as, an offer to sell or issue or the solicitation of an offer to buy or acquire securities of AFI Development Plc (the "Company") or any of its subsidiaries in any jurisdiction or an inducement to enter into investment activity. No part of this document, nor the fact of its distribution, should form the basis of, or be relied on in connection with, any contract or commitment or investment decision whatsoever. No representation, warranty or undertaking, express or implied, is made as to, and no reliance should be placed on, the fairness, accuracy, completeness or correctness of the information or the opinions contained herein. None of the Company or any of its affiliates, advisors or representatives shall have any liability whatsoever (in negligence or otherwise) for any loss howsoever arising from any use of this document or its contents or otherwise arising in connection with the document.
This communication is only being distributed to and is only directed at (1) qualified institutional buyers (within the meaning of Rule 144A of the United States Securities Act of 1933, as amended (the "Securities Act") or (2) accredited investors (as defined in Rule 501(a) of Regulation D adopted pursuant to the Securities Act). Any person who is not a "qualified institutional buyer" or "accredited investor" should not act or rely on this document or any of its contents.
This document contains "forward-looking statements", which include all statements other than statements of historical facts, including, without limitation, any statements preceded by, followed by or that include the words "targets", "believes", "expects", "aims", "intends", "will", "may", "anticipates", "would", "could" or similar expressions or the negative thereof. Such forward-looking statements involve known and unknown risks, uncertainties and other important factors beyond the Company's control that could cause the actual results, performance or achievements of the Company to be materially different from future results, performance or achievements expressed or implied by such forward-looking, including, among others, the achievement of anticipated levels of profitability, growth, cost and synergy of recent acquisitions, the impact of competitive pricing, the ability to obtain necessary regulatory approvals and licenses, the impact of developments in the Russian economic, political and legal environment, volatility in stock markets or in the price of our shares or GDRs, financial risk management and the impact of general business and global economic conditions.
Such forward-looking statements are based on numerous assumptions regarding the Company's present and future business strategies and the environment in which the Company will operate in the future. By their nature, forward-looking statements involve risks and uncertainties because they relate to events and depend on circumstances that may or may not occur in the future. These forward-looking statements speak only as at the date as of which they are made, and the Company expressly disclaims any obligation or undertaking to disseminate any updates or revisions to any forward-looking statements contained herein to reflect any change in the Company's expectations with regard thereto or any change in events, conditions or circumstances on which any such statements are based.
Neither the Company, nor any of its agents, employees or advisors intends or has any duty or obligation to supplement, amend, update or revise any of the forward-looking statements contained in this document.
The information contained in this document is provided as at the date of this document and is subject to change without notice.
Disclaimer
2

SECTION 1
Company Overview
Company at Glance
4
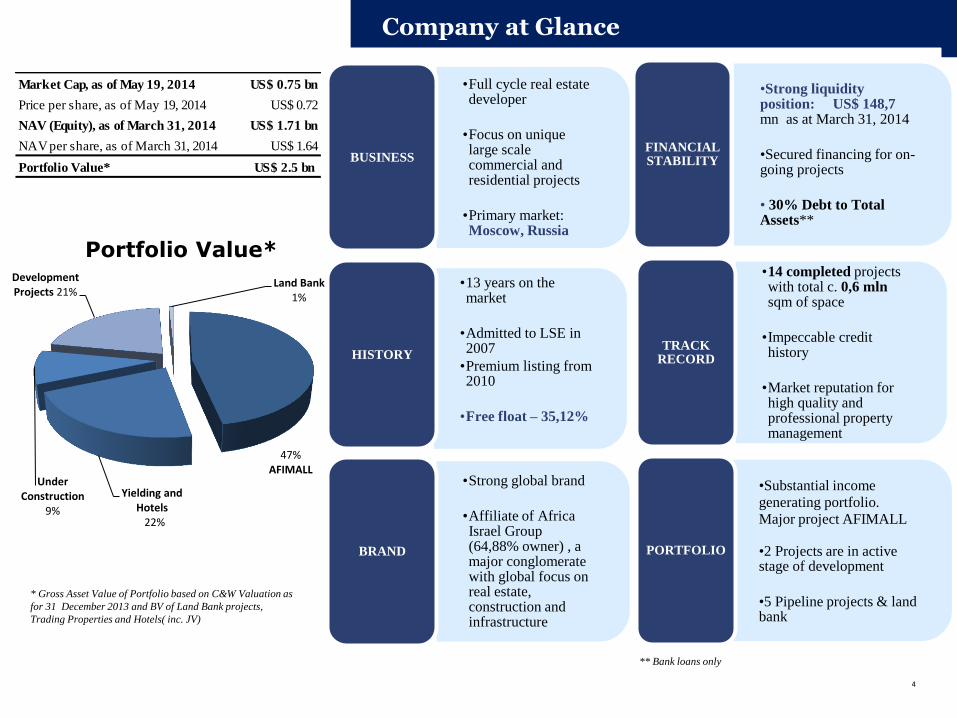
•Full cycle real estate developer
•Focus on unique large scale commercial and residential projects
•Primary market: Moscow, Russia
BUSINESS
•13 years on the market
•Admitted to LSE in 2007
•Premium listing from 2010
•Free float – 35,12%
HISTORY
•Strong global brand
•Affiliate of Africa Israel Group (64,88% owner) , a major conglomerate with global focus on real estate, construction and infrastructure
BRAND
•Strong liquidity position: US$ 148,7 mn as at March 31, 2014
•Secured financing for on-going projects
• 30% Debt to Total Assets**
FINANCIAL STABILITY
•14 completed projects with total c. 0,6 mln sqm of space
•Impeccable credit history
•Market reputation for high quality and professional property management
TRACK RECORD
•Substantial income
generating portfolio.
Major project AFIMALL
•2 Projects are in active stage of development
•5 Pipeline projects & land bank
PORTFOLIO
47% AFIMALL
Yielding and Hotels 22%
Under Construction
9%
Development Projects 21%
Land Bank 1%
Portfolio Value*
* Gross Asset Value of Portfolio based on C&W Valuation as
for 31 December 2013 and BV of Land Bank projects,
Trading Properties and Hotels( inc. JV)
** Bank loans only
Market Cap, as of May 19, 2014 US$ 0.75 bn
Price per share, as of May 19, 2014 US$ 0.72
NAV (Equity), as of March 31, 2014 US$ 1.71 bn
NAV per share, as of March 31, 2014 US$ 1.64
Portfolio Value* US$ 2.5 bn

Note: the NOI projections are “forward looking statements” based on C&W valuation assumptions and Company estimations and they can be realized or not realized due to factors beyond the Company's control including, among others, the impact of competitive
pricing, the ability to obtain necessary regulatory approvals and licenses, the impact of developments in the Russian economic, political and legal environment, volatility in stock markets or in the price of our shares or GDRs, financial risk management and the
impact of general business and global economic conditions
Key Projects in Moscow
Yielding Assets (retail, offices and hotels)
Ownership:50%
Other
** Odinburg presented with cost value
* Outside of Moscow
Value** ( C&W, Dec, 31 2013):
US$ 1.7 bn
GLA(excl. hotels),sqm: 195K sqm
NOI stab. ( excl. hotels):
US$ 204 mn
Value (BV): US$ 16 mn
5
Projects Under Development
Value** (afid share, C&W):
US$ 760 mn
GLA,sqm: 217,6K sqm
GSA,sqm: c. 588,4K sqm
Land Bank
Active phase of construction
Yielding Assets
Projects under
Development
Completed Assets
Tverskaya IB Riversede Station AFIMALL
PLAZA SPA Kisl* PLAZA SPA ZHEL* Aquamarine III
Aquamarine Hotel Paveletskaya,1 H2O
* * Hotels presented with cost value
Odinburg** Paveletskaya II
Plaza IC Pochtovaya
Plaza iia
Expolon
Plaza IV

SECTION 1
Project Update
Yielding Projects
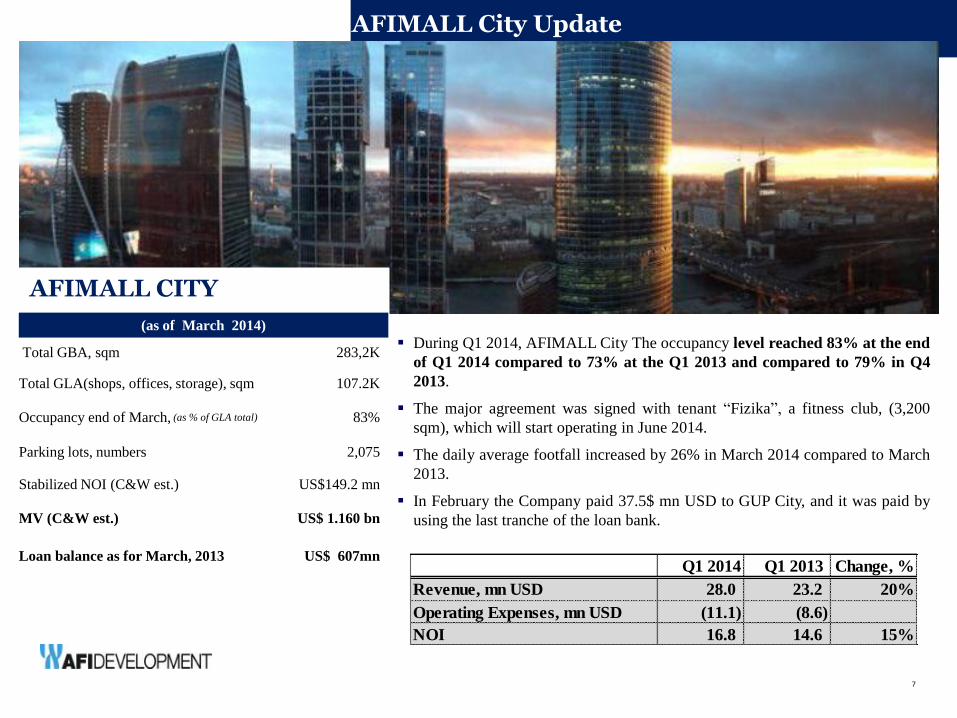
(as of March 2014)
Total GBA, sqm 283,2K
Total GLA(shops, offices, storage), sqm 107.2K
Occupancy end of March, (as % of GLA total) 83%
Parking lots, numbers 2,075
Stabilized NOI (C&W est.) US$149.2 mn
MV (C&W est.) US$ 1.160 bn
Loan balance as for March, 2013 US$ 607mn
AFIMALL CITY
During Q1 2014, AFIMALL City The occupancy level reached 83% at the end
of Q1 2014 compared to 73% at the Q1 2013 and compared to 79% in Q4
2013.
The major agreement was signed with tenant “Fizika”, a fitness club, (3,200
sqm), which will start operating in June 2014.
The daily average footfall increased by 26% in March 2014 compared to March
2013.
In February the Company paid 37.5$ mn USD to GUP City, and it was paid by
using the last tranche of the loan bank.
AFIMALL City Update
7
Q1 2014 Q1 2013 Change, %
Revenue, mn USD 28.0 23.2 20%
Operating Expenses, mn USD (11.1) (8.6)
NOI 16.8 14.6 15%

AFIMALL and Moscow-City Development
AFIMALL
MOSCOW CITY DEVELOPMENT
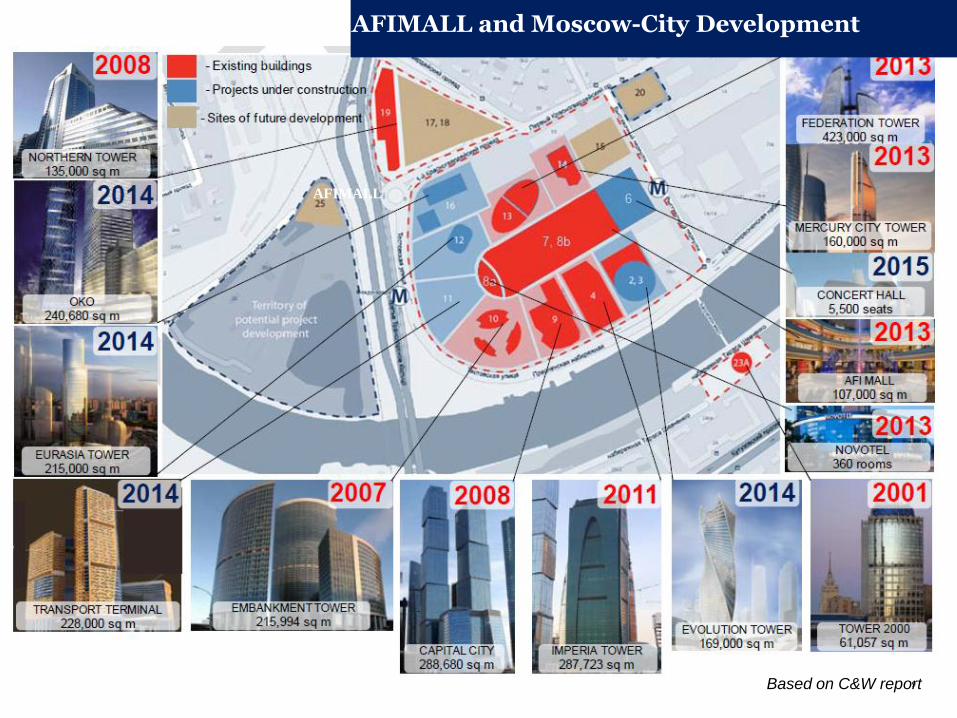
Existing Office Complex 0 – Tower 2000
4 – Imperia Tower
8 – CityPoint
9 – Capital City
10 – Naberezhnaya Tower
12 – Eurasia Tower
13a – Federation Tower (West)
19 – Northern Tower
6, 7 – Central Core (AFIMALL City)
Under Construction 2, 3 – Evolution Tower
11 – IQ-quarter
13b – Federation Tower (East)
14 – Mercury City Tower
16a – OKO
16b – Parking
Planned 15 – Moscow City Government
Building
20 – Exposition and Business Center
By 2015 total office stock expected to reach 1.0 m sq m
Following the delivery of Eurasia Tower in Q1 2014 (90K sqm) , the total
stock in Moscow-City reached 676K sqm. By the end of 2014, market expects
it to growth further with the commissioning of OKO MFC, while in 2015 the
delivery of Evolution Tower (78K sqm), IQ-quarter (107K sqm) and possibly
part of Federation Tower East (101K sqm) will bring the total stock of Moscow-
City to 1m sq m.
About 120K workforce are expected to work in the Moscow City area by the
time all planned office has been constructed
The Moscow City vacancy rate increased to c. 37% due to the recent launching
of the new building Eurazia Tower.
2 additional metro lines: Prolongation of Tretyakovskaya till Ramenki,
construction of Hordovaya with 4 different lines connections (Vystovochnaya,
Polezhaevskaya, Hodinskoye Pole, Dinamo, Savelovskaya) by 2015 – 2016.
One of the major deals that was singed in Q1 2014 in MCC were the agreement
to lease the 2,336 sqm in Naberezhnaya Tower.
The new metro station Delovoy Center, which has a direct access to the mall,
has started its operations. 8
AFIMALL and Moscow-City Development
AFIMALL
Based on C&W report 9
Building AFIMALL Ozerkovskaya III Berezkovskaya Tverskaya Plaza IIPaveletskaya, bld.
1H2O Tvesrkaya Plaza Ib
Aquamarine
Hotel*
Plaza SPA
Kislovodsk
Plaza SPA
ZheleznovodskTOTAL
Moscow Moscow Moscow Moscow Moscow Moscow Moscow Moscow
Moscow City CBD CBD CBD CBD
Class Retail Office A & Street
Retail Office B
Office & Street
Retail Office B Office B
Office & Street
Retail Hotel Hotel Hotel
GBA, sqm 283,128 61,772 11,612 6,008 16,246 10,698 2,104 8,931 25,000 11,701 437K
GLA, sqm 107,208 46,247 10,250 6,008 14,085 8,990 1,909 159 keys 275 keys 134 keys 195K
Parking lots (total), # 2,075 466 150 - 126 81 - 15 - 15
Ocupancy rate, % 83% - 91% 95% 96% 76% 95% 71% 56% 59%
750- Office
500 - retail
NOI stab (C&W est.),
US mn149.2 38.4 5.2 2.5 4.5 2.7 1.3 - - - 204
NOI Year 2014 (C&W
est.), US mn 89.0 12.2 4.6 2.8 2.9 1.6 0.9 - - - 114
MV,US$ mn*** 1,160 324 38.5 32 29.6 17.3 8.8 28.1 22.7 20.3 1,681
Location Kavkaz region Kavkaz region
1,224 Average rent as of
31.12.2013, $/sq m357 579 365 689 594 ADR 231 ADR 371 ADR 223
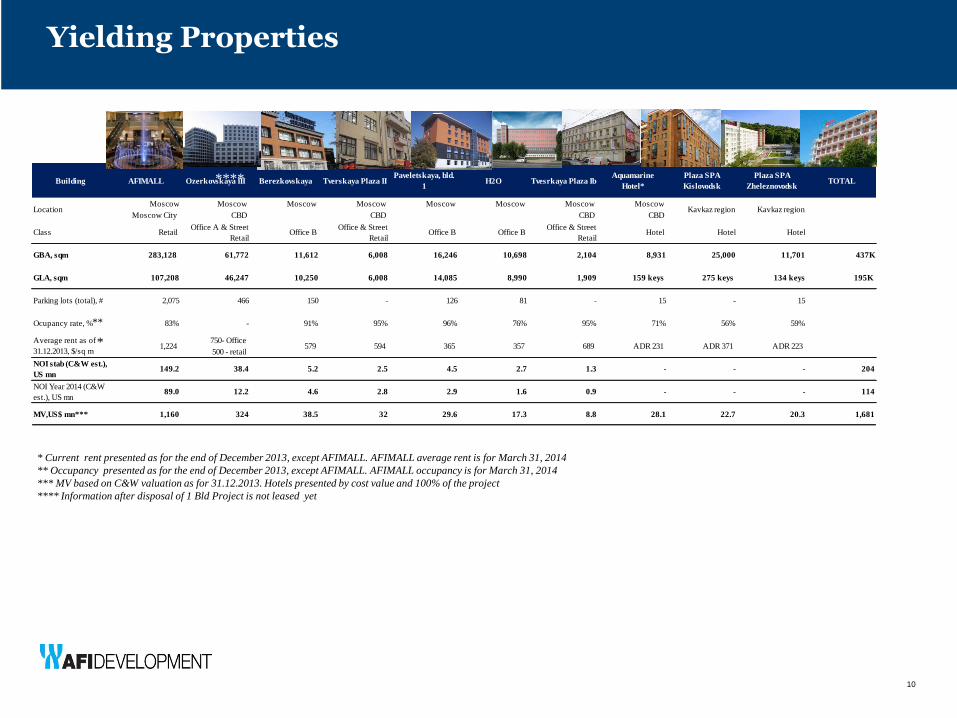
Yielding Properties
10
* Current rent presented as for the end of December 2013, except AFIMALL. AFIMALL average rent is for March 31, 2014
** Occupancy presented as for the end of December 2013, except AFIMALL. AFIMALL occupancy is for March 31, 2014
*** MV based on C&W valuation as for 31.12.2013. Hotels presented by cost value and 100% of the project
**** Information after disposal of 1 Bld Project is not leased yet
10
*
**
****
SECTION 2 Project Update
Development Projects
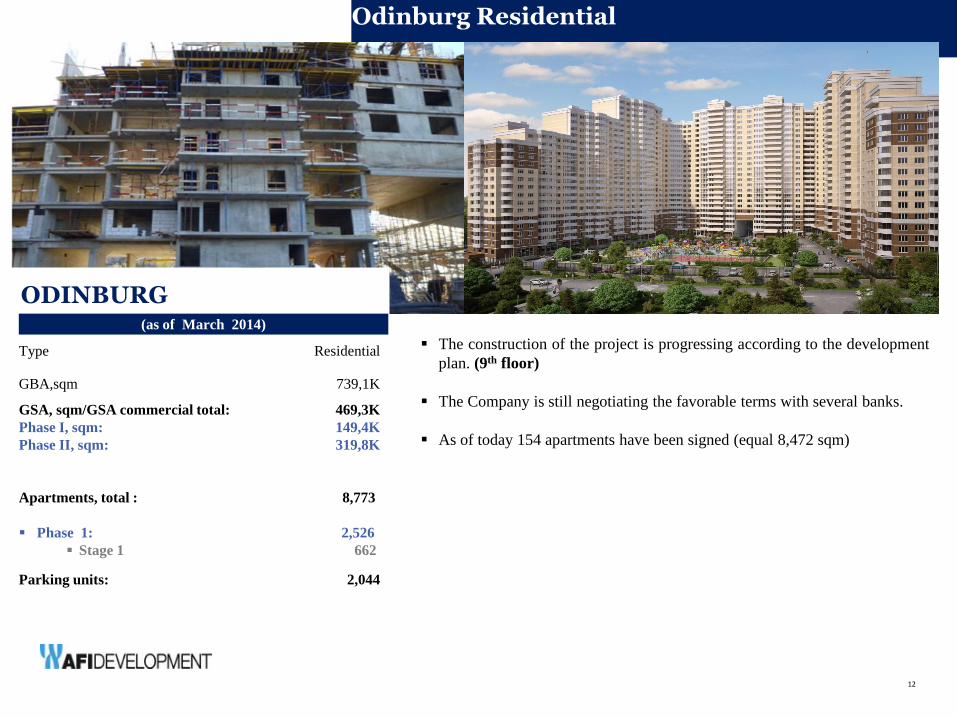
ODINBURG
The construction of the project is progressing according to the development
plan. (9th floor)
The Company is still negotiating the favorable terms with several banks.
As of today 154 apartments have been signed (equal 8,472 sqm)
Odinburg Residential
12
(as of March 2014)
Type Residential
GBA,sqm 739,1K
GSA, sqm/GSA commercial total:
Phase I, sqm:
Phase II, sqm:
469,3K
149,4K
319,8K
Apartments, total : 8,773
Phase 1: 2,526
Stage 1 662
Parking units: 2,044
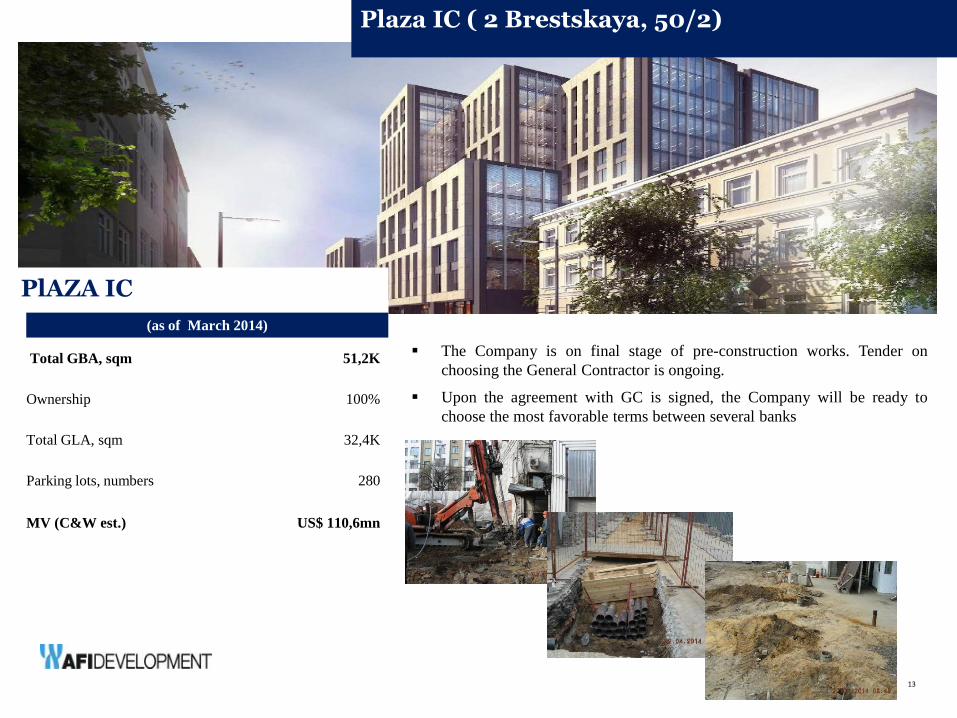
PlAZA IC
(as of March 2014)
Total GBA, sqm 51,2K
Ownership 100%
Total GLA, sqm 32,4K
Parking lots, numbers 280
MV (C&W est.) US$ 110,6mn
13
Plaza IC ( 2 Brestskaya, 50/2)
The Company is on final stage of pre-construction works. Tender on
choosing the General Contractor is ongoing.
Upon the agreement with GC is signed, the Company will be ready to
choose the most favorable terms between several banks
PARAMETERS:
Type: Mix
GBA, sqm: 111,7K
GLA, sqm: 90,3K
MV(C&W),mn: S$ 103,5
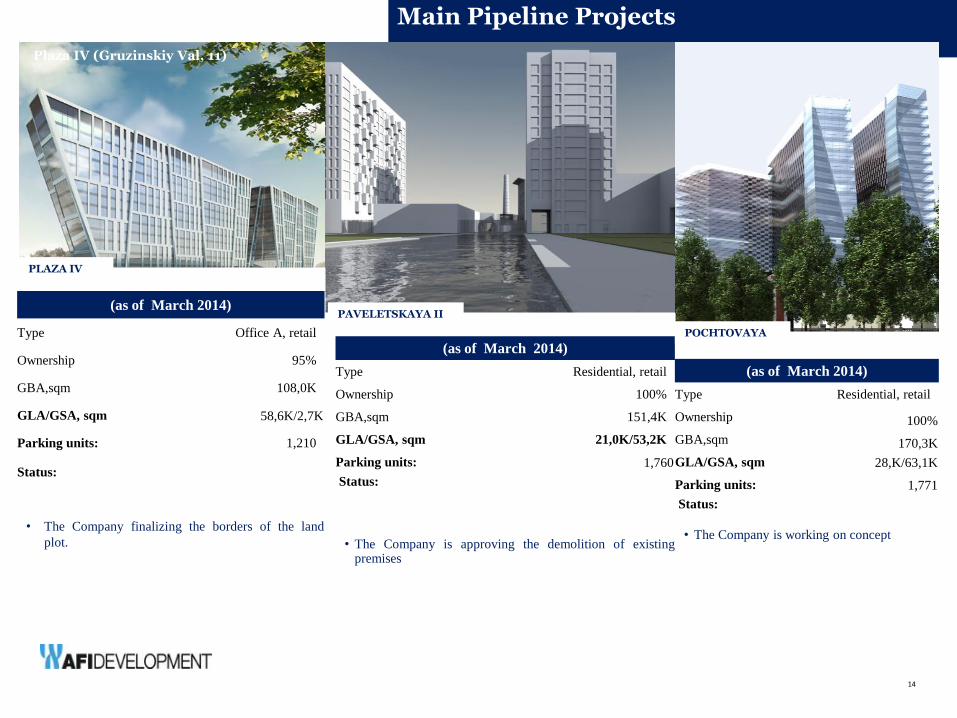
(as of March 2014)
Type Office A, retail
Ownership 95%
GBA,sqm 108,0K
GLA/GSA, sqm 58,6K/2,7K
Parking units: 1,210
Status:
• The Company finalizing the borders of the land
plot.
(as of March 2014)
Type Residential, retail
Ownership 100%
GBA,sqm 151,4K
GLA/GSA, sqm 21,0K/53,2K
Parking units: 1,760
Status:
• The Company is approving the demolition of existing premises
(as of March 2014)
Type Residential, retail
Ownership 100%
GBA,sqm 170,3K
GLA/GSA, sqm 28,K/63,1K
Parking units: 1,771
Status:
• The Company is working on concept
PLAZA IV
PAVELETSKAYA II
POCHTOVAYA
14
Plaza IV (Gruzinskiy Val, 11)
Main Pipeline Projects

SECTION 3 Financial Update
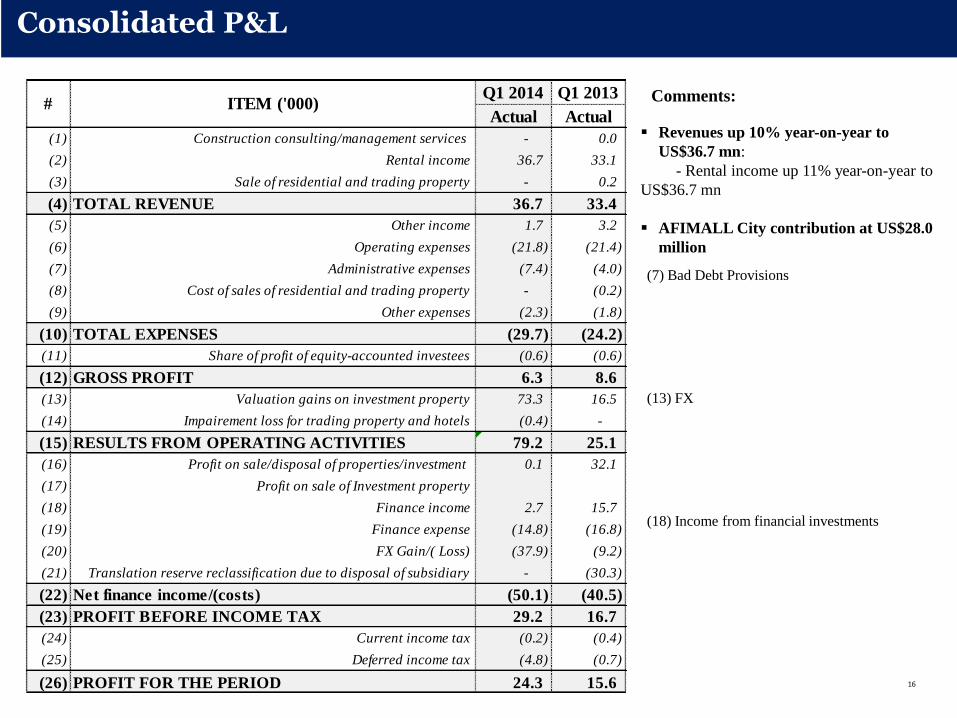
Q1 2014 Q1 2013
Actual Actual
(1) Construction consulting/management services - 0.0
(2) Rental income 36.7 33.1
(3) Sale of residential and trading property - 0.2
(4) TOTAL REVENUE 36.7 33.4
(5) Other income 1.7 3.2
(6) Operating expenses (21.8) (21.4)
(7) Administrative expenses (7.4) (4.0)
(8) Cost of sales of residential and trading property - (0.2)
(9) Other expenses (2.3) (1.8)
(10) TOTAL EXPENSES (29.7) (24.2)
(11) Share of profit of equity-accounted investees (0.6) (0.6)
(12) GROSS PROFIT 6.3 8.6
(13) Valuation gains on investment property 73.3 16.5
(14) Impairement loss for trading property and hotels (0.4) -
(15) RESULTS FROM OPERATING ACTIVITIES 79.2 25.1
(16) Profit on sale/disposal of properties/investment 0.1 32.1
(17) Profit on sale of Investment property
(18) Finance income 2.7 15.7
(19) Finance expense (14.8) (16.8)
(20) FX Gain/( Loss) (37.9) (9.2)
(21) Translation reserve reclassification due to disposal of subsidiary - (30.3)
(22) Net finance income/(costs) (50.1) (40.5)
(23) PROFIT BEFORE INCOME TAX 29.2 16.7
(24) Current income tax (0.2) (0.4)
(25) Deferred income tax (4.8) (0.7)
(26) PROFIT FOR THE PERIOD 24.3 15.6
# ITEM ('000)
Consolidated P&L
16
Revenues up 10% year-on-year to
US$36.7 mn:
- Rental income up 11% year-on-year to
US$36.7 mn
AFIMALL City contribution at US$28.0
million
16
(7) Bad Debt Provisions
(13) FX
(18) Income from financial investments
Comments:
17
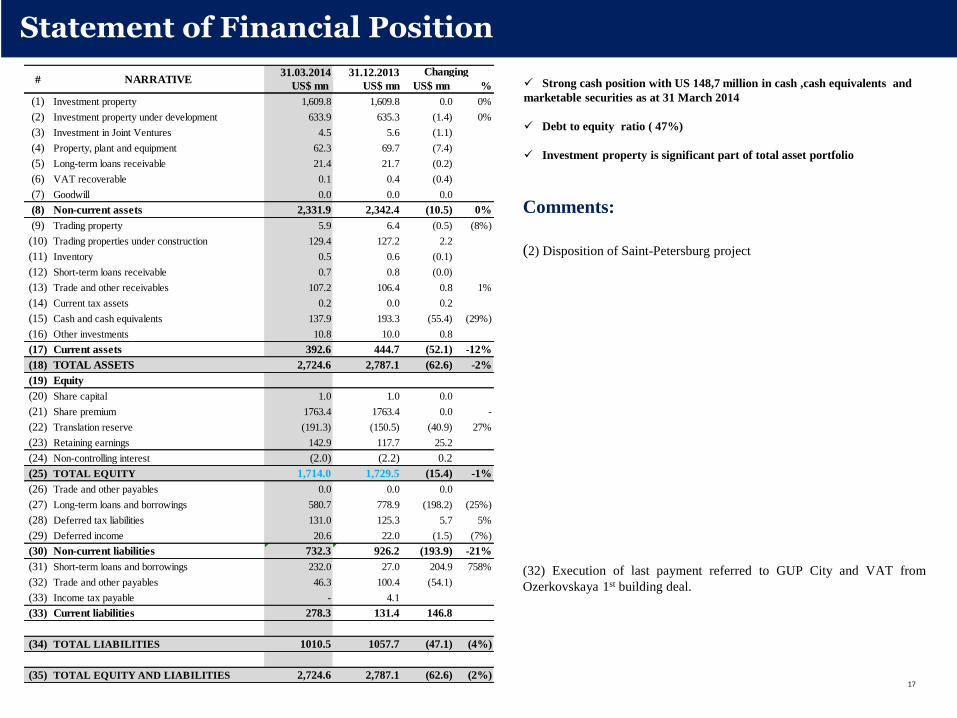
Statement of Financial Position
Comments:
(2) Disposition of Saint-Petersburg project
(32) Execution of last payment referred to GUP City and VAT from
Ozerkovskaya 1st building deal.
17
Strong cash position with US 148,7 million in cash ,cash equivalents and
marketable securities as at 31 March 2014
Debt to equity ratio ( 47%)
Investment property is significant part of total asset portfolio
31.03.2014 31.12.2013
US$ mn US$ mn US$ mn %
(1) Investment property 1,609.8 1,609.8 0.0 0%
(2) Investment property under development 633.9 635.3 (1.4) 0%
(3) Investment in Joint Ventures 4.5 5.6 (1.1)
(4) Property, plant and equipment 62.3 69.7 (7.4)
(5) Long-term loans receivable 21.4 21.7 (0.2)
(6) VAT recoverable 0.1 0.4 (0.4)
(7) Goodwill 0.0 0.0 0.0
(8) Non-current assets 2,331.9 2,342.4 (10.5) 0%
(9) Trading property 5.9 6.4 (0.5) (8%)
(10) Trading properties under construction 129.4 127.2 2.2
(11) Inventory 0.5 0.6 (0.1)
(12) Short-term loans receivable 0.7 0.8 (0.0)
(13) Trade and other receivables 107.2 106.4 0.8 1%
(14) Current tax assets 0.2 0.0 0.2
(15) Cash and cash equivalents 137.9 193.3 (55.4) (29%)
(16) Other investments 10.8 10.0 0.8
(17) Current assets 392.6 444.7 (52.1) -12%
(18) TOTAL ASSETS 2,724.6 2,787.1 (62.6) -2%
(19) Equity
(20) Share capital 1.0 1.0 0.0
(21) Share premium 1763.4 1763.4 0.0 -
(22) Translation reserve (191.3) (150.5) (40.9) 27%
(23) Retaining earnings 142.9 117.7 25.2
(24) Non-controlling interest (2.0) (2.2) 0.2
(25) TOTAL EQUITY 1,714.0 1,729.5 (15.4) -1%
(26) Trade and other payables 0.0 0.0 0.0
(27) Long-term loans and borrowings 580.7 778.9 (198.2) (25%)
(28) Deferred tax liabilities 131.0 125.3 5.7 5%
(29) Deferred income 20.6 22.0 (1.5) (7%)
(30) Non-current liabilities 732.3 926.2 (193.9) -21%
(31) Short-term loans and borrowings 232.0 27.0 204.9 758%
(32) Trade and other payables 46.3 100.4 (54.1)
(33) Income tax payable - 4.1
(33) Current liabilities 278.3 131.4 146.8
(34) TOTAL LIABILITIES 1010.5 1057.7 (47.1) (4%)
(35) TOTAL EQUITY AND LIABILITIES 2,724.6 2,787.1 (62.6) (2%)
# NARRATIVE Changing
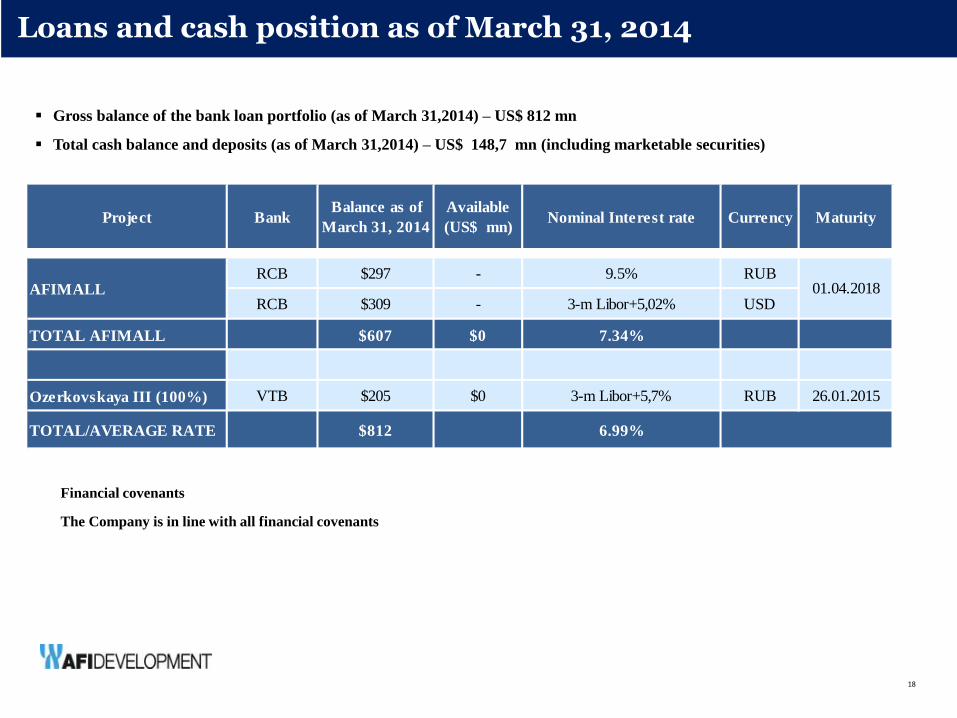
Loans and cash position as of March 31, 2014
The Company is in line with all financial covenants
*
18
Gross balance of the bank loan portfolio (as of March 31,2014) – US$ 812 mn
Total cash balance and deposits (as of March 31,2014) – US$ 148,7 mn (including marketable securities)
Financial covenants
Project BankBalance as of
March 31, 2014
Available
(US$ mn)Nominal Interest rate Currency Maturity
RCB $297 - 9.5% RUB
RCB $309 - 3-m Libor+5,02% USD
TOTAL AFIMALL $607 $0 7.34%
Ozerkovskaya III (100%) VTB $205 $0 3-m Libor+5,7% RUB 26.01.2015
TOTAL/AVERAGE RATE $812 6.99%
AFIMALL 01.04.2018
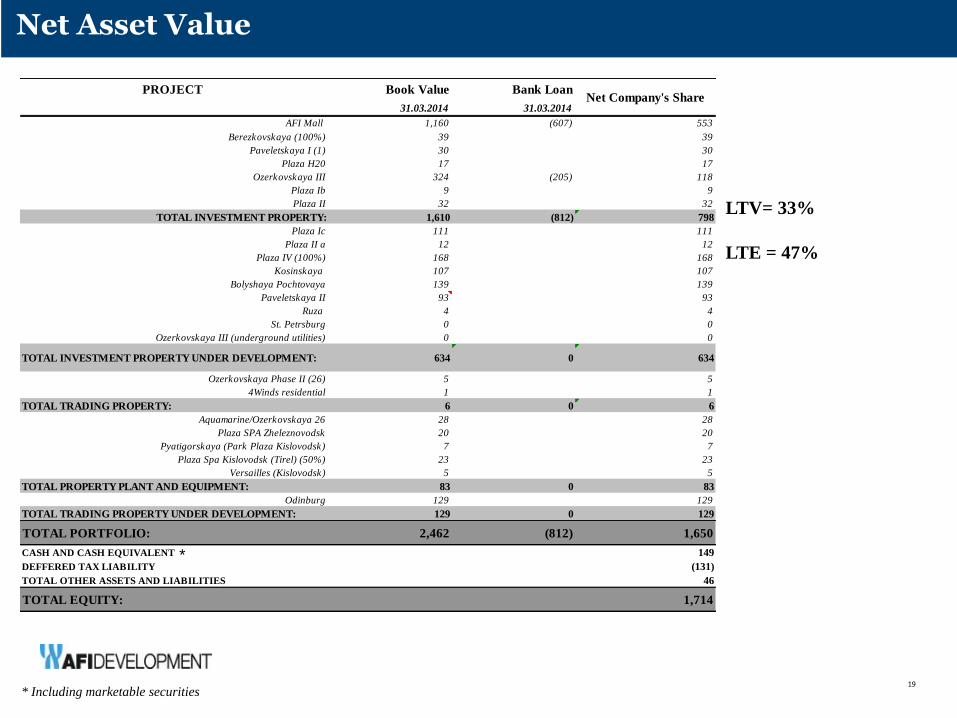
PROJECT Book Value Bank Loan
31.03.2014 31.03.2014
AFI Mall 1,160 (607) 553
Berezkovskaya (100%) 39 39
Paveletskaya I (1) 30 30
Plaza H20 17 17
Ozerkovskaya III 324 (205) 118
Plaza Ib 9 9
Plaza II 32 32
TOTAL INVESTMENT PROPERTY: 1,610 (812) 798
Plaza Ic 111 111
Plaza II a 12 12
Plaza IV (100%) 168 168
Kosinskaya 107 107
Bolyshaya Pochtovaya 139 139
Paveletskaya II 93 93
Ruza 4 4
St. Petrsburg 0 0
Ozerkovskaya III (underground utilities) 0 0
TOTAL INVESTMENT PROPERTY UNDER DEVELOPMENT: 634 0 634
Ozerkovskaya Phase II (26) 5 5
4Winds residential 1 1
TOTAL TRADING PROPERTY: 6 0 6
Aquamarine/Ozerkovskaya 26 28 28
Plaza SPA Zheleznovodsk 20 20
Pyatigorskaya (Park Plaza Kislovodsk) 7 7
Plaza Spa Kislovodsk (Tirel) (50%) 23 23
Versailles (Kislovodsk) 5 5
TOTAL PROPERTY PLANT AND EQUIPMENT: 83 0 83
Odinburg 129 129
TOTAL TRADING PROPERTY UNDER DEVELOPMENT: 129 0 129
TOTAL PORTFOLIO: 2,462 (812) 1,650
CASH AND CASH EQUIVALENT 149
DEFFERED TAX LIABILITY (131)
TOTAL OTHER ASSETS AND LIABILITIES 46
TOTAL EQUITY: 1,714
Net Company's Share
19
Net Asset Value
LTV= 33%
LTE = 47%
19
*
* Including marketable securities

Annex
Market Update
Market Overview and Capital Markets
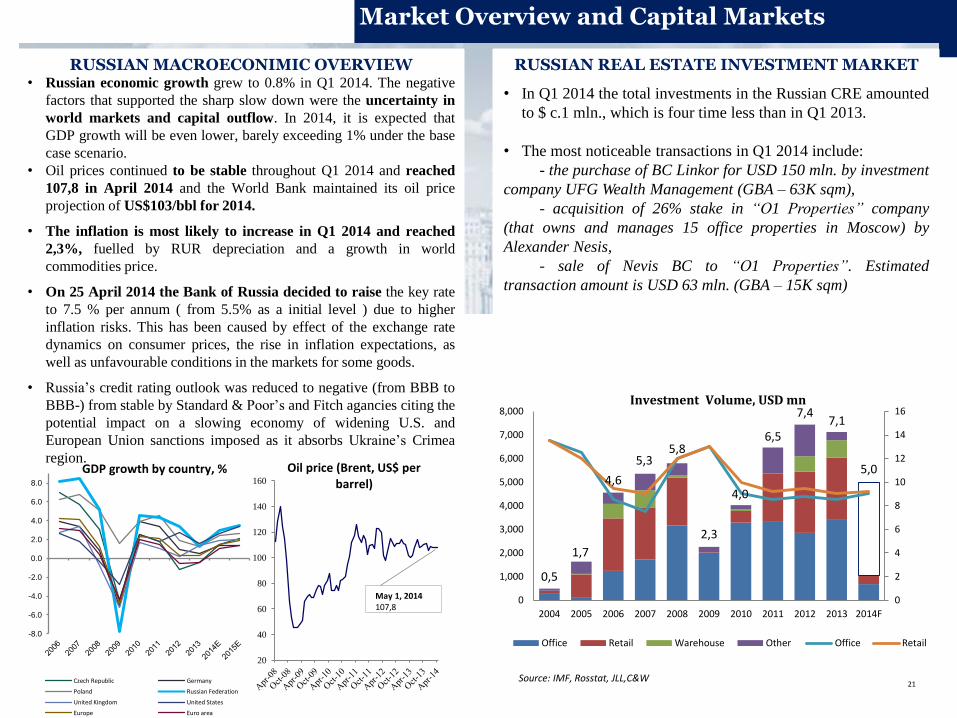
RUSSIAN MACROECONIMIC OVERVIEW RUSSIAN REAL ESTATE INVESTMENT MARKET • Russian economic growth grew to 0.8% in Q1 2014. The negative
factors that supported the sharp slow down were the uncertainty in
world markets and capital outflow. In 2014, it is expected that
GDP growth will be even lower, barely exceeding 1% under the base
case scenario.
• Oil prices continued to be stable throughout Q1 2014 and reached
107,8 in April 2014 and the World Bank maintained its oil price
projection of US$103/bbl for 2014.
• The inflation is most likely to increase in Q1 2014 and reached
2,3%, fuelled by RUR depreciation and a growth in world
commodities price.
• On 25 April 2014 the Bank of Russia decided to raise the key rate
to 7.5 % per annum ( from 5.5% as a initial level ) due to higher
inflation risks. This has been caused by effect of the exchange rate
dynamics on consumer prices, the rise in inflation expectations, as
well as unfavourable conditions in the markets for some goods.
• Russia’s credit rating outlook was reduced to negative (from BBB to
BBB-) from stable by Standard & Poor’s and Fitch agancies citing the
potential impact on a slowing economy of widening U.S. and
European Union sanctions imposed as it absorbs Ukraine’s Crimea
region.
• In Q1 2014 the total investments in the Russian CRE amounted
to $ c.1 mln., which is four time less than in Q1 2013.
• The most noticeable transactions in Q1 2014 include:
- the purchase of BC Linkor for USD 150 mln. by investment
company UFG Wealth Management (GBA – 63K sqm),
- acquisition of 26% stake in “O1 Properties” company
(that owns and manages 15 office properties in Moscow) by
Alexander Nesis,
- sale of Nevis BC to “O1 Properties”. Estimated
transaction amount is USD 63 mln. (GBA – 15K sqm)
-8.0
-6.0
-4.0
-2.0
0.0
2.0
4.0
6.0
8.0
GDP growth by country, %
Czech Republic Germany
Poland Russian Federation
United Kingdom United States
Europe Euro area
21
20
40
60
80
100
120
140
160
Oil price (Brent, US$ per barrel)
May 1, 2014 107,8
Source: IMF, Rosstat, JLL,C&W
0,5
1,7
4,6
5,3 5,8
2,3
4,0
6,5
7,4 7,1
5,0
0
2
4
6
8
10
12
14
16
0
1,000
2,000
3,000
4,000
5,000
6,000
7,000
8,000
2004 2005 2006 2007 2008 2009 2010 2011 2012 2013 2014F
Investment Volume, USD mn
Office Retail Warehouse Other Office Retail

Office and Retail Markets overview
OFFICE MARKET OVERVIEW
RETAIL MARKET OVERVIEW
Key indicators Units
Prime rate, US$ sqmpa
(US$/sqm/year)
900-1,100
Base rent Class A
US$ sqmpa
580-900
Yields (prime) 9,00%
Overall vacancy,% 13,9%
Vacancy rate,%
(Class A CBD )
20,8%
Key indicators Units
Prime rate, US$
psqma (prime shopping center retail
gallery)
3,000- 4,500
Base rent, US$
psqma
500-1,800
Yields (prime) 8,5%
Vacancy rate,% 2,5%
• About 209,048 sq m of new office space were delivered in Moscow in
Q1 2014 with the following key Class A developments: Morozov II and
Evrazia Tower. In 2014 office supply will continue to be higher than
demand, which will result in further growth of in the availability of
quality offices in Moscow.
• Overall vacancy rate ticked up slightly to 13.9%. Vacancy levels for
Class A office spaces turned to be a bit higher compared to the levels
seen in Q1 2013 and reached 20.8% mainly due to the new supply in Q1
2014
• Ruble devaluation affected negatively dollar denominated rents.
Over the last quarter, prime rents decreased slightly to USD900–1,100
per sq m per year mainly due to the ruble devaluation. Nonetheless, the
level of base rents across the market remained largely stable.
• In Q1 2014 completions level in Moscow was 59,100 sq m in Q1 2014.
This accounts for two shopping centres: Reutov Park (GLA 42,600) and
Moskvorechie (GLA 16,500).
• Despite the challenging macroeconomic environment international
retailers were active in Q1 2014. Among new retailers in Russia —
Conguitos, Sinsay, Monki, and Violeta by Mango.
• The vacancy rate and rental rates remained stable in Q1 2014. As of
at the end of Q1 2014 the vacancy rate in quality shopping centres
remained at 2.5%. Prime rent in Moscow shopping centres is
USD3,000–4,500/sq m/year and the average rent is USD500–1,800/ sq
m/year.
22
RESIDENTIAL MARKET MOSCOW AND MOSCOW REGION
• At the end of March 2014 the weighted average dollar price in the
primary market of business residential segment reached US$ 7,270
psqm.
• The average price in Moscow region reached 2,205 US$ per sqm
600 710
930
1,090
710 640
740 790 850 850
800
1,000
1,500
2,000
800 850
1,200 1,150 1,150 1,100
400
600
800
1,000
1,200
1,400
1,600
1,800
2,000
2,200
US$
/psq
m/p
a
Office Rental Rates
average Class A class A CBD Prime
3,000
3,500
4,500
4,800
3,700
4,000 4,000
4,000
4,500 4,500 4,500
1,300 1,500
1,700 2,000
1,200 1,350
1,350 1,350
1,150 1,150
1,150
0
500
1,000
1,500
2,000
2,500
3,000
3,500
4,000
4,500
5,000
USD
psq
m p
a
Retail Rental Rates
Prime rents Base rents
6000
6500
7000
7500
8000
8500
7,270
Residential Price
Average price (appartments), US$ Average Market Price, USD
Source: JLL, intermarksavills Source: http://www.peresvet.ru/temptext/1397046862160.pdf


![Q1 2018 Investor Presentation [Read-Only]investor.drhorton.com/~/media/Files/D/D-R-Horton-IR...Investor Presentation Q1 FY 2018. 2 D.R. HORTON, INC. By closings volume for calendar](https://static.documents.pub/doc/80x56/5fb889bdaea07e29f34181c8/q1-2018-investor-presentation-read-only-mediafilesdd-r-horton-ir-investor.jpg)


