23
Quarterly Review of the Medical Technology Sector (MedTech) Q1 2014 Member: FINRA/SIPC
Quarterly
Review of the
Medical
Technology
Sector
(MedTech)
Q1 2014
Member: FINRA/SIPC
2
About Navidar
Navidar is an investment banking firm providing companies and investors in dynamic industries with strategic
M&A advice, capital raising solutions, vital insights and breakthrough opportunities.
■ Big Firm Experience Combined with Senior Banker Attention
■ Global Relationships With Top-Tier Investors and World-Leading Companies
■ Greater Creativity & Customized Solutions
■ Focused on the Middle Corridor of the United States
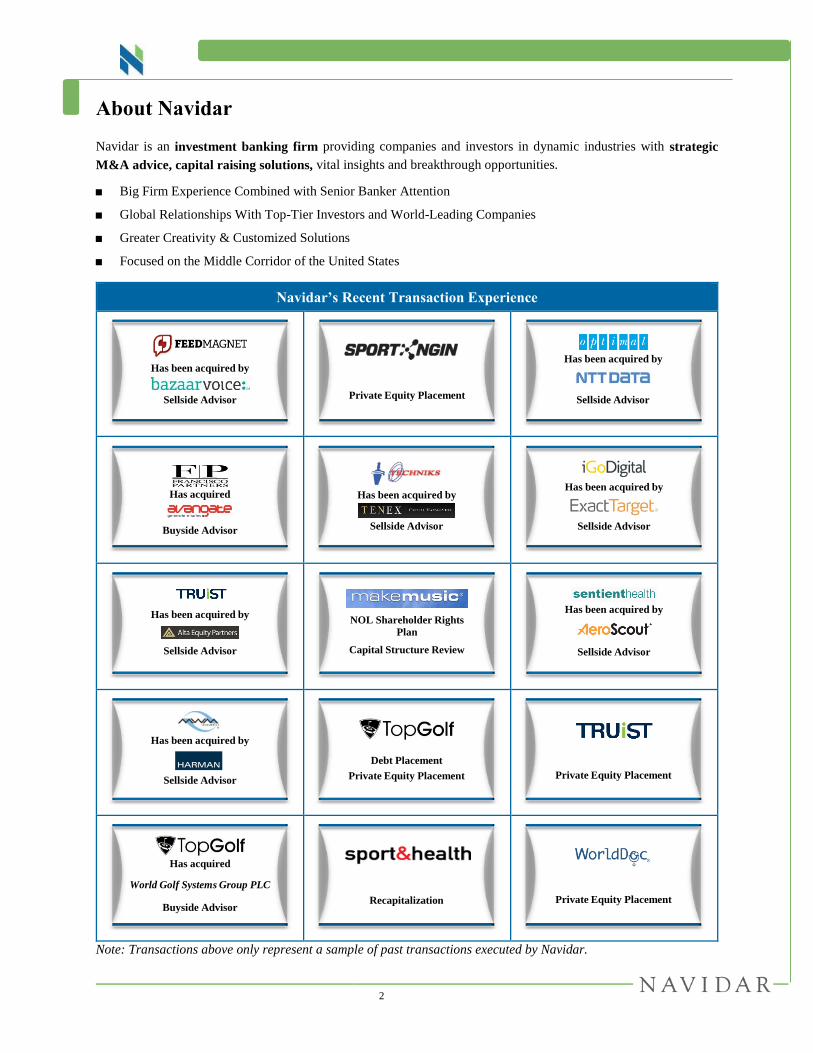
Navidar’s Recent Transaction Experience
Note: Transactions above only represent a sample of past transactions executed by Navidar.
Sellside Advisor
Has been acquired by
Private Equity Placement Sellside Advisor
Has been acquired by
Has acquired
Buyside Advisor Sellside Advisor
Has been acquired by
Sellside Advisor
Has been acquired by
Sellside Advisor
Has been acquired by
Capital Structure Review
NOL Shareholder Rights
Plan
Has been acquired by
Sellside Advisor
Sellside Advisor
Has been acquired by
Debt Placement
Private Equity Placement Private Equity Placement
Buyside Advisor
Has acquired
World Golf Systems Group PLC
Recapitalization Private Equity Placement
3
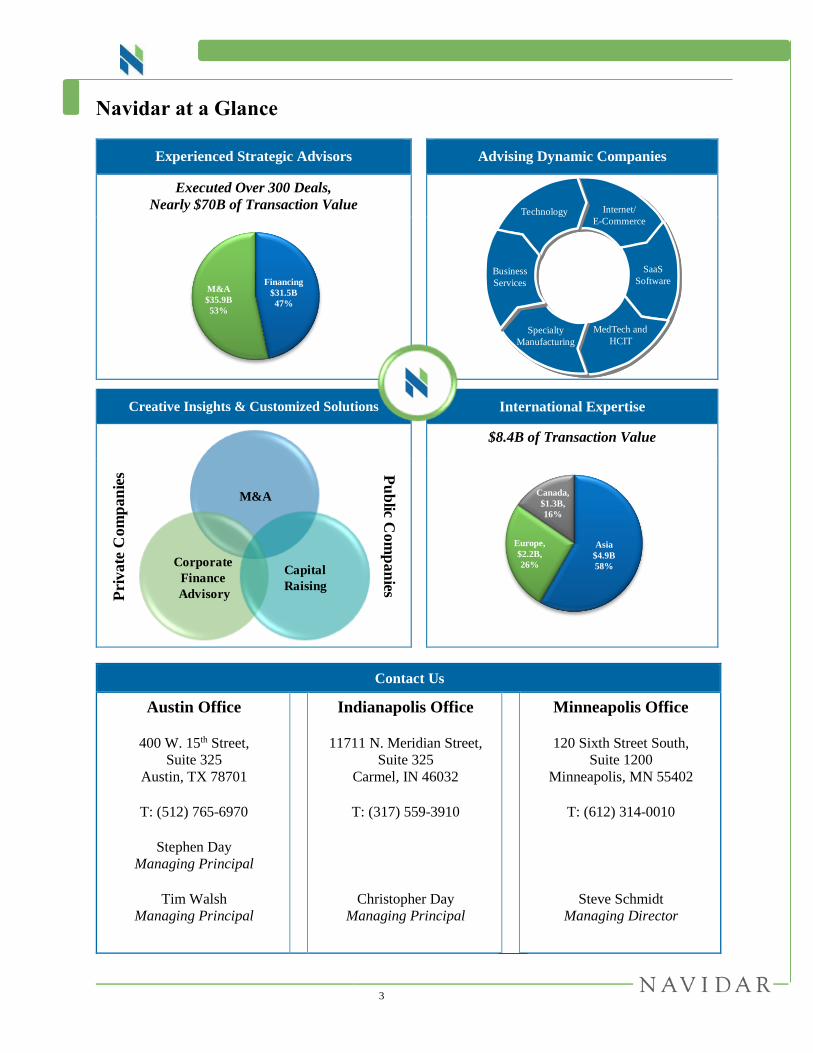
Navidar at a Glance
Experienced Strategic Advisors
Advising Dynamic Companies
Executed Over 300 Deals,
Nearly $70B of Transaction Value
Creative Insights & Customized Solutions
International Expertise
$8.4B of Transaction Value
Contact Us
Austin Office
400 W. 15th Street,
Suite 325
Austin, TX 78701
T: (512) 765-6970
Stephen Day
Managing Principal
Tim Walsh
Managing Principal
Indianapolis Office
11711 N. Meridian Street,
Suite 325
Carmel, IN 46032
T: (317) 559-3910
Christopher Day
Managing Principal
Christopher Day
Managing Principal
Minneapolis Office
120 Sixth Street South,
Suite 1200
Minneapolis, MN 55402
T: (612) 314-0010
Christopher Day
Managing Principal
Steve Schmidt
Managing Director
Financing
$31.5B
47%
M&A
$35.9B
53%
M&A
Corporate
Finance
Advisory
Capital
Raising
Pu
blic C
om
pa
nies
Pri
va
te C
om
pa
nie
s
Asia
$4.9B
58%
Europe,
$2.2B,
26%
Canada,
$1.3B,
16%
Technology Internet/
E-Commerce
SaaS
SoftwareBusiness
Services
MedTech and
HCITSpecialty
Manufacturing
Technology Internet/
E-Commerce
SaaS
SoftwareBusiness
Services
MedTech and
HCITSpecialty
Manufacturing
4
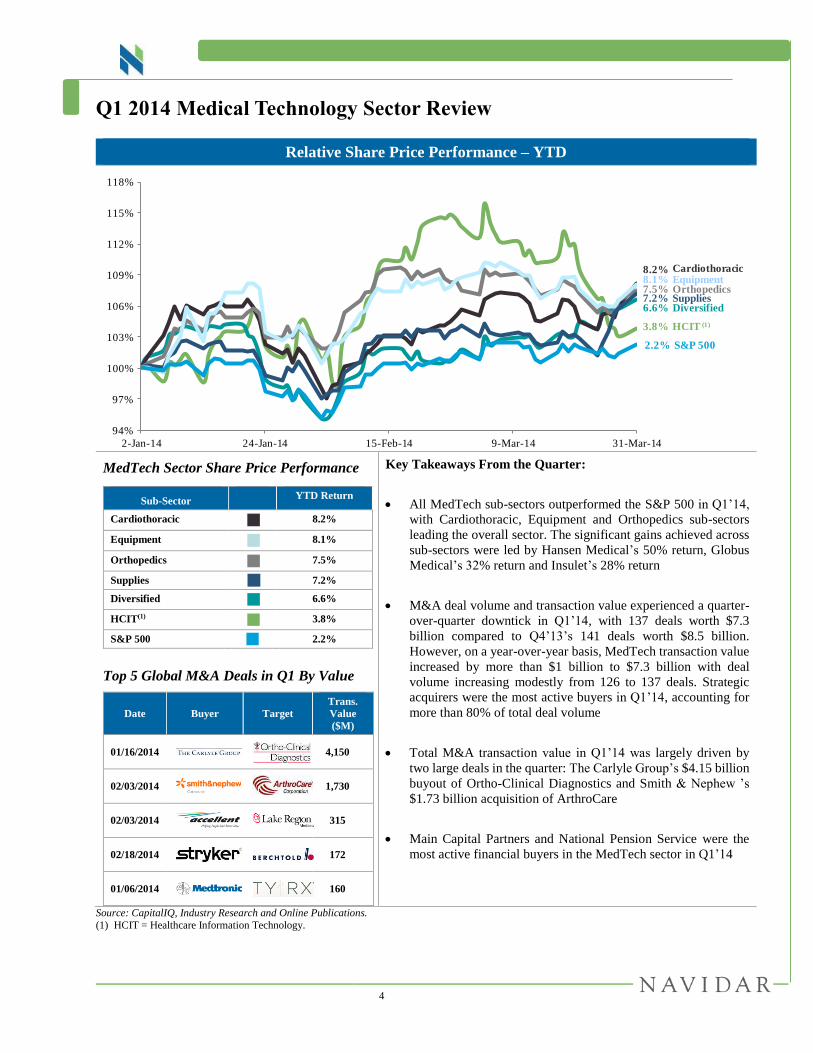
Q1 2014 Medical Technology Sector Review
Relative Share Price Performance – YTD
MedTech Sector Share Price Performance
Top 5 Global M&A Deals in Q1 By Value
Date Buyer Target
Trans.
Value
($M)
01/16/2014
4,150
02/03/2014
1,730
02/03/2014 315
02/18/2014 172
01/06/2014 160
Sub-Sector YTD Return
Cardiothoracic 8.2%
Equipment
8.1%
Orthopedics 7.5%
Supplies 7.2%
Diversified 6.6%
HCIT(1) 3.8%
S&P 500 2.2%
Key Takeaways From the Quarter:
All MedTech sub-sectors outperformed the S&P 500 in Q1’14,
with Cardiothoracic, Equipment and Orthopedics sub-sectors
leading the overall sector. The significant gains achieved across
sub-sectors were led by Hansen Medical’s 50% return, Globus
Medical’s 32% return and Insulet’s 28% return
M&A deal volume and transaction value experienced a quarter-
over-quarter downtick in Q1’14, with 137 deals worth $7.3
billion compared to Q4’13’s 141 deals worth $8.5 billion.
However, on a year-over-year basis, MedTech transaction value
increased by more than $1 billion to $7.3 billion with deal
volume increasing modestly from 126 to 137 deals. Strategic
acquirers were the most active buyers in Q1’14, accounting for
more than 80% of total deal volume
Total M&A transaction value in Q1’14 was largely driven by
two large deals in the quarter: The Carlyle Group’s $4.15 billion
buyout of Ortho-Clinical Diagnostics and Smith & Nephew ’s
$1.73 billion acquisition of ArthroCare
Main Capital Partners and National Pension Service were the
most active financial buyers in the MedTech sector in Q1’14
Source: CapitalIQ, Industry Research and Online Publications.
(1) HCIT = Healthcare Information Technology.
94%
97%
100%
103%
106%
109%
112%
115%
118%
2-Jan-14 24-Jan-14 15-Feb-14 9-Mar-14 31-Mar-14
7.2%
3.8%
6.6%
8.2%8.1%7.5%
Supplies
HCIT (1)
Diversified
CardiothoracicEquipmentOrthopedics
S&P 5002.2%
5
Medical Technology Sector M&A Review
Source: CapitalIQ and Industry Research. (1) Defined as transaction value of $500M EV and less.
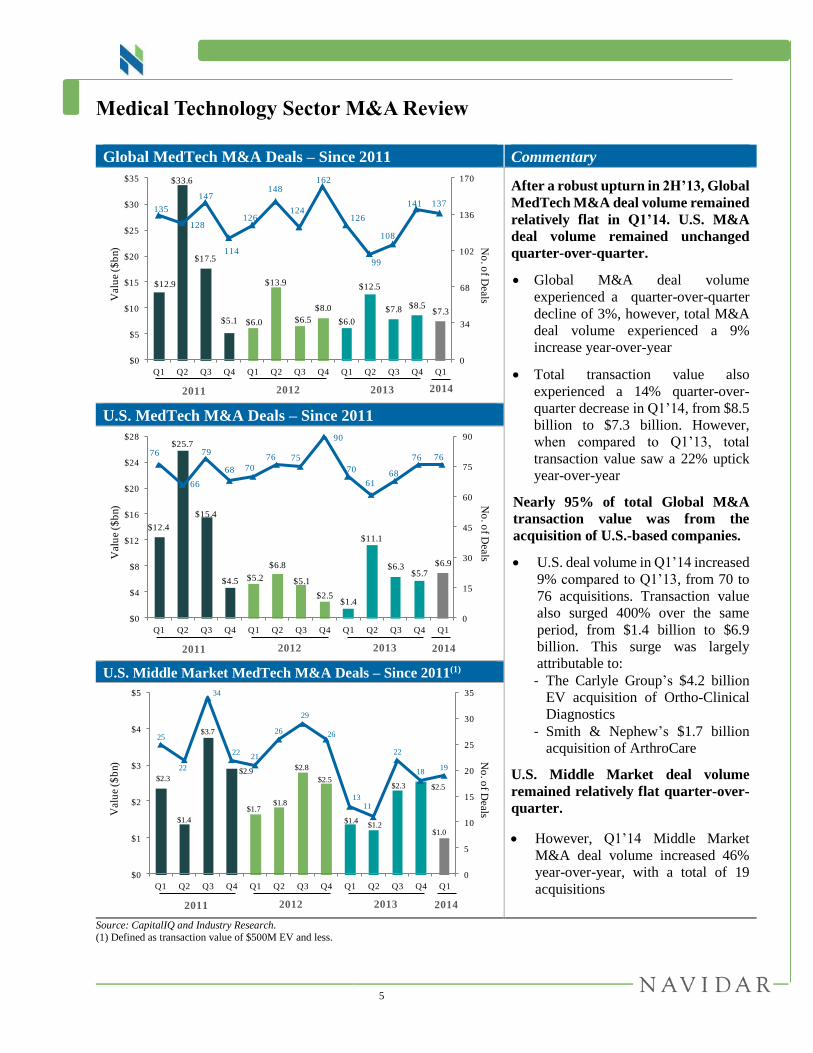
Global MedTech M&A Deals – Since 2011 Commentary
After a robust upturn in 2H’13, Global
MedTech M&A deal volume remained
relatively flat in Q1’14. U.S. M&A
deal volume remained unchanged
quarter-over-quarter.
Global M&A deal volume
experienced a quarter-over-quarter
decline of 3%, however, total M&A
deal volume experienced a 9%
increase year-over-year
Total transaction value also
experienced a 14% quarter-over-
quarter decrease in Q1’14, from $8.5
billion to $7.3 billion. However,
when compared to Q1’13, total
transaction value saw a 22% uptick
year-over-year
Nearly 95% of total Global M&A
transaction value was from the
acquisition of U.S.-based companies.
U.S. deal volume in Q1’14 increased
9% compared to Q1’13, from 70 to
76 acquisitions. Transaction value
also surged 400% over the same
period, from $1.4 billion to $6.9
billion. This surge was largely
attributable to:
- The Carlyle Group’s $4.2 billion
EV acquisition of Ortho-Clinical
Diagnostics
- Smith & Nephew’s $1.7 billion
acquisition of ArthroCare
U.S. Middle Market deal volume
remained relatively flat quarter-over-
quarter.
However, Q1’14 Middle Market
M&A deal volume increased 46%
year-over-year, with a total of 19
acquisitions
U.S. MedTech M&A Deals – Since 2011
U.S. Middle Market MedTech M&A Deals – Since 2011(1)
Valu
e (
$b
n)
$12.9
$33.6
$17.5
$5.1 $6.0
$13.9
$6.5
$8.0
$6.0
$12.5
$7.8 $8.5 $7.3
135
128
147
114
126
148
124
162
126
99
108
141 137
0
34
68
102
136
170
$0
$5
$10
$15
$20
$25
$30
$35
Q1 Q2 Q3 Q4 Q1 Q2 Q3 Q4 Q1 Q2 Q3 Q4 Q1
No
. of D
eals
2011 2012 2013 2014
Val
ue
($b
n)
$12.4
$25.7
$15.4
$4.5 $5.2
$6.8
$5.1
$2.5 $1.4
$11.1
$6.3 $5.7
$6.9
76
66
79
68 70
76 75
90
70
6168
76 76
0
15
30
45
60
75
90
$0
$4
$8
$12
$16
$20
$24
$28
Q1 Q2 Q3 Q4 Q1 Q2 Q3 Q4 Q1 Q2 Q3 Q4 Q1
No
. of D
eals
2011 2012 2013 2014
Val
ue
($b
n)
$2.3
$1.4
$3.7
$2.9
$1.7 $1.8
$2.8
$2.5
$1.4 $1.2
$2.3 $2.5
$1.0
25
22
34
2221
26
29
26
1311
22
1819
0
5
10
15
20
25
30
35
$0
$1
$2
$3
$4
$5
Q1 Q2 Q3 Q4 Q1 Q2 Q3 Q4 Q1 Q2 Q3 Q4 Q1
No
. of D
eals
2011 2012 2013 2014

6
Medical Technology Sector M&A Review (Cont.)
Top 10 Global MedTech M&A Transactions in Q1 2014
Announced
Date Buyer Target
Trn. Value
($M)
LTM
EV/Rev. (x)
LTM
EV/EBITDA (x)
03/20/2014 EKF Diagnostics (U.K.) Selah Genomics (U.S.) 73.2 55.9x NA
03/13/2014 Medira (U.S.) Medegen Medical Products & Certain
Assets of Patient Care Business (U.S.) 75.0 NA NA
02/24/2014 Zhongyuan Union Stem Cell Bio-engineering (China)
Shanghai Zhicheng Biological Technology (China)
139.1 NA NA
02/18/2014 Stryker (U.S.) Berchtold (Germany) 172.0 1.4x NA
02/03/2014 Smith & Nephew (U.S.) ArthroCare (U.S.) 1,730.1 4.0x 17.8x
02/03/2014 Accellent (U.S.) Lake Region Medical (U.S.) 315.0 NA NA
01/30/2014 Wright Medical Group (U.S.) Solana Surgical (U.S.) 84.9 NA NA
01/16/2014 The Carlyle Group (U.S.) Ortho-Clinical Diagnostics (U.S.) 4,150.0 2.2x NA
01/07/2014 Carl Zeiss Meditec (U.S.) Aaren Scientific (U.S.) 70.0 NA NA
01/06/2014 Medtronic (U.S.) TYRX (U.S.) 160.0 NA NA
U.S. MedTech M&A Deal Volume by Size
Q1 2013 Q1 2014 Q4 2013
$ in millions
except # Number of
Deals
Total Deal
Value
Number of
Deals
Total Deal
Value
Number of
Deals
Total Deal
Value
< $50M 8 158 13 199 5 27
$50M to $100M 2 178 4 303 4 253
$100M to $250M NA NA 1 160 4 565
$250M to $500M 3 1,042 1 315 4 1,205
$500M to $1000M NA NA NA NA 3 1,965
>1B NA NA 2 5,880 1 1,675
Undisclosed 57 NA 55 NA 55 NA
Total 70 1,377 76 6,857 76 5,689
Source: CapitalIQ and Industry Research. Note: EV = Enterprise Value (Equity Value + Debt + Minority Interest – Cash and Cash Equivalents).
7
Medical Technology Sector M&A Review (Cont.)
Review of Selected MedTech Transactions in Q1
Healthstream acquired Health Care Compliance Strategies (HCCS) for $16M EV.
Acquisition enhances Healthstream’s Workforce Development portfolio with a comprehensive
solution of premium courseware and a proven application for conflict of interest remediation
Headquartered in Jericho, NY, HCCS offers General Compliance Suite, providing online training courses
and learning management systems to hospitals and healthcare institutions. The Company also provides
Research Compliance Suite, providing solutions for grant and contract writing, conflict of interest
remediation, research best practices and other solutions for professional relationships and data issues.
HCCS also offers Quality Improvement Suite, which offers joint commission accreditation and tracer
methodology, patient safety solutions, bioterrorism and disaster preparation, organizational performance
improvement and patient education. In addition, HCCS’ Workplace Compliance Suite includes tools for
preventing sexual harassment in healthcare organizations and identifying theft prevention.
Varian Medical Systems acquired Velocity Medical Solutions. Valuation was not disclosed.
Acquisition of Velocity Medical’s product portfolio bolsters Varian Medical’s Oncology business,
enabling healthcare professionals to utilize patient images and data to plan and assess treatments,
collaborate with colleagues and share clinical knowledge
Based in Atlanta, GA, Velocity Medical Solutions provides intelligent radiation treatment tools for
oncologists. Velocity specializes in oncology-focused picture archiving and communications systems
(PACS) with wide applicability to the research, clinical and drug discovery markets. The Company was
founded by leading clinicians who have helped develop innovative and powerful tools to transform
unstructured data into useful clinical knowledge. Proprietary Velocity software enables clinicians to easily
collect, integrate and share data from CT, PET and MR images and diverse treatment systems for close
collaboration with referring physicians, oncologists and medical physicists. Velocity software is already in
use in over 200 cancer treatment centers worldwide.
TELUS Health Solutions acquired Med Access. Valuation was not disclosed.
Acquisition positions TELUS as Canada’s largest electronic medical record provider, expanding
the Company’s EMR reach to 12,500 Canadian physicians and medical specialists
Based in Canada, Med Access provides electronic medical record services to 2,000 specialty and general
practice doctors in British Columbia, Alberta, Saskatchewan, Manitoba and Ontario. The Company offers
Web-based electronic medical record system software for linking patients, physicians, hospitals and
healthcare service providers across Canada. Company solutions include Rise Health Suite, which includes
calendar-facing views for booking, appointment listing, patient information discovery and recalls and alerts
for physicians. In addition, the Med Access solution offers an entry-level scheduling and billing software
and services package, combined with Med Easy, a solution for meeting the billing and scheduling needs of
clients. Source: CapitalIQ, Press Releases, Equity Research, Online Publications and Industry Research.
Note: EV = Enterprise Value (Equity Value + Debt + Minority Interest – Cash and Cash Equivalents) and NTM = Next Twelve Months.
8
Medical Technology Sector M&A Review (Cont.)
Healthcare Supplies
Carl Zeiss Meditec acquired Aaren Scientific for $70M EV.
Acquisition of Aaren Scientific expands Carl Zeiss’ intraocular lens portfolio, complementing the
existing development and manufacturing sites in Berlin, Germany and La Rochelle, France
Headquartered in Canada, Aaren Scientific designs and manufactures intraocular lenses (IOLs) and
ophthalmic surgical products for cataract and refractive surgeries. Aaren offers hydrophilic and
hydrophobic IOLs processed with the Company’s P.U.R.E. system, aspheric optics to enhance contrast
sensitivity in cases of lens misalignment and heparin surface modification for biocompatibility. Aaren
Scientific, manufacturer of IOLs for over two decades, was the first so in the U.S. to receive CE registration
and is well regarded for its innovative R&D capabilities. The Company earned 2012 total revenues of ~$20
million and has 235 employees worldwide.
North Coast Medical acquired ActivaTek. Valuation was not disclosed.
Acquisition represents new growth vectors for ActivaTek’s business and its global distribution
partners in the Rehabilitation medical sector, while enabling North Coast Medical to enhance the
well-being of a greater number of rehabilitation patients
Based in Salt Lake City, UT, ActivaTek develops and markets iontophoresis products to the rehabilitation
medicine market. The Company offers drug delivery and medical devices, including Trivarion, an
iontophoresis system that delivers treatment to key extremities such as the elbows, wrists, Achilles tendon,
shoulders, knees, fingers and knuckles. ActivaTek also offers ActivaStim, a muscle stimulation electrode,
ActivaPatch, a self-contained iontophoretic drug delivery system, Trivarion Butterfly, a buffered
iontophoretic delivery kit and ActivaDoseII, a drug dose control system.
Minnesota Thermal Science acquires Cool Logistics. Valuation was not disclosed.
Acquisition accelerates Minnesota Thermal’s BioPharma strategy and expands Cool Logistics’
market positioning with a large global footprint, strong local sales and customer service support
Headquartered in the U.K, Cool Logistics designs and manufactures temperature-controlled packaging
solutions for pharmaceutical and healthcare industries in the United Kingdom and internationally. The
Company offers dry ice shippers, off-the-shelf temperature controlled packaging systems, passive vacuum
insulated panels, material phase-change packaging solutions, thermal packaging solutions and bulk
shipping products. Cool Logistics, founded in 2000, employed approximately 50 professionals globally.
Source: CapitalIQ, Press Releases, Equity Research, Online Publications and Industry Research.
Note: EV = Enterprise Value (Equity Value + Debt + Minority Interest – Cash and Cash Equivalents) and NTM = Next Twelve Months.
9
Medical Technology Sector M&A Review (Cont.)
Healthcare Equipment
Smith & Nephew acquired ArthroCare for $1.73B EV, which implied 4.0x LTM Revenue.
Acquisition combines ArthroCare’s latest generation of radio frequency technology and Smith
& Nephew’s strong mechanical blade portfolio
Additionally, ArthroCare’s shoulder anchor solutions strongly complements Smith & Nephew’s
competencies in knee repair, forming an extensive, integrated joint repair portfolio
Headquartered in Austin, TX, ArthroCare develops and manufactures surgical devices, instruments and
implants that enhance surgical techniques, supplement minimally-invasive procedures and improve patient
outcomes. ArthroCare’s two core product lines are Sports Medicine and Ear, Nose & Throat with a growing
presence in spine, wound care, urology and gynecology. The Company has approximately 1,800 employees
and had 2012 revenue of $368 million.
Accellent acquired Lake Region Medical for $315M EV.
Acquisition of Lake Region Medical enables Accellent to offer patients interventional catheter
deliver, access and rectrieval systems to complement customers’ core therapeutic devices
Additionally, the new Lake Region Medical will have strong manufacturing capabilities to
support customers’ product needs for components, sub-assemblies and fully-assembled devices
in both Cardio & Vascular and Advanced Surgical markets
Based in Chaska, MN, Lake Region Medical develops and manufactures medical devices and components
for customers in the United States and internationally. The Company provides interventional and low-
volume diagnostic guidewires, specialized medical devices, precision machining as well as hydrophilic,
silicone, PTFE, heparin and polyimide coatings. Lake Region’s product applications include stimulation
therapy for the cardiovascular, neurovascular and peripheral vascular systems.
Stryker acquired Berchtold for $172M EV, which implied 1.4x LTM Revenue.
Acquisition bolsters Stryker’s fast-growing Endoscopy division with the addition of Berchtold’s
innovative operating room equipment product portfolio
Headquartered in Germany, Berchtold develops, manufactures and installs operating room lights and
surgical tables. The Company’s products include Chromophare operating room (OR) instruments and
examination lights, mobile OR tables, ceiling pendants, telemedicine products and infrastructure for
scalable in-room routing, device control and digital data exchange with external devices. Berchtold had
2013 revenue of approximately $125 million.
Source: CapitalIQ, Press Releases, Equity Research, Online Publications and Industry Research.
Note: EV = Enterprise Value (Equity Value + Debt + Minority Interest – Cash and Cash Equivalents) and NTM = Next Twelve Months.
10
Medical Technology Sector M&A Review (Cont.)
Healthcare Equipment
Medtronic acquired TYRX for $160M EV.
Acquisition of TYRX’s infection-reducing surgical products and medical devices marks a
strategic entry point for Medtronic into the broader healthcare services and solutions market
Headquartered in Monmouth Junction, NJ, TYRX's product offerings include the recently FDA-approved
AIGISRx® Fully Resorbable Antibacterial Envelope, designed to reduce surgical site infections associated
with Cardiac Implantable Electronic Devices and the AIGISRx Antibacterial Envelope, for use with spinal
cord neuromostimulators. TYRX, founded in 1998, had 2013 revenue of $30 million and employed
approximately 50 professionals worldwide.
Wright Medical acquired Solana Surgical for $84.9M EV and OrthoPro for $36M EV.
Acquisition of Solana Surgical improves Wright’s biologic offerings in the foot and ankle market,
while OrthoPro fills in product gaps in Wright’s lower extremity hardware portfolio
Headquartered in Memphis, TN, Solana Surgical is a global orthopedics solution provider developing
innovative products to restore motion, relieve pain and improve surgical outcomes. Since coming to
market in 2011, Solana Surgical’s aim has been to advance the science of foot, ankle and hand wellness.
Headquartered in Salt Lake City, UT, OrthoPro provides high quality, innovative foot and ankle products.
In the last decade, OrthoPro has launched several innovative surgical products for the foot and ankle
market, including the Phalinx Cannulated Hammertoe Fixation System, Total Compression Plate System
and Hemiarthroplasty Implant. OrthoPro was founded in 2003.
Source: CapitalIQ, Press Releases, Equity Research, Online Publications and Industry Research. Note: EV = Enterprise Value (Equity Value + Debt + Minority Interest – Cash and Cash Equivalents) and NTM = Next Twelve Months.
11
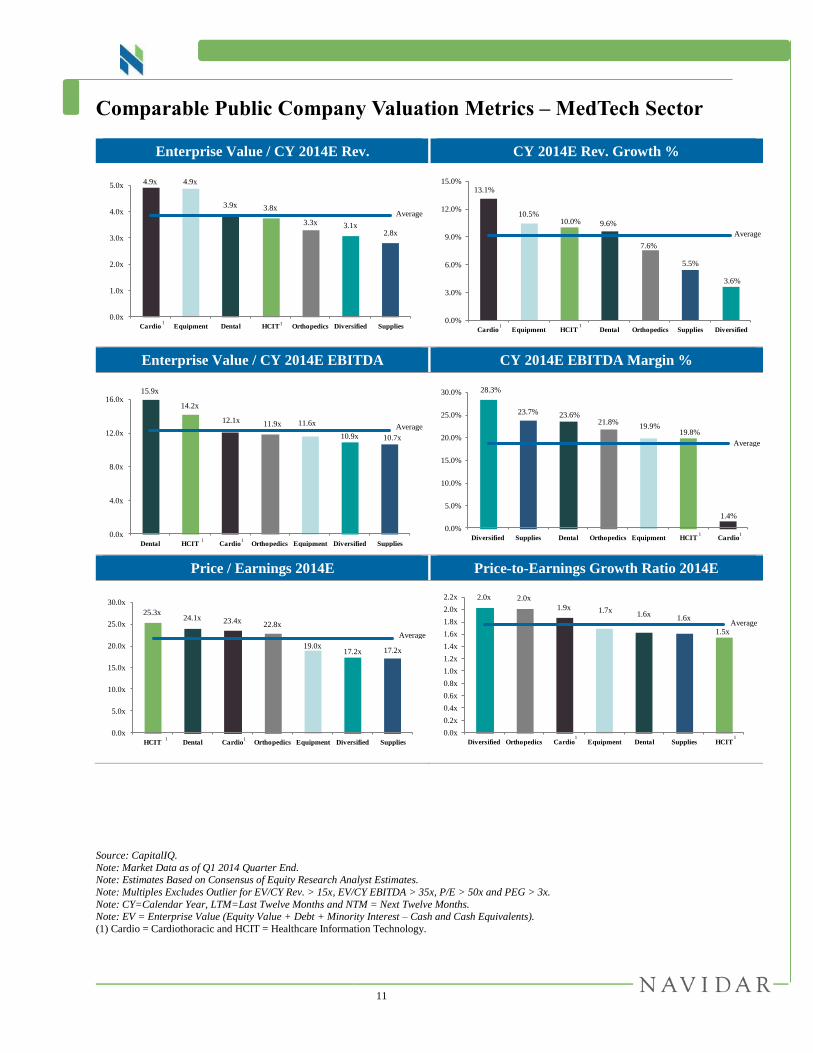
Comparable Public Company Valuation Metrics – MedTech Sector
Enterprise Value / CY 2014E Rev. CY 2014E Rev. Growth %
Enterprise Value / CY 2014E EBITDA CY 2014E EBITDA Margin %
Price / Earnings 2014E Price-to-Earnings Growth Ratio 2014E
Source: CapitalIQ.
Note: Market Data as of Q1 2014 Quarter End. Note: Estimates Based on Consensus of Equity Research Analyst Estimates.
Note: Multiples Excludes Outlier for EV/CY Rev. > 15x, EV/CY EBITDA > 35x, P/E > 50x and PEG > 3x.
Note: CY=Calendar Year, LTM=Last Twelve Months and NTM = Next Twelve Months. Note: EV = Enterprise Value (Equity Value + Debt + Minority Interest – Cash and Cash Equivalents).
(1) Cardio = Cardiothoracic and HCIT = Healthcare Information Technology.
4.9x 4.9x
3.9x 3.8x
3.3x 3.1x2.8x
0.0x
1.0x
2.0x
3.0x
4.0x
5.0x
Cardio Equipment Dental HCIT Orthopedics Diversified Supplies11
13.1%
10.5%10.0% 9.6%
7.6%
5.5%
3.6%
0.0%
3.0%
6.0%
9.0%
12.0%
15.0%
Cardio Equipment HCIT Dental Orthopedics Supplies Diversified1 1
15.9x
14.2x
12.1x 11.9x 11.6x
10.9x 10.7x
0.0x
4.0x
8.0x
12.0x
16.0x
Dental HCIT Cardio Orthopedics Equipment Diversified Supplies1 1
28.3%
23.7% 23.6%21.8%
19.9%19.8%
1.4%
0.0%
5.0%
10.0%
15.0%
20.0%
25.0%
30.0%
Diversified Supplies Dental Orthopedics Equipment HCIT Cardio11
25.3x24.1x 23.4x
22.8x
19.0x17.2x 17.2x
0.0x
5.0x
10.0x
15.0x
20.0x
25.0x
30.0x
HCIT Dental Cardio Orthopedics Equipment Diversified Supplies1 1
2.0x 2.0x
1.9x 1.7x1.6x
1.6x
1.5x
0.0x
0.2x
0.4x
0.6x
0.8x
1.0x
1.2x
1.4x
1.6x
1.8x
2.0x
2.2x
Diversified Orthopedics Cardio Equipment Dental Supplies HCIT11
Average
Average
Average
Average
Average
Average
12
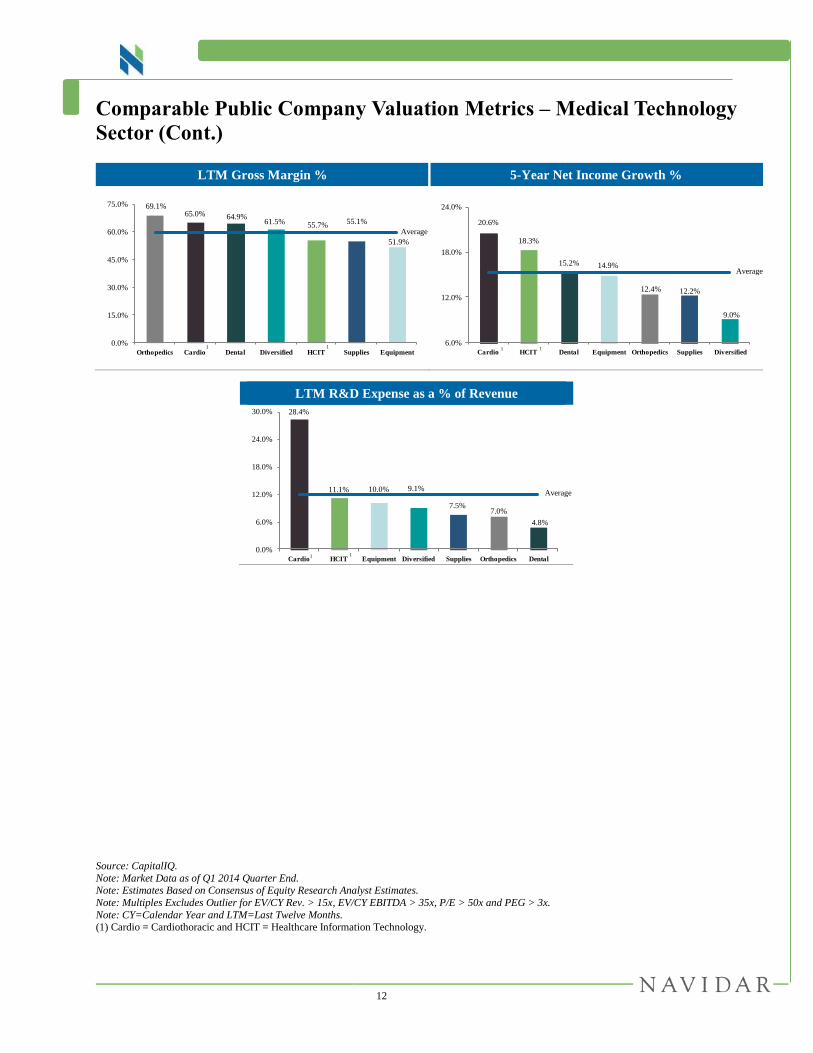
Comparable Public Company Valuation Metrics – Medical Technology
Sector (Cont.)
LTM Gross Margin % 5-Year Net Income Growth %
Source: CapitalIQ.
Note: Market Data as of Q1 2014 Quarter End. Note: Estimates Based on Consensus of Equity Research Analyst Estimates.
Note: Multiples Excludes Outlier for EV/CY Rev. > 15x, EV/CY EBITDA > 35x, P/E > 50x and PEG > 3x.
Note: CY=Calendar Year and LTM=Last Twelve Months. (1) Cardio = Cardiothoracic and HCIT = Healthcare Information Technology.
69.1%65.0% 64.9%
61.5% 55.7%55.1%
51.9%
0.0%
15.0%
30.0%
45.0%
60.0%
75.0%
Orthopedics Cardio Dental Diversified HCIT Supplies Equipment1 1
20.6%
18.3%
15.2% 14.9%
12.4% 12.2%
9.0%
6.0%
12.0%
18.0%
24.0%
Cardio HCIT Dental Equipment Orthopedics Supplies Diversified1 1
LTM R&D Expense as a % of Revenue
28.4%
11.1% 10.0% 9.1%
7.5%7.0%
4.8%
0.0%
6.0%
12.0%
18.0%
24.0%
30.0%
Cardio HCIT Equipment Diversified Supplies Orthopedics Dental1 1
Average
Average
Average
13
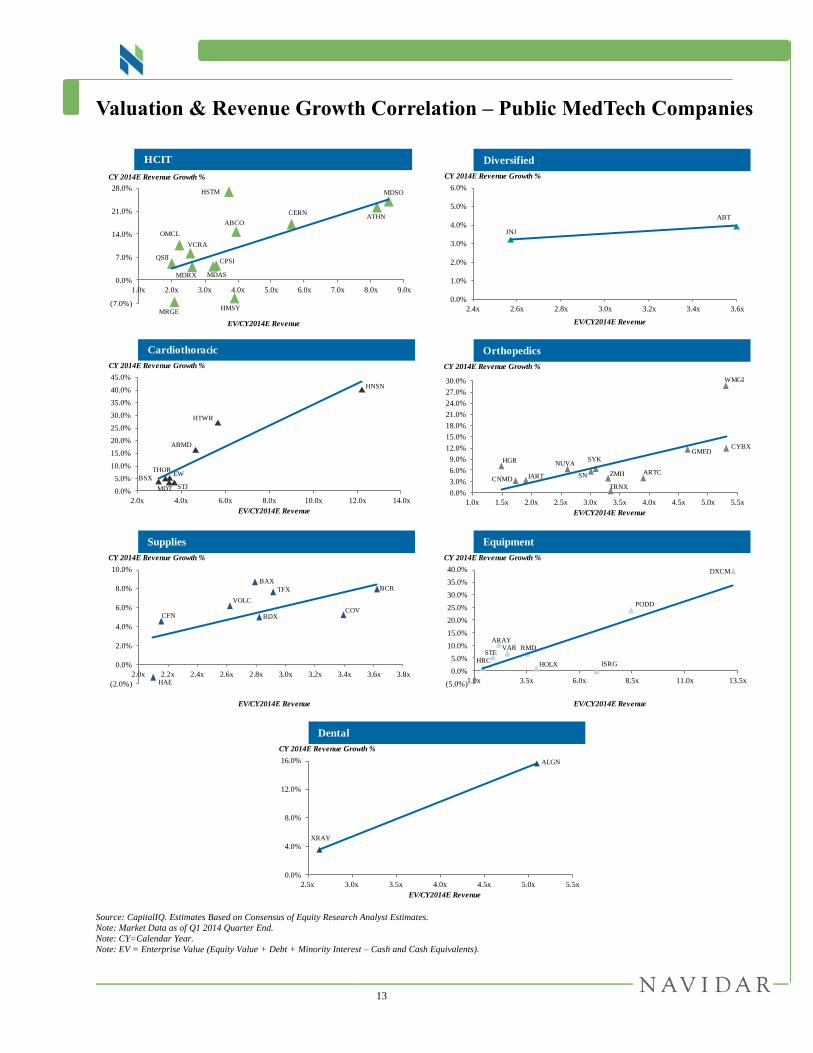
Valuation & Revenue Growth Correlation – Public MedTech Companies
Source: CapitalIQ. Estimates Based on Consensus of Equity Research Analyst Estimates.
Note: Market Data as of Q1 2014 Quarter End.
Note: CY=Calendar Year.
Note: EV = Enterprise Value (Equity Value + Debt + Minority Interest – Cash and Cash Equivalents).
QSII
MRGE
OMCL
VCRA
MDRX MDAS
CPSI
HSTM
HMSY
ABCO
CERNATHN
MDSO
(7.0%)
0.0%
7.0%
14.0%
21.0%
28.0%
1.0x 2.0x 3.0x 4.0x 5.0x 6.0x 7.0x 8.0x 9.0x
CY 2014E Revenue Growth %
EV/CY2014E Revenue
HCIT
JNJ
ABT
0.0%
1.0%
2.0%
3.0%
4.0%
5.0%
6.0%
2.4x 2.6x 2.8x 3.0x 3.2x 3.4x 3.6x
CY 2014E Revenue Growth %
EV/CY2014E Revenue
Diversified
BSX
THOREW
MDT STJ
ABMD
HNSN
HTWR
0.0%
5.0%
10.0%
15.0%
20.0%
25.0%
30.0%
35.0%
40.0%
45.0%
2.0x 4.0x 6.0x 8.0x 10.0x 12.0x 14.0x
CY 2014E Revenue Growth %
EV/CY2014E Revenue
Cardiothoracic
HGR
CNMD IART
NUVA
ARTC
SYK
SN
TRNX
ZMH
GMED
WMGI
CYBX
0.0%
3.0%
6.0%
9.0%
12.0%
15.0%
18.0%
21.0%
24.0%
27.0%
30.0%
1.0x 1.5x 2.0x 2.5x 3.0x 3.5x 4.0x 4.5x 5.0x 5.5x
CY 2014E Revenue Growth %
EV/CY2014E Revenue
Orthopedics
CFN
HAE
TFX
BDX
BAX
VOLC
COV
BCR
(2.0%)
0.0%
2.0%
4.0%
6.0%
8.0%
10.0%
2.0x 2.2x 2.4x 2.6x 2.8x 3.0x 3.2x 3.4x 3.6x 3.8x
CY 2014E Revenue Growth %
EV/CY2014E Revenue
Supplies
HRC
STE
ARAYVAR RMD
HOLX ISRG
PODD
DXCM
(5.0%)
0.0%
5.0%
10.0%
15.0%
20.0%
25.0%
30.0%
35.0%
40.0%
1.0x 3.5x 6.0x 8.5x 11.0x 13.5x
CY 2014E Revenue Growth %
EV/CY2014E Revenue
Equipment
XRAY
ALGN
0.0%
4.0%
8.0%
12.0%
16.0%
2.5x 3.0x 3.5x 4.0x 4.5x 5.0x 5.5x
CY 2014E Revenue Growth %
EV/CY2014E Revenue
Dental
14
Appendix
15
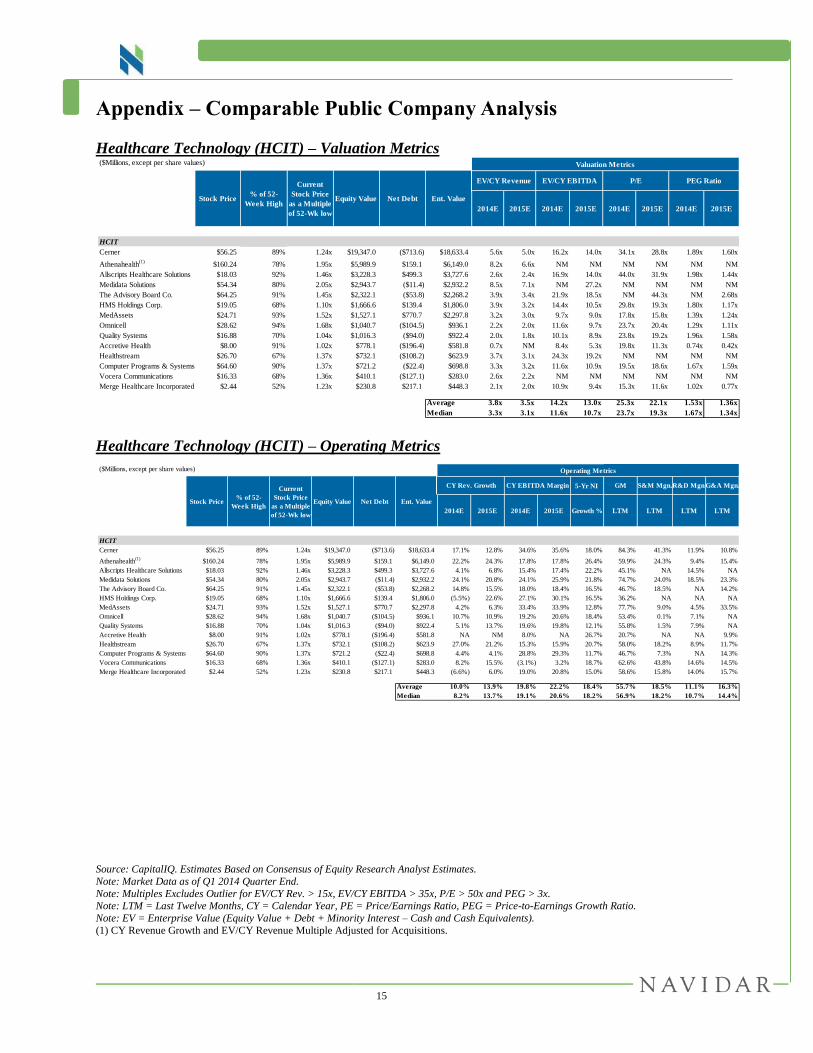
Appendix – Comparable Public Company Analysis
Healthcare Technology (HCIT) – Valuation Metrics
Healthcare Technology (HCIT) – Operating Metrics
Source: CapitalIQ. Estimates Based on Consensus of Equity Research Analyst Estimates.
Note: Market Data as of Q1 2014 Quarter End.
Note: Multiples Excludes Outlier for EV/CY Rev. > 15x, EV/CY EBITDA > 35x, P/E > 50x and PEG > 3x. Note: LTM = Last Twelve Months, CY = Calendar Year, PE = Price/Earnings Ratio, PEG = Price-to-Earnings Growth Ratio.
Note: EV = Enterprise Value (Equity Value + Debt + Minority Interest – Cash and Cash Equivalents).
(1) CY Revenue Growth and EV/CY Revenue Multiple Adjusted for Acquisitions.
($Millions, except per share values) Valuation Metrics Operating Metrics
2014E 2015E 2014E 2015E 2014E 2015E 2014E 2015E
HCIT
Cerner $56.25 89% 1.24x $19,347.0 ($713.6) $18,633.4 5.6x 5.0x 16.2x 14.0x 34.1x 28.8x 1.89x 1.60x
Athenahealth(1)
$160.24 78% 1.95x $5,989.9 $159.1 $6,149.0 8.2x 6.6x NM NM NM NM NM NM
Allscripts Healthcare Solutions $18.03 92% 1.46x $3,228.3 $499.3 $3,727.6 2.6x 2.4x 16.9x 14.0x 44.0x 31.9x 1.98x 1.44x
Medidata Solutions $54.34 80% 2.05x $2,943.7 ($11.4) $2,932.2 8.5x 7.1x NM 27.2x NM NM NM NM
The Advisory Board Co. $64.25 91% 1.45x $2,322.1 ($53.8) $2,268.2 3.9x 3.4x 21.9x 18.5x NM 44.3x NM 2.68x
HMS Holdings Corp. $19.05 68% 1.10x $1,666.6 $139.4 $1,806.0 3.9x 3.2x 14.4x 10.5x 29.8x 19.3x 1.80x 1.17x
MedAssets $24.71 93% 1.52x $1,527.1 $770.7 $2,297.8 3.2x 3.0x 9.7x 9.0x 17.8x 15.8x 1.39x 1.24x
Omnicell $28.62 94% 1.68x $1,040.7 ($104.5) $936.1 2.2x 2.0x 11.6x 9.7x 23.7x 20.4x 1.29x 1.11x
Quality Systems $16.88 70% 1.04x $1,016.3 ($94.0) $922.4 2.0x 1.8x 10.1x 8.9x 23.8x 19.2x 1.96x 1.58x
Accretive Health $8.00 91% 1.02x $778.1 ($196.4) $581.8 0.7x NM 8.4x 5.3x 19.8x 11.3x 0.74x 0.42x
Healthstream $26.70 67% 1.37x $732.1 ($108.2) $623.9 3.7x 3.1x 24.3x 19.2x NM NM NM NM
Computer Programs & Systems $64.60 90% 1.37x $721.2 ($22.4) $698.8 3.3x 3.2x 11.6x 10.9x 19.5x 18.6x 1.67x 1.59x
Vocera Communications $16.33 68% 1.36x $410.1 ($127.1) $283.0 2.6x 2.2x NM NM NM NM NM NM
Merge Healthcare Incorporated $2.44 52% 1.23x $230.8 $217.1 $448.3 2.1x 2.0x 10.9x 9.4x 15.3x 11.6x 1.02x 0.77x
Average 3.8x 3.5x 14.2x 13.0x 25.3x 22.1x 1.53x 1.36x
Median 3.3x 3.1x 11.6x 10.7x 23.7x 19.3x 1.67x 1.34x
Stock Price% of 52-
Week High
Current
Stock Price
as a Multiple
of 52-Wk low
Equity Value Net Debt Ent. Value
EV/CY Revenue EV/CY EBITDA P/E PEG Ratio
($Millions, except per share values) Operating Metrics
5-Yr NI
2014E 2015E 2014E 2015E Growth % LTM LTM LTM LTM
HCIT
Cerner $56.25 89% 1.24x $19,347.0 ($713.6) $18,633.4 17.1% 12.8% 34.6% 35.6% 18.0% 84.3% 41.3% 11.9% 10.8%
Athenahealth(1)
$160.24 78% 1.95x $5,989.9 $159.1 $6,149.0 22.2% 24.3% 17.8% 17.8% 26.4% 59.9% 24.3% 9.4% 15.4%
Allscripts Healthcare Solutions $18.03 92% 1.46x $3,228.3 $499.3 $3,727.6 4.1% 6.8% 15.4% 17.4% 22.2% 45.1% NA 14.5% NA
Medidata Solutions $54.34 80% 2.05x $2,943.7 ($11.4) $2,932.2 24.1% 20.8% 24.1% 25.9% 21.8% 74.7% 24.0% 18.5% 23.3%
The Advisory Board Co. $64.25 91% 1.45x $2,322.1 ($53.8) $2,268.2 14.8% 15.5% 18.0% 18.4% 16.5% 46.7% 18.5% NA 14.2%
HMS Holdings Corp. $19.05 68% 1.10x $1,666.6 $139.4 $1,806.0 (5.5%) 22.6% 27.1% 30.1% 16.5% 36.2% NA NA NA
MedAssets $24.71 93% 1.52x $1,527.1 $770.7 $2,297.8 4.2% 6.3% 33.4% 33.9% 12.8% 77.7% 9.0% 4.5% 33.5%
Omnicell $28.62 94% 1.68x $1,040.7 ($104.5) $936.1 10.7% 10.9% 19.2% 20.6% 18.4% 53.4% 0.1% 7.1% NA
Quality Systems $16.88 70% 1.04x $1,016.3 ($94.0) $922.4 5.1% 13.7% 19.6% 19.8% 12.1% 55.8% 1.5% 7.9% NA
Accretive Health $8.00 91% 1.02x $778.1 ($196.4) $581.8 NA NM 8.0% NA 26.7% 20.7% NA NA 9.9%
Healthstream $26.70 67% 1.37x $732.1 ($108.2) $623.9 27.0% 21.2% 15.3% 15.9% 20.7% 58.0% 18.2% 8.9% 11.7%
Computer Programs & Systems $64.60 90% 1.37x $721.2 ($22.4) $698.8 4.4% 4.1% 28.8% 29.3% 11.7% 46.7% 7.3% NA 14.3%
Vocera Communications $16.33 68% 1.36x $410.1 ($127.1) $283.0 8.2% 15.5% (3.1%) 3.2% 18.7% 62.6% 43.8% 14.6% 14.5%
Merge Healthcare Incorporated $2.44 52% 1.23x $230.8 $217.1 $448.3 (6.6%) 6.0% 19.0% 20.8% 15.0% 58.6% 15.8% 14.0% 15.7%
Average 10.0% 13.9% 19.8% 22.2% 18.4% 55.7% 18.5% 11.1% 16.3%
Median 8.2% 13.7% 19.1% 20.6% 18.2% 56.9% 18.2% 10.7% 14.4%
GM S&M Mgn.R&D Mgn.G&A Mgn.CY Rev. Growth CY EBITDA Margin
Stock Price% of 52-
Week High
Current
Stock Price
as a Multiple
of 52-Wk low
Equity Value Net Debt Ent. Value
16
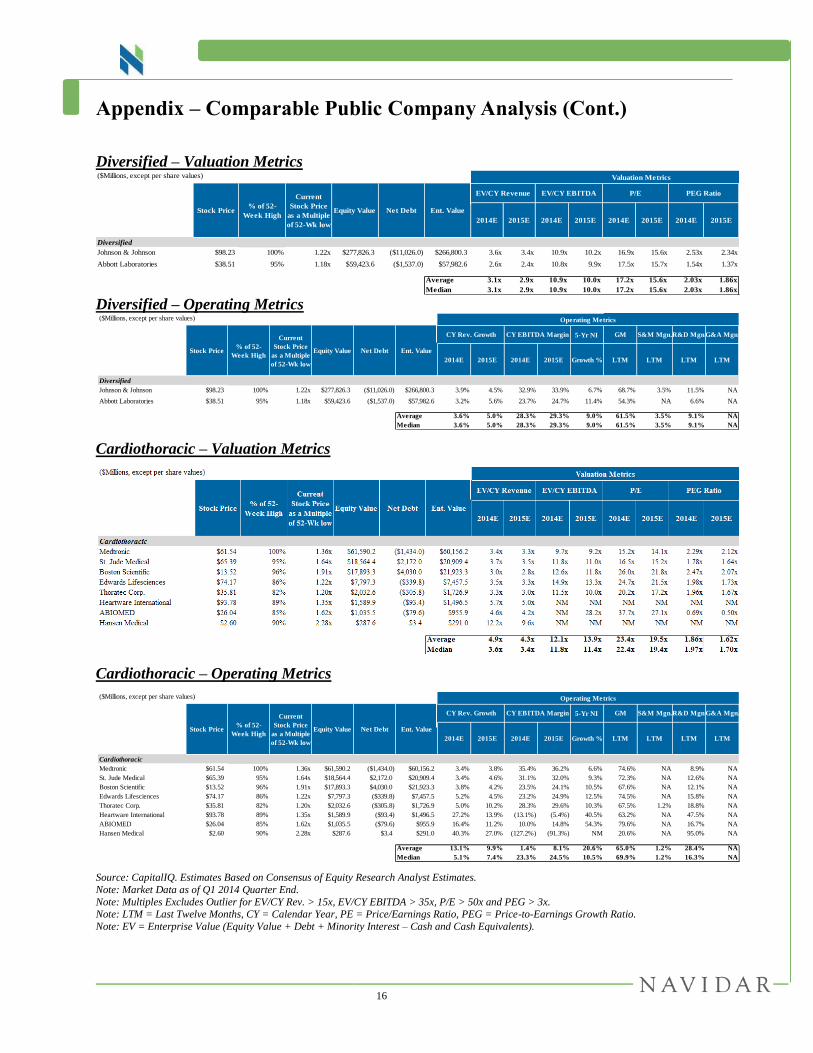
Appendix – Comparable Public Company Analysis (Cont.)
Diversified – Valuation Metrics
Diversified – Operating Metrics
Cardiothoracic – Valuation Metrics
Cardiothoracic – Operating Metrics
Source: CapitalIQ. Estimates Based on Consensus of Equity Research Analyst Estimates.
Note: Market Data as of Q1 2014 Quarter End.
Note: Multiples Excludes Outlier for EV/CY Rev. > 15x, EV/CY EBITDA > 35x, P/E > 50x and PEG > 3x. Note: LTM = Last Twelve Months, CY = Calendar Year, PE = Price/Earnings Ratio, PEG = Price-to-Earnings Growth Ratio.
Note: EV = Enterprise Value (Equity Value + Debt + Minority Interest – Cash and Cash Equivalents).
($Millions, except per share values) Valuation Metrics
2014E 2015E 2014E 2015E 2014E 2015E 2014E 2015E
Diversified
Johnson & Johnson $98.23 100% 1.22x $277,826.3 ($11,026.0) $266,800.3 3.6x 3.4x 10.9x 10.2x 16.9x 15.6x 2.53x 2.34x
Abbott Laboratories $38.51 95% 1.18x $59,423.6 ($1,537.0) $57,982.6 2.6x 2.4x 10.8x 9.9x 17.5x 15.7x 1.54x 1.37x
Average 3.1x 2.9x 10.9x 10.0x 17.2x 15.6x 2.03x 1.86x
Median 3.1x 2.9x 10.9x 10.0x 17.2x 15.6x 2.03x 1.86x
Stock Price% of 52-
Week High
Current
Stock Price
as a Multiple
of 52-Wk low
Equity Value Net Debt Ent. Value
EV/CY Revenue EV/CY EBITDA P/E PEG Ratio
($Millions, except per share values) Operating Metrics
5-Yr NI
2014E 2015E 2014E 2015E Growth % LTM LTM LTM LTM
Diversified
Johnson & Johnson $98.23 100% 1.22x $277,826.3 ($11,026.0) $266,800.3 3.9% 4.5% 32.9% 33.9% 6.7% 68.7% 3.5% 11.5% NA
Abbott Laboratories $38.51 95% 1.18x $59,423.6 ($1,537.0) $57,982.6 3.2% 5.6% 23.7% 24.7% 11.4% 54.3% NA 6.6% NA
Average 3.6% 5.0% 28.3% 29.3% 9.0% 61.5% 3.5% 9.1% NA
Median 3.6% 5.0% 28.3% 29.3% 9.0% 61.5% 3.5% 9.1% NA
GM S&M Mgn.R&D Mgn.G&A Mgn.CY Rev. Growth CY EBITDA Margin
Stock Price% of 52-
Week High
Current
Stock Price
as a Multiple
of 52-Wk low
Equity Value Net Debt Ent. Value
($Millions, except per share values) Operating Metrics
5-Yr NI
2014E 2015E 2014E 2015E Growth % LTM LTM LTM LTM
Cardiothoracic
Medtronic $61.54 100% 1.36x $61,590.2 ($1,434.0) $60,156.2 3.4% 3.8% 35.4% 36.2% 6.6% 74.6% NA 8.9% NA
St. Jude Medical $65.39 95% 1.64x $18,564.4 $2,172.0 $20,909.4 3.4% 4.6% 31.1% 32.0% 9.3% 72.3% NA 12.6% NA
Boston Scientific $13.52 96% 1.91x $17,893.3 $4,030.0 $21,923.3 3.8% 4.2% 23.5% 24.1% 10.5% 67.6% NA 12.1% NA
Edwards Lifesciences $74.17 86% 1.22x $7,797.3 ($339.8) $7,457.5 5.2% 4.5% 23.2% 24.9% 12.5% 74.5% NA 15.8% NA
Thoratec Corp. $35.81 82% 1.20x $2,032.6 ($305.8) $1,726.9 5.0% 10.2% 28.3% 29.6% 10.3% 67.5% 1.2% 18.8% NA
Heartware International $93.78 89% 1.35x $1,589.9 ($93.4) $1,496.5 27.2% 13.9% (13.1%) (5.4%) 40.5% 63.2% NA 47.5% NA
ABIOMED $26.04 85% 1.62x $1,035.5 ($79.6) $955.9 16.4% 11.2% 10.0% 14.8% 54.3% 79.6% NA 16.7% NA
Hansen Medical $2.60 90% 2.28x $287.6 $3.4 $291.0 40.3% 27.0% (127.2%) (91.3%) NM 20.6% NA 95.0% NA
Average 13.1% 9.9% 1.4% 8.1% 20.6% 65.0% 1.2% 28.4% NA
Median 5.1% 7.4% 23.3% 24.5% 10.5% 69.9% 1.2% 16.3% NA
GM S&M Mgn.R&D Mgn.G&A Mgn.CY Rev. Growth CY EBITDA Margin
Stock Price% of 52-
Week High
Current
Stock Price
as a Multiple
of 52-Wk low
Equity Value Net Debt Ent. Value
17
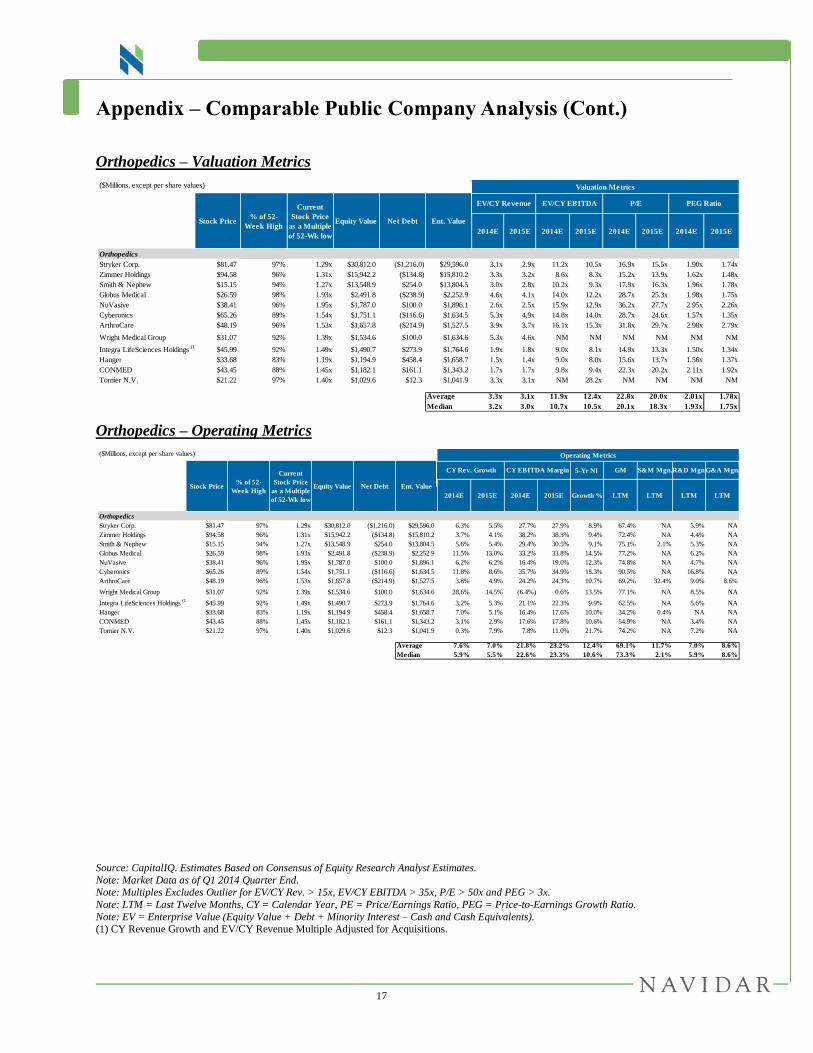
Appendix – Comparable Public Company Analysis (Cont.)
Orthopedics – Valuation Metrics
Orthopedics – Operating Metrics
Source: CapitalIQ. Estimates Based on Consensus of Equity Research Analyst Estimates.
Note: Market Data as of Q1 2014 Quarter End. Note: Multiples Excludes Outlier for EV/CY Rev. > 15x, EV/CY EBITDA > 35x, P/E > 50x and PEG > 3x.
Note: LTM = Last Twelve Months, CY = Calendar Year, PE = Price/Earnings Ratio, PEG = Price-to-Earnings Growth Ratio.
Note: EV = Enterprise Value (Equity Value + Debt + Minority Interest – Cash and Cash Equivalents). (1) CY Revenue Growth and EV/CY Revenue Multiple Adjusted for Acquisitions.
($Millions, except per share values) Valuation Metrics Operating Metrics
2014E 2015E 2014E 2015E 2014E 2015E 2014E 2015E
Orthopedics
Stryker Corp. $81.47 97% 1.29x $30,812.0 ($1,216.0) $29,596.0 3.1x 2.9x 11.2x 10.5x 16.9x 15.5x 1.90x 1.74x
Zimmer Holdings $94.58 96% 1.31x $15,942.2 ($134.8) $15,810.2 3.3x 3.2x 8.6x 8.3x 15.2x 13.9x 1.62x 1.48x
Smith & Nephew $15.15 94% 1.27x $13,548.9 $254.0 $13,804.5 3.0x 2.8x 10.2x 9.3x 17.9x 16.3x 1.96x 1.78x
Globus Medical $26.59 98% 1.93x $2,491.8 ($238.9) $2,252.9 4.6x 4.1x 14.0x 12.2x 28.7x 25.3x 1.98x 1.75x
NuVasive $38.41 96% 1.95x $1,787.0 $100.0 $1,896.1 2.6x 2.5x 15.9x 12.9x 36.2x 27.7x 2.95x 2.26x
Cyberonics $65.26 89% 1.54x $1,751.1 ($116.6) $1,634.5 5.3x 4.9x 14.8x 14.0x 28.7x 24.6x 1.57x 1.35x
ArthroCare $48.19 96% 1.53x $1,657.8 ($214.9) $1,527.5 3.9x 3.7x 16.1x 15.3x 31.8x 29.7x 2.98x 2.79x
Wright Medical Group $31.07 92% 1.39x $1,534.6 $100.0 $1,634.6 5.3x 4.6x NM NM NM NM NM NM
Integra LifeSciences Holdings (1)
$45.99 92% 1.49x $1,490.7 $273.9 $1,764.6 1.9x 1.8x 9.0x 8.1x 14.9x 13.3x 1.50x 1.34x
Hanger $33.68 83% 1.19x $1,194.9 $458.4 $1,658.7 1.5x 1.4x 9.0x 8.0x 15.6x 13.7x 1.56x 1.37x
CONMED $43.45 88% 1.45x $1,182.1 $161.1 $1,343.2 1.7x 1.7x 9.8x 9.4x 22.3x 20.2x 2.11x 1.92x
Tornier N.V. $21.22 97% 1.40x $1,029.6 $12.3 $1,041.9 3.3x 3.1x NM 28.2x NM NM NM NM
Average 3.3x 3.1x 11.9x 12.4x 22.8x 20.0x 2.01x 1.78x
Median 3.2x 3.0x 10.7x 10.5x 20.1x 18.3x 1.93x 1.75x
Stock Price% of 52-
Week High
Current
Stock Price
as a Multiple
of 52-Wk low
Equity Value Net Debt Ent. Value
EV/CY Revenue EV/CY EBITDA P/E PEG Ratio
($Millions, except per share values) Operating Metrics
5-Yr NI
2014E 2015E 2014E 2015E Growth % LTM LTM LTM LTM
Orthopedics
Stryker Corp. $81.47 97% 1.29x $30,812.0 ($1,216.0) $29,596.0 6.3% 5.5% 27.7% 27.9% 8.9% 67.4% NA 5.9% NA
Zimmer Holdings $94.58 96% 1.31x $15,942.2 ($134.8) $15,810.2 3.7% 4.1% 38.2% 38.3% 9.4% 72.4% NA 4.4% NA
Smith & Nephew $15.15 94% 1.27x $13,548.9 $254.0 $13,804.5 5.6% 5.4% 29.4% 30.5% 9.1% 75.1% 2.1% 5.3% NA
Globus Medical $26.59 98% 1.93x $2,491.8 ($238.9) $2,252.9 11.5% 13.0% 33.2% 33.8% 14.5% 77.2% NA 6.2% NA
NuVasive $38.41 96% 1.95x $1,787.0 $100.0 $1,896.1 6.2% 6.2% 16.4% 19.0% 12.3% 74.8% NA 4.7% NA
Cyberonics $65.26 89% 1.54x $1,751.1 ($116.6) $1,634.5 11.8% 8.6% 35.7% 34.9% 18.3% 90.5% NA 16.8% NA
ArthroCare $48.19 96% 1.53x $1,657.8 ($214.9) $1,527.5 3.8% 4.9% 24.2% 24.3% 10.7% 69.2% 32.4% 9.0% 8.6%
Wright Medical Group $31.07 92% 1.39x $1,534.6 $100.0 $1,634.6 28.6% 14.5% (6.4%) 0.6% 13.5% 77.1% NA 8.5% NA
Integra LifeSciences Holdings (1)
$45.99 92% 1.49x $1,490.7 $273.9 $1,764.6 3.2% 5.3% 21.1% 22.3% 9.9% 62.5% NA 5.6% NA
Hanger $33.68 83% 1.19x $1,194.9 $458.4 $1,658.7 7.0% 5.1% 16.4% 17.6% 10.0% 34.2% 0.4% NA NA
CONMED $43.45 88% 1.45x $1,182.1 $161.1 $1,343.2 3.1% 2.9% 17.6% 17.8% 10.6% 54.9% NA 3.4% NA
Tornier N.V. $21.22 97% 1.40x $1,029.6 $12.3 $1,041.9 0.3% 7.9% 7.8% 11.0% 21.7% 74.2% NA 7.2% NA
Average 7.6% 7.0% 21.8% 23.2% 12.4% 69.1% 11.7% 7.0% 8.6%
Median 5.9% 5.5% 22.6% 23.3% 10.6% 73.3% 2.1% 5.9% 8.6%
GM S&M Mgn.R&D Mgn.G&A Mgn.CY Rev. Growth CY EBITDA Margin
Stock Price% of 52-
Week High
Current
Stock Price
as a Multiple
of 52-Wk low
Equity Value Net Debt Ent. Value
18
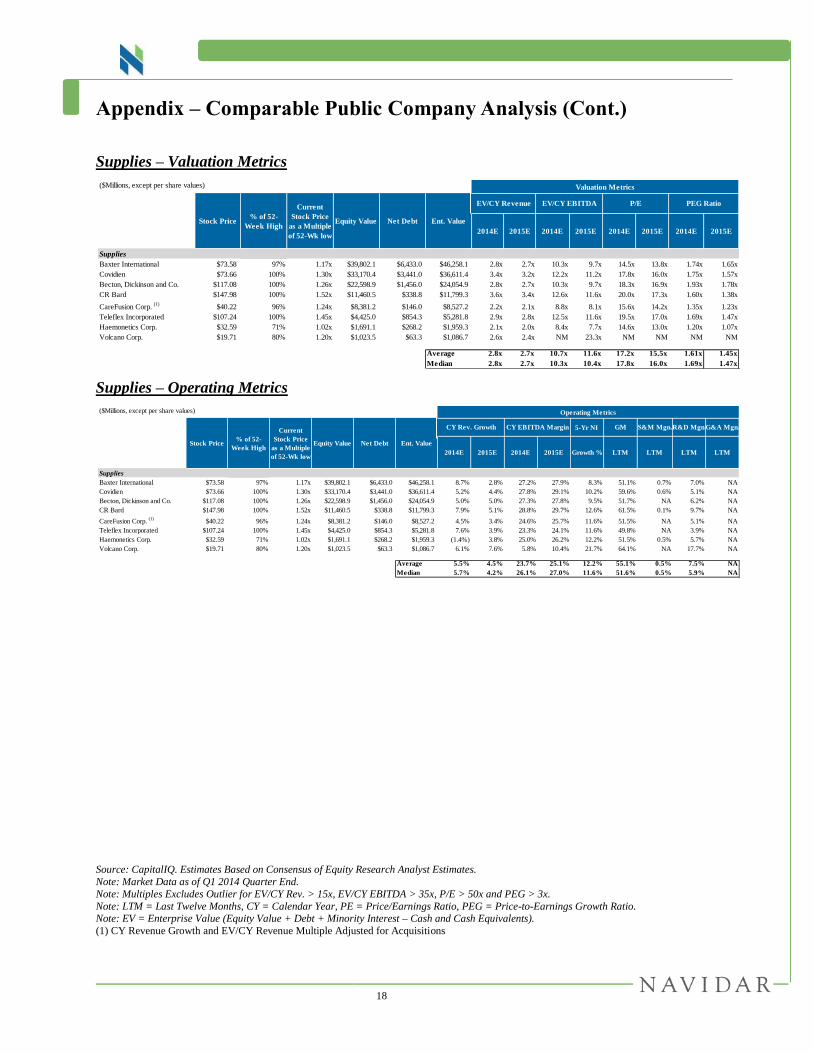
Appendix – Comparable Public Company Analysis (Cont.)
Supplies – Valuation Metrics
Supplies – Operating Metrics
Source: CapitalIQ. Estimates Based on Consensus of Equity Research Analyst Estimates.
Note: Market Data as of Q1 2014 Quarter End.
Note: Multiples Excludes Outlier for EV/CY Rev. > 15x, EV/CY EBITDA > 35x, P/E > 50x and PEG > 3x.
Note: LTM = Last Twelve Months, CY = Calendar Year, PE = Price/Earnings Ratio, PEG = Price-to-Earnings Growth Ratio. Note: EV = Enterprise Value (Equity Value + Debt + Minority Interest – Cash and Cash Equivalents).
(1) CY Revenue Growth and EV/CY Revenue Multiple Adjusted for Acquisitions
($Millions, except per share values) Valuation Metrics Operating Metrics
2014E 2015E 2014E 2015E 2014E 2015E 2014E 2015E
Supplies
Baxter International $73.58 97% 1.17x $39,802.1 $6,433.0 $46,258.1 2.8x 2.7x 10.3x 9.7x 14.5x 13.8x 1.74x 1.65x
Covidien $73.66 100% 1.30x $33,170.4 $3,441.0 $36,611.4 3.4x 3.2x 12.2x 11.2x 17.8x 16.0x 1.75x 1.57x
Becton, Dickinson and Co. $117.08 100% 1.26x $22,598.9 $1,456.0 $24,054.9 2.8x 2.7x 10.3x 9.7x 18.3x 16.9x 1.93x 1.78x
CR Bard $147.98 100% 1.52x $11,460.5 $338.8 $11,799.3 3.6x 3.4x 12.6x 11.6x 20.0x 17.3x 1.60x 1.38x
CareFusion Corp. (1)
$40.22 96% 1.24x $8,381.2 $146.0 $8,527.2 2.2x 2.1x 8.8x 8.1x 15.6x 14.2x 1.35x 1.23x
Teleflex Incorporated $107.24 100% 1.45x $4,425.0 $854.3 $5,281.8 2.9x 2.8x 12.5x 11.6x 19.5x 17.0x 1.69x 1.47x
Haemonetics Corp. $32.59 71% 1.02x $1,691.1 $268.2 $1,959.3 2.1x 2.0x 8.4x 7.7x 14.6x 13.0x 1.20x 1.07x
Volcano Corp. $19.71 80% 1.20x $1,023.5 $63.3 $1,086.7 2.6x 2.4x NM 23.3x NM NM NM NM
Average 2.8x 2.7x 10.7x 11.6x 17.2x 15.5x 1.61x 1.45x
Median 2.8x 2.7x 10.3x 10.4x 17.8x 16.0x 1.69x 1.47x
Stock Price% of 52-
Week High
Current
Stock Price
as a Multiple
of 52-Wk low
Equity Value Net Debt Ent. Value
EV/CY Revenue EV/CY EBITDA P/E PEG Ratio
($Millions, except per share values) Operating Metrics
5-Yr NI
2014E 2015E 2014E 2015E Growth % LTM LTM LTM LTM
Supplies
Baxter International $73.58 97% 1.17x $39,802.1 $6,433.0 $46,258.1 8.7% 2.8% 27.2% 27.9% 8.3% 51.1% 0.7% 7.0% NA
Covidien $73.66 100% 1.30x $33,170.4 $3,441.0 $36,611.4 5.2% 4.4% 27.8% 29.1% 10.2% 59.6% 0.6% 5.1% NA
Becton, Dickinson and Co. $117.08 100% 1.26x $22,598.9 $1,456.0 $24,054.9 5.0% 5.0% 27.3% 27.8% 9.5% 51.7% NA 6.2% NA
CR Bard $147.98 100% 1.52x $11,460.5 $338.8 $11,799.3 7.9% 5.1% 28.8% 29.7% 12.6% 61.5% 0.1% 9.7% NA
CareFusion Corp. (1)
$40.22 96% 1.24x $8,381.2 $146.0 $8,527.2 4.5% 3.4% 24.6% 25.7% 11.6% 51.5% NA 5.1% NA
Teleflex Incorporated $107.24 100% 1.45x $4,425.0 $854.3 $5,281.8 7.6% 3.9% 23.3% 24.1% 11.6% 49.8% NA 3.9% NA
Haemonetics Corp. $32.59 71% 1.02x $1,691.1 $268.2 $1,959.3 (1.4%) 3.8% 25.0% 26.2% 12.2% 51.5% 0.5% 5.7% NA
Volcano Corp. $19.71 80% 1.20x $1,023.5 $63.3 $1,086.7 6.1% 7.6% 5.8% 10.4% 21.7% 64.1% NA 17.7% NA
Average 5.5% 4.5% 23.7% 25.1% 12.2% 55.1% 0.5% 7.5% NA
Median 5.7% 4.2% 26.1% 27.0% 11.6% 51.6% 0.5% 5.9% NA
GM S&M Mgn.R&D Mgn.G&A Mgn.CY Rev. Growth CY EBITDA Margin
Stock Price% of 52-
Week High
Current
Stock Price
as a Multiple
of 52-Wk low
Equity Value Net Debt Ent. Value

19
Appendix – Comparable Public Company Analysis (Cont.)
Equipment – Valuation Metrics
Equipment – Operating Metrics
Dental – Valuation Metrics
Dental – Operating Metrics
Source: CapitalIQ. Estimates Based on Consensus of Equity Research Analyst Estimates.
Note: Market Data as of Q1 2014 Quarter End. Note: Multiples Excludes Outlier for EV/CY Rev. > 15x, EV/CY EBITDA > 35x, P/E > 50x and PEG > 3x.
Note: LTM = Last Twelve Months, CY = Calendar Year, PE = Price/Earnings Ratio, PEG = Price-to-Earnings Growth Ratio.
Note: EV = Enterprise Value (Equity Value + Debt + Minority Interest – Cash and Cash Equivalents).
($Millions, except per share values) Valuation Metrics Operating Metrics
2014E 2015E 2014E 2015E 2014E 2015E 2014E 2015E
Equipment
Intuitive Surgical $437.99 85% 1.25x $16,790.3 ($1,403.5) $15,386.8 6.8x 6.2x 19.0x 17.1x 29.3x 25.2x NM 2.70x
Varian Medical Systems $83.99 98% 1.33x $8,697.4 ($563.9) $8,133.5 2.6x 2.4x 11.3x 10.5x 18.9x 17.1x 1.73x 1.57x
ResMed $44.69 78% 1.08x $6,330.8 ($536.9) $5,793.9 3.5x 3.1x 10.7x 9.1x 17.2x 15.5x 1.34x 1.20x
Hologic $21.50 93% 1.16x $5,899.4 $3,859.3 $9,758.6 3.9x 3.8x 11.4x 10.7x 15.6x 13.8x 2.05x 1.81x
DexCom $41.36 83% 2.75x $3,011.4 ($47.8) $2,963.6 13.3x 9.9x NM NM NM NM NM NM
Steris Corp. $47.75 96% 1.23x $2,813.9 $317.4 $3,133.3 1.9x 1.8x 9.1x NM 17.2x 15.9x 1.47x 1.36x
Insulet Corp. $47.42 92% 2.02x $2,611.0 ($28.0) $2,583.0 8.4x 6.9x NM NM NM NM NM NM
Hill-Rom Holdings $38.54 86% 1.20x $2,214.4 $194.4 $2,408.8 1.4x 1.4x 7.9x 7.8x 16.0x 14.9x 1.92x 1.79x
Accuray Incorporated $9.60 88% 2.55x $733.0 $41.4 $774.4 2.2x 1.9x NM 22.0x NM NM NM NM
Average 4.9x 4.2x 11.6x 12.9x 19.0x 17.1x 1.70x 1.74x
Median 3.5x 3.1x 11.0x 10.6x 17.2x 15.7x 1.73x 1.68x
Stock Price% of 52-
Week High
Current
Stock Price
as a Multiple
of 52-Wk low
Equity Value Net Debt Ent. Value
EV/CY Revenue EV/CY EBITDA P/E PEG Ratio
($Millions, except per share values) Operating Metrics
5-Yr NI
2014E 2015E 2014E 2015E Growth % LTM LTM LTM LTM
Equipment
Intuitive Surgical $437.99 85% 1.25x $16,790.3 ($1,403.5) $15,386.8 (0.1%) 8.9% 35.8% 36.5% 9.3% 70.4% NA 7.4% NA
Varian Medical Systems $83.99 98% 1.33x $8,697.4 ($563.9) $8,133.5 6.8% 6.2% 22.6% 23.0% 10.9% 42.6% NA 7.4% NA
ResMed $44.69 78% 1.08x $6,330.8 ($536.9) $5,793.9 6.8% 13.5% 32.9% 33.9% 12.9% 63.4% NA 7.8% NA
Hologic $21.50 93% 1.16x $5,899.4 $3,859.3 $9,758.6 0.8% 4.0% 34.6% 35.2% 7.6% 62.6% 13.5% 7.9% 10.2%
DexCom $41.36 83% 2.75x $3,011.4 ($47.8) $2,963.6 39.4% 34.2% 1.1% 14.1% 31.7% 62.6% NA 26.4% NA
Steris Corp. $47.75 96% 1.23x $2,813.9 $317.4 $3,133.3 5.4% 3.9% 20.6% NA 11.7% 40.6% 0.4% 3.1% NA
Insulet Corp. $47.42 92% 2.02x $2,611.0 ($28.0) $2,583.0 23.9% 23.1% 10.1% 14.5% 26.5% 45.5% 22.5% 8.8% 20.2%
Hill-Rom Holdings $38.54 86% 1.20x $2,214.4 $194.4 $2,408.8 1.2% 1.8% 17.8% 17.8% 8.3% 45.4% NA 4.1% NA
Accuray Incorporated $9.60 88% 2.55x $733.0 $41.4 $774.4 10.3% 11.0% 3.3% 8.8% NM 34.4% 16.7% 17.4% 14.2%
Average 10.5% 11.8% 19.9% 23.0% 14.9% 51.9% 13.3% 10.0% 14.9%
Median 6.8% 8.9% 20.6% 20.4% 11.3% 45.5% 15.1% 7.8% 14.2%
GM S&M Mgn.R&D Mgn.G&A Mgn.CY Rev. Growth CY EBITDA Margin
Stock Price% of 52-
Week High
Current
Stock Price
as a Multiple
of 52-Wk low
Equity Value Net Debt Ent. Value
($Millions, except per share values) Valuation Metrics Operating Metrics
2014E 2015E 2014E 2015E 2014E 2015E 2014E 2015E
Dental
DENTSPLY International $46.04 90% 1.15x $6,529.1 $1,460.6 $8,032.7 2.6x 2.5x 12.9x 11.9x 18.3x 16.7x 1.74x 1.58x
Align Technology $51.79 80% 1.75x $4,219.9 ($370.0) $3,849.9 5.1x 4.5x 19.0x 16.2x 29.8x 25.9x 1.50x 1.30x
Average 3.9x 3.5x 15.9x 14.1x 24.1x 21.3x 1.62x 1.44x
Median 3.9x 3.5x 15.9x 14.1x 24.1x 21.3x 1.62x 1.44x
Stock Price% of 52-
Week High
Current
Stock Price
as a Multiple
of 52-Wk low
Equity Value Net Debt Ent. Value
EV/CY Revenue EV/CY EBITDA P/E PEG Ratio
($Millions, except per share values) Operating Metrics
5-Yr NI
2014E 2015E 2014E 2015E Growth % LTM LTM LTM LTM
Dental
DENTSPLY International $46.04 90% 1.15x $6,529.1 $1,460.6 $8,032.7 3.6% 3.9% 20.4% 21.2% 10.6% 53.5% NA 2.9% NA
Align Technology $51.79 80% 1.75x $4,219.9 ($370.0) $3,849.9 15.7% 12.2% 26.9% 28.0% 19.9% 76.3% 27.6% 6.7% 17.3%
Average 9.6% 8.1% 23.6% 24.6% 15.2% 64.9% 27.6% 4.8% 17.3%
Median 9.6% 8.1% 23.6% 24.6% 15.2% 64.9% 27.6% 4.8% 17.3%
GM S&M Mgn.R&D Mgn.G&A Mgn.CY Rev. Growth CY EBITDA Margin
Stock Price% of 52-
Week High
Current
Stock Price
as a Multiple
of 52-Wk low
Equity Value Net Debt Ent. Value
20
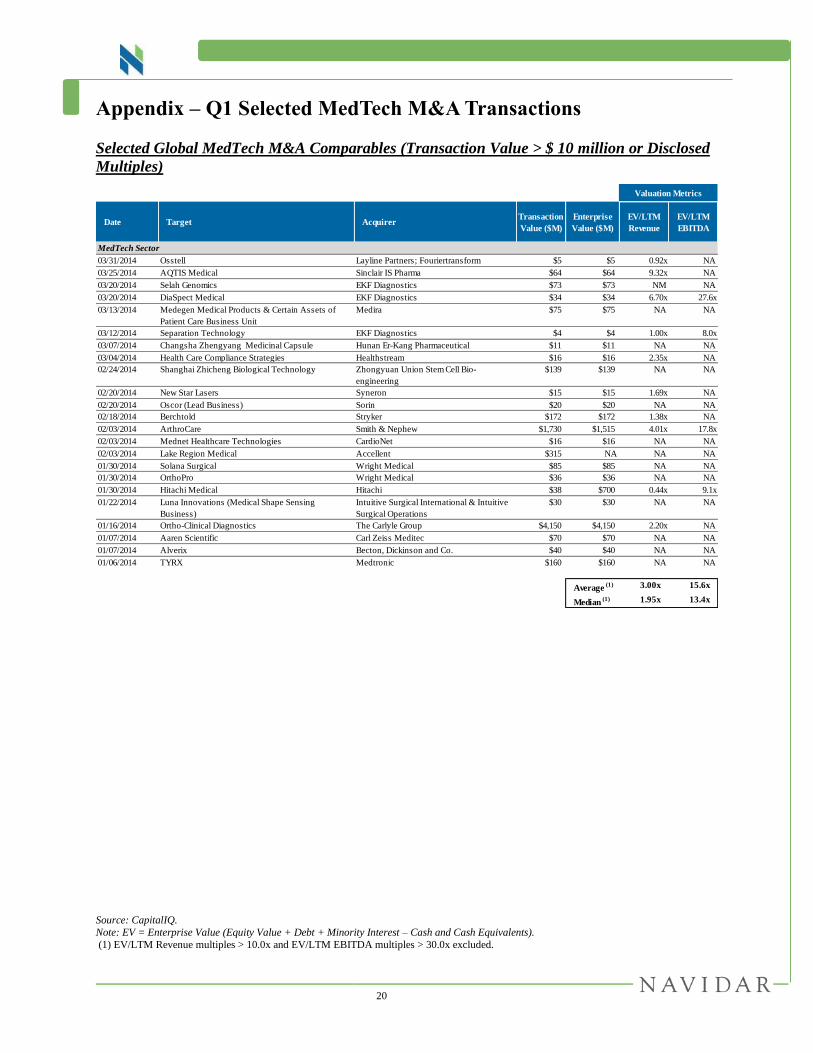
Appendix – Q1 Selected MedTech M&A Transactions
Selected Global MedTech M&A Comparables (Transaction Value > $ 10 million or Disclosed
Multiples)
Source: CapitalIQ.
Note: EV = Enterprise Value (Equity Value + Debt + Minority Interest – Cash and Cash Equivalents).
(1) EV/LTM Revenue multiples > 10.0x and EV/LTM EBITDA multiples > 30.0x excluded.
Valuation Metrics
Date Target AcquirerTransaction
Value ($M)
Enterprise
Value ($M)
EV/LTM
Revenue
EV/LTM
EBITDA
MedTech Sector
03/31/2014 Osstell Layline Partners; Fouriertransform $5 $5 0.92x NA
03/25/2014 AQTIS Medical Sinclair IS Pharma $64 $64 9.32x NA
03/20/2014 Selah Genomics EKF Diagnostics $73 $73 NM NA
03/20/2014 DiaSpect Medical EKF Diagnostics $34 $34 6.70x 27.6x
03/13/2014 Medegen Medical Products & Certain Assets of
Patient Care Business Unit
Medira $75 $75 NA NA
03/12/2014 Separation Technology EKF Diagnostics $4 $4 1.00x 8.0x
03/07/2014 Changsha Zhengyang Medicinal Capsule Hunan Er-Kang Pharmaceutical $11 $11 NA NA
03/04/2014 Health Care Compliance Strategies Healthstream $16 $16 2.35x NA
02/24/2014 Shanghai Zhicheng Biological Technology Zhongyuan Union Stem Cell Bio-
engineering
$139 $139 NA NA
02/20/2014 New Star Lasers Syneron $15 $15 1.69x NA
02/20/2014 Oscor (Lead Business) Sorin $20 $20 NA NA
02/18/2014 Berchtold Stryker $172 $172 1.38x NA
02/03/2014 ArthroCare Smith & Nephew $1,730 $1,515 4.01x 17.8x
02/03/2014 Mednet Healthcare Technologies CardioNet $16 $16 NA NA
02/03/2014 Lake Region Medical Accellent $315 NA NA NA
01/30/2014 Solana Surgical Wright Medical $85 $85 NA NA
01/30/2014 OrthoPro Wright Medical $36 $36 NA NA
01/30/2014 Hitachi Medical Hitachi $38 $700 0.44x 9.1x
01/22/2014 Luna Innovations (Medical Shape Sensing
Business)
Intuitive Surgical International & Intuitive
Surgical Operations
$30 $30 NA NA
01/16/2014 Ortho-Clinical Diagnostics The Carlyle Group $4,150 $4,150 2.20x NA
01/07/2014 Aaren Scientific Carl Zeiss Meditec $70 $70 NA NA
01/07/2014 Alverix Becton, Dickinson and Co. $40 $40 NA NA
01/06/2014 TYRX Medtronic $160 $160 NA NA
Average (1) 3.00x 15.6x
Median (1) 1.95x 13.4x
21
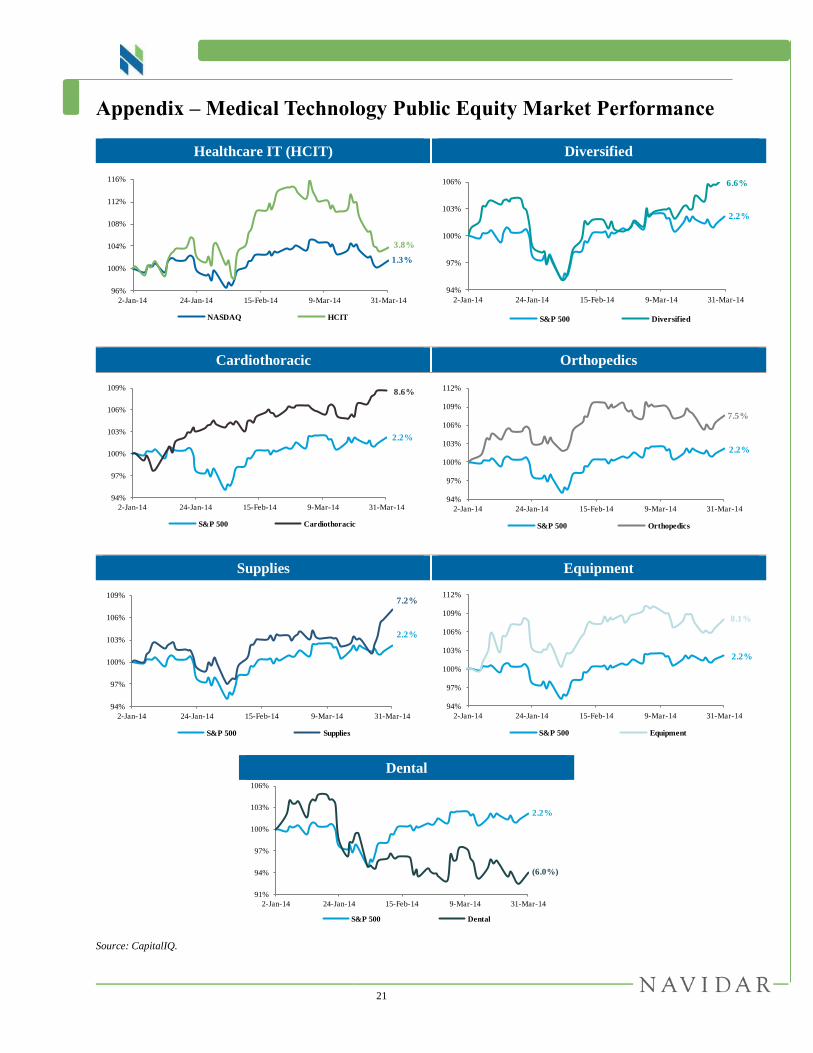
Appendix – Medical Technology Public Equity Market Performance
Healthcare IT (HCIT) Diversified
Cardiothoracic Orthopedics
Supplies Equipment
Source: CapitalIQ.
96%
100%
104%
108%
112%
116%
2-Jan-14 24-Jan-14 15-Feb-14 9-Mar-14 31-Mar-14
NASDAQ HCIT
3.8%
1.3%
94%
97%
100%
103%
106%
2-Jan-14 24-Jan-14 15-Feb-14 9-Mar-14 31-Mar-14
S&P 500 Diversified
6.6%
2.2%
94%
97%
100%
103%
106%
109%
2-Jan-14 24-Jan-14 15-Feb-14 9-Mar-14 31-Mar-14
S&P 500 Cardiothoracic
8.6%
2.2%
94%
97%
100%
103%
106%
109%
112%
2-Jan-14 24-Jan-14 15-Feb-14 9-Mar-14 31-Mar-14
S&P 500 Orthopedics
7.5%
2.2%
94%
97%
100%
103%
106%
109%
2-Jan-14 24-Jan-14 15-Feb-14 9-Mar-14 31-Mar-14
S&P 500 Supplies
7.2%
2.2%
94%
97%
100%
103%
106%
109%
112%
2-Jan-14 24-Jan-14 15-Feb-14 9-Mar-14 31-Mar-14
S&P 500 Equipment
8.1%
2.2%
Dental
91%
94%
97%
100%
103%
106%
2-Jan-14 24-Jan-14 15-Feb-14 9-Mar-14 31-Mar-14
S&P 500 Dental
(6.0%)
2.2%
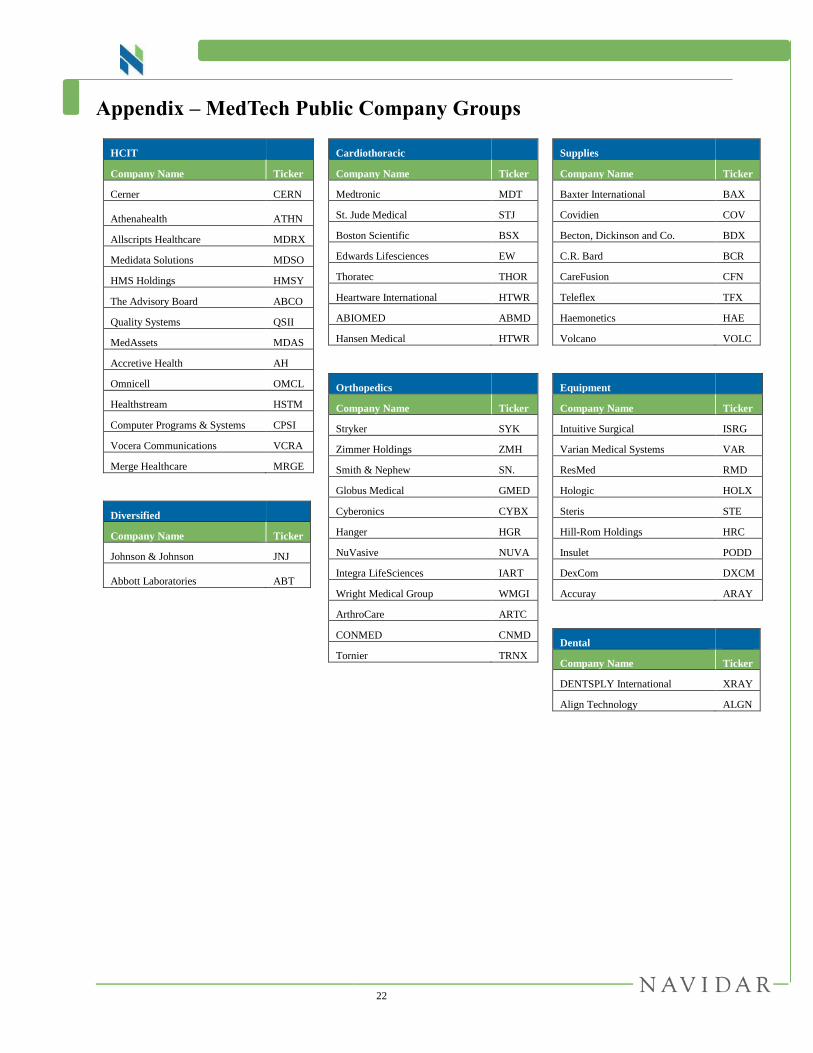
22
Appendix – MedTech Public Company Groups
HCIT
Company Name Ticker
Cerner CERN
Athenahealth ATHN
Allscripts Healthcare MDRX
Medidata Solutions MDSO
HMS Holdings HMSY
The Advisory Board ABCO
Quality Systems QSII
MedAssets MDAS
Accretive Health AH
Omnicell OMCL
Healthstream HSTM
Computer Programs & Systems CPSI
Vocera Communications VCRA
Merge Healthcare MRGE
Diversified
Company Name Ticker
Johnson & Johnson JNJ
Abbott Laboratories ABT
Cardiothoracic
Company Name Ticker
Medtronic MDT
St. Jude Medical STJ
Boston Scientific BSX
Edwards Lifesciences EW
Thoratec THOR
Heartware International HTWR
ABIOMED ABMD
Hansen Medical HTWR
Orthopedics
Company Name Ticker
Stryker SYK
Zimmer Holdings ZMH
Smith & Nephew SN.
Globus Medical GMED
Cyberonics CYBX
Hanger HGR
NuVasive NUVA
Integra LifeSciences IART
Wright Medical Group WMGI
ArthroCare ARTC
CONMED CNMD
Tornier TRNX
Supplies
Company Name Ticker
Baxter International BAX
Covidien COV
Becton, Dickinson and Co. BDX
C.R. Bard BCR
CareFusion CFN
Teleflex TFX
Haemonetics HAE
Volcano VOLC
Equipment
Company Name Ticker
Intuitive Surgical ISRG
Varian Medical Systems VAR
ResMed RMD
Hologic HOLX
Steris STE
Hill-Rom Holdings HRC
Insulet PODD
DexCom DXCM
Accuray ARAY
Dental
Company Name Ticker
DENTSPLY International XRAY
Align Technology ALGN
23
Disclaimer
This Quarterly Report (the “Quarterly”) has been prepared solely for informational purposes and may not be used or
relied upon for any purpose other than as specifically contemplated by a written agreement with us.
This Quarterly is not intended to provide the sole basis for evaluating and should not be considered a recommendation
with respect to, any transaction or other matter. This Quarterly does not constitute an offer, or the solicitation of an
offer, to buy or sell any securities or other financial product, to participate in any transaction or to provide any
investment banking or other services and should not be deemed to be a commitment or undertaking of any kind on the
part of Navidar Group LLC (“Navidar”) or any of its affiliates to underwrite, place or purchase any securities or to
provide any debt or equity financing or to participate in any transaction, or a recommendation to buy or sell any
securities, to make any investment or to participate in any transaction or trading strategy.
Although the information contained in this Quarterly has been obtained or compiled from sources deemed reliable,
neither Navidar nor any of its affiliates make any representation or warranty, express or implied, as to the accuracy or
completeness of the information contained herein and nothing contained herein is, or shall be relied upon as, a promise
or representation whether as to the past, present or future performance. The information set forth herein may include
estimates and/or involve significant elements of subjective judgment and analysis. No representations are made as to
the accuracy of such estimates or that all assumptions relating to such estimates have been considered or stated or that
such estimates will be realized. The information contained herein does not purport to contain all of the information
that may be required to evaluate a participation in any transaction and any recipient hereof should conduct its own
independent analysis of the data referred to herein. We assume no obligation to update or otherwise revise these
materials.
Navidar and its affiliates do not provide legal, tax or accounting advice. Prior to making any investment or
participating in any transaction, you should consult, to the extent necessary, your own independent legal, tax,
accounting and other professional advisors to ensure that any transaction or investment is suitable for you in the light
of your financial capacity and objectives.


