24
© 2021 OTIS WORLDWIDE CORPORATION. Q1 2021 Earnings Call April 26, 2021

© 2021 OTIS WORLDWIDE CORPORATION.
Q1 2021
Earnings CallApril 26, 2021

© 2021 OTIS WORLDWIDE CORPORATION. 2
Forward-Looking StatementsNote: All results and expectations in this presentation reflect continuing operations unless otherwise noted.
This communication contains statements which, to the extent they are not statements of historical or present fact, constitute “forward-looking statements” under the securities laws. From
time to time, oral or written forward-looking statements may also be included in other information released to the public. These forward-looking statements are intended to provide
management’s current expectations or plans for Otis’ future operating and financial performance, based on assumptions currently believed to be valid. Forward-looking statements can
be identified by the use of words such as “believe,” “expect,” “expectations,” “plans,” “strategy,” “prospects,” “estimate,” “project,” “target,” “anticipate,” “will,” “should,” “see,”
“guidance,” “outlook,” “confident” and other words of similar meaning in connection with a discussion of future operating or financial performance or the separation and distribution.
Forward-looking statements may include, among other things, statements relating to future sales, earnings, cash flow, results of operations, uses of cash, dividends, share repurchases, tax
rates and other measures of financial performance or potential future plans, strategies or transactions of Otis following its separation from United Technologies Corporation, including the
estimated costs associated with the separation and distribution and other statements that are not historical facts. All forward-looking statements involve risks, uncertainties and other
factors that may cause actual results to differ materially from those expressed or implied in the forward-looking statements. For those statements, Otis claims the protection of the safe
harbor for forward-looking statements contained in the U.S. Private Securities Litigation Reform Act of 1995. Such risks, uncertainties and other factors include, without limitation: (1) the
effect of economic conditions in the industries and markets in which Otis and its businesses operate in the U.S. and globally and any changes therein, including financial market conditions,
fluctuations in commodity prices, interest rates and foreign currency exchange rates, levels of end market demand in construction, the impact of weather conditions, pandemic health
issues (including COVID-19 and its effects, among other things, on global supply, demand, and distribution disruptions as the outbreak continues and results in an increasingly prolonged
period of travel, commercial and/or other similar restrictions and limitations), natural disasters and the financial condition of Otis’ customers and suppliers; (2) challenges in the
development, production, delivery, support, performance and realization of the anticipated benefits of advanced technologies and new products and services; (3) future levels of
indebtedness and capital spending and research and development spending; (4) future availability of credit and factors that may affect such availability, including credit market
conditions in the U.S. and other countries in which Otis and its businesses operate and Otis’ capital structure; (5) the timing and scope of future repurchases of Otis’ common stock, which
may be suspended at any time due to various factors, including market conditions and the level of other investing activities and uses of cash; (6) delays and disruption in delivery of
materials and services from suppliers; (7) cost reduction efforts and restructuring costs and savings and other consequences thereof; (8) new business and investment opportunities; (9) the
anticipated benefits of moving away from diversification and balance of operations across product lines, regions and industries; (10) the outcome of legal proceedings, investigations and
other contingencies; (11) pension plan assumptions and future contributions; (12) the impact of the negotiation of collective bargaining agreements and labor disputes; (13) the effect of
changes in political conditions in the U.S., including the new U.S. Administration, and other countries in which Otis and its businesses operate, including China’s response to the new U.S.
administration and the United Kingdom’s recent withdrawal from the European Union, on general market conditions, global trade policies and currency exchange rates in the near term
and beyond; (14) the effect of changes in tax, environmental, regulatory (including among other things import/export) and other laws and regulations in the U.S. and other countries in
which Otis and its businesses operate, including changes as a result of the new U.S. Administration; (15) the ability of Otis to retain and hire key personnel; (16) the scope, nature, impact or
timing of acquisition and divestiture activity, including among other things integration of acquired businesses into existing businesses and realization of synergies and opportunities for
growth and innovation and incurrence of related costs; (17) the expected benefits of the separation and distribution and the timing thereof; (18) the determination by the Internal
Revenue Service and other tax authorities that the distribution or certain related transactions should be treated as taxable transactions; (19) risks associated with indebtedness incurred as
a result of financing transactions undertaken in connection with the separation; (20) the risk that dis-synergy costs, costs of restructuring transactions and other costs incurred in connection
with the separation will exceed Otis’ estimates; and (21) the impact of the separation on Otis’ businesses and Otis’ resources, systems, procedures and controls, diversion of
management’s attention and the impact on relationships with customers, suppliers, employees and other business counterparties. The above list of factors is not exhaustive or necessarily
in order of importance. For additional information on identifying factors that may cause actual results to vary from those stated in forward-looking statements, see Otis’ registration
statements on Form 10 and Form S-3 and the reports of Otis on Forms 10-K, 10-Q and 8-K filed with or furnished to the SEC from time to time. Any forward-looking statement speaks only as
of the date on which it is made, and Otis assumes no obligation to update or revise such statement, whether as a result of new information, future events or otherwise, except as required
by applicable law.
© 2021 OTIS WORLDWIDE CORPORATION. 3
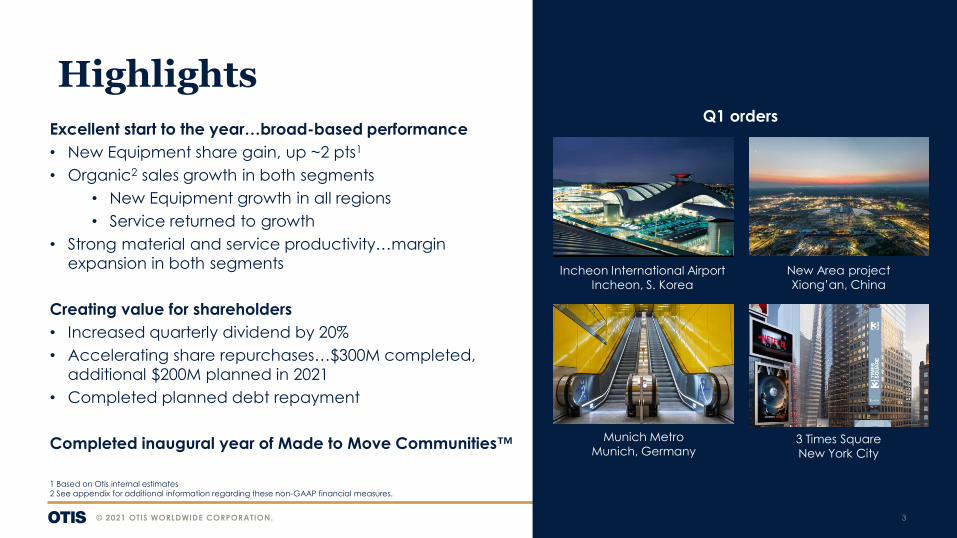
Highlights
Excellent start to the year…broad-based performance
• New Equipment share gain, up ~2 pts1
• Organic2 sales growth in both segments
• New Equipment growth in all regions
• Service returned to growth
• Strong material and service productivity…margin
expansion in both segments
Creating value for shareholders
• Increased quarterly dividend by 20%
• Accelerating share repurchases…$300M completed,
additional $200M planned in 2021
• Completed planned debt repayment
Completed inaugural year of Made to Move Communities™
1 Based on Otis internal estimates
2 See appendix for additional information regarding these non-GAAP financial measures.
Q1 orders
Munich Metro
Munich, Germany
New Area project
Xiong’an, ChinaIncheon International Airport
Incheon, S. Korea
3 Times Square
New York City

© 2021 OTIS WORLDWIDE CORPORATION. 4
Q1 2021 update
• New Equipment orders up 18.4% at constant currency1…up 1.4% on a rolling 12-
month basis
• New Equipment backlog up 8% and 2% at constant currency1
• Organic1 sales up 10.3%...New Equipment up 25.1%, Service up 1.3%
• Adjusted operating profit margin1 expanded 40 bps
• Free cash flow1 of $541M…176% conversion1 of GAAP net income
Q1 2021
Results
Revised 2021
Outlook
• Improved across all key metrics
• Net sales of $13.6B to $13.9B, up 6.7 to 8.7% at actual currency; organic up 4 to 6%
• Adjusted operating profit1 up $175 to $215M at actual currency, up $120 to $160M
at constant currency1
• Adjusted diluted EPS1 of $2.78 to $2.84, up 10 to 13%
• Free cash flow1 of $1.35 to $1.45B…~120% conversion1 of GAAP net income
1 See appendix for additional information regarding these non-GAAP financial measures

© 2021 OTIS WORLDWIDE CORPORATION. 5
Q1 2021 results
Sales Diluted earnings per shareOperating profit
2,966
3,408
Q1 2020 Q1 2021
($ millions, except per share amounts)
450533
15.2%15.6%
Q1 2020 Q1 2021
Q1 adjusted operating profit1 up
$83M…up $57M at constant currency1
Q1 adjusted operating profit margin1
expanded 40 bps, including ~80 bps of
segment mix headwind
1 See appendix for additional information regarding these non-GAAP financial measures
GAAP
Adjusted1
Adjusted
margin1
329 509
Organic1 10.3%
FX 4.4%
Net acquisitions/other 0.2%
Total net sales 14.9%
$0.60 $0.72
Q1 2020 Q1 2021
GAAP
Adjusted1
$0.38 $0.71
Adj. EPS1 drivers
Operating profit $0.13
Tax $0.05
Net interest / NCI ($0.06)

© 2021 OTIS WORLDWIDE CORPORATION. 6
New Equipment
1,123
1,458
Q1 2020 Q1 2021
Net sales
65
109
5.8%
7.5%
Q1 2020 Q1 2021
Operating profit
1 See appendix for additional information regarding these non-GAAP financial measures.
2 Based on Otis internal estimates.
GAAP 64 104
Adjusted1
Adjusted
margin1
29.8%
62.5%
67.7%
+ 170 bps
Y/Y
Q1 Results
• Orders up ~18.4% at constant currency1
…growth in all regions with the Americas
and Asia up double digits
• New Equipment share up ~2 pts2
• New Equipment backlog up 2% at constant
currency1…broad-based growth
• Organic1 sales up 25.1%
– Americas up 21.8%
– EMEA up 3.3%
– Asia up 46.0%
• Adjusted operating profit1 up $44M…higher
volume and strong material productivity
partially offset by unfavorable mix and price
($ millions)
25.1%
Organic1
© 2021 OTIS WORLDWIDE CORPORATION. 7
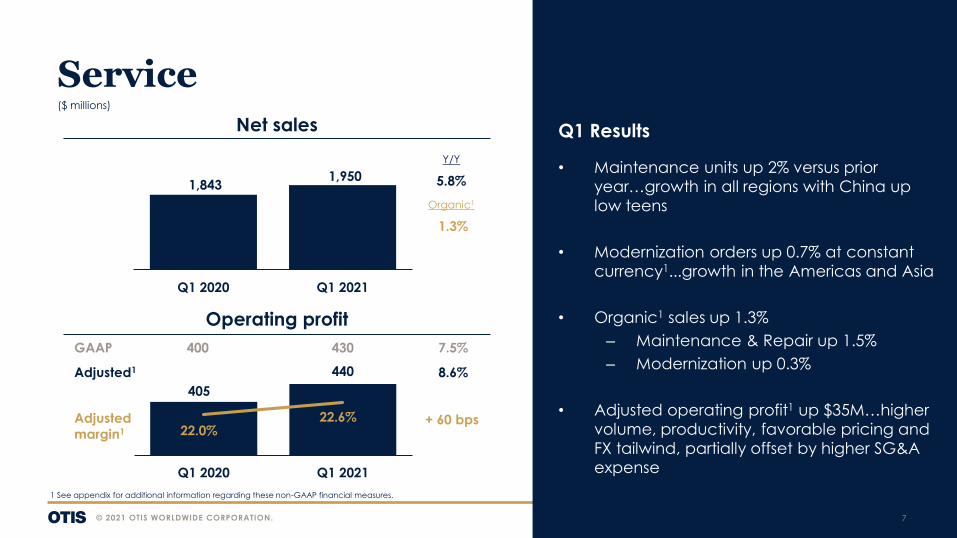
Service
Q1 Results
• Maintenance units up 2% versus prior
year…growth in all regions with China up
low teens
• Modernization orders up 0.7% at constant
currency1...growth in the Americas and Asia
• Organic1 sales up 1.3%
– Maintenance & Repair up 1.5%
– Modernization up 0.3%
• Adjusted operating profit1 up $35M…higher
volume, productivity, favorable pricing and
FX tailwind, partially offset by higher SG&A
expense
1 See appendix for additional information regarding these non-GAAP financial measures.
1,843 1,950
Q1 2020 Q1 2021
Net sales
405
440
22.0%22.6%
Q1 2020 Q1 2021
Operating profit
GAAP 400 430
Adjusted1
Adjusted
margin1
5.8%
7.5%
8.6%
+ 60 bps
Y/Y
($ millions)
1.3%
Organic1

© 2021 OTIS WORLDWIDE CORPORATION. 8
2021 financial outlook
1 See appendix for additional information regarding these non-GAAP financial measures.
Otis up 2 to 4%
New Equipment up 2 to 5%
Service up 2 to 4%
Organic1 sales
Adjusted operating profit1
Free cash flow1 & capital deployment
Adjusted net income & EPS1
Prior outlook
Constant currency1 up $75 to $125M
Actual currency up $125 to $175M
Adjusted net income1 $1,160 to $1,200M
Adjusted EPS1 $2.67 to $2.77, up 6 to 10%
Free cash flow1 $1.3 to 1.4B
Quarterly dividend per share $0.20
Share repurchases ~$300M
Otis up 4 to 6%
New Equipment up 7.5 to 8.5%
Service up 2 to 4%
Current outlook
Constant currency1 up $120 to $160M
Actual currency up $175 to $215M
Adjusted net income1 $1,200 to $1,225M
Adjusted EPS1 $2.78 to $2.84, up 10 to 13%
Free cash flow1 $1.35 to 1.45B
Quarterly dividend per share $0.24
Share repurchases ~$500M
Improving 2021 outlook across key metrics
© 2021 OTIS WORLDWIDE CORPORATION. 9
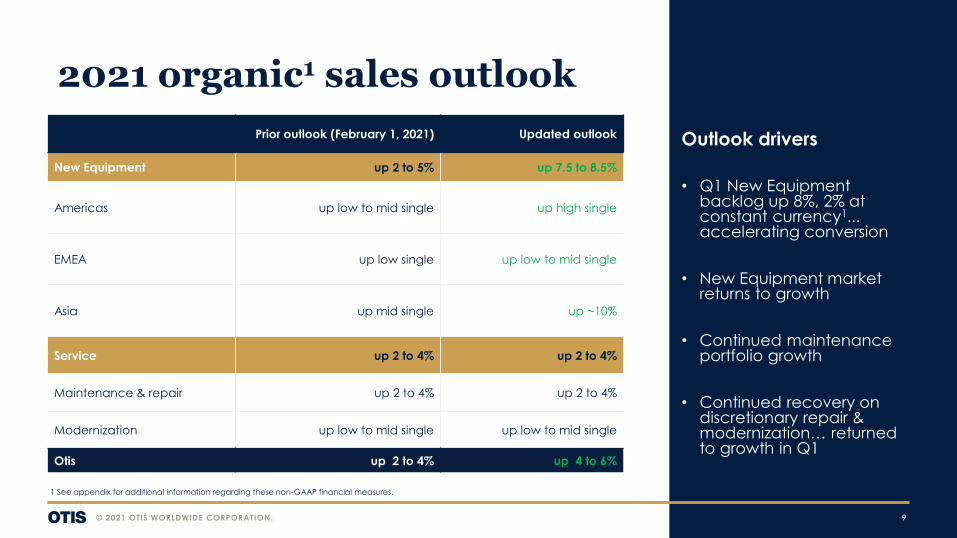
Outlook drivers
• Q1 New Equipment backlog up 8%, 2% at constant currency1... accelerating conversion
• New Equipment market returns to growth
• Continued maintenance portfolio growth
• Continued recovery on discretionary repair & modernization… returned to growth in Q1
2021 organic1 sales outlook
Prior outlook (February 1, 2021) Updated outlook
New Equipment up 2 to 5% up 7.5 to 8.5%
Americas up low to mid single up high single
EMEA up low single up low to mid single
Asia up mid single up ~10%
Service up 2 to 4% up 2 to 4%
Maintenance & repair up 2 to 4% up 2 to 4%
Modernization up low to mid single up low to mid single
Otis up 2 to 4% up 4 to 6%
1 See appendix for additional information regarding these non-GAAP financial measures.
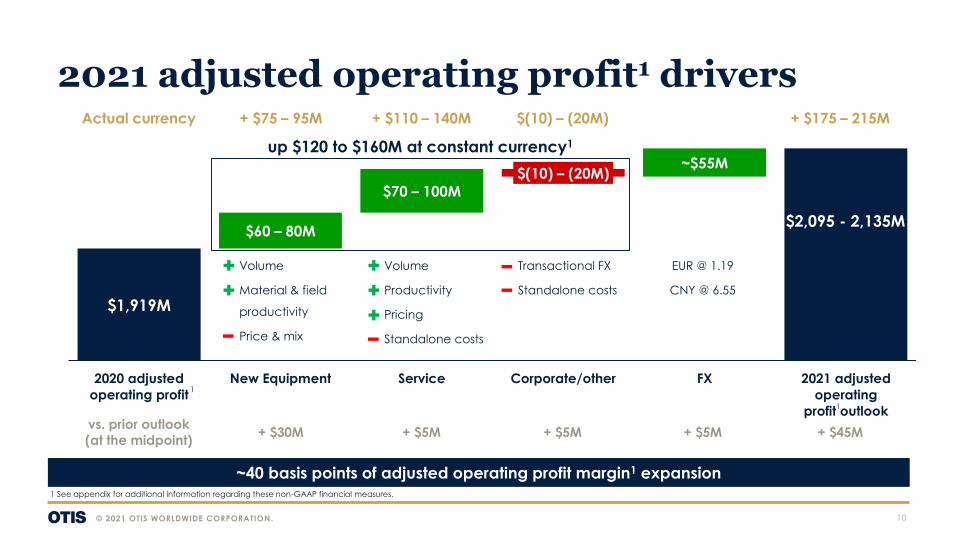
$1,919M
$60 – 80M
$70 – 100M
~$55M$(10) – (20M)
2020 adjusted
operating profit
New Equipment Service Corporate/other FX 2021 adjusted
operating
profit outlook
© 2021 OTIS WORLDWIDE CORPORATION. 10
2021 adjusted operating profit1 drivers
up $120 to $160M at constant currency1
1 See appendix for additional information regarding these non-GAAP financial measures.
1
Volume
Material & field
productivity
Price & mix
$2,095 - 2,135M
1
Volume
Productivity
Pricing
Standalone costs
Transactional FX
Standalone costs
Actual currency + $75 – 95M + $110 – 140M $(10) – (20M)
EUR @ 1.19
CNY @ 6.55
+ $175 – 215M
~40 basis points of adjusted operating profit margin1 expansion
vs. prior outlook
(at the midpoint)+ $30M + $5M + $5M + $45M+ $5M

© 2021 OTIS WORLDWIDE CORPORATION. 11
Otis fundamentals1
Iconic global brand in a large, growing industry
Sustainable growth over the medium-termGaining share in NE2 & accelerating Service portfolio growth
Driving profitability Expanding margins through growth & productivity
Investing through the cycle Sustainable level of R&D and Capex
Robust free cash flow3 generation >100% FCF conversion3
Focus on creating shareholder value Raised dividend & accelerated share repurchases
1 Based on Otis’ current expectations. 2 Based on Otis internal estimates. 3 See appendix for additional information regarding these non-GAAP financial measures.

© 2021 OTIS WORLDWIDE CORPORATION.12

Appendix
© 2021 OTIS WORLDWIDE CORPORATION. 13
© 2021 OTIS WORLDWIDE CORPORATION. 14
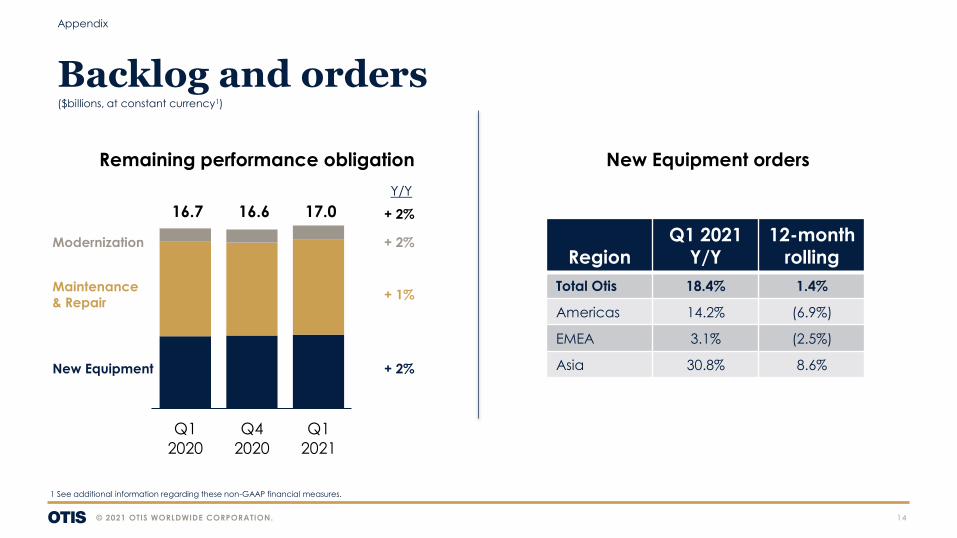
Backlog and orders
1 See additional information regarding these non-GAAP financial measures.
Appendix
($billions, at constant currency1)
16.7 16.6 17.0
Q1
2020
Q4
2020
Q1
2021
New Equipment
Maintenance
& Repair
Modernization
Remaining performance obligation New Equipment orders
RegionQ1 2021
Y/Y12-month
rolling
Total Otis 18.4% 1.4%
Americas 14.2% (6.9%)
EMEA 3.1% (2.5%)
Asia 30.8% 8.6%
Y/Y
+ 2%
+ 1%
+ 2%
+ 2%

$450M
$533M
$39M
$15M$3M
$26M
Q1 2020 adjusted
operating profit
New
Equipment
Service Corporate /
Other
FX Q1 2021 adjusted
operating profit
© 2021 OTIS WORLDWIDE CORPORATION. 15
Q1 2021 adjusted operating profit1 drivers
1 See additional information regarding these non-GAAP financial measures.
Volume
Material productivity
Mix/price
Volume
Productivity
Pricing
Standalone costs
Appendix
1 1
40 basis points of adjusted operating profit margin1 expansion
+$57M at constant currency1
Actual currency + $44M + $35M + $4M + $83M

© 2021 OTIS WORLDWIDE CORPORATION. 16
Appendix
Additional information
1Q21 actuals
Prior FY21 outlook
(February 1, 2021)
Updated FY21
outlook
Restructuring expense $15M $60 – 70M $60 – 70M
Non-service pension expense $2M $10 – 15M $10 – 15M
Net interest expense $32M ~$135M ~$125M
Adjusted effective tax rate 28.7% ~29.5% ~29.5%
Noncontrolling interest expense $44M ~$175M $180 - 185M
Capital expenditures $44M $160 – 170M $160 – 170M
Diluted shares outstanding 433.7M ~434M ~432M

© 2021 OTIS WORLDWIDE CORPORATION. 17
Appendix
Use and Definitions of Non-GAAP Financial MeasuresOtis Worldwide Corporation (“Otis”) reports its financial results in accordance with accounting principles generally accepted in the United States ("GAAP"). We supplement the reporting of our financial information
determined under GAAP with certain non-GAAP financial information. The non-GAAP information presented provides investors with additional useful information, but should not be considered in isolation or as substitutes
for the related GAAP measures. Moreover, other companies may define non-GAAP measures differently, which limits the usefulness of these measures for comparisons with such other companies. We encourage investors
to review our financial statements and publicly filed reports in their entirety and not to rely on any single financial measure. A reconciliation of the non-GAAP measures (referenced in this press release) to the
corresponding amounts prepared in accordance with GAAP appears in the attached tables. These tables provide additional information as to the items and amounts that have been excluded from the adjusted
measures.
Organic sales, adjusted selling, general and administrative (“SG&A”) expense, earnings before interest taxes and depreciation (“EBITDA”), adjusted EBITDA, adjusted operating profit, adjusted net income, adjusted
diluted earnings per share (“EPS”), adjusted effective tax rate and free cash flow are non-GAAP financial measures.
Organic sales represents consolidated net sales (a GAAP measure), excluding the impact of foreign currency translation, acquisitions and divestitures completed in the preceding twelve months and other significant
items of a non-recurring and/or nonoperational nature (“other significant items”). Management believes organic sales is a useful measure in providing period-to-period comparisons of the results of the Company’s
ongoing operational performance.
Adjusted SG&A expense represents SG&A expense (a GAAP measure), excluding restructuring costs, other significant items and allocated costs for certain functions and services previously performed by United
Technologies Corporation (“UTC”) prior to our separation (“UTC allocated costs”) and including solely for fiscal years prior to 2020 estimated standalone public company costs, as though Otis’ operations had been
conducted independently from UTC (“standalone costs”). Standalone costs for fiscal years prior to 2020 are based on quarterly estimates determined during Otis’ annual planning process for the 2020 fiscal year.
Recurring standalone costs for 2021 and 2020 are not adjusted.
Adjusted operating profit represents income from continuing operations (a GAAP measure), excluding restructuring costs, other non-recurring significant items, UTC allocated costs and including solely for fiscal years prior
to 2020 estimated standalone public company costs.
Adjusted net income represents net income from continuing operations (a GAAP measure), excluding restructuring costs and other non-recurring significant items and UTC allocated costs and including solely for fiscal
years prior to 2020 estimated standalone public company costs, estimated adjustments to non-service pension expense, net interest expense and income tax expense as if Otis was a standalone public company
(“standalone operating income adjustments”). Adjusted EPS represents diluted earnings per share from continuing operations (a GAAP measure), adjusted for the per share impact of restructuring, other significant items
and solely for fiscal years prior to 2020 estimated standalone operating income adjustments.
The adjusted effective tax rate represents the effective tax rate (a GAAP measure) adjusted for the tax impact of restructuring costs, non-recurring significant items and solely for fiscal years prior to 2020 the tax impact of
the additional adjustments (estimated standalone public company costs, interest expense and non-service pension expense).
EBITDA represents net income from operations (a GAAP measure), adjusted for noncontrolling interests, income tax expense, net interest expense, non-service pension expense and depreciation and amortization.
Adjusted EBITDA represents EBITDA, as calculated above, adjusted for the impact of restructuring, other significant items and UTC allocated costs, including solely for fiscal years prior to 2020estimated standalone public
company costs. Management believes that adjusted SG&A, EBITDA, adjusted EBITDA, adjusted operating profit, adjusted net income, adjusted EPS and the adjusted effective tax rate are useful measures in providing
period-to-period comparisons of the results of the Company’s ongoing operational performance and to the extent applicable as if it had been a standalone public company for fiscal years prior to 2020.
Additionally, GAAP financial results include the impact of changes in foreign currency exchange rates ("AFX"). We use the non-GAAP measure “at constant currency” or “CFX” to show changes in our financial results
without giving effect to period-to-period currency fluctuations. Under U.S. GAAP, income statement results are translated in U.S. dollars at the average exchange rate for the period presented. Management believes that
this non-GAAP measure is useful in providing period-to-period comparisons of the results of the Company’s ongoing operational performance.
Free cash flow is a non-GAAP financial measure that represents cash flow from operations (a GAAP measure) less capital expenditures. Management believes free cash flow is a useful measure of liquidity and an
additional basis for assessing Otis’ ability to fund its activities, including the financing of acquisitions, debt service, repurchases of common stock and distribution of earnings to shareholders.
When we provide our expectations for organic sales, adjusted operating profit, adjusted net income, adjusted effective tax rate, adjusted EPS and free cash flow on a forward-looking basis, a reconciliation of the
differences between the non-GAAP expectations and the corresponding GAAP measures (expected diluted EPS from continuing operations, operating profit, the effective tax rate, net sales and expected cash flow
from operations) generally is not available without unreasonable effort due to potentially high variability, complexity and low visibility as to the items that would be excluded from the GAAP measure in the relevant future
period, such as unusual gains and losses, the ultimate outcome of pending litigation, fluctuations in foreign currency exchange rates, the impact and timing of potential acquisitions and divestitures, and other structural
changes or their probable significance. The variability of the excluded items may have a significant, and potentially unpredictable, impact on our future GAAP results.

© 2021 OTIS WORLDWIDE CORPORATION. 18
2021 GAAP to adjusted financials reconciliation
Appendix
(a) Reflects costs for certain functions and services performed by UTC organizations that were allocated to Otis for purposes of carve-out financial statements.
(b) Non-service pension expense included in GAAP net income attributable to Otis pre-Separation includes amounts associated with Otis' participation in UTC retained pension plans.
(c) The adjusted effective tax rate represents the effective tax rate (a GAAP measure)adjusted for the tax impact of restructuring costs, other significant non-recurring items
($millions) Otis New Equipment Service Corporate/other
Sales 1Q20 1Q21 1Q20 1Q21 1Q20 1Q21 1Q20 1Q21
Net sales 2,966 3,408 1,123 1,458 1,843 1,950 0 0
Income
Net income attributable to Otis 165 308
Noncontrolling interest in subsidiaries’ 37 44
Income tax expense 125 123
Net interest expense 5 32
Non-service pension benefit (expense) (3) 2
GAAP operating profit 329 509 64 104 400 430 (135) (25)
Restructuring 6 15 1 5 5 10 0 0
One-time separation costs 32 9 0 0 0 0 32 9
Fixed asset impairment 67 0 0 0 0 0 67 0
UTC allocated corporate expenses (a) 16 0 0 0 0 0 16 0
Adjusted operating profit 450 533 65 109 405 440 (20) (16)Adjusted operating profit margin 15.2% 15.6% 5.8% 7.5% 22.0% 22.6%
Non-service pension benefit (expense) (b) 3 (2)
Net interest expense (5) (32)
Adjusted pre-tax profit 448 499
Adjusted income tax expense (149) (143)Adjusted tax rate (c) 33.3% 28.7%
Noncontrolling interest (37) (44)
Adjusted net income 262 312

© 2021 OTIS WORLDWIDE CORPORATION. 19
Appendix
Organic sales reconciliation
Q1 2021 Total OtisNew
EquipmentService
Maintenance
& RepairModernization
Organic 10.3% 25.1% 1.3% 1.5% 0.3%
FX 4.4% 4.6% 4.2% 4.4% 3.9%
Net acquisitions / divestitures 0.2% 0.1% 0.3% 0.3% 0.0%
Total net sales growth 14.9% 29.8% 5.8% 6.2% 4.2%

© 2021 OTIS WORLDWIDE CORPORATION. 20
Appendix
Adjusted operating profit at constant currency reconciliation($millions) Q1 2020 Q1 2021 Y/Y
New Equipment
Adjusted operating profit 65 109 44
Impact of foreign exchange (5) (5)
Adjusted operating profit at constant currency 65 104 39
Service
Adjusted operating profit 405 440 35
Impact of foreign exchange (20) (20)
Adjusted operating profit at constant currency 405 420 15
Otis Consolidated
Adjusted operating profit 450 533 83
Impact of foreign exchange (26) (26)
Adjusted operating profit at constant currency 450 507 57
© 2021 OTIS WORLDWIDE CORPORATION. 21
Appendix
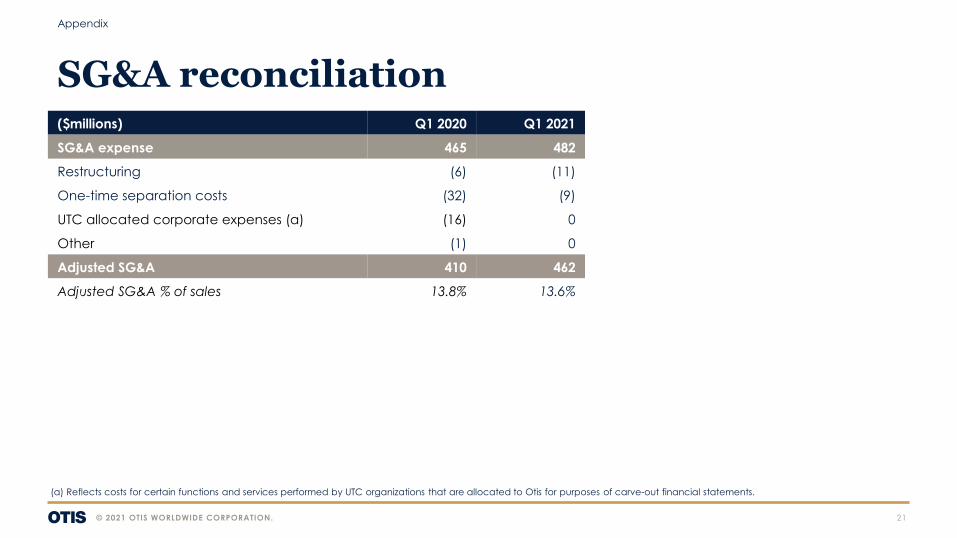
SG&A reconciliation($millions) Q1 2020 Q1 2021
SG&A expense 465 482
Restructuring (6) (11)
One-time separation costs (32) (9)
UTC allocated corporate expenses (a) (16) 0
Other (1) 0
Adjusted SG&A 410 462
Adjusted SG&A % of sales 13.8% 13.6%
(a) Reflects costs for certain functions and services performed by UTC organizations that are allocated to Otis for purposes of carve-out financial statements.

© 2021 OTIS WORLDWIDE CORPORATION. 22
Appendix
Diluted earnings per share reconciliationQ1 2020 Q1 2021
GAAP diluted earnings per share $0.38 $0.71
Impact of non-recurring items on diluted earnings per share $0.22 $0.01
Adjusted diluted earnings per share $0.60 $0.72

© 2021 OTIS WORLDWIDE CORPORATION. 23
Appendix
Free cash flow reconciliation($millions) Q1 2020 Q1 2021
Operating cash flow1 159 585
Capital expenditures (39) (44)
Free cash flow 120 541
GAAP net income 165 308
FCF conversion 73% 176%
1 Operating cash flow excludes dividends paid to noncontrolling interests.

© 2021 OTIS WORLDWIDE CORPORATION. 24
Appendix
Other reconciliations
($billions)Q1
2020
Q4
2020
Q1
2021
RPO at actual currency 16.3 17.2 17.3
FX1 0.4 (0.6) (0.3)
RPO at constant currency 16.7 16.6 17.0
Remaining performance obligation (RPO)
Growth %Q1
2021
Constant currency 2%
FX 6%
Actual currency 8%
New Equipment backlog
1 2020 totals have been adjusted to reflect FX impacts of the constant currency calculation


