28
Q1 2021 Results 6 th May 2021 sacyr.com Rumichaca Pasto, Colombia
Q1 2021 Results
6th May 2021 sacyr.com
Rumichaca Pasto, Colombia
Q1 2021 Results - 1 -
Index
I. Highlights: First Quarter 2021 2
II. Income Statement 4
III. Backlog 8
IV. Consolidated Balance Sheet 10
V. Business Areas Performance 13
VI. Boosting Sustainability 18
VII. Stock Market Evolution 19
VIII. Significant Holdings 19
IX. Annexes 20
Notes
The interim financial information contained herein is prepared in accordance with
International Financial Reporting Standards (IFRSs). This is unaudited information and,
therefore, may be modified in the future. This document does not constitute an offer,
invitation or recommendation to buy, sell or exchange shares or to make any kind of
investment. Sacyr does not assume any kind of liability for damage or losses arising from
any use of this document or its contents.
In order to comply with the European Securities and Markets Authority (ESMA) Guidelines
(2015/1415) on Alternative Performance Measures, the Appendix included at the end of this
document details the most important APMs used in its preparation. Sacyr considers that this
additional information facilitates the comparability, reliability and understanding of its financial
information.
Q1 2021 Results - 2 -
Main milestones of the period
• Shareholder remuneration
Shareholder remuneration remains as one of the group's strategic pillars. In line
with this, during February 2021 Sacyr carried out the payment of a dividend under the
modality of "Scrip Dividend", where shareholders could choose between: (i) sell the free-
of-charge allocation rights to Sacyr at a guaranteed fixed price of 0.042 euros gross per
right.; (ii) receive 1 new share for every 47 existing ones. More than 92% Sacyr's share
capital chose to receive the company's dividend on shares, demonstrating full
confidence in the company’s value.
After the end of quarter, during the Annual General Meeting held on April 29, 2021, two
new dividend payments under the "Scrip Dividend" format were approved.
• Performance of recourse net debt
During this first quarter, recourse net debt has increased in a timely manner due to
Panama's arbitration award, the investments made by the group and the seasonal effect
of the business. Despite this and to counteract this one-off impact, the group is in the
process of completing a green financial structure that will allow it to reduce this increase.
As it stated in strategic lines 21-25 presented in February of this year, the Sacyr group
is committed to significantly reducing recourse net debt in 2021 and 2022.
• Issuance of the first social bond linked to an infrastructure project
First issuance in Latin America of a social bond linked to the infrastructure project "Puerta
del Hierro – Cruz del Viso", also known as "Montes de María", in Colombia. The issue
was for $209 million (174 million euros), with a maturity of 24 years (May 2045) and is
backed by the U.S. Development Finance Corporation (DFC). Sacyr maintains its
commitment to sustainability, a cornerstone of the 21-25 Strategic Plan, with an
I. Highlights 1Q 2021 Pedemontana, Italy
Q1 2021 Results - 3 -
increasing presence in this area and in benchmark relevant index’s such as MSCI and
FTSE4Good.
• Panama
Sacyr has refunded EUR 95 million in February 2021 for the last arbitration award issued
by the International Chamber of Commerce (ICC).
Sacyr and GUPC will continue to defend their arguments in the various international
authorities (ICC, UNCITRAL) in relation to the claims filed with the ACP and the State of
Panama.
More than 5 years after its inauguration, the "Third Set of Locks" of the expansion of the
Panama Canal is a technical example of a project which reliability over the required
three-year maintenance period has been 99.97%, thanks to the efforts of more than
30,000 people who worked on it.
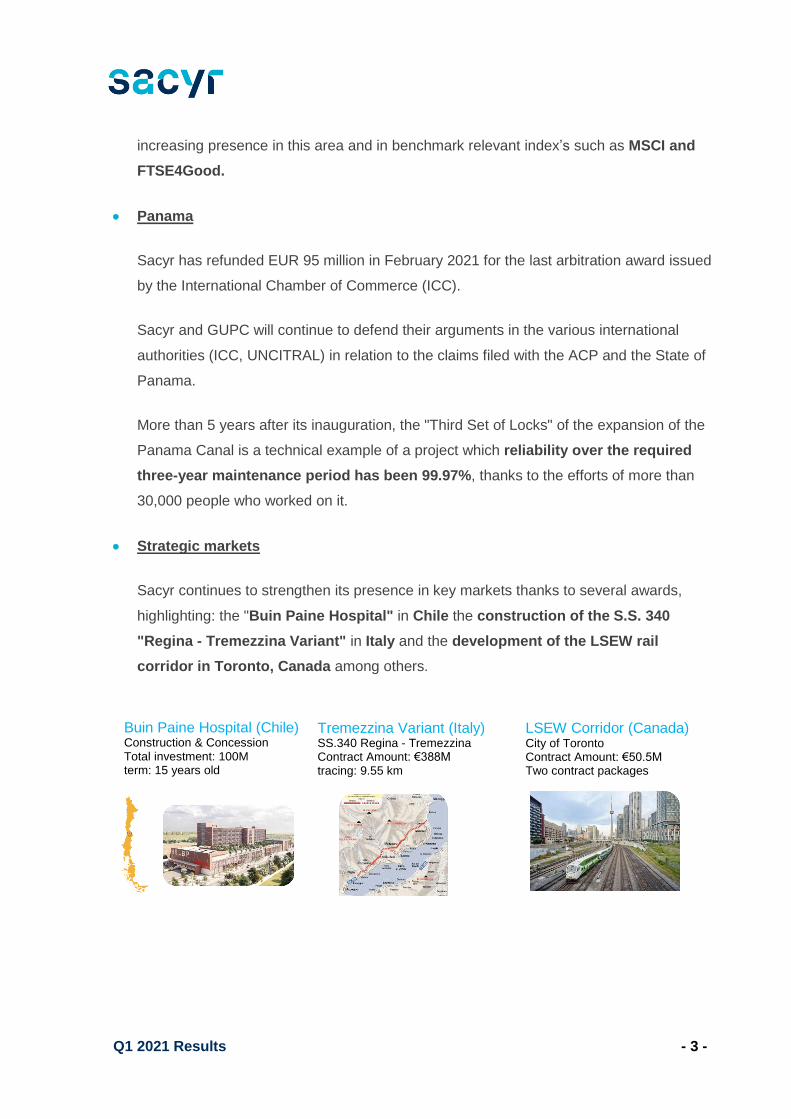
• Strategic markets
Sacyr continues to strengthen its presence in key markets thanks to several awards,
highlighting: the "Buin Paine Hospital" in Chile the construction of the S.S. 340
"Regina - Tremezzina Variant" in Italy and the development of the LSEW rail
corridor in Toronto, Canada among others.
Buin Paine Hospital (Chile) Construction & Concession Total investment: 100M term: 15 years old
Tremezzina Variant (Italy) SS.340 Regina - Tremezzina Contract Amount: €388M tracing: 9.55 km
LSEW Corridor (Canada) City of Toronto Contract Amount: €50.5M Two contract packages
Q1 2021 Results - 4 -
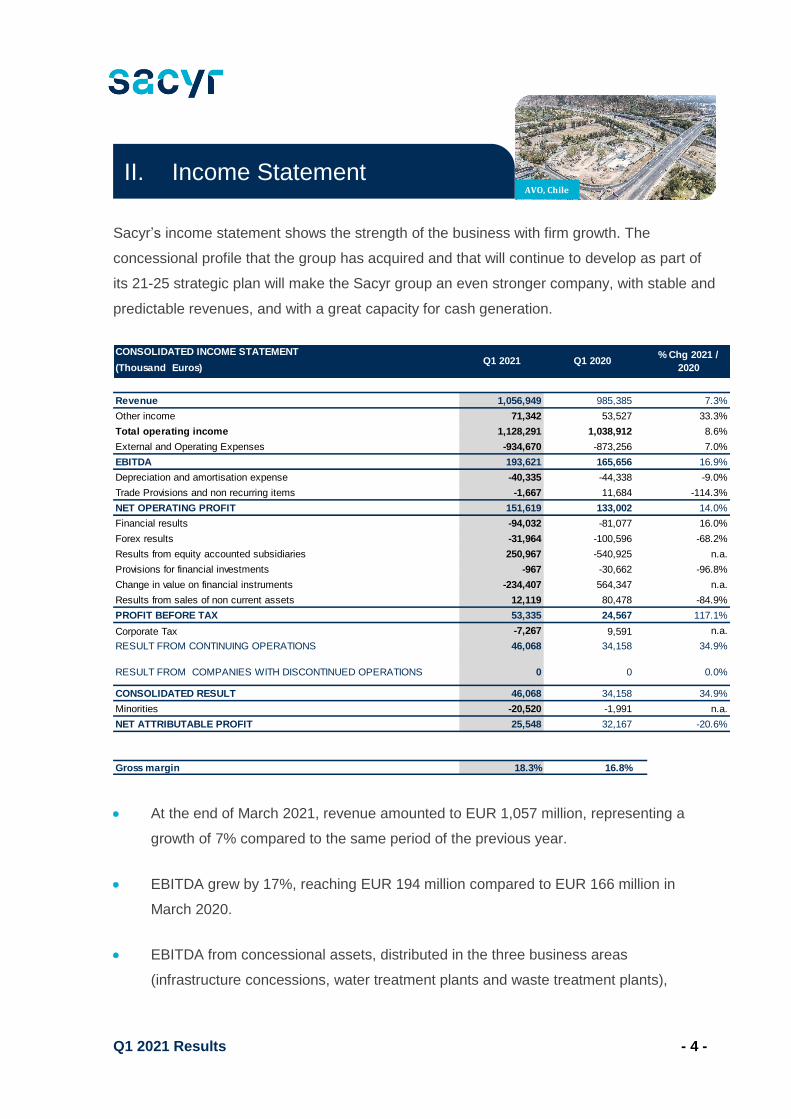
Sacyr’s income statement shows the strength of the business with firm growth. The
concessional profile that the group has acquired and that will continue to develop as part of
its 21-25 strategic plan will make the Sacyr group an even stronger company, with stable and
predictable revenues, and with a great capacity for cash generation.
• At the end of March 2021, revenue amounted to EUR 1,057 million, representing a
growth of 7% compared to the same period of the previous year.
• EBITDA grew by 17%, reaching EUR 194 million compared to EUR 166 million in
March 2020.
• EBITDA from concessional assets, distributed in the three business areas
(infrastructure concessions, water treatment plants and waste treatment plants),
CONSOLIDATED INCOME STATEMENT
(Thousand Euros)
Revenue 1,056,949 985,385 7.3%
Other income 71,342 53,527 33.3%
Total operating income 1,128,291 1,038,912 8.6%
External and Operating Expenses -934,670 -873,256 7.0%
EBITDA 193,621 165,656 16.9%
Depreciation and amortisation expense -40,335 -44,338 -9.0%
Trade Provisions and non recurring items -1,667 11,684 -114.3%
NET OPERATING PROFIT 151,619 133,002 14.0%
Financial results -94,032 -81,077 16.0%
Forex results -31,964 -100,596 -68.2%
Results from equity accounted subsidiaries 250,967 -540,925 n.a.
Provisions for financial investments -967 -30,662 -96.8%
Change in value on financial instruments -234,407 564,347 n.a.
Results from sales of non current assets 12,119 80,478 -84.9%
PROFIT BEFORE TAX 53,335 24,567 117.1%
Corporate Tax -7,267 9,591 n.a.
RESULT FROM CONTINUING OPERATIONS 46,068 34,158 34.9%
RESULT FROM COMPANIES WITH DISCONTINUED OPERATIONS 0 0 0.0%
CONSOLIDATED RESULT 46,068 34,158 34.9%
Minorities -20,520 -1,991 n.a.
NET ATTRIBUTABLE PROFIT 25,548 32,167 -20.6%
Gross margin 18.3% 16.8%
Q1 2021 Q1 2020% Chg 2021 /
2020
II. Income Statement AVO, Chile
Q1 2021 Results - 5 -
amounted to EUR 157 million, representing 81% over the total, increasing by 400 basic
points from 77% in the first quarter of 2020.
• Net operating income (EBIT) grew by 14% to EUR 152 million.
• The EBITDA margin on revenues stood at 18.3%, an improvement of 150 basic points
compared to the same period of the previous year.
• The Group's net profit at 31 March 2021 amounted to EUR 26 million.
• Operating cash flow amounted to EUR 117 million as of March 31, 2021, representing
a growth of 31%, compared to 89 million in the same period of the previous year.
Revenue
Positive performance and focus on strategic markets
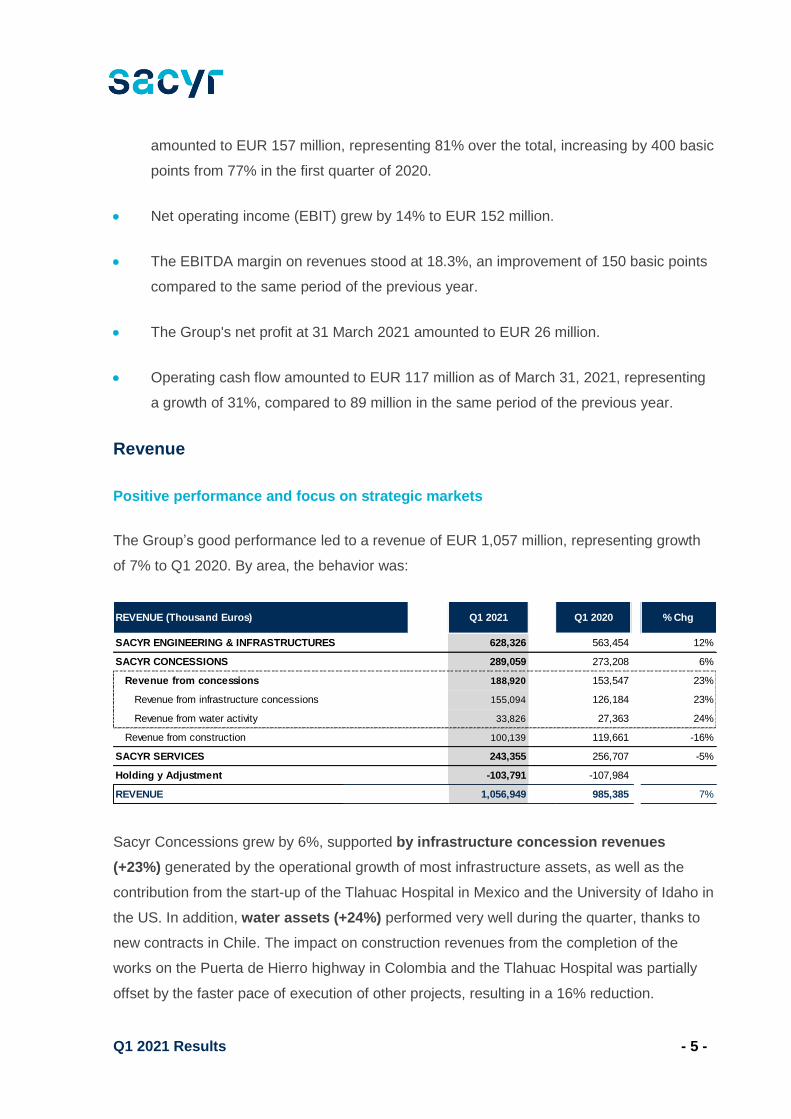
The Group’s good performance led to a revenue of EUR 1,057 million, representing growth
of 7% to Q1 2020. By area, the behavior was:
Sacyr Concessions grew by 6%, supported by infrastructure concession revenues
(+23%) generated by the operational growth of most infrastructure assets, as well as the
contribution from the start-up of the Tlahuac Hospital in Mexico and the University of Idaho in
the US. In addition, water assets (+24%) performed very well during the quarter, thanks to
new contracts in Chile. The impact on construction revenues from the completion of the
works on the Puerta de Hierro highway in Colombia and the Tlahuac Hospital was partially
offset by the faster pace of execution of other projects, resulting in a 16% reduction.
628,326 563,454 12%
SACYR CONCESSIONS 289,059 273,208 6%
Revenue from concessions 188,920 153,547 23%
Revenue from infrastructure concessions 155,094 126,184 23%
Revenue from water activity 33,826 27,363 24%
Revenue from construction 100,139 119,661 -16%
SACYR SERVICES 243,355 256,707 -5%
Holding y Adjustment -103,791 -107,984
REVENUE 1,056,949 985,385 7%
SACYR ENGINEERING & INFRASTRUCTURES
REVENUE (Thousand Euros) Q1 2021 Q1 2020 % Chg
Q1 2021 Results - 6 -
The Engineering and Infrastructure area grew by 12%, supported by the pace of billing of
projects located in the strategic markets where the Group operates (Italy, Chile, Peru,
Uruguay, Brazil, United States, United Kingdom, Portugal and Spain, among others).
The revenues of Sacyr Services activity decreased by 5%, slightly affected by the Covid-19
condition.
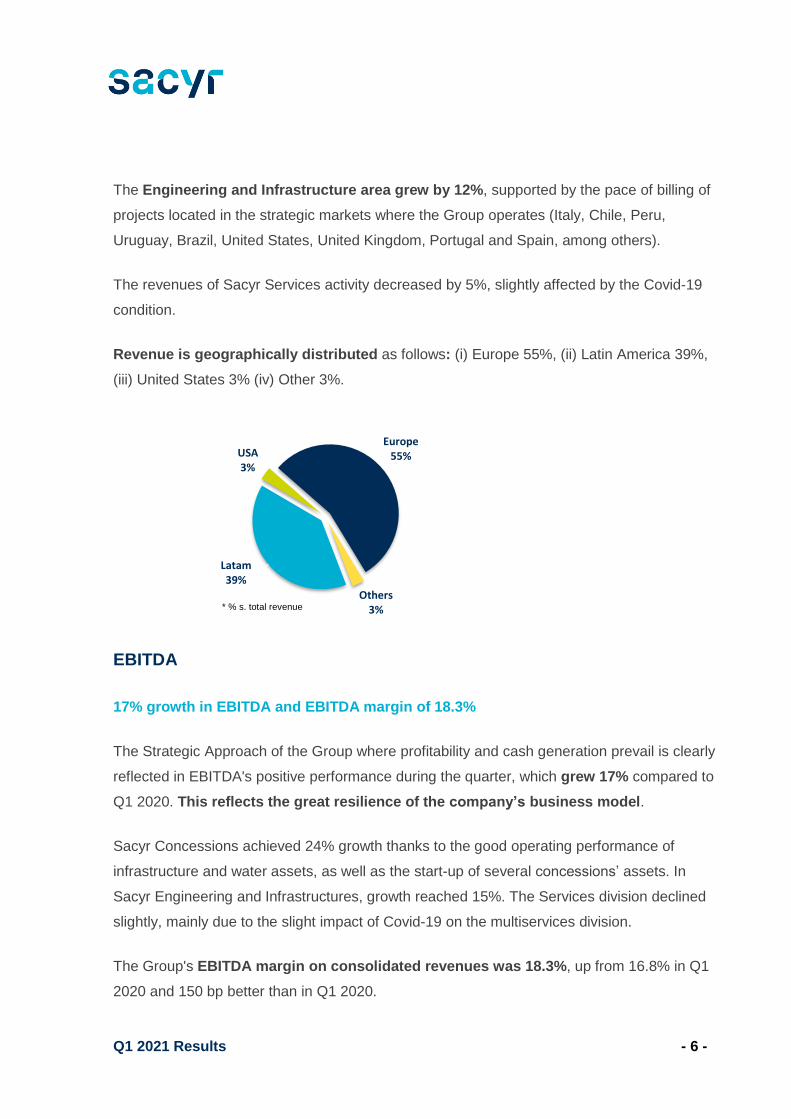
Revenue is geographically distributed as follows: (i) Europe 55%, (ii) Latin America 39%,
(iii) United States 3% (iv) Other 3%.
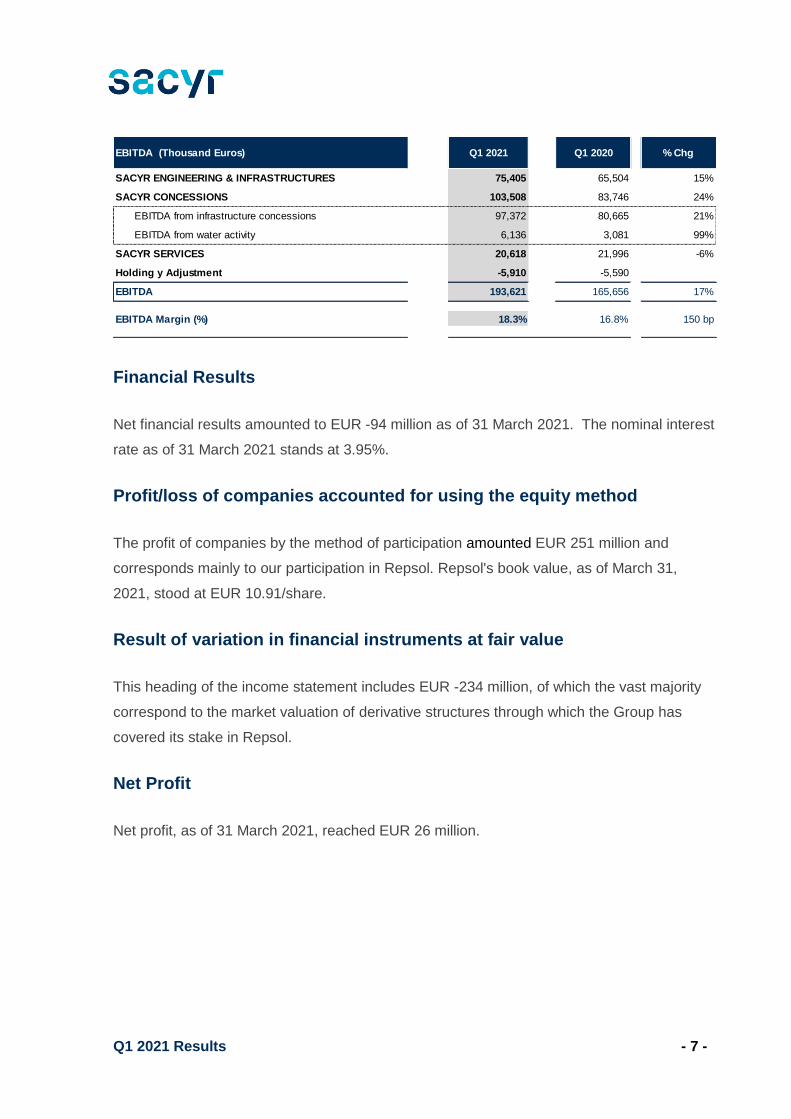
EBITDA
17% growth in EBITDA and EBITDA margin of 18.3%
The Strategic Approach of the Group where profitability and cash generation prevail is clearly
reflected in EBITDA's positive performance during the quarter, which grew 17% compared to
Q1 2020. This reflects the great resilience of the company’s business model.
Sacyr Concessions achieved 24% growth thanks to the good operating performance of
infrastructure and water assets, as well as the start-up of several concessions’ assets. In
Sacyr Engineering and Infrastructures, growth reached 15%. The Services division declined
slightly, mainly due to the slight impact of Covid-19 on the multiservices division.
The Group's EBITDA margin on consolidated revenues was 18.3%, up from 16.8% in Q1
2020 and 150 bp better than in Q1 2020.
Latam39%
USA3%
Europe55%
Others3%* % s. total revenue
Q1 2021 Results - 7 -
Financial Results
Net financial results amounted to EUR -94 million as of 31 March 2021. The nominal interest
rate as of 31 March 2021 stands at 3.95%.
Profit/loss of companies accounted for using the equity method
The profit of companies by the method of participation amounted EUR 251 million and
corresponds mainly to our participation in Repsol. Repsol's book value, as of March 31,
2021, stood at EUR 10.91/share.
Result of variation in financial instruments at fair value
This heading of the income statement includes EUR -234 million, of which the vast majority
correspond to the market valuation of derivative structures through which the Group has
covered its stake in Repsol.
Net Profit
Net profit, as of 31 March 2021, reached EUR 26 million.
75,405 65,504 15%
SACYR CONCESSIONS 103,508 83,746 24%
EBITDA from infrastructure concessions 97,372 80,665 21%
EBITDA from water activity 6,136 3,081 99%
SACYR SERVICES 20,618 21,996 -6%
Holding y Adjustment -5,910 -5,590
EBITDA 193,621 165,656 17%
EBITDA Margin (%) 18.3% 16.8% 150 bp
SACYR ENGINEERING & INFRASTRUCTURES
Q1 2020 % ChgEBITDA (Thousand Euros) Q1 2021
Q1 2021 Results - 8 -
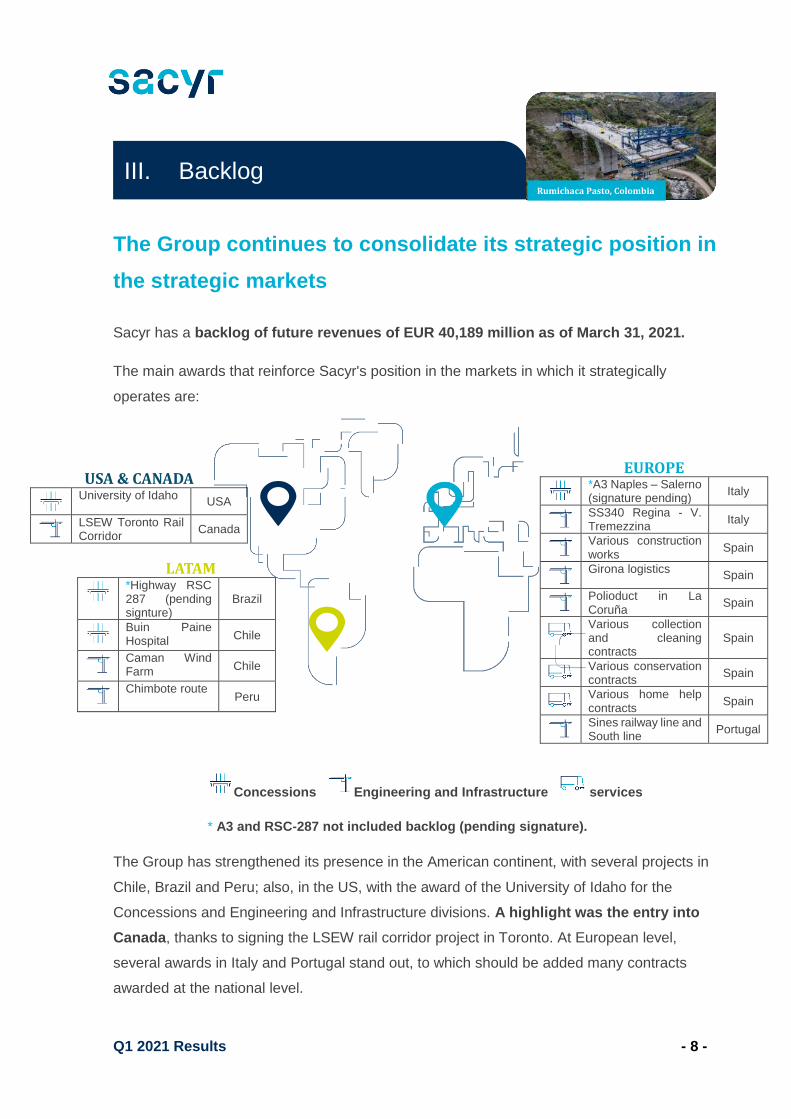
The Group continues to consolidate its strategic position in
the strategic markets
Sacyr has a backlog of future revenues of EUR 40,189 million as of March 31, 2021.
The main awards that reinforce Sacyr's position in the markets in which it strategically
operates are:
Concessions Engineering and Infrastructure services
* A3 and RSC-287 not included backlog (pending signature).
The Group has strengthened its presence in the American continent, with several projects in
Chile, Brazil and Peru; also, in the US, with the award of the University of Idaho for the
Concessions and Engineering and Infrastructure divisions. A highlight was the entry into
Canada, thanks to signing the LSEW rail corridor project in Toronto. At European level,
several awards in Italy and Portugal stand out, to which should be added many contracts
awarded at the national level.
USA & CANADA
University of Idaho
USA
LSEW Toronto Rail Corridor
Canada
LATAM
*Highway RSC 287 (pending signture)
Brazil
Buin Paine Hospital Chile
Caman Wind Farm Chile
Chimbote route
Peru
EUROPE
*A3 Naples – Salerno (signature pending)
Italy
SS340 Regina - V. Tremezzina
Italy
Various construction works
Spain
Girona logistics
Spain
Polioduct in La Coruña
Spain
Various collection and cleaning contracts
Spain
Various conservation contracts
Spain
Various home help contracts
Spain
Sines railway line and South line
Portugal
III. Backlog Rumichaca Pasto, Colombia
Q1 2021 Results - 9 -
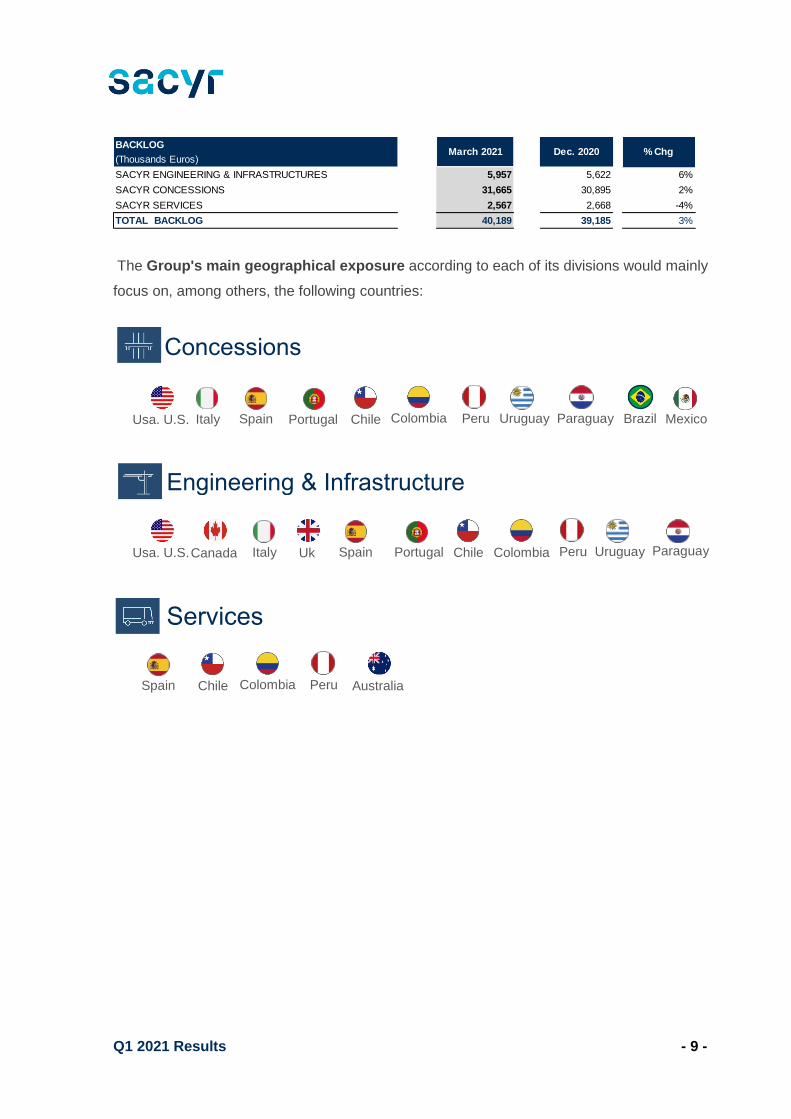
The Group's main geographical exposure according to each of its divisions would mainly
focus on, among others, the following countries:
BACKLOG
(Thousands Euros)
SACYR ENGINEERING & INFRASTRUCTURES 5,957 5,622 6%
SACYR CONCESSIONS 31,665 30,895 2%
SACYR SERVICES 2,567 2,668 -4%
TOTAL BACKLOG 40,189 39,185 3%
March 2021 % ChgDec. 2020
Concessions
Usa. U.S. Italy Colombia Chile
Australia
Spain
Peru Uruguay Paraguay Portugal
Colombia Chile Spain
Peru
Paraguay Portugal
Services
Brazil Mexico
Usa. U.S. Canada Italy Colombia Chile Uk Spain
Peru Uruguay
Engineering & Infrastructure
Q1 2021 Results - 10 -
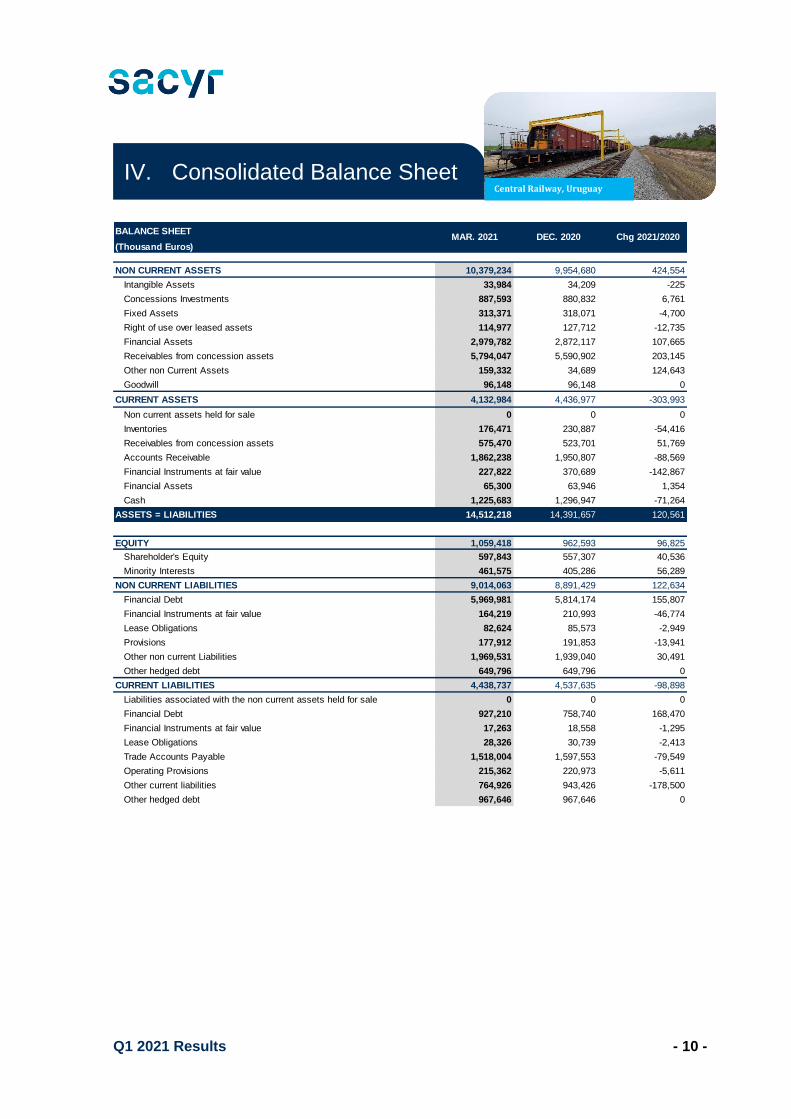
BALANCE SHEET
(Thousand Euros)
NON CURRENT ASSETS 10,379,234 9,954,680 424,554
Intangible Assets 33,984 34,209 -225
Concessions Investments 887,593 880,832 6,761
Fixed Assets 313,371 318,071 -4,700
Right of use over leased assets 114,977 127,712 -12,735
Financial Assets 2,979,782 2,872,117 107,665
Receivables from concession assets 5,794,047 5,590,902 203,145
Other non Current Assets 159,332 34,689 124,643
Goodwill 96,148 96,148 0
CURRENT ASSETS 4,132,984 4,436,977 -303,993
Non current assets held for sale 0 0 0
Inventories 176,471 230,887 -54,416
Receivables from concession assets 575,470 523,701 51,769
Accounts Receivable 1,862,238 1,950,807 -88,569
Financial Instruments at fair value 227,822 370,689 -142,867
Financial Assets 65,300 63,946 1,354
Cash 1,225,683 1,296,947 -71,264
ASSETS = LIABILITIES 14,512,218 14,391,657 120,561
EQUITY 1,059,418 962,593 96,825
Shareholder's Equity 597,843 557,307 40,536
Minority Interests 461,575 405,286 56,289
NON CURRENT LIABILITIES 9,014,063 8,891,429 122,634
Financial Debt 5,969,981 5,814,174 155,807
Financial Instruments at fair value 164,219 210,993 -46,774
Lease Obligations 82,624 85,573 -2,949
Provisions 177,912 191,853 -13,941
Other non current Liabilities 1,969,531 1,939,040 30,491
Other hedged debt 649,796 649,796 0
CURRENT LIABILITIES 4,438,737 4,537,635 -98,898
Liabilities associated with the non current assets held for sale 0 0 0
Financial Debt 927,210 758,740 168,470
Financial Instruments at fair value 17,263 18,558 -1,295
Lease Obligations 28,326 30,739 -2,413
Trade Accounts Payable 1,518,004 1,597,553 -79,549
Operating Provisions 215,362 220,973 -5,611
Other current liabilities 764,926 943,426 -178,500
Other hedged debt 967,646 967,646 0
Chg 2021/2020MAR. 2021 DEC. 2020
IV. Consolidated Balance Sheet Central Railway, Uruguay
Q1 2021 Results - 11 -
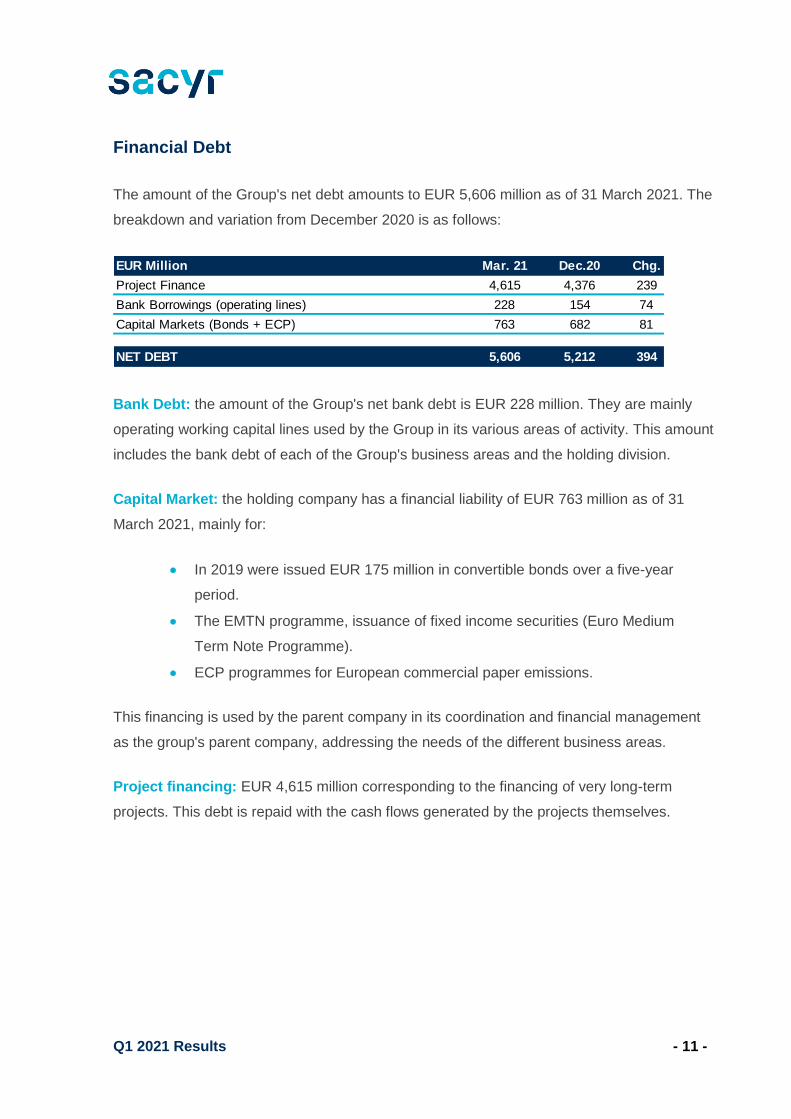
Financial Debt
The amount of the Group's net debt amounts to EUR 5,606 million as of 31 March 2021. The
breakdown and variation from December 2020 is as follows:
Bank Debt: the amount of the Group's net bank debt is EUR 228 million. They are mainly
operating working capital lines used by the Group in its various areas of activity. This amount
includes the bank debt of each of the Group's business areas and the holding division.
Capital Market: the holding company has a financial liability of EUR 763 million as of 31
March 2021, mainly for:
• In 2019 were issued EUR 175 million in convertible bonds over a five-year
period.
• The EMTN programme, issuance of fixed income securities (Euro Medium
Term Note Programme).
• ECP programmes for European commercial paper emissions.
This financing is used by the parent company in its coordination and financial management
as the group's parent company, addressing the needs of the different business areas.
Project financing: EUR 4,615 million corresponding to the financing of very long-term
projects. This debt is repaid with the cash flows generated by the projects themselves.
Mar. 21 Dec.20 Chg.
Project Finance 4,615 4,376 239
Bank Borrowings (operating lines) 228 154 74
Capital Markets (Bonds + ECP) 763 682 81
NET DEBT 5,606 5,212 394
EUR Million
Q1 2021 Results - 12 -
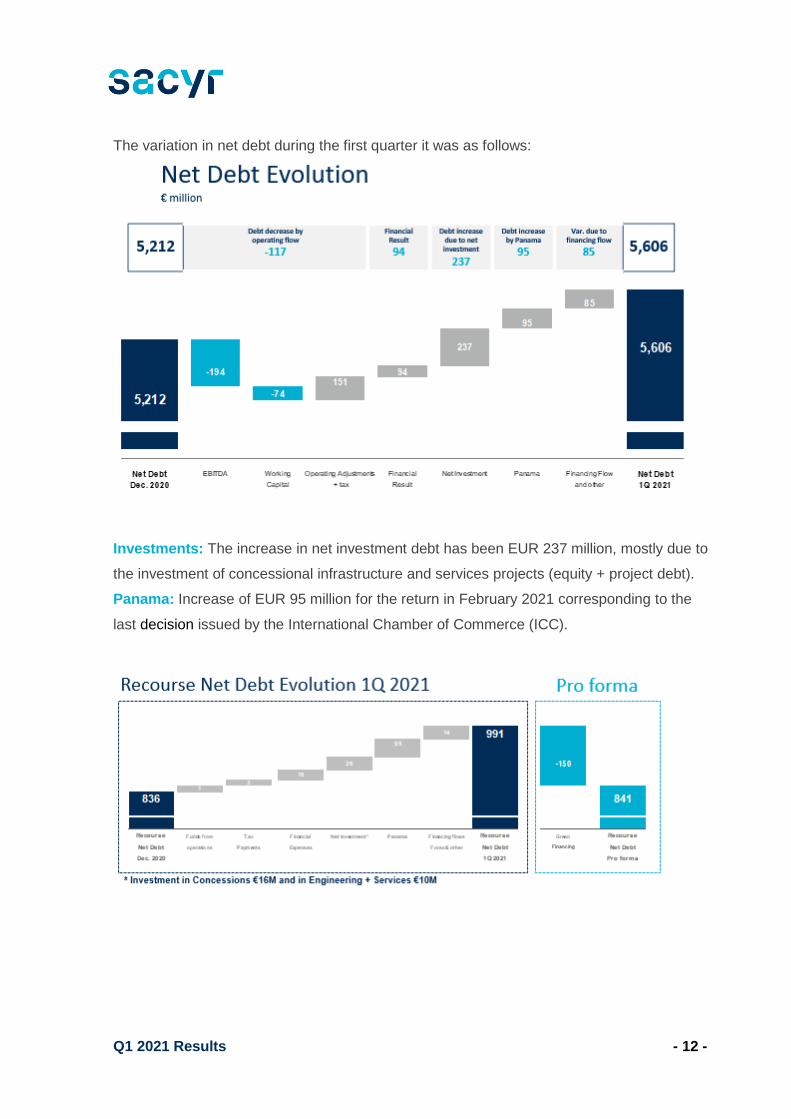
The variation in net debt during the first quarter it was as follows:
Investments: The increase in net investment debt has been EUR 237 million, mostly due to
the investment of concessional infrastructure and services projects (equity + project debt).
Panama: Increase of EUR 95 million for the return in February 2021 corresponding to the
last decision issued by the International Chamber of Commerce (ICC).
Q1 2021 Results - 13 -
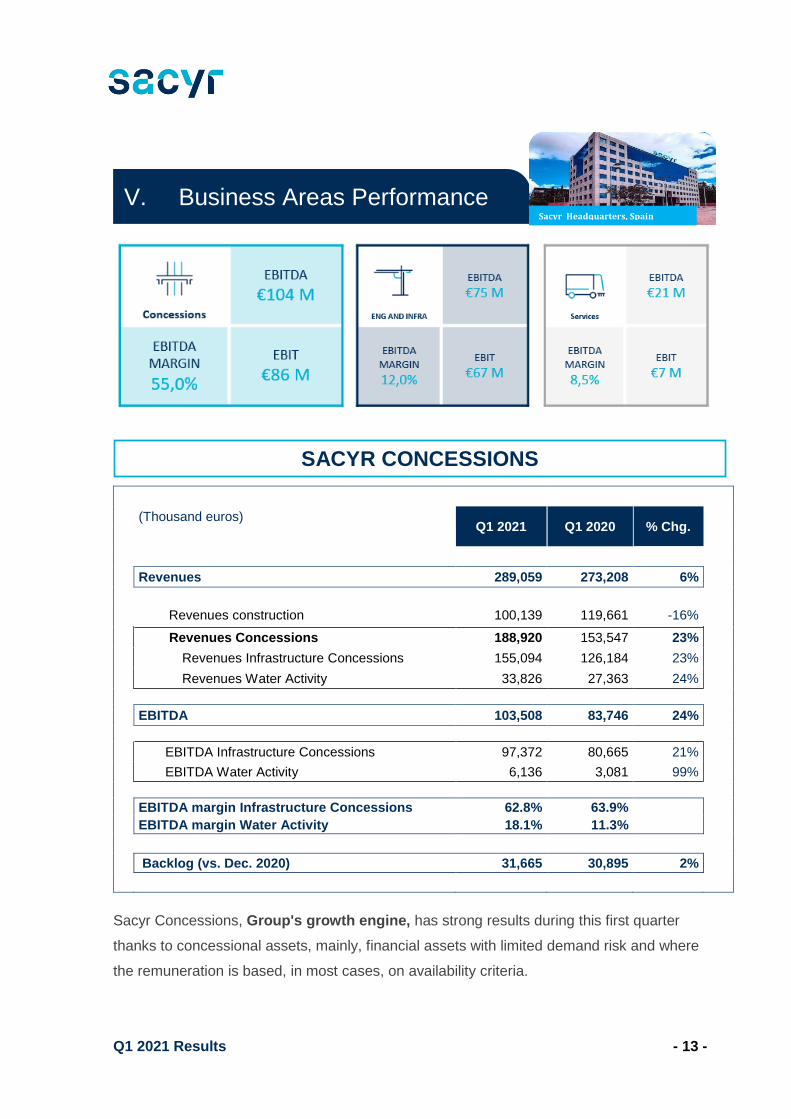
(Thousand euros) Q1 2021 Q1 2020 % Chg.
Revenues 289,059 273,208 6%
Revenues construction 100,139 119,661 -16%
Revenues Concessions 188,920 153,547 23%
Revenues Infrastructure Concessions 155,094 126,184 23%
Revenues Water Activity 33,826 27,363 24%
EBITDA 103,508 83,746 24%
EBITDA Infrastructure Concessions 97,372 80,665 21%
EBITDA Water Activity 6,136 3,081 99%
EBITDA margin Infrastructure Concessions 62.8% 63.9%
EBITDA margin Water Activity 18.1% 11.3%
Backlog (vs. Dec. 2020) 31,665 30,895 2%
Sacyr Concessions, Group's growth engine, has strong results during this first quarter
thanks to concessional assets, mainly, financial assets with limited demand risk and where
the remuneration is based, in most cases, on availability criteria.
SACYR CONCESSIONS
V. Business Areas Performance Sacyr Headquarters, Spain
Q1 2021 Results - 14 -
• As of March 31, 2021, the revenue from the concession activity amounted to
EUR 289 million, representing a growth of 6% compared to the same period of
the previous year, thanks to the concessional revenues and the contribution of
the water segment.
• The revenues from infrastructure concessions (+23%) reflect the operational
growth of most infrastructure assets, as well as the start-up contribution of
Tlahuac Hospital in Mexico and the University of Idaho. In addition, water
assets (+24%) also performed well for the contribution of the five full water
cycles in Chile, among others.
• The impact on construction revenues by the completion of the works in the
Puerta de Hierro Highway in Colombia and the Tlahuac hospital, is partially
offset by the higher pace of execution in other projects, obtaining a reduction of
16%.
• The good performance in revenues is accompanied by strong growth in the
EBITDA. At the end of the first quarter of the year it amounted to EUR 104
million, an increase of 24% compared to EUR 84 million in the same period of
the previous year. This increase is due to the commissioning of several
tranches and projects, as well as by the water activity.
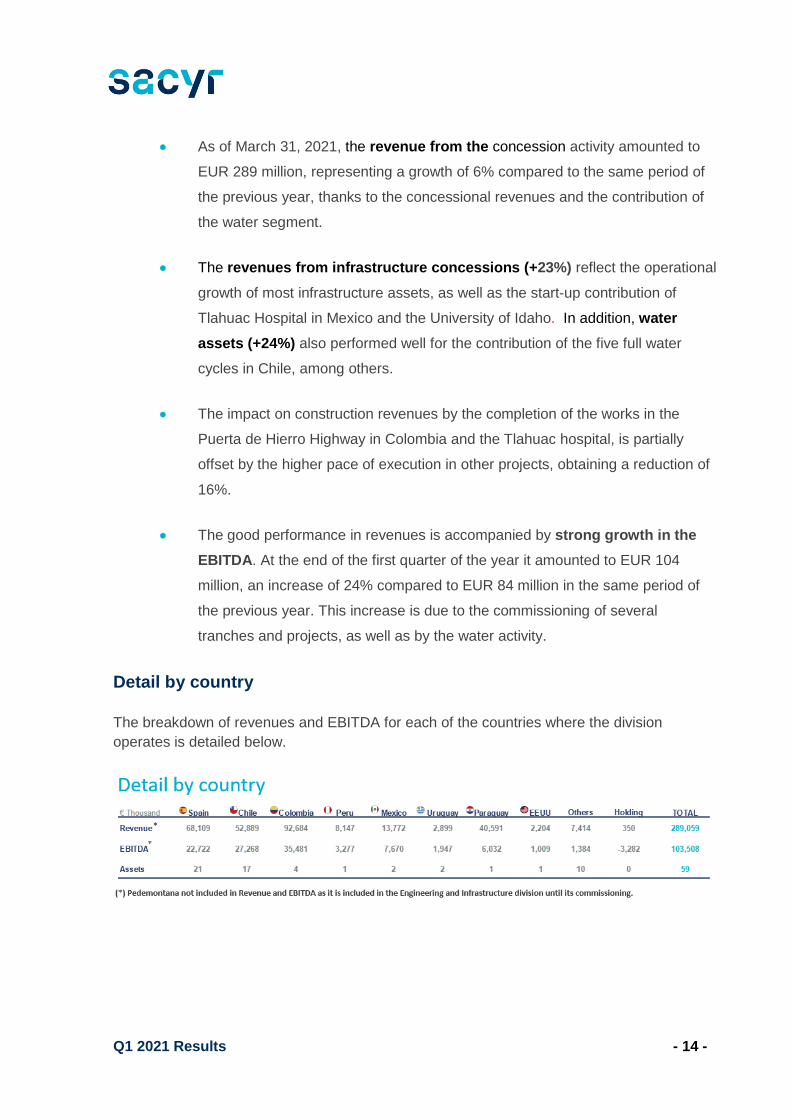
Detail by country
The breakdown of revenues and EBITDA for each of the countries where the division
operates is detailed below.
Q1 2021 Results - 15 -
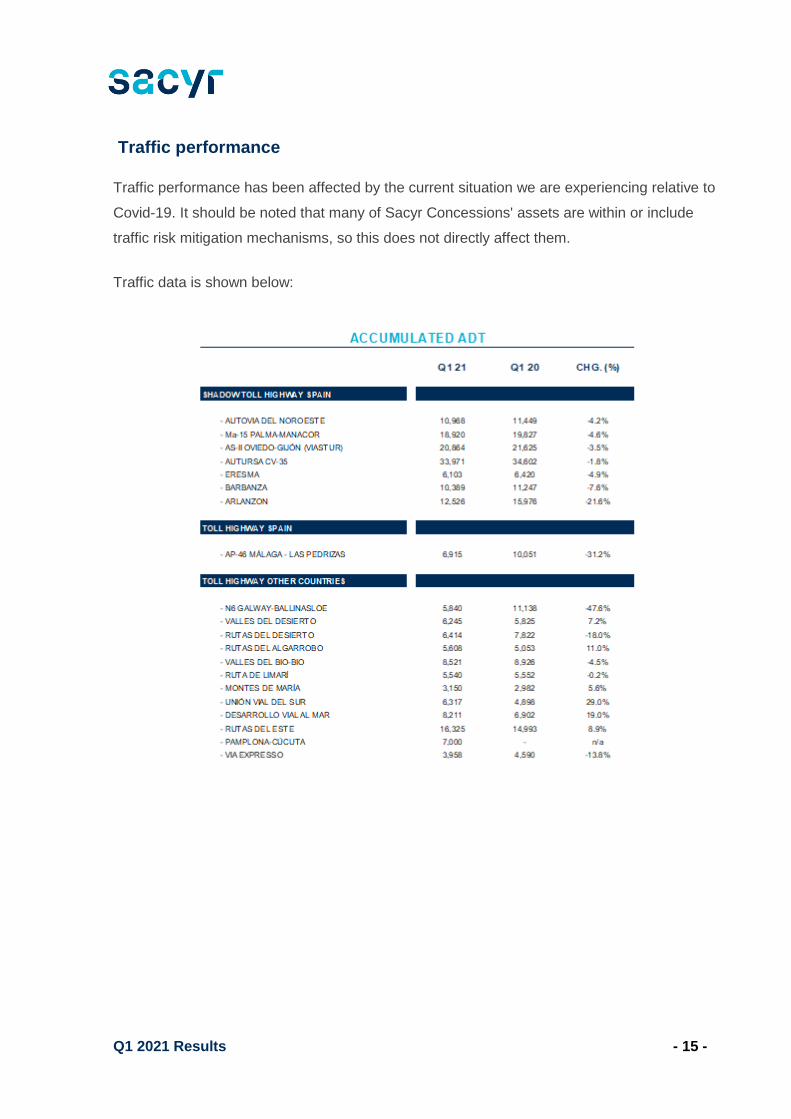
Traffic performance
Traffic performance has been affected by the current situation we are experiencing relative to
Covid-19. It should be noted that many of Sacyr Concessions' assets are within or include
traffic risk mitigation mechanisms, so this does not directly affect them.
Traffic data is shown below:
Q1 2021 Results - 16 -
(Thousand euros) Q1 2021 Q1 2020 % Chg.
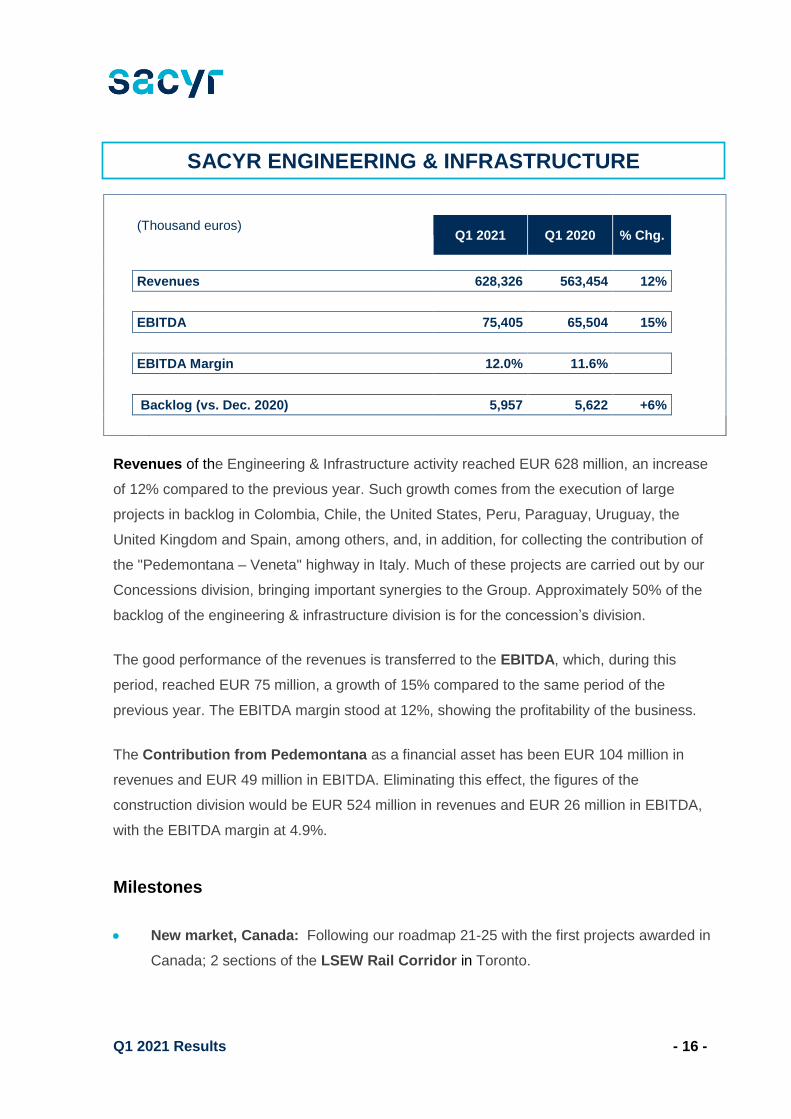
Revenues 628,326 563,454 12%
EBITDA 75,405 65,504 15%
EBITDA Margin 12.0% 11.6%
Backlog (vs. Dec. 2020) 5,957 5,622 +6%
Revenues of the Engineering & Infrastructure activity reached EUR 628 million, an increase
of 12% compared to the previous year. Such growth comes from the execution of large
projects in backlog in Colombia, Chile, the United States, Peru, Paraguay, Uruguay, the
United Kingdom and Spain, among others, and, in addition, for collecting the contribution of
the "Pedemontana – Veneta" highway in Italy. Much of these projects are carried out by our
Concessions division, bringing important synergies to the Group. Approximately 50% of the
backlog of the engineering & infrastructure division is for the concession’s division.
The good performance of the revenues is transferred to the EBITDA, which, during this
period, reached EUR 75 million, a growth of 15% compared to the same period of the
previous year. The EBITDA margin stood at 12%, showing the profitability of the business.
The Contribution from Pedemontana as a financial asset has been EUR 104 million in
revenues and EUR 49 million in EBITDA. Eliminating this effect, the figures of the
construction division would be EUR 524 million in revenues and EUR 26 million in EBITDA,
with the EBITDA margin at 4.9%.
Milestones
• New market, Canada: Following our roadmap 21-25 with the first projects awarded in
Canada; 2 sections of the LSEW Rail Corridor in Toronto.
SACYR ENGINEERING & INFRASTRUCTURE
Q1 2021 Results - 17 -
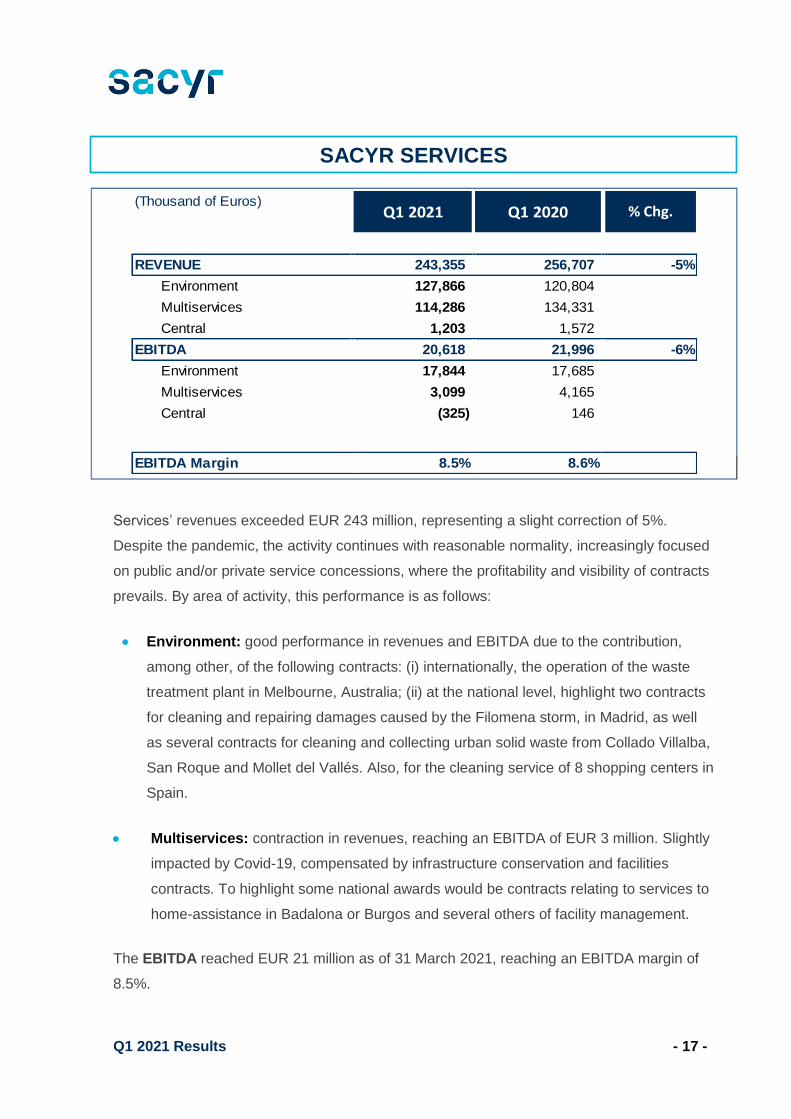
Services’ revenues exceeded EUR 243 million, representing a slight correction of 5%.
Despite the pandemic, the activity continues with reasonable normality, increasingly focused
on public and/or private service concessions, where the profitability and visibility of contracts
prevails. By area of activity, this performance is as follows:
• Environment: good performance in revenues and EBITDA due to the contribution,
among other, of the following contracts: (i) internationally, the operation of the waste
treatment plant in Melbourne, Australia; (ii) at the national level, highlight two contracts
for cleaning and repairing damages caused by the Filomena storm, in Madrid, as well
as several contracts for cleaning and collecting urban solid waste from Collado Villalba,
San Roque and Mollet del Vallés. Also, for the cleaning service of 8 shopping centers in
Spain.
• Multiservices: contraction in revenues, reaching an EBITDA of EUR 3 million. Slightly
impacted by Covid-19, compensated by infrastructure conservation and facilities
contracts. To highlight some national awards would be contracts relating to services to
home-assistance in Badalona or Burgos and several others of facility management.
The EBITDA reached EUR 21 million as of 31 March 2021, reaching an EBITDA margin of
8.5%.
(Thousand of Euros)
REVENUE 243,355 256,707 -5%
Environment 127,866 120,804
Multiservices 114,286 134,331
Central 1,203 1,572
EBITDA 20,618 21,996 -6%
Environment 17,844 17,685
Multiservices 3,099 4,165
Central (325) 146
EBITDA Margin 8.5% 8.6%
Q1 2021 Q1 2020 % Chg.
SACYR SERVICES
Q1 2021 Results - 18 -
The Sacyr Group considers Sustainability as a cornerstone of the Strategic Plan, with the
aim of moving the society towards a sustainable future through the development and
management of infrastructures that generate a positive social, economic and environmental
impact, for the benefit of all our stakeholders and those regions in which we are present.
We are called to be a reference Group in the development of infrastructures for the future
of society, thanks to our innovative proposal, respect of the environment and the commitment
to the professional and personal development of a diverse and involved workforce.
Our vision for sustainability is part of our Board of Directors' commitment, which recently
approved the Sustainability Framework Policy for the Group, establishing a new strategic
framework developed in the "Sacyr Sustainable Plan 2025", our action plan for
sustainability for the period 2021-2025. In this way, we ensure that all activities carried out
aim and promote long-term value creation for society, for our shareholders and for all our
stakeholders, contributing to the fulfilment of the Sustainable Development Goals (SDGs).
In addition, the Sustainability and Corporate Governance Commission and the
Sustainability Committee, are responsible for proposing, implementing and supervising all
the initiatives that the Group develops in this field.
This balance between profitability, value creation and sustainability are achieved through
ethical, transparent and responsible management, contributing to solving the
challenges of the planet's sustainability, as our main environmental, social and
governance outcomes show.
VI. Boosting Sustainability
TRANSPARENCY
✓ Creation SUSTAINABILITY COMMISSION AND CORPORATE GOVERNANCE
✓ Creation SUSTAINABILITY COMMITTEE
✓ Certification CSR Management System
Q1 2021 Results - 19 -
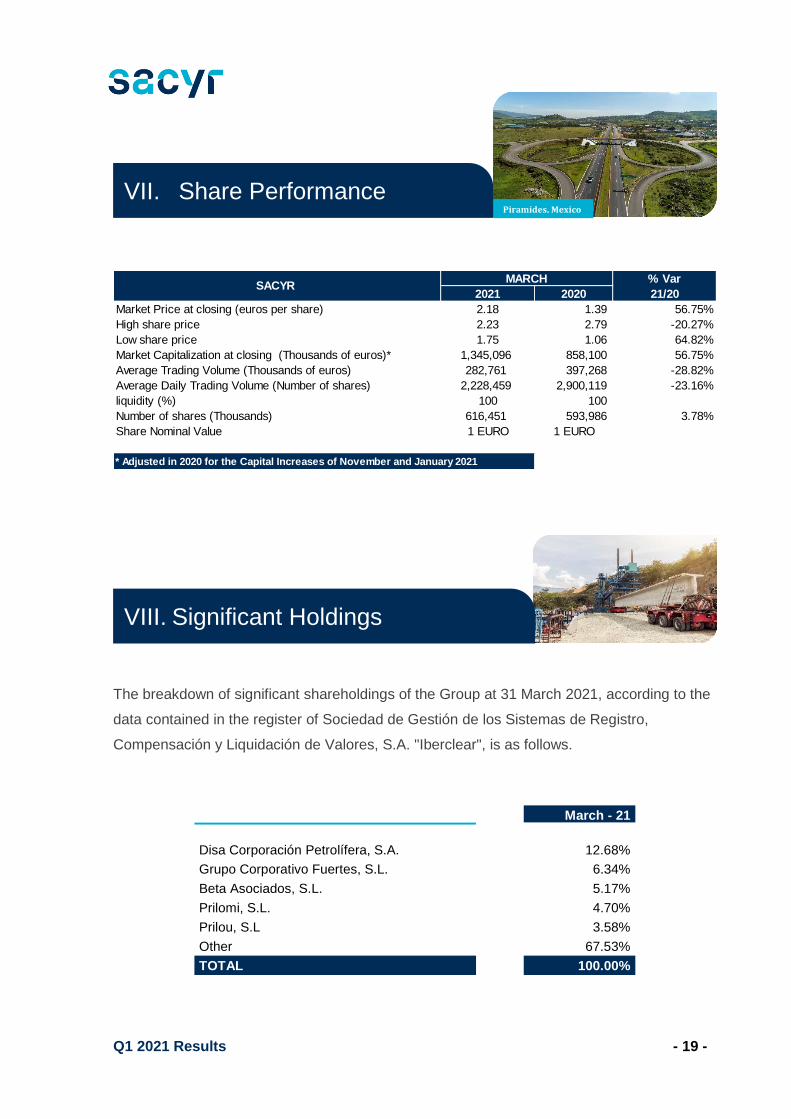
The breakdown of significant shareholdings of the Group at 31 March 2021, according to the
data contained in the register of Sociedad de Gestión de los Sistemas de Registro,
Compensación y Liquidación de Valores, S.A. "Iberclear", is as follows.
March - 21
Disa Corporación Petrolífera, S.A. 12.68%
Grupo Corporativo Fuertes, S.L. 6.34%
Beta Asociados, S.L. 5.17%
Prilomi, S.L. 4.70%
Prilou, S.L 3.58%
Other 67.53%
TOTAL 100.00%
% Var
2021 2020 21/20
Market Price at closing (euros per share) 2.18 1.39 56.75%
High share price 2.23 2.79 -20.27%
Low share price 1.75 1.06 64.82%
Market Capitalization at closing (Thousands of euros)* 1,345,096 858,100 56.75%
Average Trading Volume (Thousands of euros) 282,761 397,268 -28.82%
Average Daily Trading Volume (Number of shares) 2,228,459 2,900,119 -23.16%
liquidity (%) 100 100
Number of shares (Thousands) 616,451 593,986 3.78%
Share Nominal Value 1 EURO 1 EURO
* Adjusted in 2020 for the Capital Increases of November and January 2021
SACYR MARCH
VII. Share Performance
VIII. Significant Holdings
Piramides, Mexico
Q1 2021 Results - 20 -
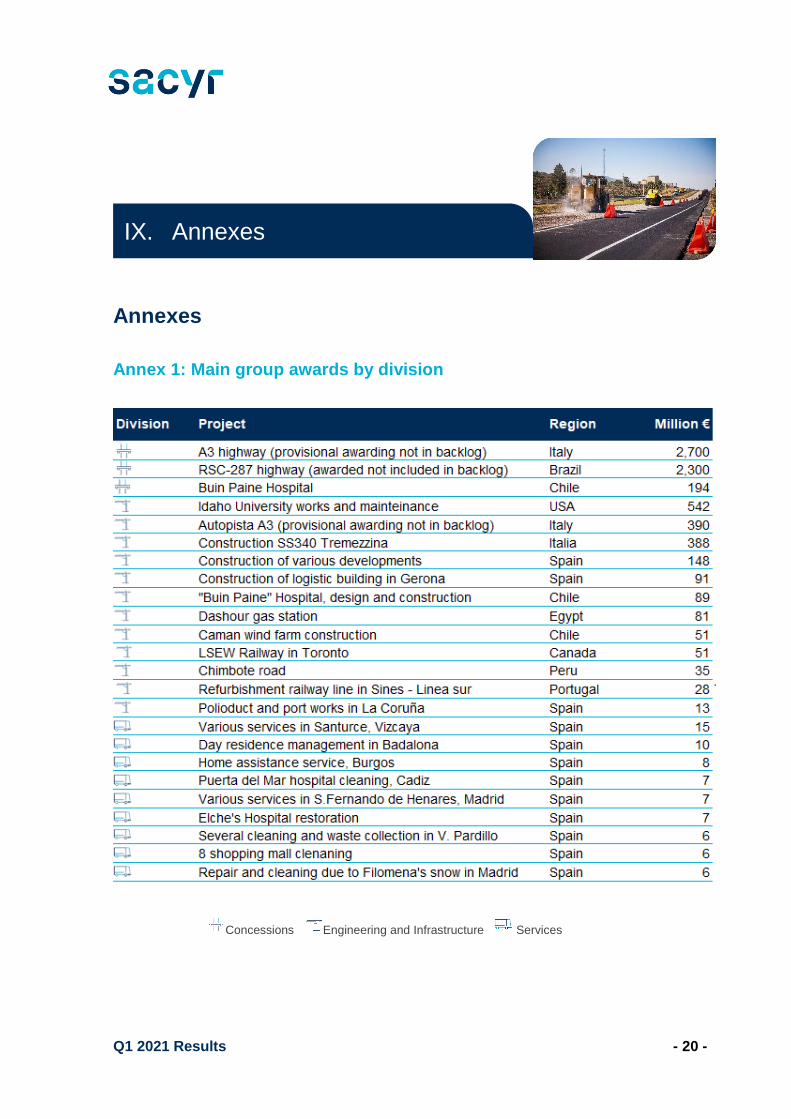
Annexes
Annex 1: Main group awards by division
Concessions Engineering and Infrastructure Services
IX. Annexes
Q1 2021 Results - 21 -
sacyr.com
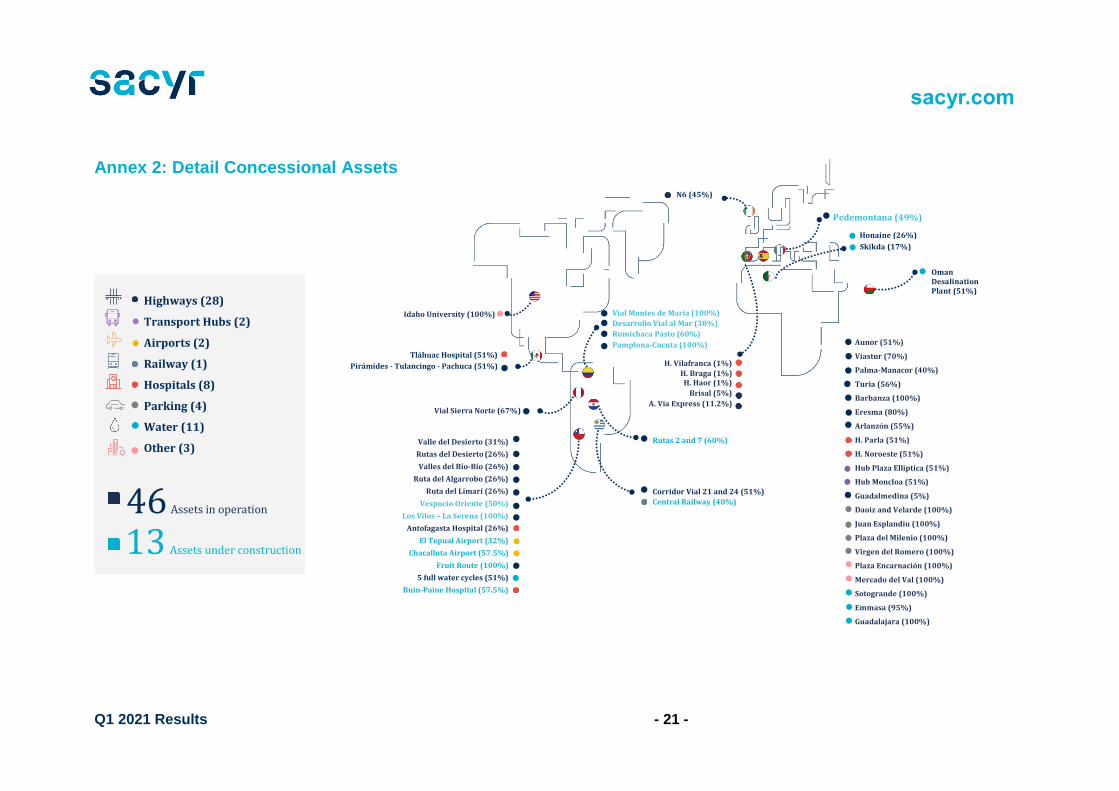
Annex 2: Detail Concessional Assets
Highways (28)
Transport Hubs (2)
Airports (2)
Railway (1)
Hospitals (8)
Parking (4)
Water (11)
Other (3)
13 Assets under construction
46 Assets in operation
Tláhuac Hospital (51%) Pirámides - Tulancingo - Pachuca (51%)
Vial Sierra Norte (67%)
Valle del Desierto (31%) Rutas del Desierto (26%) Valles del Bío-Bío (26%)
Ruta del Algarrobo (26%) Ruta del Limarí (26%)
Vespucio Oriente (50%) Los Vilos – La Serena (100%)
Antofagasta Hospital (26%) El Tepual Airport (32%)
Chacalluta Airport (57.5%) Fruit Route (100%)
5 full water cycles (51%) Buin-Paine Hospital (57.5%)
H. Vilafranca (1%) H. Braga (1%) H. Haor (1%)
Brisal (5%) A. Via Express (11.2%)
N6 (45%)
Pedemontana (49%)
Corridor Vial 21 and 24 (51%)
Central Railway (40%)
Rutas 2 and 7 (60%)
Aunor (51%) Viastur (70%) Palma-Manacor (40%) Turia (56%) Barbanza (100%) Eresma (80%) Arlanzón (55%) H. Parla (51%) H. Noroeste (51%) Hub Plaza Elliptica (51%) Hub Moncloa (51%) Guadalmedina (5%) Daoiz and Velarde (100%) Juan Esplandiu (100%) Plaza del Milenio (100%) Virgen del Romero (100%) Plaza Encarnación (100%) Mercado del Val (100%) Sotogrande (100%) Emmasa (95%) Guadalajara (100%)
Vial Montes de María (100%)
Desarrollo Vial al Mar (38%)
Rumichaca Pasto (60%) Pamplona-Cucuta (100%)
Oman Desalination Plant (51%)
Honaine (26%)
Skikda (17%)
Idaho University (100%)
Q1 2021 Results - 22 -
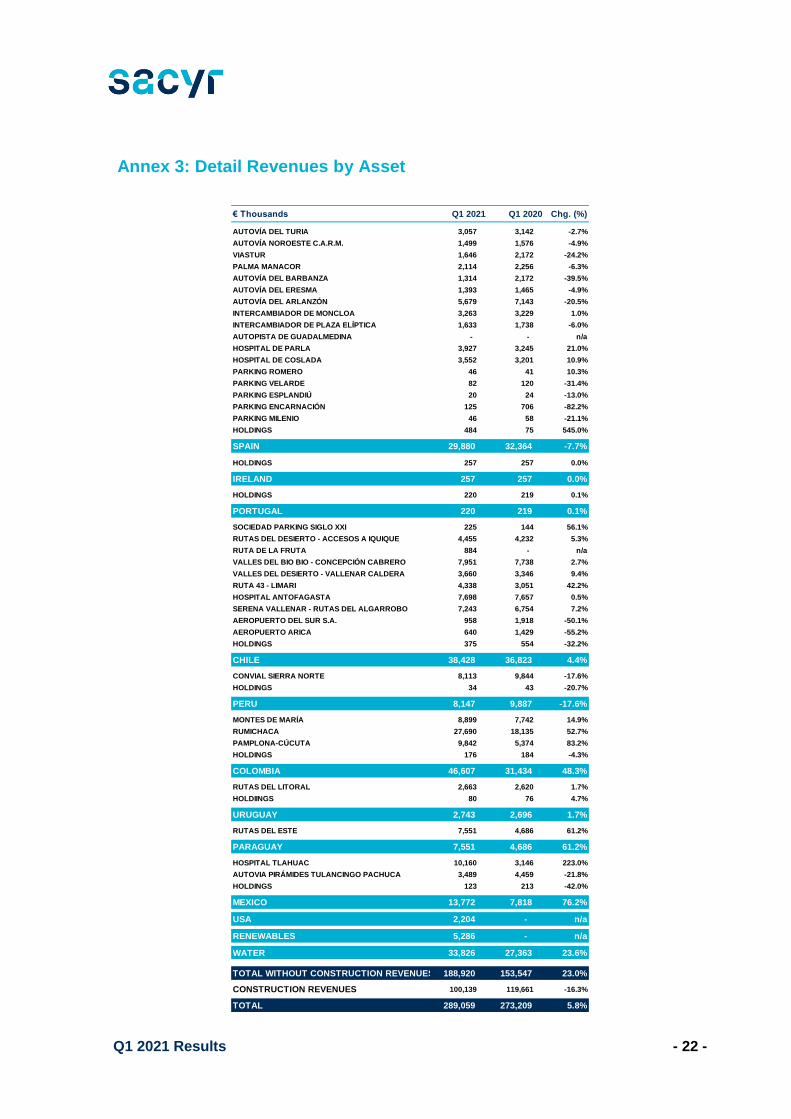
Annex 3: Detail Revenues by Asset
€ Thousands Q1 2021 Q1 2020 Chg. (%)
AUTOVÍA DEL TURIA 3,057 3,142 -2.7%
AUTOVÍA NOROESTE C.A.R.M. 1,499 1,576 -4.9%
VIASTUR 1,646 2,172 -24.2%
PALMA MANACOR 2,114 2,256 -6.3%
AUTOVÍA DEL BARBANZA 1,314 2,172 -39.5%
AUTOVÍA DEL ERESMA 1,393 1,465 -4.9%
AUTOVÍA DEL ARLANZÓN 5,679 7,143 -20.5%
INTERCAMBIADOR DE MONCLOA 3,263 3,229 1.0%
INTERCAMBIADOR DE PLAZA ELÍPTICA 1,633 1,738 -6.0%
AUTOPISTA DE GUADALMEDINA - - n/a
HOSPITAL DE PARLA 3,927 3,245 21.0%
HOSPITAL DE COSLADA 3,552 3,201 10.9%
PARKING ROMERO 46 41 10.3%
PARKING VELARDE 82 120 -31.4%
PARKING ESPLANDIÚ 20 24 -13.0%
PARKING ENCARNACIÓN 125 706 -82.2%
PARKING MILENIO 46 58 -21.1%
HOLDINGS 484 75 545.0%AEROPUERTO DE MURCIA CONCESIONARIA -1
SPAIN 29,880 32,364 -7.7%
HOLDINGS 257 257 0.0%
IRELAND 257 257 0.0%
HOLDINGS 220 219 0.1%
PORTUGAL 220 219 0.1%
SOCIEDAD PARKING SIGLO XXI 225 144 56.1%
RUTAS DEL DESIERTO - ACCESOS A IQUIQUE 4,455 4,232 5.3%
RUTA DE LA FRUTA 884 - n/a
VALLES DEL BIO BIO - CONCEPCIÓN CABRERO 7,951 7,738 2.7%
VALLES DEL DESIERTO - VALLENAR CALDERA 3,660 3,346 9.4%
RUTA 43 - LIMARI 4,338 3,051 42.2%
HOSPITAL ANTOFAGASTA 7,698 7,657 0.5%
SERENA VALLENAR - RUTAS DEL ALGARROBO 7,243 6,754 7.2%
AEROPUERTO DEL SUR S.A. 958 1,918 -50.1%
AEROPUERTO ARICA 640 1,429 -55.2%
HOLDINGS 375 554 -32.2%
CHILE 38,428 36,823 4.4%
CONVIAL SIERRA NORTE 8,113 9,844 -17.6%
HOLDINGS 34 43 -20.7%
PERU 8,147 9,887 -17.6%
MONTES DE MARÍA 8,899 7,742 14.9%
RUMICHACA 27,690 18,135 52.7%
PAMPLONA-CÚCUTA 9,842 5,374 83.2%
HOLDINGS 176 184 -4.3%
COLOMBIA 46,607 31,434 48.3%
RUTAS DEL LITORAL 2,663 2,620 1.7%
HOLDIINGS 80 76 4.7%
URUGUAY 2,743 2,696 1.7%
RUTAS DEL ESTE 7,551 4,686 61.2%
PARAGUAY 7,551 4,686 61.2%
HOSPITAL TLAHUAC 10,160 3,146 223.0%
AUTOVIA PIRÁMIDES TULANCINGO PACHUCA 3,489 4,459 -21.8%
HOLDINGS 123 213 -42.0%
MEXICO 13,772 7,818 76.2%
USA 2,204 - n/a
RENEWABLES 5,286 - n/a
WATER 33,826 27,363 23.6%
TOTAL WITHOUT CONSTRUCTION REVENUES 188,920 153,547 23.0%
CONSTRUCTION REVENUES 100,139 119,661 -16.3%
TOTAL 289,059 273,209 5.8%
Q1 2021 Results - 23 -
sacyr.com
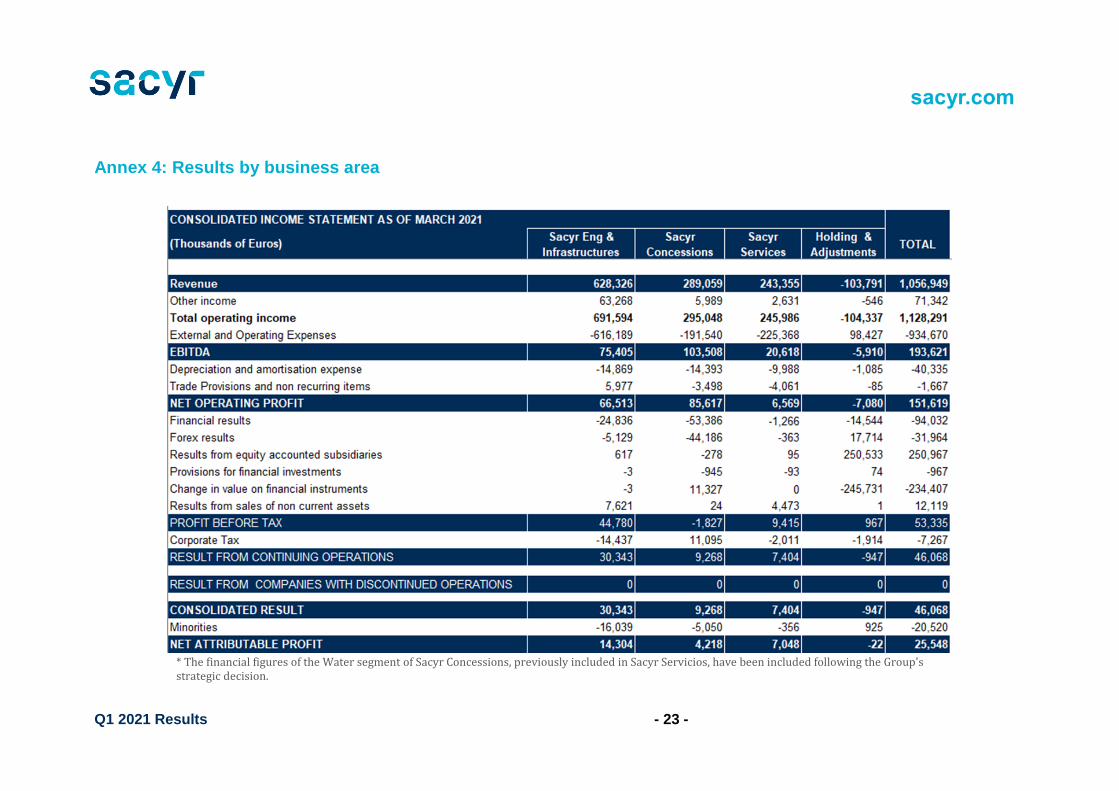
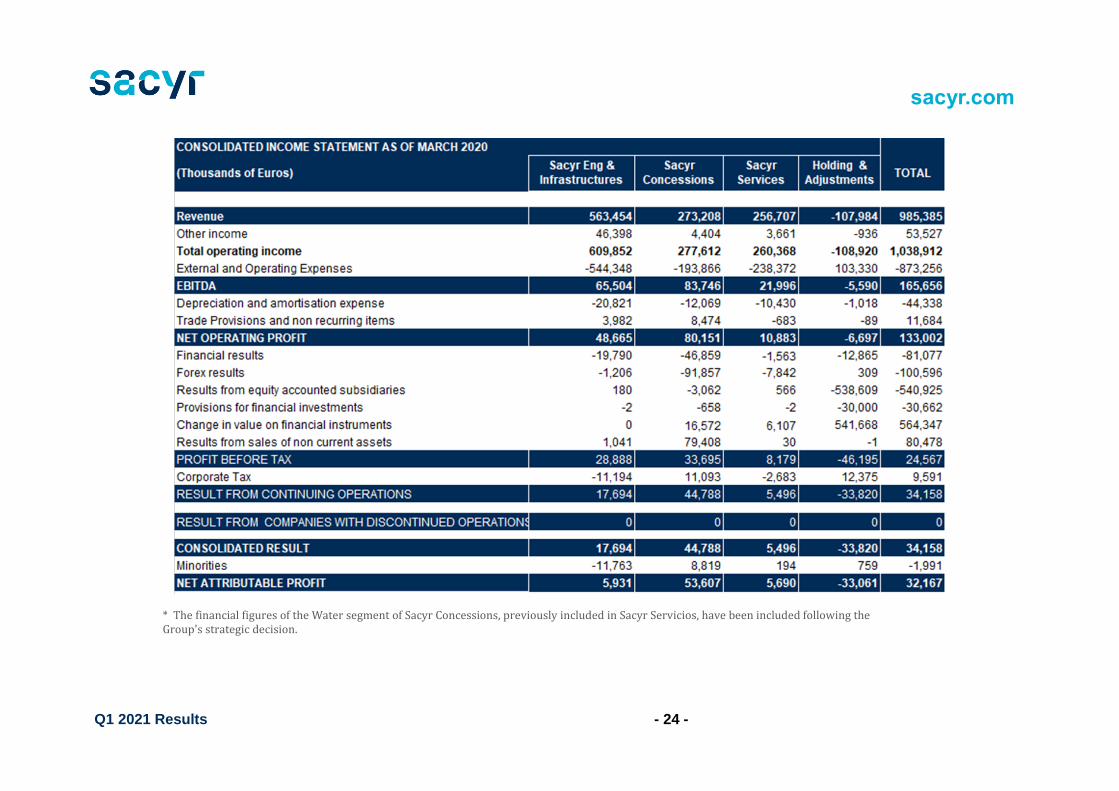
Annex 4: Results by business area
* The financial figures of the Water segment of Sacyr Concessions, previously included in Sacyr Servicios, have been included following the Group's strategic decision.
Q1 2021 Results - 24 -
sacyr.com
* The financial figures of the Water segment of Sacyr Concessions, previously included in Sacyr Servicios, have been included following the Group's strategic decision.
Q1 2021 Results - 25 -
Annex 5: Alternative Performance Measures
The Sacyr Group presents its results in accordance with International Financial Reporting
Standards (IFRS). In addition, the Group provides other financial measures, called
Alternative Performance Measures (MAR) or Alternative Performance Measures (APM's),
used by Management in decision-making and in the assessment of financial performance,
cash flows or financial situation.
In order to comply with the European Securities and Markets Authority (ESMA) Directive
(2015/1415es), on Alternative Performance Measures, the following details the breakdowns
required for each MAR, on their definition, conciliation, explanation of use, comparison and
consistency.
The Sacyr Group believes that this additional information will promote comparability,
reliability and understanding of your financial information.
Alternative Performance Measures
Gross operating income (EBITDA): is the Operating Profit before endowment to the
depreciation and variation of provisions, disaffected – if any – of extraordinary/non-recurring
gains or losses.
Operating Income (EBIT): It is calculated as a difference between Total operating income
(Business Figure, Company Work for Fixed Asset, Other Operating Income, Capital
Subsidy Imputation) and Total Operating Expenses (Personnel Expenses, Depreciation,
Variation of Provisions and Others).
Gross debt: groups the items of Non-Current Financial Debt and Current Financial Debt
from the consolidated balance sheet liability, which include bank debt and issues in the
capital market (bonds).
Net debt: it is calculated by subtracting from Gross Debt the items of Other current financial
assets, and Cash and other equivalent liquid assets of the consolidated balance sheet
asset.
Q1 2021 Results - 26 -
Project financing debt (gross or net): is the financial debt (gross or net) of project
companies. In this type of debt, the guarantee received by the lender is limited to the cash
flow of the project and the value of its assets, with limited recourse to the shareholder
Corporate debt (gross or net): is the debt of the Group's parent company and includes
bank debt and issues in capital markets.
Recourse net debt ratio: includes the recourse net debt divided by the recourse EBITDA +
distributions and dividends from the projects.
Financial Income: Financial Income - Financial Expense
Backlog: Value of work contracts awarded and closed pending. These contracts are
included in the portfolio once formalized. The portfolio is shown at the percentage
attributable to the Group, according to consolidation method.
Once a contract is added to the portfolio, the value of the pending production of that
contract remains in the portfolio until it has been completed or canceled. However, we
adjust the valuation to reflect changes in prices and timeframes that could be agreed with
the customer. Due to multiple factors, all or part of the portfolio tied to a contract may not
translate into revenue. Our portfolio is subject to project adjustments and cancellations and
cannot be taken as a certain indicator of future earnings.
There is no comparable financial measure in IFRS, so reconciliation with financial
statements is not possible. Sacyr's management considers the portfolio to be a useful
indicator of the Company's future income and a typical indicator used by companies in the
sectors in which we operate.
Concession Portfolio: represents the estimated future revenues of the concessions, in the
concession period, according to the financial plan of each concession and includes
assumptions of exchange rate variations between the euro and other currencies, inflation,
prices, tariffs and traffic volumes.
Market capitalization: number of shares at the end of the period multiplied by the quote at
the end of the period.
Q1 2021 Results - 27 -
Comparable: Corrections are sometimes made to certain figures to make them comparable
between years, for example, eliminating extraordinary deteriorations, significant perimeter
inflows or outputs that can distort the comparison between years of magnitudes such as
sales, exchange rate effect, etc. In each case, the corrections made are detailed in the
appropriate heading.
IMD (Average Daily Intensity): is defined as the total number of users that the lease uses
during a day. Typically, the IMD is calculated as the total number of vehicles that a
motorway passes through in a day
T
For more information, please contact:
Department of Investor Relations
Tel: 91 545 50 00


