23
Q1 2021 RESULTS INVESTOR & ANALYST PRESENTATION May 12, 2021 Dr. Cornelius Patt, CEO

Q1 2021 RESULTS
INVESTOR & ANALYST PRESENTATION
May 12, 2021
Dr. Cornelius Patt, CEO
ZOOPLUS OPERATES IN A
HIGHLY ATTRACTIVE CATEGORYQ1 2021 Investor & Analyst Call
3
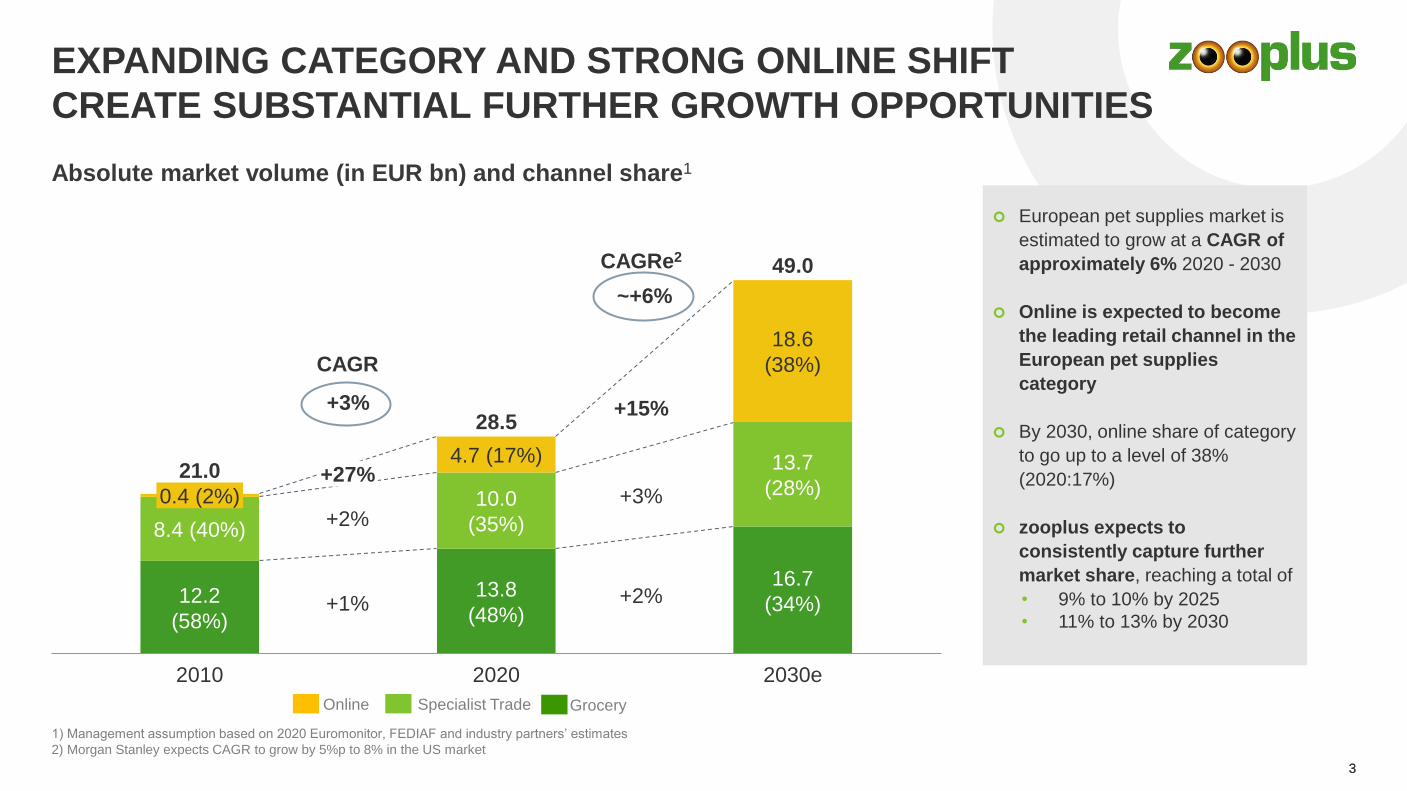
EXPANDING CATEGORY AND STRONG ONLINE SHIFT
CREATE SUBSTANTIAL FURTHER GROWTH OPPORTUNITIES
European pet supplies market is
estimated to grow at a CAGR of
approximately 6% 2020 - 2030
Online is expected to become
the leading retail channel in the
European pet supplies
category
By 2030, online share of category
to go up to a level of 38%
(2020:17%)
zooplus expects to
consistently capture further
market share, reaching a total of
• 9% to 10% by 2025
• 11% to 13% by 2030
Absolute market volume (in EUR bn) and channel share1
Online Specialist Trade Grocery
1) Management assumption based on 2020 Euromonitor, FEDIAF and industry partners’ estimates
2) Morgan Stanley expects CAGR to grow by 5%p to 8% in the US market
3
10.0
(35%)
0.4 (2%)
12.2
(58%)
2020
13.8
(48%)
8.4 (40%)
2010
4.7 (17%)
18.6
(38%)
13.7
(28%)
16.7
(34%)
2030e
21.0
28.5
49.0
+3%
~+6%
+27%
+15%
+2%+3%
+1% +2%
CAGRe2
CAGR
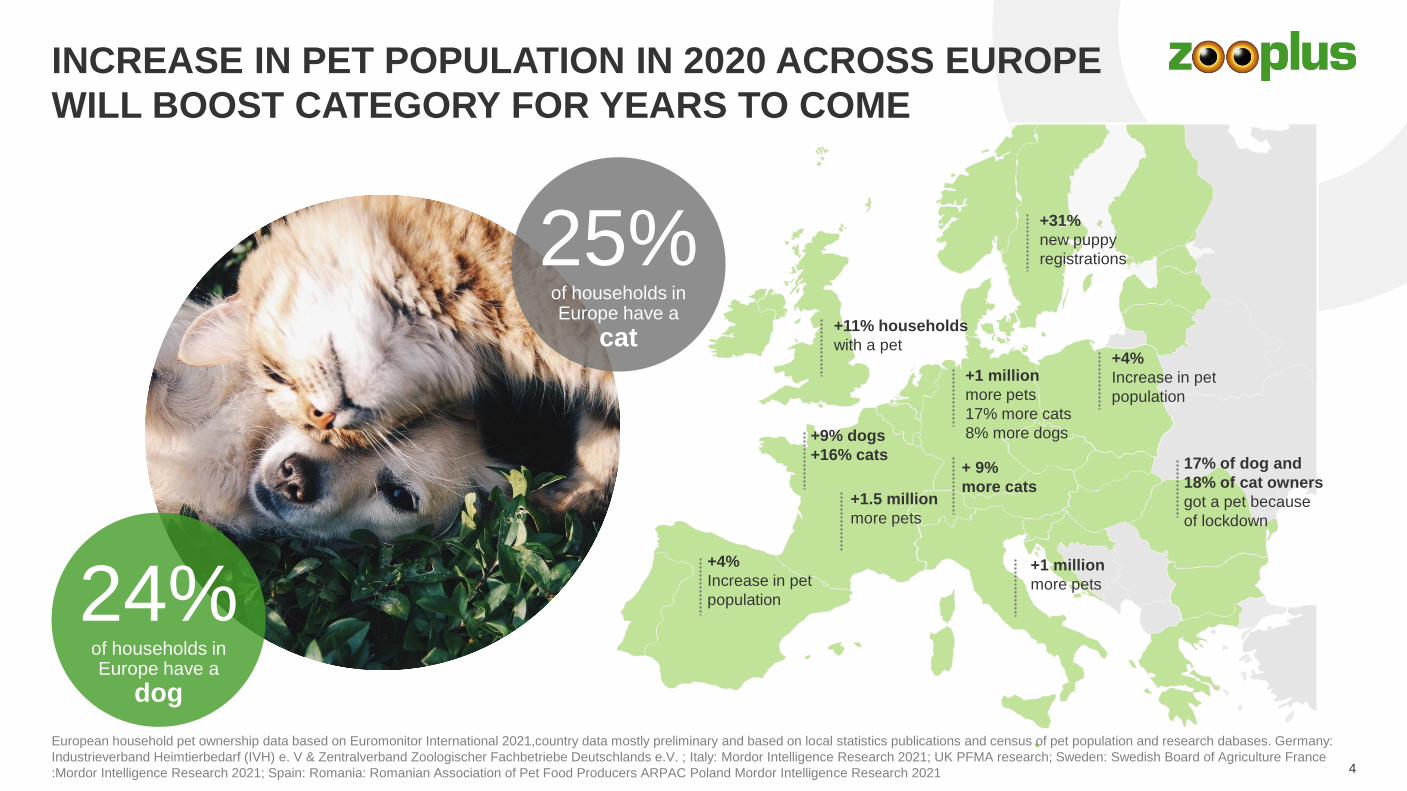
INCREASE IN PET POPULATION IN 2020 ACROSS EUROPE
WILL BOOST CATEGORY FOR YEARS TO COME
4
+1 million
more pets
17% more cats
8% more dogs
+31%
new puppy
registrations
+11% households
with a pet
+1 million
more pets
+ 9%
more cats+1.5 million
more pets
+4%
Increase in pet
population
17% of dog and
18% of cat owners
got a pet because
of lockdown
+9% dogs
+16% cats
+4%
Increase in pet
population
24%of households in Europe have a
dog
25%of households in Europe have a
cat
European household pet ownership data based on Euromonitor International 2021,country data mostly preliminary and based on local statistics publications and census of pet population and research dabases. Germany:
Industrieverband Heimtierbedarf (IVH) e. V & Zentralverband Zoologischer Fachbetriebe Deutschlands e.V. ; Italy: Mordor Intelligence Research 2021; UK PFMA research; Sweden: Swedish Board of Agriculture France
:Mordor Intelligence Research 2021; Spain: Romania: Romanian Association of Pet Food Producers ARPAC Poland Mordor Intelligence Research 2021
OPERATIONAL HIGHLIGHTSQ1 2021 Investor & Analyst Call
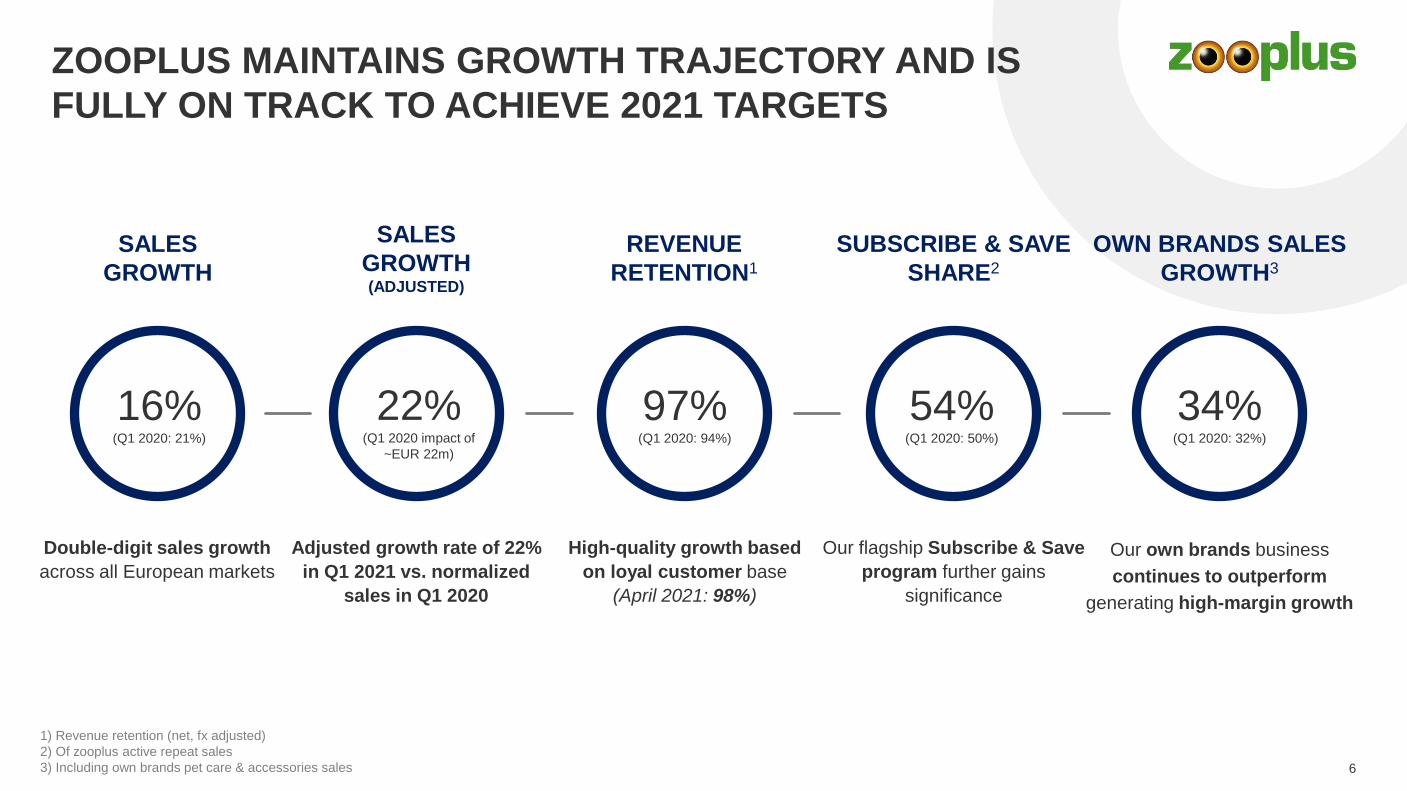
ZOOPLUS MAINTAINS GROWTH TRAJECTORY AND IS
FULLY ON TRACK TO ACHIEVE 2021 TARGETS
6
High-quality growth based
on loyal customer base
(April 2021: 98%)
REVENUE
RETENTION1
Our flagship Subscribe & Save
program further gains
significance
SUBSCRIBE & SAVE
SHARE2
Our own brands business
continues to outperform
generating high-margin growth
OWN BRANDS SALES
GROWTH3
1) Revenue retention (net, fx adjusted)
2) Of zooplus active repeat sales
3) Including own brands pet care & accessories sales
34%(Q1 2020: 32%)
97%(Q1 2020: 94%)
54%(Q1 2020: 50%)
Double-digit sales growth
across all European markets
SALES
GROWTH
16%(Q1 2020: 21%)
SALES
GROWTH (ADJUSTED)
22%(Q1 2020 impact of
~EUR 22m)
Adjusted growth rate of 22%
in Q1 2021 vs. normalized
sales in Q1 2020
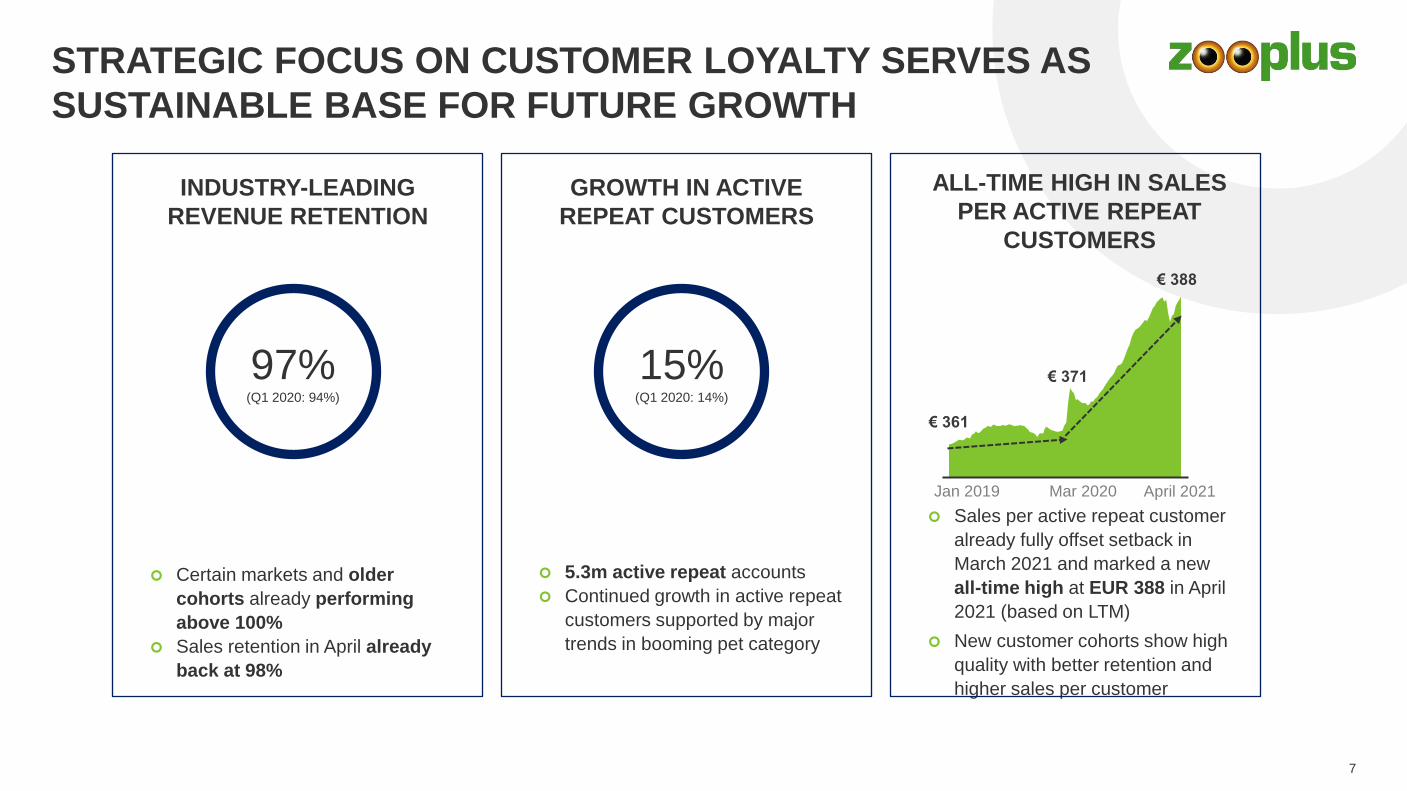
STRATEGIC FOCUS ON CUSTOMER LOYALTY SERVES AS
SUSTAINABLE BASE FOR FUTURE GROWTH
7
5.3m active repeat accounts
Continued growth in active repeat
customers supported by major
trends in booming pet category
GROWTH IN ACTIVE
REPEAT CUSTOMERS
Sales per active repeat customer
already fully offset setback in
March 2021 and marked a new
all-time high at EUR 388 in April
2021 (based on LTM)
New customer cohorts show high
quality with better retention and
higher sales per customer
ALL-TIME HIGH IN SALES
PER ACTIVE REPEAT
CUSTOMERS
Mar 2020Jan 2019 April 2021
€ 361
€ 371
€ 388
(2019: 91%)
99%15%
(Q1 2020: 14%)
Certain markets and older
cohorts already performing
above 100%
Sales retention in April already
back at 98%
INDUSTRY-LEADING
REVENUE RETENTION
(2019: 91%)
99%97%
(Q1 2020: 94%)
1) Of zooplus active repeat customer sales (customers with at least two orders in 2020)
2) Net sales of Subscribe & Save vs. PY quarter
3) Gross sales, (based on z+ customers, LTM)
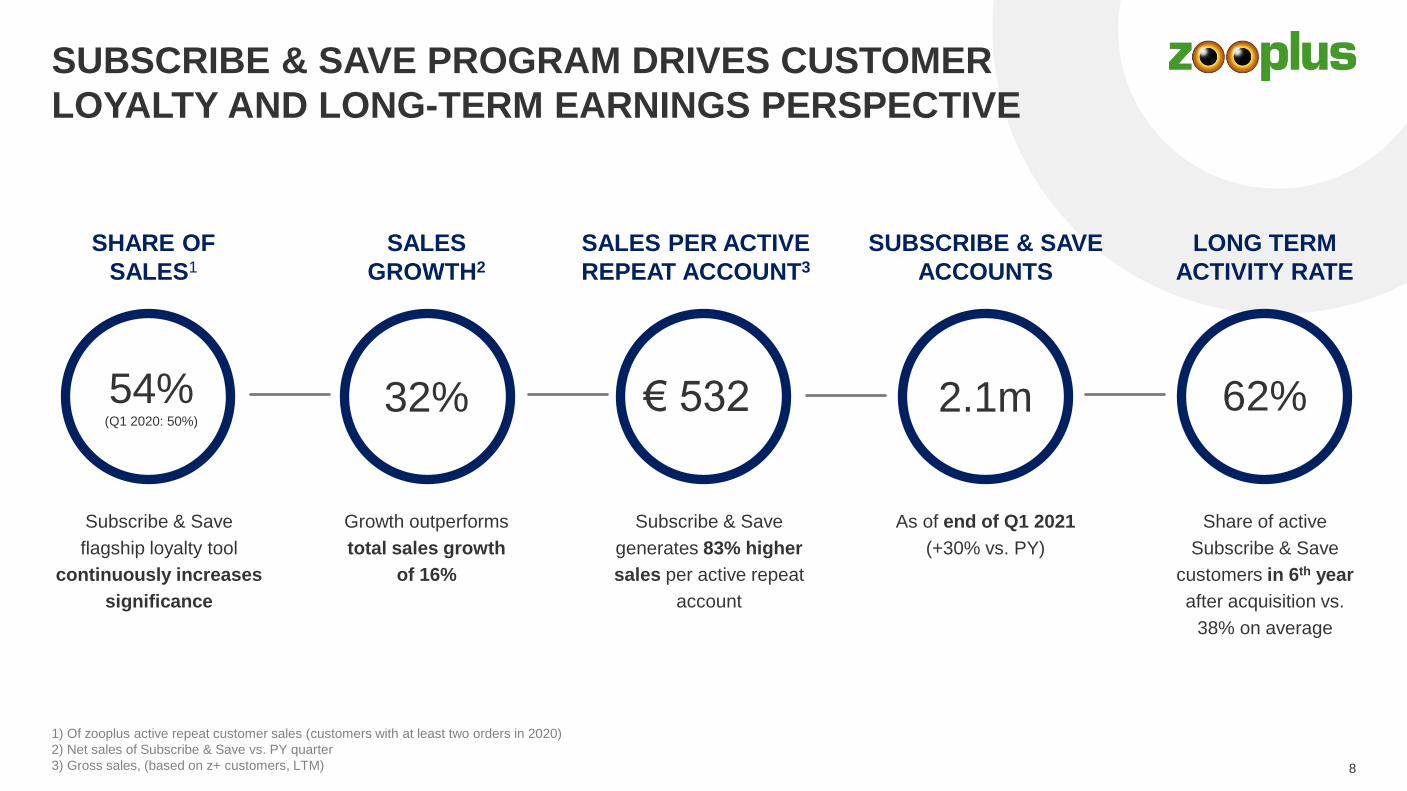
SUBSCRIBE & SAVE PROGRAM DRIVES CUSTOMER
LOYALTY AND LONG-TERM EARNINGS PERSPECTIVE
8
Subscribe & Save
flagship loyalty tool
continuously increases
significance
54%(Q1 2020: 50%)
SHARE OF
SALES1
Growth outperforms
total sales growth
of 16%
32%
SALES
GROWTH2
Subscribe & Save
generates 83% higher
sales per active repeat
account
€ 532
SALES PER ACTIVE
REPEAT ACCOUNT3
Share of active
Subscribe & Save
customers in 6th year
after acquisition vs.
38% on average
62%
LONG TERM
ACTIVITY RATE
As of end of Q1 2021
(+30% vs. PY)
2.1m
SUBSCRIBE & SAVE
ACCOUNTS
9
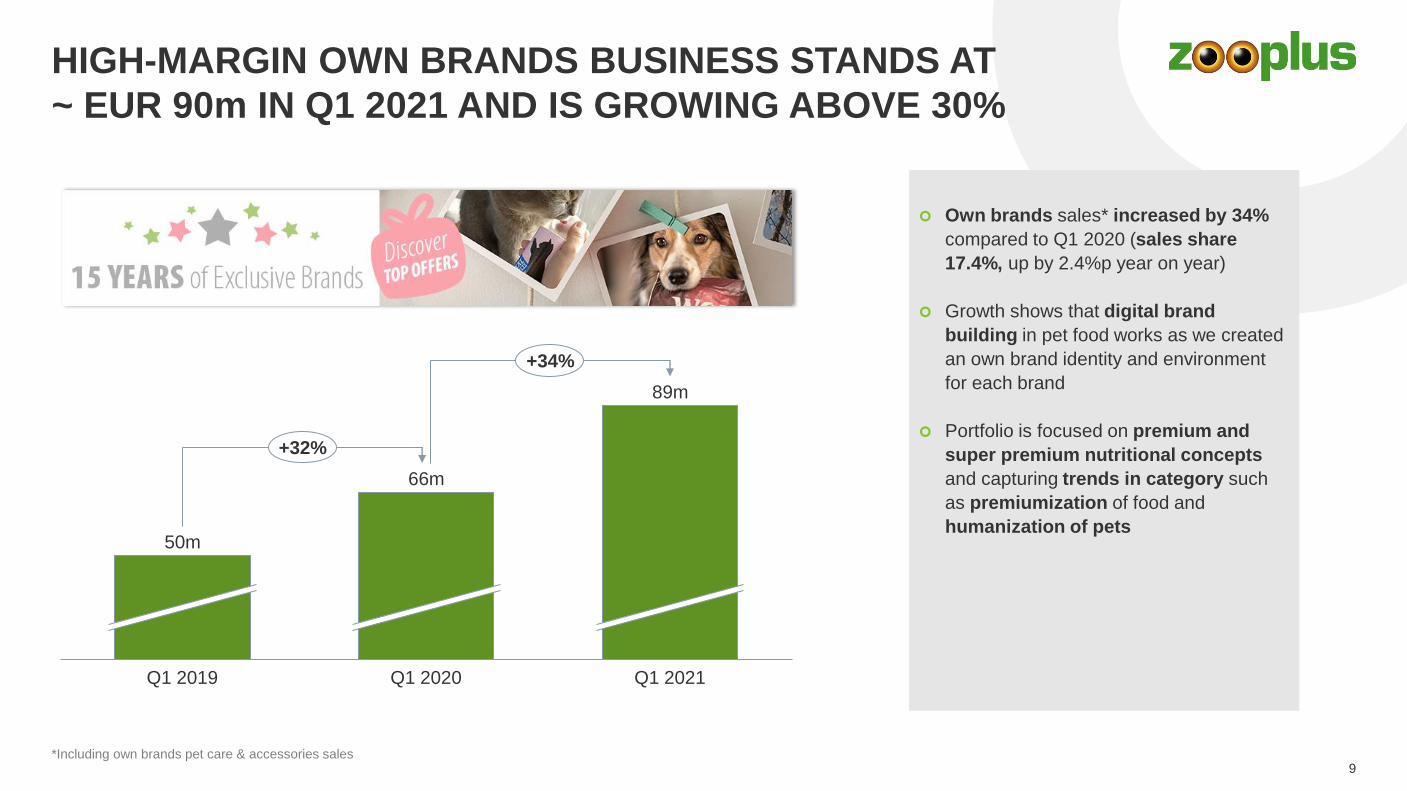
HIGH-MARGIN OWN BRANDS BUSINESS STANDS AT
~ EUR 90m IN Q1 2021 AND IS GROWING ABOVE 30%
Q1 2021Q1 2019 Q1 2020
50m
66m
89m
+32%
+34%
Own brands sales* increased by 34%
compared to Q1 2020 (sales share
17.4%, up by 2.4%p year on year)
Growth shows that digital brand
building in pet food works as we created
an own brand identity and environment
for each brand
Portfolio is focused on premium and
super premium nutritional concepts
and capturing trends in category such
as premiumization of food and
humanization of pets
*Including own brands pet care & accessories sales

FINANCIAL HIGHLIGHTSQ1 2021 Investor & Analyst Call
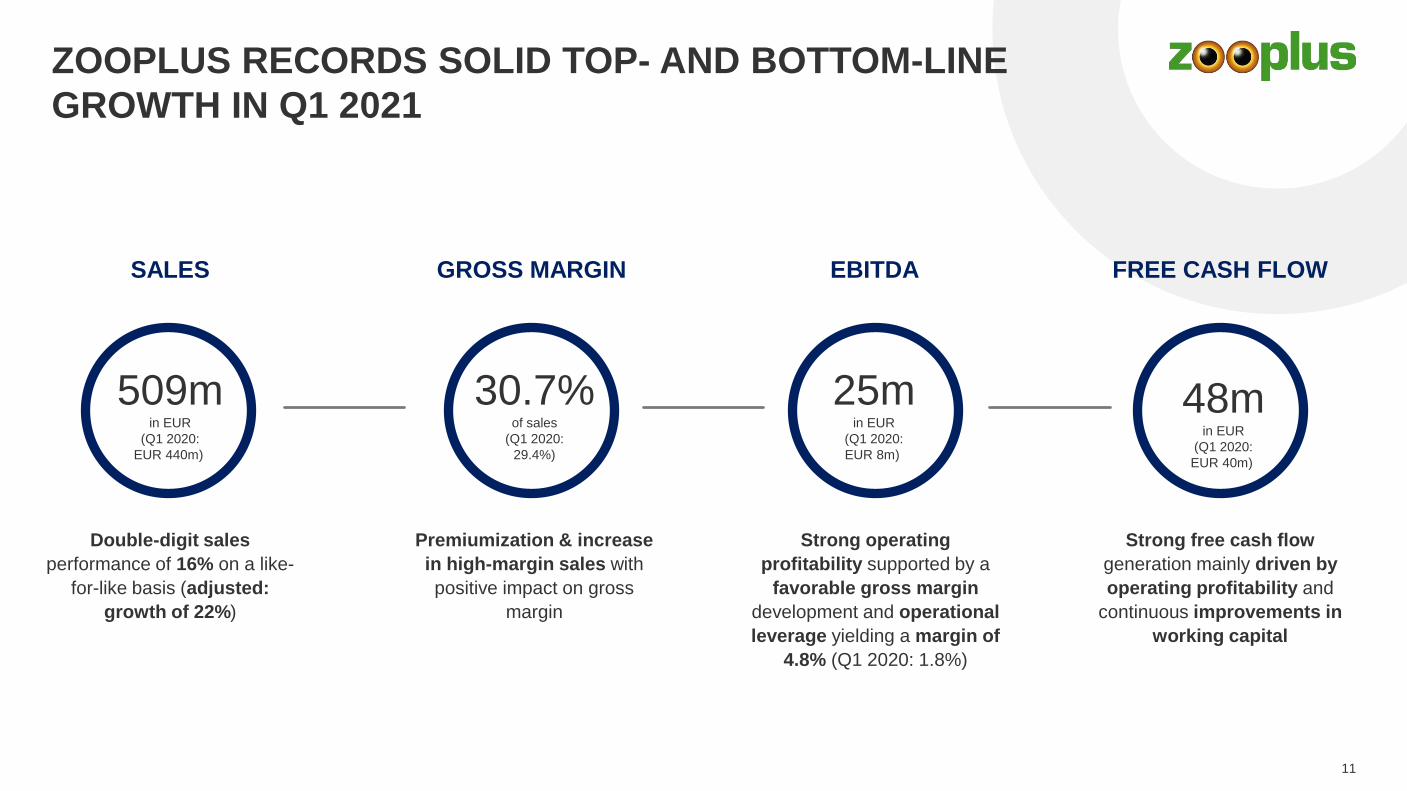
ZOOPLUS RECORDS SOLID TOP- AND BOTTOM-LINE
GROWTH IN Q1 2021
11
Premiumization & increase
in high-margin sales with
positive impact on gross
margin
GROSS MARGIN EBITDA FREE CASH FLOW
48min EUR
(Q1 2020:
EUR 40m)
30.7%of sales
(Q1 2020:
29.4%)
25min EUR
(Q1 2020:
EUR 8m)
Double-digit sales
performance of 16% on a like-
for-like basis (adjusted:
growth of 22%)
SALES
509min EUR
(Q1 2020:
EUR 440m)
Strong operating
profitability supported by a
favorable gross margin
development and operational
leverage yielding a margin of
4.8% (Q1 2020: 1.8%)
Strong free cash flow
generation mainly driven by
operating profitability and
continuous improvements in
working capital
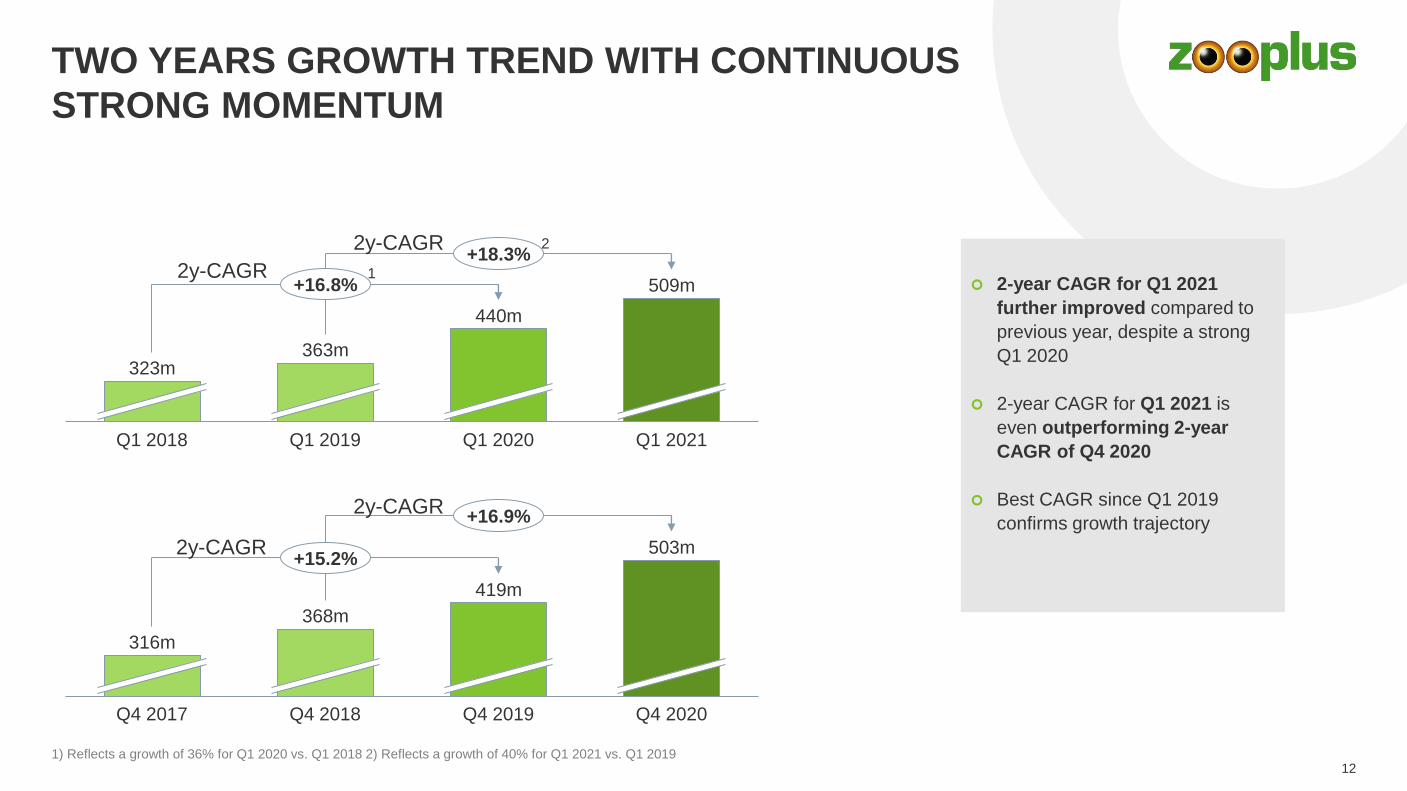
TWO YEARS GROWTH TREND WITH CONTINUOUS
STRONG MOMENTUM
12
Q1 2021
440m
509m
Q1 2018 Q1 2019 Q1 2020
323m363m
+16.8%
+18.3%
368m
Q4 2020Q4 2018Q4 2017
316m
Q4 2019
419m
503m+15.2%
+16.9%
2-year CAGR for Q1 2021
further improved compared to
previous year, despite a strong
Q1 2020
2-year CAGR for Q1 2021 is
even outperforming 2-year
CAGR of Q4 2020
Best CAGR since Q1 2019
confirms growth trajectory
2y-CAGR
2y-CAGR
2y-CAGR
2y-CAGR
1) Reflects a growth of 36% for Q1 2020 vs. Q1 2018 2) Reflects a growth of 40% for Q1 2021 vs. Q1 2019
1
2
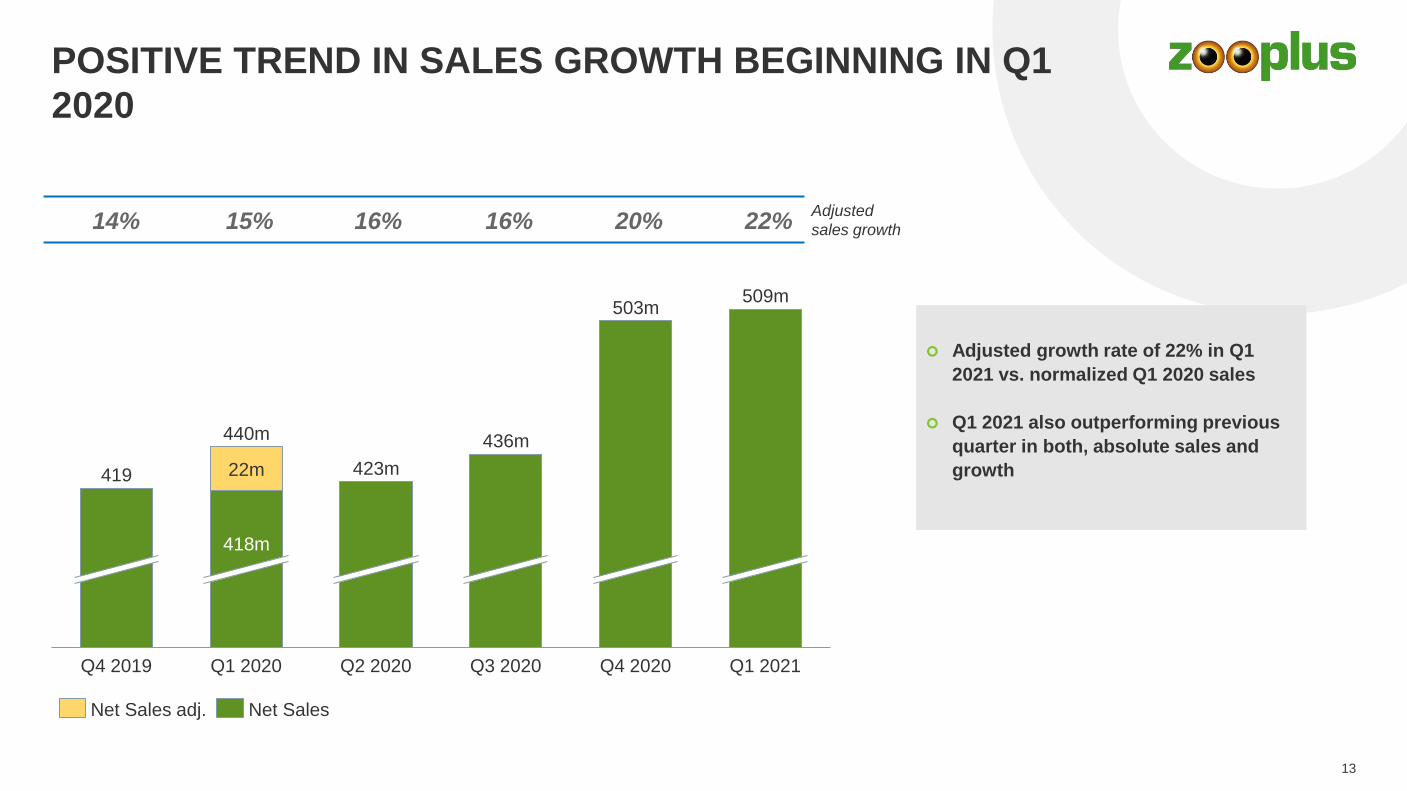
423m
509m
22m
418m
Q1 2020 Q2 2020 Q3 2020
503m
Q4 2020Q4 2019
419
440m
Q1 2021
436m
13
POSITIVE TREND IN SALES GROWTH BEGINNING IN Q1
2020
Net Sales adj. Net Sales
Adjusted
sales growth15% 16% 16% 20% 22%
Adjusted growth rate of 22% in Q1
2021 vs. normalized Q1 2020 sales
Q1 2021 also outperforming previous
quarter in both, absolute sales and
growth
14%
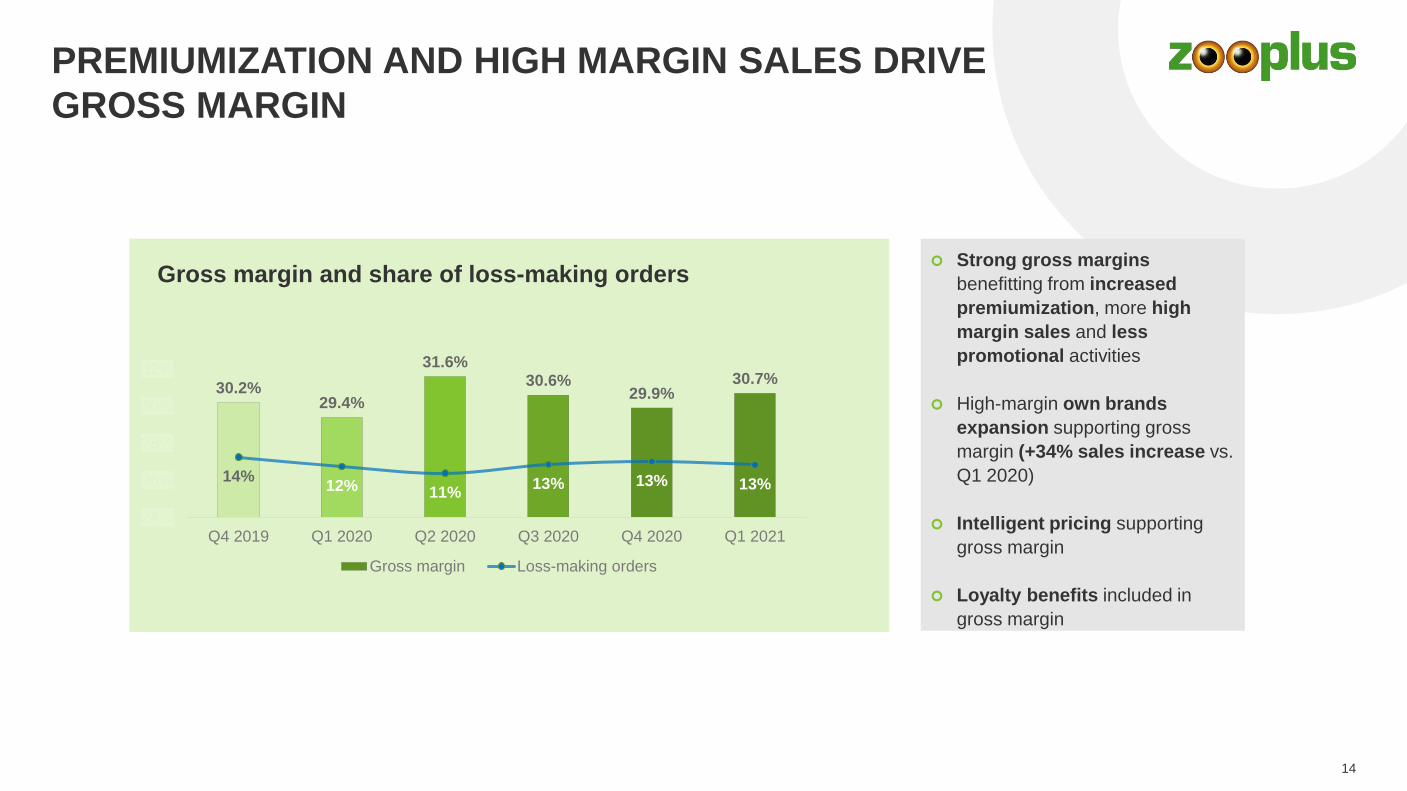
30.2%29.4%
31.6%30.6%
29.9%30.7%
14%12% 11%
13% 13% 13%
0%
5%
10%
15%
20%
25%
30%
35%
40%
24%
26%
28%
30%
32%
Q4 2019 Q1 2020 Q2 2020 Q3 2020 Q4 2020 Q1 2021
Gross margin Loss-making orders
14
PREMIUMIZATION AND HIGH MARGIN SALES DRIVE
GROSS MARGIN
Gross margin and share of loss-making orders Strong gross margins
benefitting from increased
premiumization, more high
margin sales and less
promotional activities
High-margin own brands
expansion supporting gross
margin (+34% sales increase vs.
Q1 2020)
Intelligent pricing supporting
gross margin
Loyalty benefits included in
gross margin
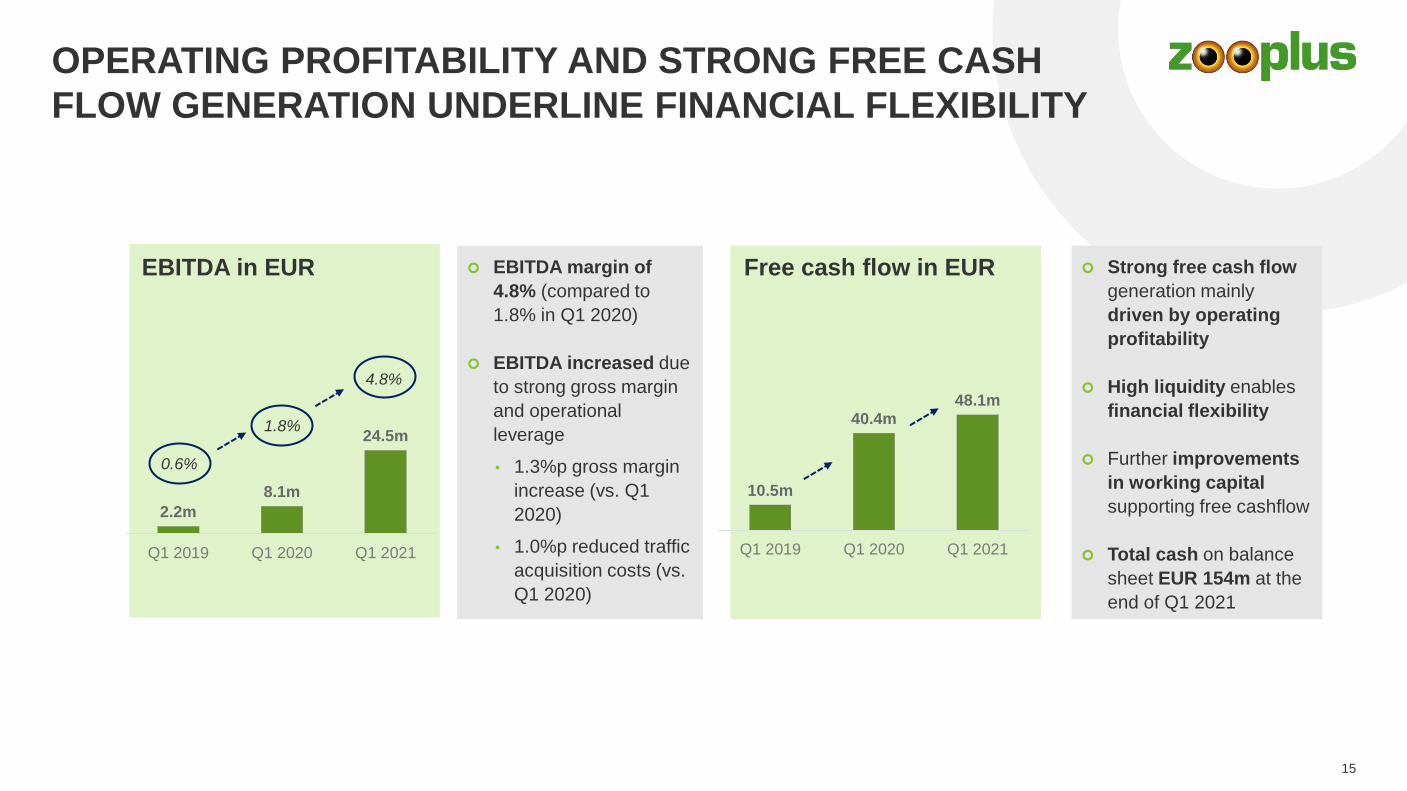
OPERATING PROFITABILITY AND STRONG FREE CASH
FLOW GENERATION UNDERLINE FINANCIAL FLEXIBILITY
15
EBITDA margin of
4.8% (compared to
1.8% in Q1 2020)
EBITDA increased due
to strong gross margin
and operational
leverage
• 1.3%p gross margin
increase (vs. Q1
2020)
• 1.0%p reduced traffic
acquisition costs (vs.
Q1 2020)
Strong free cash flow
generation mainly
driven by operating
profitability
High liquidity enables
financial flexibility
Further improvements
in working capital
supporting free cashflow
Total cash on balance
sheet EUR 154m at the
end of Q1 2021
2.2m
8.1m
24.5m
Q1 2019 Q1 2020 Q1 2021
10.5m
40.4m48.1m
Q1 2019 Q1 2020 Q1 2021
1.8%
4.8%
0.6%
EBITDA in EUR Free cash flow in EUR
2021 GUIDANCE &
OUTLOOK 2025Q1 2021 Investor & Analyst Call
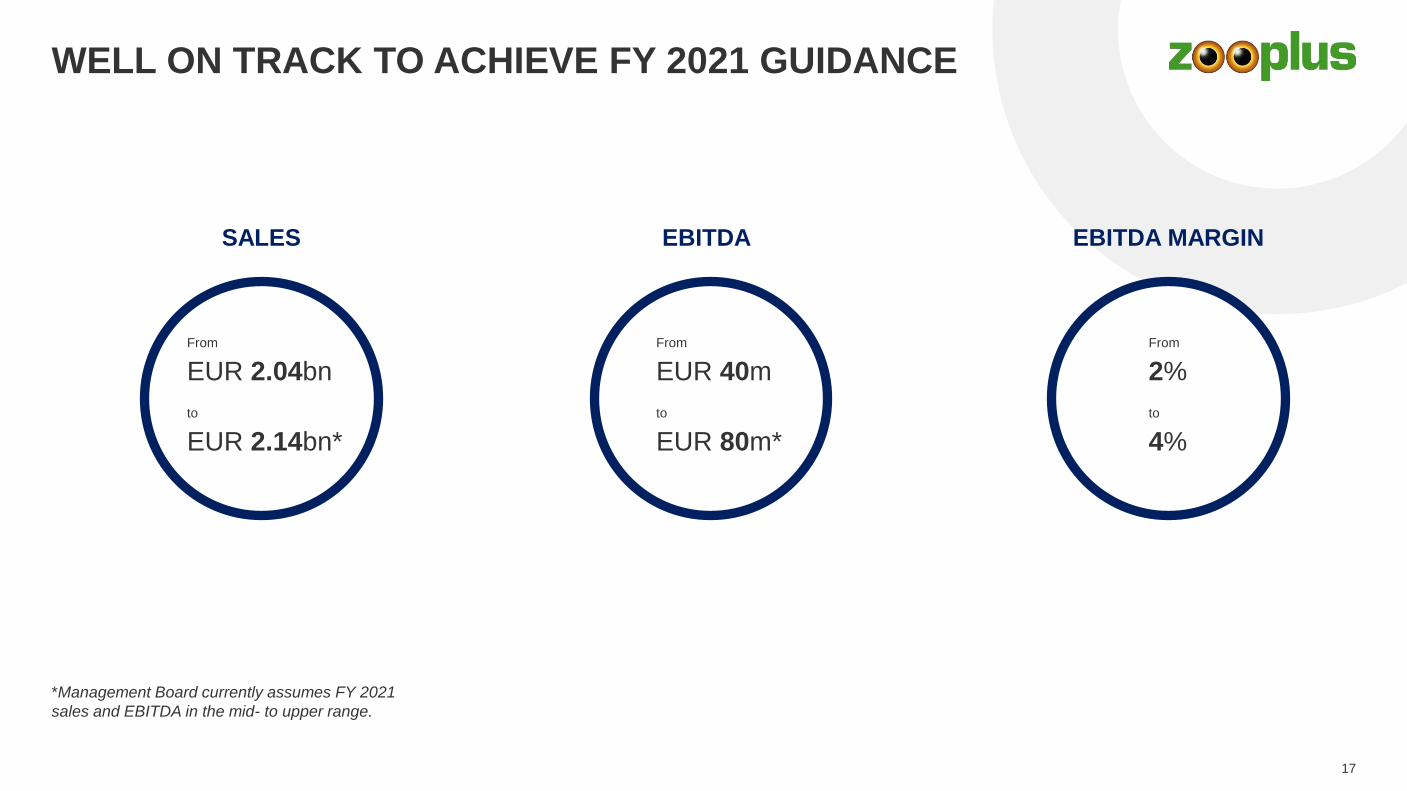
WELL ON TRACK TO ACHIEVE FY 2021 GUIDANCE
*Management Board currently assumes FY 2021
sales and EBITDA in the mid- to upper range.
SALES EBITDA MARGINEBITDA
From
EUR 2.04bn
to
EUR 2.14bn*
17
From
EUR 40m
to
EUR 80m*
From
2%
to
4%
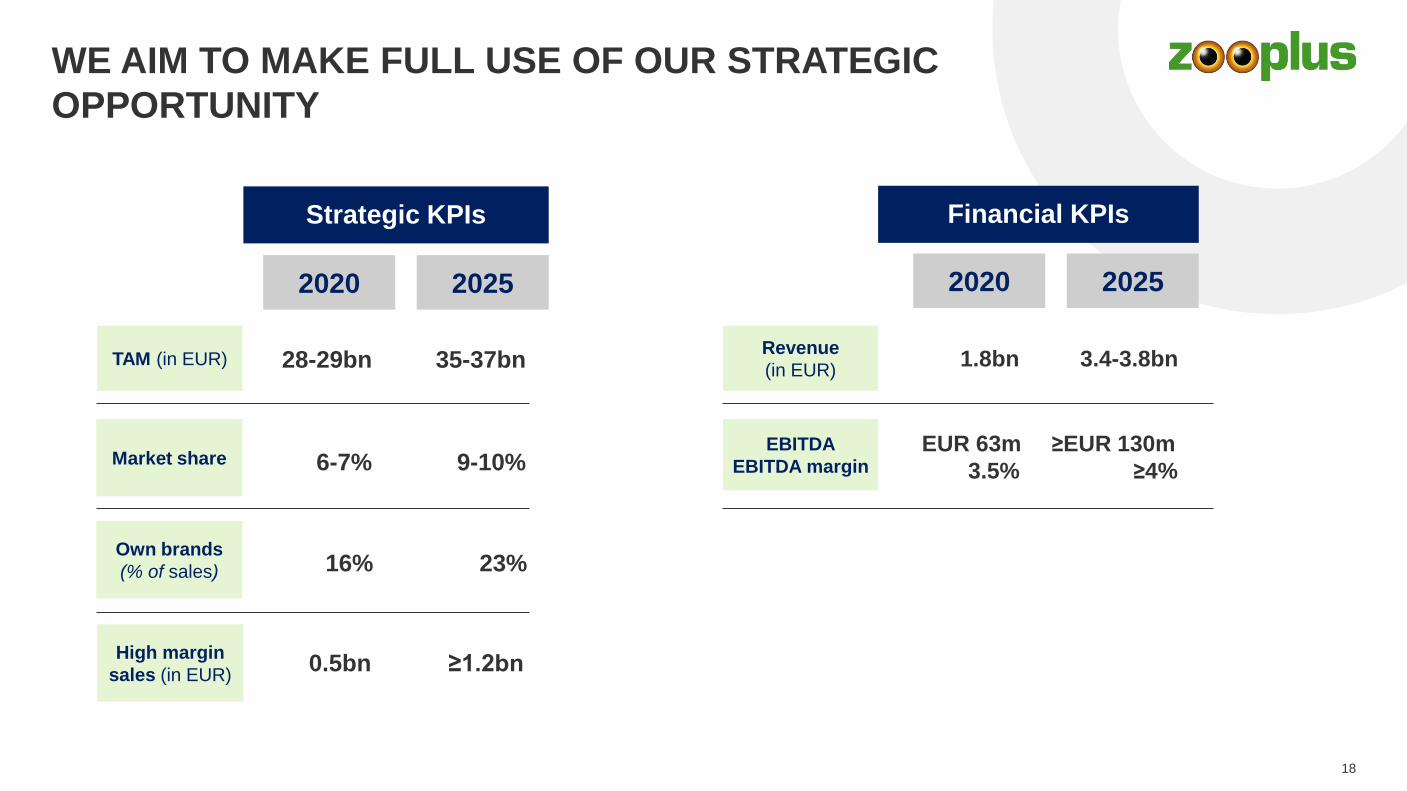
WE AIM TO MAKE FULL USE OF OUR STRATEGIC
OPPORTUNITY
2020
Strategic KPIs
2020
Financial KPIs
2025
TAM (in EUR)Revenue
(in EUR)
EBITDA
EBITDA marginMarket share
Own brands
(% of sales)
28-29bn 1.8bn 3.4-3.8bn
High margin
sales (in EUR)
EUR 63m
3.5%6-7%
16%
0.5bn
≥EUR 130m
≥4%9-10%
≥1.2bn
23%
35-37bn
2025
18
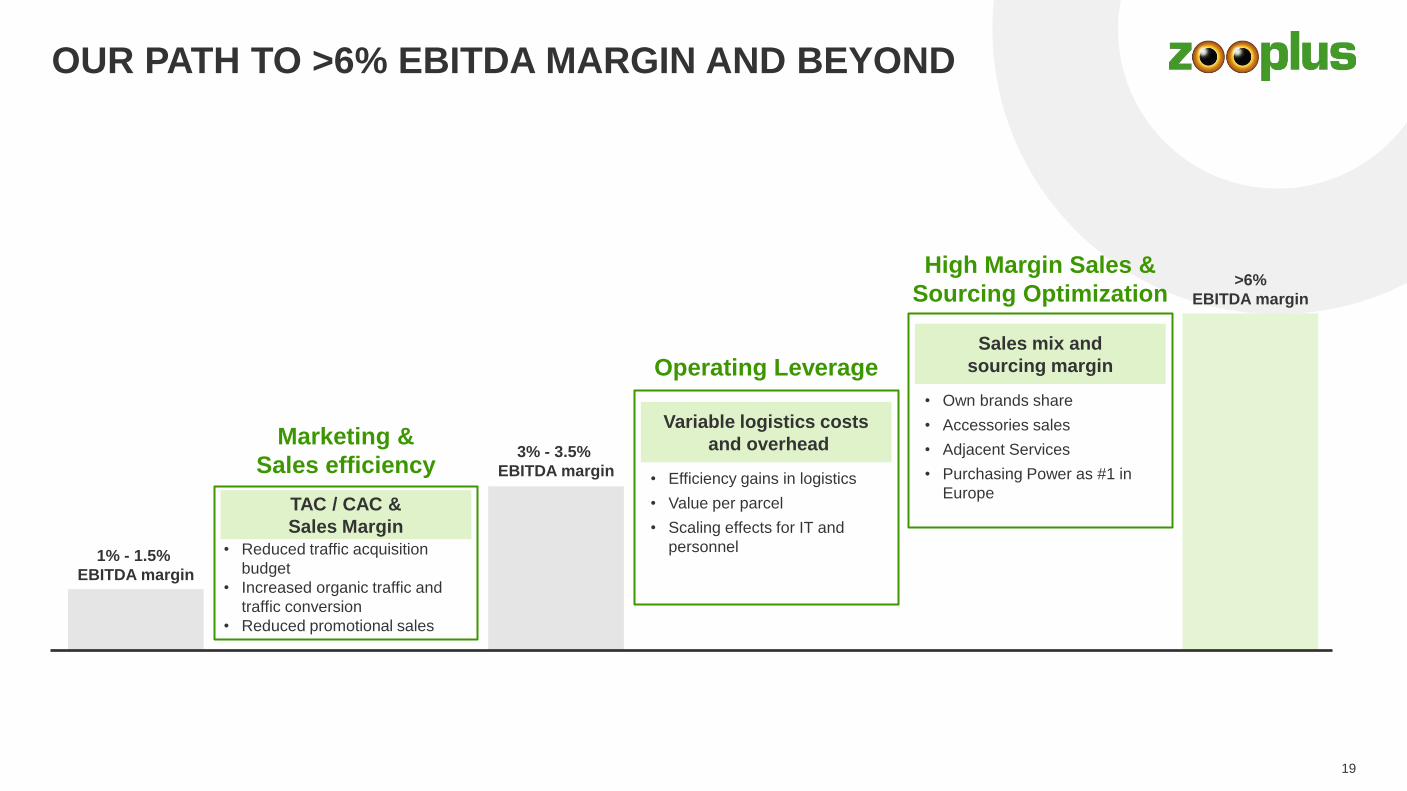
OUR PATH TO >6% EBITDA MARGIN AND BEYOND
3% - 3.5%
EBITDA margin
Sales mix and
sourcing margin
>6%
EBITDA margin
Variable logistics costs
and overhead
Operating Leverage
High Margin Sales &
Sourcing Optimization
19
• Reduced traffic acquisition
budget
• Increased organic traffic and
traffic conversion
• Reduced promotional sales
TAC / CAC &
Sales Margin
Marketing &
Sales efficiency
1% - 1.5%
EBITDA margin
• Efficiency gains in logistics
• Value per parcel
• Scaling effects for IT and
personnel
• Own brands share
• Accessories sales
• Adjacent Services
• Purchasing Power as #1 in
Europe
Q&AQ1 2021 Investor & Analyst Call
THANK
YOU
22
SAFE HARBOR STATEMENT
This document includes supplemental financial measures that are or may be non-GAAP financial measures. These supplemental financial
measures should not be viewed in isolation as alternatives to measures of zooplus’ financial condition, results of operations or cash flows
as presented in accordance with IFRS in its Consolidated Financial Statements. Other companies that report or describe similarly titled
financial measures may calculate them differently.
This document contains statements related to our future business and financial performance and future events or developments involving
zooplus that may constitute forward-looking statements. We may also make forward-looking statements in other reports, in presentations,
in material delivered to stockholders and in press releases. In addition, our representatives may from time to time make oral forward-
looking statements. Such statements are based on the current expectations and certain assumptions of zooplus’ management, and are,
therefore, subject to certain risks and uncertainties. A variety of factors, many of which are beyond zooplus’ control, affect zooplus’
operations, performance, business strategy and results and could cause the actual results, performance or achievements of zooplus to be
materially different from any future results, performance or achievements that may be expressed or implied by such forward-looking
statements or anticipated based on historical trends. Further information about risks and uncertainties affecting zooplus is included
throughout our most recent annual and interim reports, which are available on the zooplus website, www.zooplus.de. Should one or more
of these risks or uncertainties materialize, or should underlying assumptions prove incorrect, actual results, performance or achievements
of zooplus may vary materially from those described in the relevant forward-looking statement as being expected, anticipated, intended,
planned, believed, sought, estimated or projected. zooplus neither intends, nor assumes any obligation, to update or revise these forward-
looking statements in light of developments which differ from those anticipated.
Due to rounding, numbers presented throughout this and other documents may not add up precisely to the totals provided and
percentages may not precisely reflect the absolute figures.
SOURCES PET POPULATION
23
• European Households with Pets: Euromonitor International 2021
• Belgium: Flanders region, https://dierenwelzijn.vlaanderen.be/aantal-honden-in-vlaanderen; https://dierenwelzijn.vlaanderen.be/aantal-
katten-in-vlaanderen
• France: SPA Society for the Protection of Animals https://www.la-spa.fr/actualites/spa/pres-de-38-000-adoptions-en-2020-reflexespa;
Mordor Intelligence Research 2021
• Germany: Industrieverband Heimtierbedarf (IVH) e. V & Zentralverband Zoologischer Fachbetriebe Deutschlands e.V.
https://www.zzf.de/fileadmin/files/ZZF/Marktdaten/ZZF_IVH_Folder_Der_deutsche_Heimtiermarkt_2020_und_Anzahl_der_Heimtiere_in_
Deutschland.pdf; TASSO e.V.
• Italy: https://www.aboutpharma.com/blog/2020/10/05/effetto-lockdown-in-italia-e-boom-di-animali-da-
compagnia/?comingfrom=aboutpharma; Mordor Intelligence Research 2021
• Poland Mordor Intelligence Research 2021
• Romania: Romanian Association of Pet Food Producers ARPAC https://www.arpac.ro/noutati/74-studiu-arpac-numarul-romanilor-din-
mediul-urban-care-detin-animale-de-companie-a-crescut-in-perioada-starii-de-urgenta
• Sweden: Swedish Board of Agriculture; Figures based on March 2021 vs. March 2020 https://jordbruksverket.se/e-tjanster-databaser-
och-appar/e-tjanster-och-databaser-djur/hundregistret/statistik-ur-hundregistret
• Switzerland https://www.luzernerzeitung.ch/wirtschaft/auf-homeoffice-folgt-haustierboom-bello-miezi-und-co-sind-wegen-corona-beliebter-
denn-je-ld.1274809
• Spain: https://www.anfaac.org/datos-sectoriales/ OK diario https://okdiario.com/mascotas/5-mascotas-mas-comunes-espana-2021-
6703589 ; Mordor Intelligence Research 2021
• UK; PFMA https://pfma-reports.co.uk/ PFMA research released in September 2020 highlighted that 11% of UK households had acquired a
new pet during the pandemic and a further 10% were planning to do so.;


